Spatial analysis and risk mapping of soil-transmitted ... · Remotely sensed climatic and...
14
Spatial analysis and risk mapping of soil-transmitted helminth infections in Brazil, using Bayesian geostatistical models Ronaldo G. C. Scholte 1,2,3 , Nadine Schur 1,2 , Maria E. Bavia 4 , Edgar M. Carvalho 5 , Frédérique Chammartin 1,2 , Jürg Utzinger 1,2 , Penelope Vounatsou 1,2 1 Department of Epidemiology and Public Health, Swiss Tropical and Public Health Institute, Basel, Switzerland; 2 University of Basel, Basel, Switzerland; 3 Laboratory of Helmintology and Medical Malacology - René Rachou Research Center/Fiocruz, Belo Horizonte, Brazil; 4 Laboratory of Monitoring Diseases by Geographic Information System, School of Veterinary Medicine, Federal University of Bahia, Salvador, Brazil; 5 Department of Preventive Medicine, Federal University of Bahia, Salvador, Brazil Abstract. Soil-transmitted helminths (Ascaris lumbricoides, Trichuris trichiura and hookworm) negatively impact the health and wellbeing of hundreds of millions of people, particularly in tropical and subtropical countries, including Brazil. Reliable maps of the spatial distribution and estimates of the number of infected people are required for the control and eventual elimination of soil-transmitted helminthiasis. We used advanced Bayesian geostatistical modelling, coupled with geographi- cal information systems and remote sensing to visualize the distribution of the three soil-transmitted helminth species in Brazil. Remotely sensed climatic and environmental data, along with socioeconomic variables from readily available data- bases were employed as predictors. Our models provided mean prevalence estimates for A. lumbricoides, T. trichiura and hookworm of 15.6%, 10.1% and 2.5%, respectively. By considering infection risk and population numbers at the unit of the municipality, we estimate that 29.7 million Brazilians are infected with A. lumbricoides, 19.2 million with T. trichiura and 4.7 million with hookworm. Our model-based maps identified important risk factors related to the transmission of soil- transmitted helminths and confirm that environmental variables are closely associated with indices of poverty. Our smoothed risk maps, including uncertainty, highlight areas where soil-transmitted helminthiasis control interventions are most urgently required, namely in the North and along most of the coastal areas of Brazil. We believe that our predictive risk maps are useful for disease control managers for prioritising control interventions and for providing a tool for more effi- cient surveillance-response mechanisms. Keywords: Bayesian modelling, geographical information system, remote sensing, soil-transmitted helminths, variable selec- tion, Brazil. Introduction The soil-transmitted helminths are a group of nema- tode parasites that cause human infection when their eggs are ingested (Ascaris lumbricoides and Trichuris trichiura) or larvae penetrate the skin (the two hook- worm species Ancylostoma duodenale and Necator americanus) (Bethony et al., 2006; Hotez et al., 2008; Knopp et al., 2012). Recent climate suitability model- ling suggests that more than 5.3 billion people were at risk of soil-transmitted helminthiasis in 2010 with over 1 billion people infected with at least one of the aforementioned soil-transmitted helminth species (Pullan and Brooker, 2012). The distribution of infec- tions is governed by social-ecological systems with poverty playing a key role in maintaining high levels of endemicity. Indeed, the highest rates and intensity of infection and public health burden are concentrated in poor communities in tropical and subtropical areas (de Silva et al., 2003; Tchuem Tchuenté, 2011; Lustigman et al., 2012; Ziegelbauer et al., 2012). The highest infection intensities are usually observed in school- aged children, whilst there is a decline in prevalence and intensity of infection with age (Anderson and May, 1985; de Silva et al., 2003; Bethony et al., 2006; Brooker et al., 2007). Hence, the global strategy to control soil-transmitted helminthiasis (and other helminth infections such as schistosomiasis) targets the school-aged population, and this is done by periodic administration of anthelminthic drugs, usually with- out prior diagnosis (WHO, 2002, 2006; Hotez et al., 2007; Utzinger et al., 2009). In Brazil, soil-transmitted helminth infections are of considerable public health importance, particularly through their association with anaemia, diarrhoea and Corresponding author: Penelope Vounatsou Department of Epidemiology and Public Health Swiss Tropical and Public Health Institute P.O. Box, CH-4002 Basel, Switzerland Tel. +41 61 284-8109; Fax +41 61 284-8105 E-mail: [email protected] Geospatial Health 8(1), 2013, pp. 97-110
Transcript of Spatial analysis and risk mapping of soil-transmitted ... · Remotely sensed climatic and...

Spatial analysis and risk mapping of soil-transmitted helminthinfections in Brazil, using Bayesian geostatistical models
Ronaldo G. C. Scholte1,2,3, Nadine Schur1,2, Maria E. Bavia4, Edgar M. Carvalho5, FrédériqueChammartin1,2, Jürg Utzinger1,2, Penelope Vounatsou1,2
1Department of Epidemiology and Public Health, Swiss Tropical and Public Health Institute, Basel,Switzerland; 2University of Basel, Basel, Switzerland; 3Laboratory of Helmintology and Medical Malacology -René Rachou Research Center/Fiocruz, Belo Horizonte, Brazil; 4Laboratory of Monitoring Diseases byGeographic Information System, School of Veterinary Medicine, Federal University of Bahia, Salvador, Brazil;5Department of Preventive Medicine, Federal University of Bahia, Salvador, Brazil
Abstract. Soil-transmitted helminths (Ascaris lumbricoides, Trichuris trichiura and hookworm) negatively impact the healthand wellbeing of hundreds of millions of people, particularly in tropical and subtropical countries, including Brazil. Reliablemaps of the spatial distribution and estimates of the number of infected people are required for the control and eventualelimination of soil-transmitted helminthiasis. We used advanced Bayesian geostatistical modelling, coupled with geographi-cal information systems and remote sensing to visualize the distribution of the three soil-transmitted helminth species inBrazil. Remotely sensed climatic and environmental data, along with socioeconomic variables from readily available data-bases were employed as predictors. Our models provided mean prevalence estimates for A. lumbricoides, T. trichiura andhookworm of 15.6%, 10.1% and 2.5%, respectively. By considering infection risk and population numbers at the unit ofthe municipality, we estimate that 29.7 million Brazilians are infected with A. lumbricoides, 19.2 million with T. trichiuraand 4.7 million with hookworm. Our model-based maps identified important risk factors related to the transmission of soil-transmitted helminths and confirm that environmental variables are closely associated with indices of poverty. Oursmoothed risk maps, including uncertainty, highlight areas where soil-transmitted helminthiasis control interventions aremost urgently required, namely in the North and along most of the coastal areas of Brazil. We believe that our predictiverisk maps are useful for disease control managers for prioritising control interventions and for providing a tool for more effi-cient surveillance-response mechanisms.
Keywords: Bayesian modelling, geographical information system, remote sensing, soil-transmitted helminths, variable selec-tion, Brazil.
Introduction
The soil-transmitted helminths are a group of nema-tode parasites that cause human infection when theireggs are ingested (Ascaris lumbricoides and Trichuristrichiura) or larvae penetrate the skin (the two hook-worm species Ancylostoma duodenale and Necatoramericanus) (Bethony et al., 2006; Hotez et al., 2008;Knopp et al., 2012). Recent climate suitability model-ling suggests that more than 5.3 billion people were atrisk of soil-transmitted helminthiasis in 2010 withover 1 billion people infected with at least one of theaforementioned soil-transmitted helminth species(Pullan and Brooker, 2012). The distribution of infec-
tions is governed by social-ecological systems withpoverty playing a key role in maintaining high levels ofendemicity. Indeed, the highest rates and intensity ofinfection and public health burden are concentrated inpoor communities in tropical and subtropical areas (deSilva et al., 2003; Tchuem Tchuenté, 2011; Lustigmanet al., 2012; Ziegelbauer et al., 2012). The highestinfection intensities are usually observed in school-aged children, whilst there is a decline in prevalenceand intensity of infection with age (Anderson andMay, 1985; de Silva et al., 2003; Bethony et al., 2006;Brooker et al., 2007). Hence, the global strategy tocontrol soil-transmitted helminthiasis (and otherhelminth infections such as schistosomiasis) targets theschool-aged population, and this is done by periodicadministration of anthelminthic drugs, usually with-out prior diagnosis (WHO, 2002, 2006; Hotez et al.,2007; Utzinger et al., 2009).
In Brazil, soil-transmitted helminth infections are ofconsiderable public health importance, particularlythrough their association with anaemia, diarrhoea and
Corresponding author:Penelope VounatsouDepartment of Epidemiology and Public HealthSwiss Tropical and Public Health InstituteP.O. Box, CH-4002 Basel, SwitzerlandTel. +41 61 284-8109; Fax +41 61 284-8105E-mail: [email protected]
Geospatial Health 8(1), 2013, pp. 97-110
R.G.C. Scholte et al. - Geospatial Health 8(1), 2013, pp. 97-110
malnutrition, which impairs the physical, psychoso-matic and social development of school-aged childrenand adolescents (Pedrazzani et al., 1988; Nascimentoand Moitinho, 2005; Brooker et al., 2007; Jardim-Botelho et al., 2008). In 2009, the Pan AmericanHealth Organization (PAHO) put forward an agendafor the control and elimination of neglected diseasesand other poverty-related infections in Latin Americaand the Caribbean (PAHO, 2009; Schneider et al.,2011; Colston and Saboyá, 2013). Interventions thatfocus on priority areas are required to improve thecost-effectiveness of control programmes and, amongthe proposed deliverables, reliable maps of the distri-bution of neglected tropical diseases along with esti-mates of the numbers infected play an important role(Carvalho et al., 2010; Guimarães et al., 2010; Ault etal., 2012; Scholte et al., 2012a; Colston and Saboyá,2013).
Bayesian geostatistical models have been widelyused for predicting the spatial distribution of helminthinfections at different scales and for different parts ofthe world. Successful applications include risk profil-ing of schistosomiasis, soil-transmitted helminthiasisand co-infections at the village, district, national andregional level in Africa and Asia (Clements et al.,2006; Raso et al., 2006; Steinmann et al., 2007; Schuret al., 2011a; Chammartin et al., 2013a). In LatinAmerica, the paucity of data has considerably delayedthe mapping, and hence control, of soil-transmittedhelminthiasis (Sabin Vaccine Institute/Inter-AmericanDevelopment Bank/PAHO, 2011). Recent workattempted to fill this gap. Indeed, the geographical dis-tribution of the three major soil-transmitted helminthspecies has been modelled based on historical datafrom South America using different approaches(Chammartin et al., 2013b; Colston and Saboyá,2013). Another recent study assessed the regional riskof ascariasis and trichuriasis in relation to climatic,environmental and social variables in the BrazilianState of Minas Gerais (Scholte et al., 2012b) based ondata from the schistosomiasis national control pro-gramme (NCP). However, the analyses by Scholte etal. (2012b) and Colston and Saboyá (2013) used stan-dard statistical models that ignore spatial correlationof the data, and hence estimates have to be interpret-ed with caution.
In the study presented here, we analyse prevalencedata of A. lumbricoides, T. trichiura and hookwormcollected by the NCP from 2005 to 2009 and producenationwide high-resolution risk maps for the threesoil-transmitted helminth species. Superimposing pop-ulation density, we estimated the number of infected
people stratified by state. A Bayesian geostatisticalmodelling framework was employed with aligned datacollected over large number of locations. As predic-tors, we used remotely sensed climatic and environ-mental data and socioeconomic proxies. Our predic-tive maps aim to inform local and national authoritiesto better target limited resources to control and even-tually eliminate soil-transmitted helminthiasis inBrazil.
Materials and methods
Soil-transmitted helminth infection prevalence data
Prevalence data for A. lumbricoides, T. trichiuraand hookworm were obtained from 1,020 municipal-ities across Brazil surveyed in the years 2005-2009within the NCP framework. The diagnostic methodemployed to detect Schistosoma mansoni infectionwas the Kato-Katz technique (Katz et al., 1972),which is also widely used for detection and quantifi-cation of soil-transmitted helminth infections (Speichet al., 2010; Knopp et al., 2012). A single Kato-Katzthick smear was prepared from each participant.Fig. 1 shows the localities of the surveyed municipali-ties.
Climatic and environmental data
Table 1 summarises the different data sourcesutilised to derive climatic and environmental data. Inbrief, climate data were extracted from WorldclimGlobal Climate Data (Hijmans et al., 2005). Thesedata consist of 19 bioclimatic variables.Environmental data were obtained from the ModerateResolution Imaging Spectroradiometer (MODIS)onboard the Terra satellite. Land surface temperature(LST) data were used as proxy for day and night tem-peratures. The normalised difference vegetation index(NDVI) and enhanced vegetation index (EVI) wereused as proxies for moisture and vegetation, respec-tively. A digital elevation model (DEM) was employedto extract altitude data.
Socioeconomic data
Table 2 summarises the socioeconomic indicatorsused in our study. In brief, population data for theyear 2010 were stratified into rural and urban.Human development index (HDI) data for the year2000 were provided by the Instituto Brasileiro deGeografia e Estatística (IBGE). Unsatisfied basic needs
98

R.G.C. Scholte et al. - Geospatial Health 8(1), 2013, pp. 97-110
Fig. 1. Observed prevalence of soil-transmitted helminth infections in Brazil from 2005-2009 (data obtained from the schistoso-miasis NCP).
Source Type of data Period Temporal resolution
Shuttle Radar TopographyMission (SRTM)
Digital elevation model (DEM) 2000 Once
Moderate Resolution Imaging Spectroradiometer(MODIS)/Terra
Land surface temperature (LST) for day and nightNormalised difference vegetation index (NDVI)
2005-20092005-2009
8 days16 days
Worldclim GlobalClimate Data
BIO1 (annual mean temperature)BIO2 (mean diurnal range (mean of monthly (max temp - min temp)))BIO3 (isothermality (BI02/BI07) (*100))BIO4 (temperature seasonality (standard deviation*100))BIO5 (max temperature of warmest month)BIO6 (min temperature of coldest month)BIO7 (temperature annual range (BI05-BI06))BIO8 (mean temperature of wettest quarter)BIO9 (mean temperature of driest quarter)BIO10 (mean temperature of warmest quarter)BIO11 (mean temperature of coldest quarter)BIO12 (annual precipitation)BIO13 (precipitation of wettest month)BIO14 (precipitation of driest month)BIO15 (precipitation seasonality (coefficient of variation))BIO16 (precipitation of wettest quarter)BIO17 (precipitation of driest quarter)BIO18 (precipitation of warmest quarter)BIO19 (precipitation of coldest quarter)
1950-20001950-20001950-20001950-20001950-20001950-20001950-20001950-20001950-20001950-20001950-20001950-20001950-20001950-20001950-20001950-20001950-20001950-20001950-2000
OnceOnceOnceOnceOnceOnceOnceOnceOnceOnceOnceOnceOnceOnceOnceOnceOnceOnceOnce
Table 1. Data sources and properties of the climatic and other environmental covariates used for Bayesian geostatistical modelling(spatial resolution = 1 km).
(UBN) data for the year 2000 were provided byPAHO. Infant mortality rate (IMR), which has beenused as a poverty proxy by the Center forInternational Earth Science Information Network(CIESIN), for the year 2000, and human influenceindex (HII) for the year 2005, were provided by theCIESIN.
Statistical analysis
For each soil-transmitted helminth species, univari-ate logistic regressions for the continuous environmen-tal and socioeconomic factors were performed in orderto assess potential non-linear trends in relation to thelogit scale of the infection risk. Covariates indicating
99

R.G.C. Scholte et al. - Geospatial Health 8(1), 2013, pp. 97-110
Source Type of data Year
Instituto Brasileiro de Geografia e Estatística(IBGE) (census data)
Population dataHuman development index (HDI)Rural population
201020002000
Pan American Health Organization(unsatisfied basic needs) (census data)
Bras0_3 (% of pupils enrolled in primary school)Bras0_4 (% of pupils completing primary school)Bras0_5 (rate literacy 15 to 24 years)Bras0_6 (girls and boys, primary school)Bras0_7 (girls and boys, high school)Bras0_8 (girls and boys, undergraduate school)Bras0_9 (relation literacy women and men 15 to 24 years)Bras0_10 (% women work, non-farm)Bras0_11 (% people with potable water at house)Bras0_12 (% people with sanitation at house)Bras0_13 (% people with energy at house)Bras0_14 (% own x rent house)Bras0_15 (index secure tenure house)Bras0_16 (unemployment rate)Bras0_17 (% of houses with phone)Bras0_18 (% of houses with computer)Bras2_11 (% of people overcrowding)Bras2_15 (% of people subsistence)Infant mortality rate (IMR)
2000200020002000200020002000200020002000200020002000200020002000200020002000
Center for International Earth ScienceInformation Network (CIESIN)
Human influence index (HII) 2005
Table 2. Data sources and properties of the socioeconomic covariates used in our Bayesian geostatistical model to predict soil-trans-mitted helminth infection prevalence in Brazil (socioeconomic data are at the unit of the municipality).
non-linear trends were categorised into three or fourgroups, based on inspection of scatter-plots. Thedeviance information criterion (DIC) was employed todetect whether univariate logistic regressions on linearor categorised covariates have smaller DIC and there-fore better fit the outcome.
Parsimonious sets of environmental and socioeco-nomic covariates were obtained for each infectionusing Gibbs variable selection (George andMcCulloch, 1993). Variable selection was carried outin a Bayesian framework, using non-spatial multivari-ate logistic regression models with standardised linearcovariates. Bayesian geostatistical logistic regressionmodels were fitted on the reduced set of covariateswith location-specific random effect parameters toaccount for potential spatial correlation. The modelwas developed assuming that the random effects fol-low a multivariate normal distribution with variance-covariance matrix related to an exponential correla-tion function between any pair of locations. Markovchain Monte Carlo (MCMC) simulation wasemployed to estimate all model parameters.
We predicted species-specific soil-transmittedhelminth infection prevalence based on the estimatedassociations of the reduced set of covariates on the out-come and spatial parameters via Bayesian kriging, usingmarginal predictive posterior distributions. Predictionwas carried out using a grid with a spatial resolution of
5 x 5 km that resulted in over 280,000 locations forBrazil. A random sample of 820 training locations wasselected to fit the geostatistical models. The predictiveability of each model was then assessed by comparingthe model-based predictions at the remaining 200 testlocations with the observed outcomes at these locationsusing (i) mean absolute errors (MAE) and (ii) propor-tion of location correctly predicted within a 95%Bayesian credible interval (BCI). The statistical analyseswere carried out in STATA/IC version 10.1 (Stata Corp.LP; College Station, USA), WinBUGS 1.4.3 (ImperialCollege and Medical Research Council, London, UK)and Fortran 95 (Digital Equipment Corp.; Maynard,USA).
Ethical considerations
Soil-transmitted helminth infection prevalence datawere obtained from the schistosomiasis NCP,approved by the Ministry of Health in Brazil. No spe-cific ethical approval was required for the secondaryanalysis presented in this article, which focuses on riskprofiling of soil-transmitted helminth infection.
Results
The georeferenced soil-transmitted helminth species-specific infection prevalence data obtained from the
100

R.G.C. Scholte et al. - Geospatial Health 8(1), 2013, pp. 97-110
schistosomiasis NCP consisted of 1,020 unique surveylocations. Taken together, the observed prevalenceranged from nil to 64.3% with a mean prevalence of10.3% (median = 5.0% and standard deviation (SD) =13.4%) for A. lumbricoides, from nil to 42.5% with amean prevalence of 4.9% (median = 0.8% and SD =9.1%) for hookworm, and from nil to 33.4% with amean prevalence of 3.7% (median = 0.8% and SD =6.7%) for T. trichiura infection. The spatial distribu-tion of the survey locations and the prevalence of infec-tion with A. lumbricoides, hookworm and T. trichiuraare shown in Figs. 1a, 1b and 1c, respectively.
In our initial analyses, we included a set of 45 cli-matic, environmental and socioeconomic covariates.However, after careful variable selection, between 29and 33 of these covariates were removed depending onthe soil-transmitted helminth species in question.Hence, for the final geostatistical analyses, a total of16, 15 and 12 covariates were used for the predictionof risk with hookworm, A. lumbricoides andT. trichiura, respectively. Model validation indicatedthat the MAE of the A. lumbricoides was 7.3, meaningthat, on average, our predicted prevalence at the testlocations for A. lumbricoides in Brazil was about 7%higher or lower than the observed prevalence data.The hookworm and T. trichiura models showed bet-ter predictive performance with MAEs of 4.4 and 3.0,respectively. Additionally, the latter two soil-transmit-ted helminth species were correctly predicted within95% BCIs for 98% of the test locations. Even thoughthe model for A. lumbricoides ranked third, its predic-tive ability was high as it correctly predicted 94% ofthe test locations within a 95% BCI. Tables 3, 4 and 5show the results of the Bayesian variable selection andparameter estimates of the final geostatistical modelsfor hookworm, A. lumbricoides and T. trichiura,respectively.
For A. lumbricoides, the most suitable climate con-ditions appear to be high rainfall and temperaturesbelow 26 °C. In addition, we found a negative associ-ation between A. lumbricoides and altitude. Thesocioeconomic indicators suggest that the higher theHDI and the proportion of people living in houseswith sanitation facilities and electricity, the lower theodds of A. lumbricoides infection. Municipalities withhigher tenure housing index were at lower risk ofA. lumbricoides, while HII was positively correlatedwith A. lumbricoides infection.
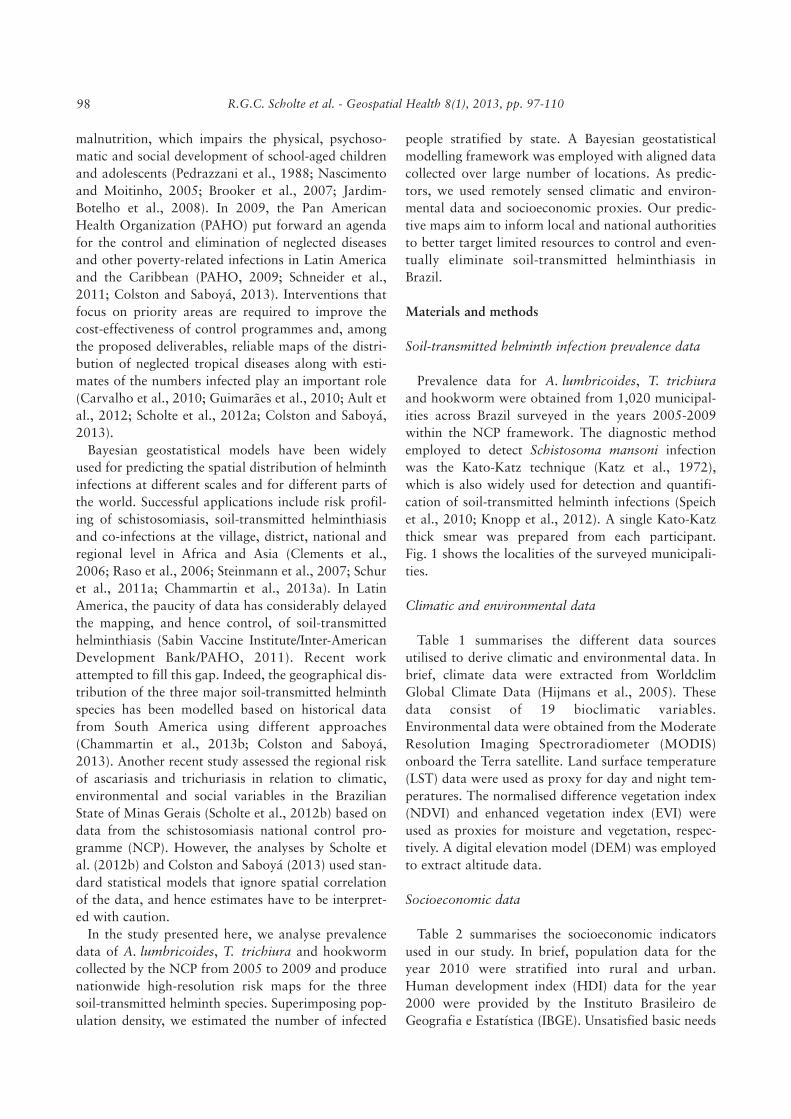
For T. trichiura, the socioeconomic indicators sug-gest that the higher the HDI and percentage of self-subsistence people, the lower the odds of an infectionwith this helminth species. On the other hand, the
higher the HII and the percentage of people livingunder crowded conditions, the higher the odds ofT. trichiura infection. The climatic factors that werefound to be significantly associated with T. trichiurainfection were high annual rainfall and temperaturesbelow 26 °C. However, altitude showed a negativerelation.
The hookworm model suggested that high vegeta-tion index and precipitation are suitable for transmis-sion, while altitude was negatively associated. Thesocioeconomic variables suggested that the higher thepercentage of urban population and HDI, the lowerthe odds for hookworm infection. Municipalities withhigh IMR had lower odds for both hookworm andT. trichiura infection. This negative relation has beenestimated both by non-spatial bivariate logistic regres-sion (data not shown) and multivariate geostatisticalmodels.
Spatial parameter estimates were similar for all threesoil-transmitted helminth species. The spatial rangewas estimated to be 4.9 km (95% BCI: 3.1-12.7 km),5.1 km (95% BCI: 3.1-14.7 km) and 5.1 km (95%BCI: 3.1-14.2 km) for A. lumbricoides, T. trichiuraand hookworm infection, respectively. The residualspatial variation was overall very low with the largestvariance of 0.03 (95% BCI: 0.01-0.04) observed forthe A. lumbricoides model. In comparison, the non-spatial variance was between 160 (A. lumbricoides)and 510 (hookworm) times smaller than the spatialvariation. These results suggest that the remaining spa-tial correlation was low after adjusting for the climat-ic and socioeconomic predictors.
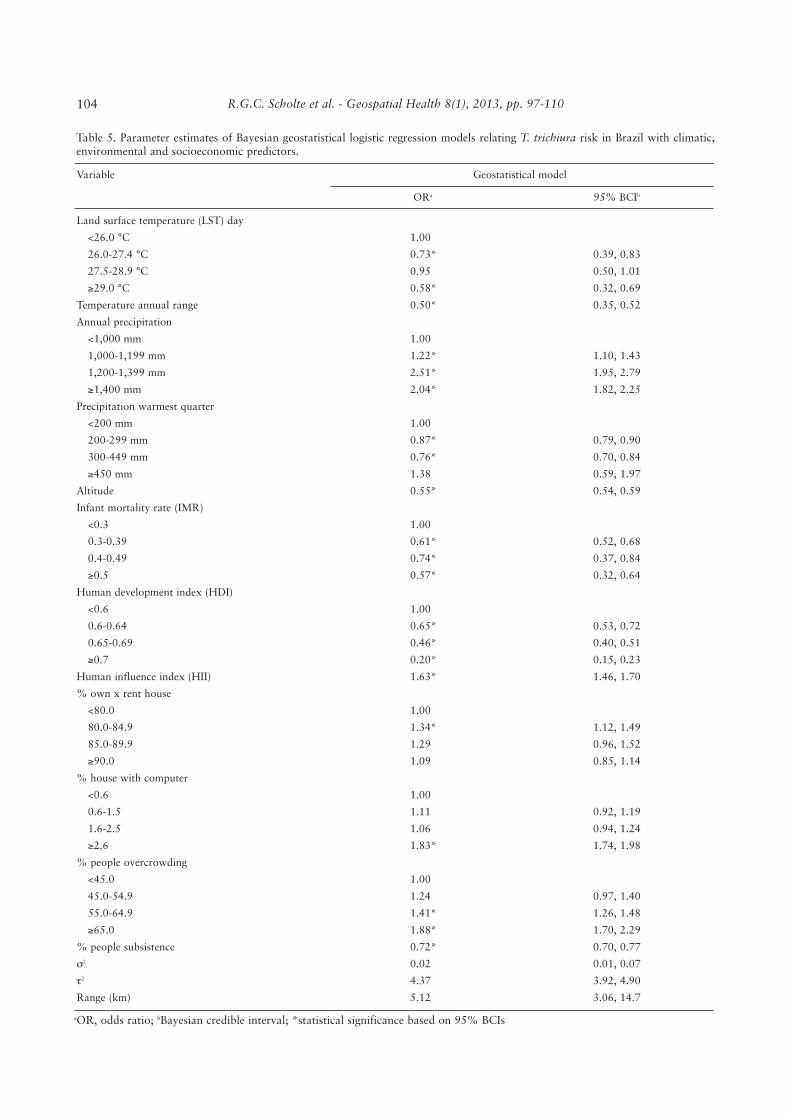
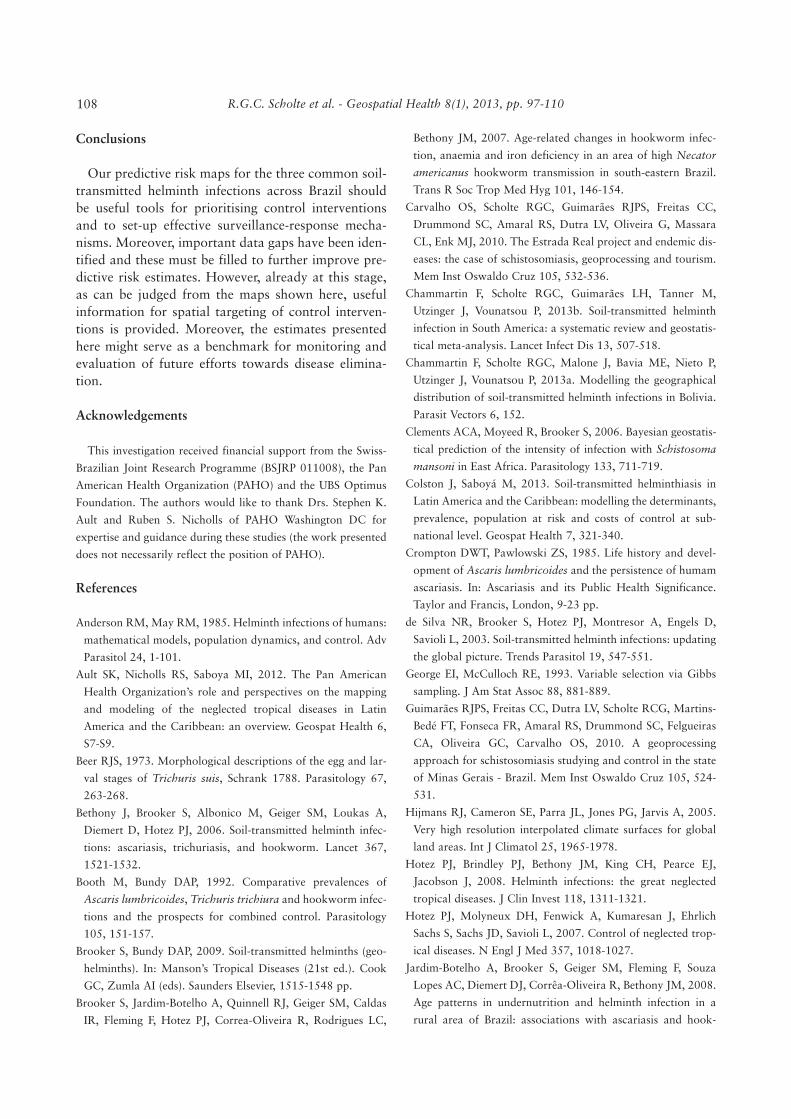
The predictive spatial distribution of the risk forA. lumbricoides, T. trichiura and hookworm in Brazil,based on the estimated outcome-predictor associationsand other modelling parameters, are shown in Fig. 2.The highest risk is in the North, the eastern part ofNortheast (the coast line), the South and along thesouth-eastern coastline. While there is low risk forA. lumbricoides infection in the south-eastern and cen-tral regions, the risk of infection with this helminthspecies is considerable higher elsewhere in Brazil. Thehighest risk for T. trichiura is in the North and alongthe north-eastern coast line, whereas the low risk areasare concentrated in the South, the Central and theSoutheast regions. High-risk areas for hookworm arein the North and inland with the low-risk areas main-ly found in the South, Southeast and Northeast. Fig. 3shows the corresponding prediction uncertainty maps,as indicated by the SDs of the model prediction errors.
By considering municipality-specific population sizes,we were able to convert model-based prevalence esti-
101

R.G.C. Scholte et al. - Geospatial Health 8(1), 2013, pp. 97-110
Variable Geostatistical model
ORa 95% BCIb
Normalised difference vegetation index (NDVI)
Mean diurnal range
<8.0 °C
8.0-9.9 °C
10.0-11.9 °C
≥12.0 °C
Precipitation wettest month
Precipitation driest month
Precipitation warmest quarter
<200 mm
200-299 mm
300-449 mm
≥450 mm
Altitude
% urban population
<35.0
35.0-54.9
55.0-74.9
≥75.0
Infant mortality rate (IMR)
<0.3
0.3-0.39
0.4-0.49
≥0.5
Human development index (HDI)
Human influence index (HII)
<19.0
19.0-20.9
21.0-23.9
≥24.0
% people potable water at house
% people sanitation at house
<1.0
1.0-14.9
15.0-39.9
≥40.0
% people energy at house
<85.0
85.0-94.9
≥95.0
Index secure tenure house
Unemployment rate
<15.0
15.0-24.9
≥25.0
% house with phone
σ2
τ2
Range (km)
1.72*
1.00
1.38*
1.39
1.16
1.75*
0.70*
1.00
0.67*
0.64*
0.19*
0.36*
1.00
0.55*
0.54*
0.49*
1.00
0.45*
0.35*
0.10*
0.30*
1.00
1.10
1.93*
1.31
1.85*
1.00
1.18
2.69*
3.74*
1.00
1.20
1.98*
0.52*
1.00
0.87
0.59*
1.66*
0.01
5.36
5.12
1.60, 1.77
1.20, 1.56
0.96, 1.51
0.94, 1.44
1.64, 1.84
0.68, 0.73
0.40, 0.75
0.59, 0.74
0.14, 0.26
0.35, 0.37
0.45, 0.61
0.42, 0.59
0.29, 0.55
0.39, 0.54
0.31, 0.36
0.07, 0.11
0.22, 0.32
0.78, 1.26
1.02, 2.12
0.51, 1.48
1.43, 1.97
0.97, 1.33
2.25, 2.90
2.08, 4.39
0.91, 1.28
1.26, 2.44
0.42, 0.54
0.76, 1.00
0.45, 0.63
1.48, 1.79
0.01, 0.02
4.82, 5.98
3.05, 14.20
Table 3. Parameter estimates of Bayesian geostatistical logistic regression models relating hookworm risk in Brazil with climatic,environmental and socioeconomic predictors.
aOR, odds ratio; bBayesian credible interval; *statistical significance based on 95% BCIs
102

R.G.C. Scholte et al. - Geospatial Health 8(1), 2013, pp. 97-110
Variable Geostatistical model
ORa 95% BCIb
Land surface temperature (LST) day<26.0 °C26.0-27.4 °C27.5-28.9 °C≥29.0 °C
Temperature annual range<12.0 °C12.0-14.9 °C15.0-17.9 °C≥18.0 °C
Annual precipitationPrecipitation driest month
<10.0 mm10.0-19.9 mm20.0-29.9 mm≥30.0 mm
Precipitation warmest quarterAltitude
<150 m150-390 m400-690 m≥700 m
Infant mortality rate (IMR)<0.30.3-0.390.4-0.49≥0.5
Human development index (HDI)<0.60.6-0.640.65-0.69≥0.7
Human influence index (HII)% people sanitation in house% people energy in house
<80.080.0-89.990.0-94.9≥95.0
% own x rent house<80.080.0-84.985.0-89.9≥90.0
Index secure tenure house% house with phone
<4.04.0-5.96.0-11.9≥12.0
% house with computer<0.60.6-1.51.6-2.5≥2.6
σ2
τ2
Range (km)
1.000.56*0.52*0.35*
1.000.76*1.11*1.201.32*
1.001.84*1.93*2.37*0.72*
1.000.72*0.37*0.30*
1.000.90*1.111.19
1.000.52*0.57*0.24*1.41*0.85*
1.000.890.69*0.56*
1.001.35*1.021.130.88*
1.001.211.33*1.71*
1.001.12*1.031.210.032.894.86
0.53, 0.580.41, 0.550.22, 0.42
0.68, 0.861.02, 1.220.76, 1.351.22, 1.35
1.33, 2.081.84, 2.031.70, 2.590.71, 0.76
0.48, 0.780.32, 0.400.23, 0.35
0.73, 0.980.76, 1.320.71, 1.25
0.50, 0.550.43, 0.660.23, 0.251.38, 1.440.72, 0.89
0.64, 1.010.63, 0.740.42, 0.63
1.20, 1.450.76, 1.190.92, 1.190.85, 0.91
0.96, 1.381.19, 1.421.52, 1.86
1.05, 1.180.98, 1.130.91, 1.420.01, 0.042.63, 3.203.05, 12.70
Table 4. Parameter estimates of Bayesian geostatistical logistic regression models relating A. lumbricoides risk in Brazil with cli-matic, environmental and socioeconomic predictors.
aOR, odds ratio; bBayesian credible interval; *statistical significance based on 95% BCIs
103
R.G.C. Scholte et al. - Geospatial Health 8(1), 2013, pp. 97-110
Variable Geostatistical model
ORa 95% BCIb
Land surface temperature (LST) day
<26.0 °C
26.0-27.4 °C
27.5-28.9 °C
≥29.0 °C
Temperature annual range
Annual precipitation
<1,000 mm
1,000-1,199 mm
1,200-1,399 mm
≥1,400 mm
Precipitation warmest quarter
<200 mm
200-299 mm
300-449 mm
≥450 mm
Altitude
Infant mortality rate (IMR)
<0.3
0.3-0.39
0.4-0.49
≥0.5
Human development index (HDI)
<0.6
0.6-0.64
0.65-0.69
≥0.7
Human influence index (HII)
% own x rent house
<80.0
80.0-84.9
85.0-89.9
≥90.0
% house with computer
<0.6
0.6-1.5
1.6-2.5
≥2.6
% people overcrowding
<45.0
45.0-54.9
55.0-64.9
≥65.0
% people subsistence
σ2
τ2
Range (km)
1.00
0.73*
0.95
0.58*
0.50*
1.00
1.22*
2.51*
2.04*
1.00
0.87*
0.76*
1.38
0.55*
1.00
0.61*
0.74*
0.57*
1.00
0.65*
0.46*
0.20*
1.63*
1.00
1.34*
1.29
1.09
1.00
1.11
1.06
1.83*
1.00
1.24
1.41*
1.88*
0.72*
0.02
4.37
5.12
0.39, 0.83
0.50, 1.01
0.32, 0.69
0.35, 0.52
1.10, 1.43
1.95, 2.79
1.82, 2.25
0.79, 0.90
0.70, 0.84
0.59, 1.97
0.54, 0.59
0.52, 0.68
0.37, 0.84
0.32, 0.64
0.53, 0.72
0.40, 0.51
0.15, 0.23
1.46, 1.70
1.12, 1.49
0.96, 1.52
0.85, 1.14
0.92, 1.19
0.94, 1.24
1.74, 1.98
0.97, 1.40
1.26, 1.48
1.70, 2.29
0.70, 0.77
0.01, 0.07
3.92, 4.90
3.06, 14.7
Table 5. Parameter estimates of Bayesian geostatistical logistic regression models relating T. trichiura risk in Brazil with climatic,environmental and socioeconomic predictors.
aOR, odds ratio; bBayesian credible interval; *statistical significance based on 95% BCIs
104

R.G.C. Scholte et al. - Geospatial Health 8(1), 2013, pp. 97-110
Fig. 2. Estimates of the spatial distribution of soil-transmitted helminth infection prevalence in Brazil.
Fig. 3. Maps of the error of prediction.
mates into number of infected people at the unit of themunicipality and, after aggregation, at the state level(Table 6). At the national level, we estimate that 29.7million Brazilians (15.6%) are infected with A. lumbri-coides. The corresponding 95% CI ranges between 26.9and 32.4 million people. For hookworm, we estimatethe number of infected people at 4.7 million (2.5%),whereas the 95% CI range between 4.0 and 5.8 millionpeople. For T. trichiura, we estimate that 19.2 millionBrazilians are infected (10.1%) with a 95% CI rangingbetween 16.6 and 21.6 million people.
Discussion
To our knowledge, we present the first model-based,spatially explicit risk maps of soil-transmitted helminthinfections for Brazil at high spatial resolution (5 x 5 km).
Our estimates include the number of infected people atthe state level (aggregation of municipality-level data) aswell as for the entire country. At the national level, weestimate overall prevalences for A. lumbricoides, T.trichiura and hookworm of 15.6%, 10.1% and 2.5%,respectively, which translates to 4.7 million infectionswith hookworm, 19.2 million infections with T. trichiu-ra and 29.7 infections with A. lumbricoides. Our esti-mates were derived from advanced Bayesian geostatisti-cal models, including two validation approaches. Modelconstruction took into account the relation between theparasite prevalence data with remotely sensed climaticand environmental data and socioeconomic variablesobtained from readily available databases. From the ini-tial set of 45 covariates, between 12 and 16 covariatesremained in the final models, depending on the soil-transmitted helminth species investigated.
105

R.G.C. Scholte et al. - Geospatial Health 8(1), 2013, pp. 97-110106
Tabl
e 6.
Geo
stat
isti
cal m
odel
-bas
ed e
stim
ates
of
the
num
ber
of p
eopl
e in
fect
ed w
ith
A.
lum
bric
oide
s, T
. tr
ichi
ura
and
hook
wor
m in
eac
h on
e of
the
26
stat
es a
nd t
he F
eder
al D
istr
ict
in B
razi
l.
Stat
eA
bbre
viat
ion
Popu
lati
onPr
edic
ted
infe
cted
pop
ulat
ion
A.
lum
bric
oide
sT.
tri
chiu
raH
ookw
orm
Est
imat
e95
% C
IE
stim
ate
95%
CI
Est
imat
e95
% C
I
Acr
e
Ala
goas
Am
apá
Am
azon
as
Bah
ia
Cea
rá
Dis
trit
o Fe
dera
l
Esp
írit
o Sa
nto
Goi
ás
Mar
anhã
o
Mat
o G
ross
o
Mat
o G
ross
o do
Sul
Min
as G
erai
s
Pará
Para
íba
Para
ná
Pern
ambu
co
Piau
í
Rio
de
Jane
iro
Rio
Gra
nde
do N
orte
Rio
Gra
nde
do S
ul
Ron
dôni
a
Ror
aim
a
Sant
a C
atar
ina
São
Paul
o
Serg
ipe
Toca
ntin
s
Tota
l
AC
AL
AP
AM
BA
CE
DF
ES
GO
MA
MT
MS
MG
PA PB PR PE PI RJ
RN
RS
RO
RR
SC SP SE TO
732,
793
3,12
0,92
2
668,
689
3,48
0,93
7
14,0
21,4
32
8,44
8,05
5
2,56
2,96
3
3,51
2,67
2
6,00
4,04
5
6,56
9,68
3
3,03
3,99
1
2,44
9,34
1
19,5
95,3
09
7,58
8,07
8
3,76
6,83
4
10,4
39,6
01
8,79
6,03
2
3,11
9,01
5
15,9
93,5
83
3,16
8,13
3
10,6
95,5
32
1,56
0,50
1
451,
227
6,24
9,68
2
41,2
52,1
60
2,06
8,03
1
1,38
3,45
3
190,
732,
694
137,
472
640,
726
201,
945
987,
890
1,44
8,41
4
830,
444
84,8
35
364,
265
258,
174
1,65
5,56
1
191,
749
146,
716
1,06
2,06
6
1,76
0,43
5
315,
285
1,16
9,23
6
605,
168
322,
195
1,75
4,49
7
279,
747
1,80
1,12
8
200,
213
78,0
18
803,
710
2,03
7,85
7
429,
944
144,
295
29,6
97,0
81
116,
148;
1
57,9
91
546,
162;
7
27,4
87
186,
164;
2
14,9
17
859,
792;
1
,125
,039
1,36
4286
; 1
,549
,369
685,
138;
9
67,3
03
57,4
11;
121
,485
322,
815;
4
19,0
62
208,
941;
3
15,2
13
1,50
9,05
7;
1,8
07,3
20
158,
071;
2
27,2
46
115,
609;
1
80,0
27
979,
766;
1
,156
,124
1,56
9,97
4;
1,9
16,7
49
271,
213;
3
63,5
00
963,
576;
1
,375
,940
535,
679;
6
80,8
13
296,
619;
3
48,3
94
1,53
2,18
6;
1,9
86,4
04
232,
541;
3
33,2
88
1,46
4,21
9;
2,1
14,5
07
176,
961;
2
22,5
28
69,9
86;
85,
869
613,
094;
9
73,0
76
1,77
3,84
3;
2,2
97,7
46
384,
034;
4
69,4
44
121,
001;
1
63,6
63
26,8
74,2
37;
32,
405,
485
137,
985
309,
908
107,
793
444,
168
412,
231
827,
065
26,3
99
318,
951
460,
511
1,32
1,82
1
285,
196
96,2
60
482,
045
1,23
2,30
4
258,
405
223,
408
243,
651
392,
684
1,00
4,39
8
188,
188
257,
763
357,
355
50,3
12
104,
370
643,
534
157,
378
121,
329
19,1
68,6
36
125,
381;
1
51,5
42
260,
285;
3
60,7
79
84,5
90;
131
,331
373,
505;
5
54,5
14
335,
113;
5
03,3
70
689,
362;
9
54,6
31
13,5
84;
47,
672
244,
131;
3
93,0
68
387,
862;
5
48,1
70
1,18
1,23
0;
1,4
13,1
39
236,
348;
3
41,6
28
82,7
88;
112
,180
389,
947;
5
85,9
00
1,07
5,23
1;
1,3
80,2
72
215,
463;
3
10,7
64
178,
518;
2
82,9
14
205,
828;
2
81,4
74
335,
918;
4
20,4
44
846,
061;
1
,175
,529
164,
110;
2
16,3
84
192,
520;
3
65,7
88
291,
814;
4
29,2
94
38,5
35;
62,
586
79,9
96;
140
,618
519,
778;
8
00,2
92
130,
493;
1
86,5
37
106,
941;
1
48,4
45
16,6
31,8
91;
21,
648,
161
23,8
90
237,
191
28,9
55
124,
966
273,
418
274,
562
44,3
40
98,3
55
55,8
38
392,
868
14,2
60
23,0
24
207,
711
289,
106
132,
593
144,
067
211,
105
58,3
26
782,
087
145,
735
151,
877
22,7
84
7,67
1
115,
620
878,
672
166,
684
16,4
64
4,74
9,24
5
14,2
90;
38,
985
206,
606;
2
76,8
26
25,2
10;
33,
101
80,0
62;
191
,800
231,
354;
3
15,4
82
223,
874;
3
26,9
40
24,3
49;
73,
045
72,7
13;
133
,833
43,8
30;
69,
647
352,
136;
4
29,6
58
11,8
33;
18,
204
17,3
91;
32,
087
172,
439;
2
52,7
80
246,
613;
3
34,6
35
111,
122;
1
55,9
47
103,
353;
1
85,8
25
177,
680;
2
44,5
30
47,4
10;
69,
866
655,
737;
9
05,2
37
121,
340;
1
71,0
80
80,2
17;
272
,737
18,8
83;
28,
090
5,95
7;
10,
108
81,8
71;
156
,868
734,
289;
1
,068
,431
139,
593;
1
95,2
23
12,5
90;
21,
997
3,96
7,24
1;
5,7
60,1
28

R.G.C. Scholte et al. - Geospatial Health 8(1), 2013, pp. 97-110 107
Using a simple linear regression approach, Colstonand Saboyá (2013) estimated that the overall prevalenceof soil-transmitted helminth infection among school-aged children in Brazil is 29.3%. Brazil-specific dataobtained from a Bayesian geostatistical meta-analysis ofhistoric soil-transmitted helminth survey data at thecontinental level revealed similar prevalence estimatesfor A. lumbricoides (14.3%) and T. trichiura (10.1%)(Chammartin et al., 2013b). However, for hookworm,a five-fold difference in the estimated prevalence wasfound: 2.5% in the current study compared to the12.3% obtained by Chammartin et al. (2013b).Differences in the spatial and temporal coverage of thedata might explain this observation. For example, interms of spatial coverage, risk profiling carried out byChammartin et al. (2013b) focussed on entire LatinAmerica, whereas the current analysis pertains to Brazilonly. In regards of temporality, the hookworm dataemployed by Chammartin et al. (2013b) covered a 10-year period (2000-2009), as opposed to a 5-year period(2005-2009) utilised in the current analysis.
The geographical distribution of A. lumbricoides andT. trichiura infection indicated high prevalence alongthe Atlantic forest areas, which are humid and warmand thus provide a suitable environment for transmis-sion. Our geostatistical models were able to identify themost important climatic factors for parasite develop-ment, and these corroborate with prior laboratoryinvestigations (Beer, 1973; Crompton and Pawlowski,1985). The similar spatial patterns of A. lumbricoidesand T. trichiura predicted by our models are supportedby the similar life cycles of these two helminth speciesoutside the human host (Bethony et al., 2006; Knopp etal., 2012). Of note, the overall prevalence of A. lumbri-coides is somewhat higher than that of T. trichiura,which might be explained by different morphologies ofthe parasite eggs (A. lumbricoides eggs show higherresilience to climate extremes in the natural environ-ment compared T. trichiura eggs), higher egg produc-tion rates of A. lumbricoides compared to T. trichiura,and somewhat faster reinfection of A. lumbricoidescompared to T. trichiura following anthelminthic drugadministration (Brooker and Bundy, 2009; Jia et al.,2012). Hookworm has a distinctively different lifecycle. In fact, hookworm eggs hatch and human infec-tion occurs when the third-stage larvae (L3) activelypenetrate the skin. Hence, hookworm larvae are vul-nerable to desiccation and need humid and warm envi-ronment for survival (Bethony et al., 2006). The geo-graphical distribution of the hookworm risk predictedby our model indicates a high prevalence on theAmazonia Legal region.
Our spatial predictions for each of the three soil-transmitted helminth species studied showed strong cor-relations with socioeconomic and environmentalcovariates (precipitation and temperature). Our resultstherefore suggest that these variables are importantdrivers for the spatial distribution of A. lumbricoides, T.trichiura and hookworm, which should be consideredwhen control strategies are planned. Importantly, ourmodels predict the risk of soil-transmitted helminthinfections at high spatial resolutions (i.e. 5 x 5 km)aggregated at various levels from the municipality to thenational. Our fine-scale estimates (e.g. municipalitylevel) can be utilised, alongside guidelines put forwardby the World Health Organization (WHO) for preven-tive chemotherapy (WHO, 2006), to calculate the costof preventive chemotherapy at the administrative unitwhere interventions will be implemented. Colston andSaboyá (2013), who estimated the prevalence of soil-transmitted helminth infection in the school-aged popu-lation of Brazil at 29.3% and using WHO treatmentguidelines, came up with an initial cost of US$ 17.5 mil-lion for administering anthelminthic drugs to school-aged children.
It must be admitted that our prediction maps may notcapture disease focality with high accuracy since ourgeospatial analysis is based on survey data aggregated atthe municipality level. The surveys were carried out athigher resolution (i.e. villages and towns), but disaggre-gated information of the exact survey locations werenot available. Our models therefore assumed that thereis no variation in our predictors within the municipali-ties although this might not be true, especially not withrespect to the socioeconomic factors. In addition, partsof Brazil lack point prevalence data. For example, thereare no prevalence data available for soil-transmittedhelminth for large areas covering the Amazon as well asthe Central and Southern regions. Interestingly, we esti-mate a lower risk in those areas compared toChammartin et al. (2013b), who used data from neigh-bouring countries to derive inference in such areas. Werecommend that future parasitological surveys be con-ducted in municipalities where no or only limited dataare currently available to improve model accuracy.Finally, advances have been made with multivariate spa-tial models for risk profiling of multiple health out-comes (for a recent example of a joint spatial model forhookworm-Schistosoma mansoni co-infection, seeSchur et al. (2011b)). It would be interesting to developand validate joint spatial models for A. lumbricoidesand T. trichiura, as these two helminth species sharesimilar transmission pathways (Booth and Bundy, 1992;Bethony et al., 2006; Knopp et al., 2012).
R.G.C. Scholte et al. - Geospatial Health 8(1), 2013, pp. 97-110108
Conclusions
Our predictive risk maps for the three common soil-transmitted helminth infections across Brazil shouldbe useful tools for prioritising control interventionsand to set-up effective surveillance-response mecha-nisms. Moreover, important data gaps have been iden-tified and these must be filled to further improve pre-dictive risk estimates. However, already at this stage,as can be judged from the maps shown here, usefulinformation for spatial targeting of control interven-tions is provided. Moreover, the estimates presentedhere might serve as a benchmark for monitoring andevaluation of future efforts towards disease elimina-tion.
Acknowledgements
This investigation received financial support from the Swiss-
Brazilian Joint Research Programme (BSJRP 011008), the Pan
American Health Organization (PAHO) and the UBS Optimus
Foundation. The authors would like to thank Drs. Stephen K.
Ault and Ruben S. Nicholls of PAHO Washington DC for
expertise and guidance during these studies (the work presented
does not necessarily reflect the position of PAHO).
References
Anderson RM, May RM, 1985. Helminth infections of humans:
mathematical models, population dynamics, and control. Adv
Parasitol 24, 1-101.
Ault SK, Nicholls RS, Saboya MI, 2012. The Pan American
Health Organization’s role and perspectives on the mapping
and modeling of the neglected tropical diseases in Latin
America and the Caribbean: an overview. Geospat Health 6,
S7-S9.
Beer RJS, 1973. Morphological descriptions of the egg and lar-
val stages of Trichuris suis, Schrank 1788. Parasitology 67,
263-268.
Bethony J, Brooker S, Albonico M, Geiger SM, Loukas A,
Diemert D, Hotez PJ, 2006. Soil-transmitted helminth infec-
tions: ascariasis, trichuriasis, and hookworm. Lancet 367,
1521-1532.
Booth M, Bundy DAP, 1992. Comparative prevalences of
Ascaris lumbricoides, Trichuris trichiura and hookworm infec-
tions and the prospects for combined control. Parasitology
105, 151-157.
Brooker S, Bundy DAP, 2009. Soil-transmitted helminths (geo-
helminths). In: Manson’s Tropical Diseases (21st ed.). Cook
GC, Zumla AI (eds). Saunders Elsevier, 1515-1548 pp.
Brooker S, Jardim-Botelho A, Quinnell RJ, Geiger SM, Caldas
IR, Fleming F, Hotez PJ, Correa-Oliveira R, Rodrigues LC,
Bethony JM, 2007. Age-related changes in hookworm infec-
tion, anaemia and iron deficiency in an area of high Necator
americanus hookworm transmission in south-eastern Brazil.
Trans R Soc Trop Med Hyg 101, 146-154.
Carvalho OS, Scholte RGC, Guimarães RJPS, Freitas CC,
Drummond SC, Amaral RS, Dutra LV, Oliveira G, Massara
CL, Enk MJ, 2010. The Estrada Real project and endemic dis-
eases: the case of schistosomiasis, geoprocessing and tourism.
Mem Inst Oswaldo Cruz 105, 532-536.
Chammartin F, Scholte RGC, Guimarães LH, Tanner M,
Utzinger J, Vounatsou P, 2013b. Soil-transmitted helminth
infection in South America: a systematic review and geostatis-
tical meta-analysis. Lancet Infect Dis 13, 507-518.
Chammartin F, Scholte RGC, Malone J, Bavia ME, Nieto P,
Utzinger J, Vounatsou P, 2013a. Modelling the geographical
distribution of soil-transmitted helminth infections in Bolivia.
Parasit Vectors 6, 152.
Clements ACA, Moyeed R, Brooker S, 2006. Bayesian geostatis-
tical prediction of the intensity of infection with Schistosoma
mansoni in East Africa. Parasitology 133, 711-719.
Colston J, Saboyá M, 2013. Soil-transmitted helminthiasis in
Latin America and the Caribbean: modelling the determinants,
prevalence, population at risk and costs of control at sub-
national level. Geospat Health 7, 321-340.
Crompton DWT, Pawlowski ZS, 1985. Life history and devel-
opment of Ascaris lumbricoides and the persistence of humam
ascariasis. In: Ascariasis and its Public Health Significance.
Taylor and Francis, London, 9-23 pp.
de Silva NR, Brooker S, Hotez PJ, Montresor A, Engels D,
Savioli L, 2003. Soil-transmitted helminth infections: updating
the global picture. Trends Parasitol 19, 547-551.
George EI, McCulloch RE, 1993. Variable selection via Gibbs
sampling. J Am Stat Assoc 88, 881-889.
Guimarães RJPS, Freitas CC, Dutra LV, Scholte RCG, Martins-
Bedé FT, Fonseca FR, Amaral RS, Drummond SC, Felgueiras
CA, Oliveira GC, Carvalho OS, 2010. A geoprocessing
approach for schistosomiasis studying and control in the state
of Minas Gerais - Brazil. Mem Inst Oswaldo Cruz 105, 524-
531.
Hijmans RJ, Cameron SE, Parra JL, Jones PG, Jarvis A, 2005.
Very high resolution interpolated climate surfaces for global
land areas. Int J Climatol 25, 1965-1978.
Hotez PJ, Brindley PJ, Bethony JM, King CH, Pearce EJ,
Jacobson J, 2008. Helminth infections: the great neglected
tropical diseases. J Clin Invest 118, 1311-1321.
Hotez PJ, Molyneux DH, Fenwick A, Kumaresan J, Ehrlich
Sachs S, Sachs JD, Savioli L, 2007. Control of neglected trop-
ical diseases. N Engl J Med 357, 1018-1027.
Jardim-Botelho A, Brooker S, Geiger SM, Fleming F, Souza
Lopes AC, Diemert DJ, Corrêa-Oliveira R, Bethony JM, 2008.
Age patterns in undernutrition and helminth infection in a
rural area of Brazil: associations with ascariasis and hook-
R.G.C. Scholte et al. - Geospatial Health 8(1), 2013, pp. 97-110 109
worm. Trop Med Int Health 13, 458-467.
Jia TW, Melville S, Utzinger J, King CH, Zhou XN, 2012. Soil-
transmitted helminth reinfection after drug treatment: a sys-
tematic review and meta-analysis. PLoS Negl Trop Dis 6,
e1621.
Katz N, Chaves A, Pellegrino J, 1972. A simple device for quan-
titative stool thick-smear technique in schistosomiasis man-
soni. Rev Inst Med Trop São Paulo 14, 397-400.
Knopp S, Steinmann P, Keiser J, Utzinger J, 2012. Nematode
infections: soil-transmitted helminths and Trichinella. Infect
Dis Clin North Am 26, 341-358.
Lustigman S, Prichard RK, Gazzinelli A, Grant WN, Boatin BA,
McCarthy JS, Basáñez MG, 2012. A research agenda for
helminth diseases of humans: the problem of helminthiases.
PLoS Negl Trop Dis 6, e1582.
Nascimento SA, Moitinho MLR, 2005. Blastocystis hominis
and other intestinal parasites in a community of Pitanga city,
Paraná state, Brazil. Rev Inst Med Trop 47, 213-217.
PAHO, 2009. Elimination of neglected diseases and other
poverty-related infections. Washington DC, Pan American
Health Organization (Technical Report CD49-09).
Pedrazzani ES, Mello DA, Pripas S, Fucci M, Barbosa CAA,
Santoro MC, 1988. Intestinal helminthiasis. II. Prevalence and
correlation with income, family size, anemia and nutritional
status. Rev Saude Publica 22, 384-389 (in Portugese).
Pullan RL, Brooker SJ, 2012. The global limits and population
at risk of soil-transmitted helminth infections in 2010. Parasit
Vectors 5, 81.
Raso G, Vounatsou P, Singer BH, N’Goran EK, Tanner M,
Utzinger J, 2006. An integrated approach for risk profiling
and spatial prediction of Schistosoma mansoni-hookworm
coinfection. Proc Natl Acad Sci USA 103, 6934-6939.
Sabin Vaccine Institute, Inter-American Development Bank, Pan
American Health Organization, 2011. A call to action:
addressing soil-transmitted helminths in Latin America and
the Caribbean. Technical Report.
Schneider MC, Aguilera XP, Barbosa da Silva Junior J, Ault SK,
Najera P, Martinez J, Requejo R, Nicholls RS, Yadon Z, Silva
JC, Leanes LF, Periago MR, 2011. Elimination of neglected
diseases in Latin America and the Caribbean: a mapping of
selected diseases. PLoS Negl Trop Dis 5, e964.
Scholte RGC, Carvalho OS, Malone JB, Utzinger J, Vounatsou
P, 2012a. Spatial distribution of Biomphalaria spp., the inter-
mediate host snails of Schistosoma mansoni, in Brazil.
Geospat Health 6, S95-S101.
Scholte RGC, Freitas CC, Dutra LV, Guimarães RJ, Drummond
SC, Oliveira G, Carvalho OS, 2012b. Utilizing environmental,
socioeconomic data and GIS techniques to estimate the risk for
ascariasis and trichuriasis in Minas Gerais, Brazil. Acta Trop
121, 112-117.
Schur N, Gosoniu L, Raso G, Utzinger J, Vounatsou P, 2011b.
Modelling the geographical distribution of co-infection risk
from single-disease surveys. Stat Med 30, 1761-1776.
Schur N, Hürlimann E, Garba A, Traoré MS, Ndir O, Ratard
RC, Tchuem Tchuenté LA, Kristensen TK, Utzinger J,
Vounatsou P, 2011a. Geostatistical model-based estimates of
schistosomiasis prevalence among individuals aged ≤20 years
in West Africa. PLoS Negl Trop Dis 5, e1194.
Speich B, Knopp S, Mohammed KA, Khamis IS, Rinaldi L,
Cringoli G, Rollinson D, Utzinger J, 2010. Comparative cost
assessment of the Kato-Katz and FLOTAC techniques for soil-
transmitted helminth diagnosis in epidemiological surveys.
Parasit Vectors 3, 71.
Steinmann P, Zhou XN, Matthys B, Li YL, Li HJ, Chen SR,
Yang Z, Fan W, Jia TW, Vounatsou P, Utzinger J, 2007. Spatial
risk profiling of Schistosoma japonicum in Eryuan county,
Yunnan province, China. Geospat Health 2, 59-73.
Tchuem Tchuenté LA, 2011. Control of soil-transmitted
helminths in sub-Saharan Africa: diagnosis, drug efficacy con-
cerns and challenges. Acta Trop 120, S4-S11.
Utzinger J, Raso G, Brooker S, de Savigny D, Tanner M,
Ørnbjerg N, Singer BH, N’Goran EK, 2009. Schistosomiasis
and neglected tropical diseases: towards integrated and sus-
tainable control and a word of caution. Parasitology 136,
1859-1874.
WHO, 2002. Prevention and control of schistosomiasis and
soil-transmitted helminthiasis: report of a WHO expert com-
mittee. WHO Tech Rep Ser 912, 1-57.
WHO, 2006. Preventive chemotherapy in human helminthiasis:
coordinated use of anthelminthic drugs in control interven-
tions: a manual for health professionals and programme man-
agers. Geneva: World Health Organization, 1-62.
Ziegelbauer K, Speich B, Mäusezahl D, Bos R, Keiser J, Utzinger
J, 2012. Effect of sanitation on soil-transmitted helminth
infection: systematic review and meta-analysis. PLoS Med 9,
e1001162.

R.G.C. Scholte et al. - Geospatial Health 8(1), 2013, pp. 97-110
Σi=1
k
MAE = min I(cli,l < pi,l), I(c
ui,l < pi,l)k
1
Σi=1
k
MAE = |pi,l - p̂i,l|.k1
( ).
Appendix
Geostatistical model
Let Yi,l be the number of observed infections withdisease l (l = 1, A. lumbricoides; l = 2, T. trichiura; andl = 3, hookworm infection) at location si (i = 1, ..., n)of the study region A⊂R2 and let Ni be the total num-ber of tested individuals for each helminth infection.We assume that Yi,l are binomially distributed, that isYi,l ∼ Bin(pi,l, Ni) where pi,l is the probability that aninfection with helminth species l is detected at site si.We model the influence of the associated set of m envi-ronmental and socioeconomic covariates Xi,l = (1, Xi1,l,..., Xim,l)
T of the infection on the logit, such as logit(pi,l)= XT
i,l βl + vi,l + wi,l, with the vector of regression coef-ficients βl = (β0,l, β1,l, ...,βm,l)
T location-specific randomeffect parameters vi,l and exchangeable random effectparameters wi,l. Unobserved spatial variation is intro-duced on vi,l by assuming that vl = (v1,l, ..., vn,l)
T followsa latent stationary Gaussian process over the studyregion with vl ∼ MVN(0, Σl)
T. The elements of the vari-ance-covariance matrix Σl are related to an isotropicexponential correlation function defined by Σij,l = σ2
l
exp(-ρl dij) with spatial variance σ2l, spatial decay ρl and
the Euclidean distance dij between any pair of loca-tions si and sj. The distance at which spatial correla-tion between locations drops below 5% is known asspatial range and can be calculated by 3/ρ if exponen-tial correlation functions are employed. We furtherassume that wi,l ∼ N(0, τ2
l ) with variance τ2l that can be
interpreted as nugget of the spatial process.
Prior specifications and implementation details
Bayesian model formulation requires the specifica-tion of prior distributions of all model parameters. Inthis study, we adopted non-informative Normal andGamma prior distributions with mean 0 and varianceof 100 for the regression coefficients βl and for thevariance parameters σ2
l and τ2l , respectively.
Furthermore, uniform prior distributions with mini-mum bounds of 30 m and maximum bounds of 3,000km were chosen for ρl (the range of distances betweenthe survey locations varies from 15 m to almost 3,000km, with a median of about 800 km).
Models were fitted in WinBUGS 1.4.3 (ImperialCollege London and Medical Research Council;London, UK) using MCMC simulation. Models wererun for two chains with a thinning of 10 and a burn-in of 1,000 iterations. Starting values for the chainswere based on non-spatial model estimates and semi-
variogram estimates for the spatial model parameters.Convergence was assessed by inspection of ergodicaverages of selected model parameters. After conver-gence, samples of 500 iterations were extracted foreach parameter and each soil-transmitted helminthspecies.
Samples from the predictive posterior distribution ateach prediction locations were obtained via Bayesiankriging. Kriging was performed in Fortran 95 (DigitalEquipment Corporation; Maynard, MA, USA) basedon code written by the authors and the samplesobtained from model fit. The results were summarisedbased on the median and the SD of the prediction.
Variable selection
Gibbs variable selection was employed on non-spa-tial logistic regression models to select parsimonioussets of the environmental and socioeconomic covari-ates for each soil-transmitted helminth infection(George and McCulloch, 1993). A vector of indicatorvariables I = (I0,l, I1,l, ..., Im,l)
T was linked to the vectorof regression coefficients in the models, such as XT
i,l βl,Il to specify between inclusion and exclusion of thecovariates where Ik = 1 if the k-th covariate is includ-ed and zero otherwise. Priors for the joint distributionof βk,l and Ik,l are defined by P(βk,l | Ik,l) = P(βk,l | Ik,l)P(Ik,l)in the Gibbs variable selection approach. Furthermore,P(βk | Ik) is given by Ik,l N(0, τ2
I=1,l) + (1 - Ik,l) N(0,τ2I=0,l).
In this study, we adopted non-informative Bernoulliprior distributions with probability of 0.5 for P(Ik,l)and set the inclusion and exclusion variances to τ2
I=1 =100 and τ2
I=0 = 0.01, respectively.
Model validation
Model validation was performed to obtain estimatesof the accuracy of predictive ability of the geostatisti-cal models for each infection. The MAE providesinformation about the absolute distances between theobserved pi,l and median predicted outcome p̂i,l at thei-th test locations (i = 1, ..., k), such as
The outcome of the BCI approach is the proportionof test locations correctly predicted within the 95%BCIs of the posterior predictive distribution (restrictedby the lower percentiles cl
i,l and upper percentiles cui,l),
110


