Spanish Wind Energy Technology Platform th General ... Hjuler_UpWind presentation... · Technical...
91
Peter Hjuler Jensen RISØ DTU Technical University of Denmark Spanish Wind Energy Technology Platform 6 th General Assembly 30.November 2011
Transcript of Spanish Wind Energy Technology Platform th General ... Hjuler_UpWind presentation... · Technical...

Peter Hjuler Jensen RISØ DTU
Technical University of Denmark
Spanish Wind Energy Technology Platform 6th General Assembly
30.November 2011
Outline
1. Background for UpWind
2. Presentation of the UpWind Project
3. General conclusions and results
4. Work and results in the 15 working groups
5. Today global status
6. Questions

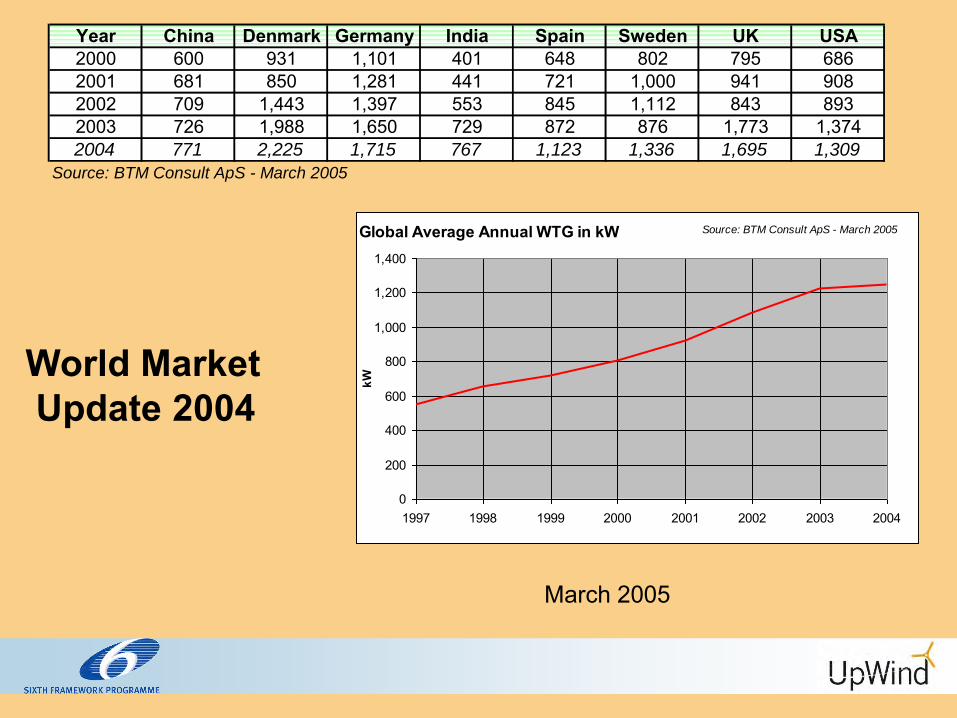
World Market Update 2004 March 2005
Installed Wind Power in the World- Annual and Cumulative -
0
1,000
2,000
3,000
4,000
5,000
6,000
7,000
8,000
9,000
1983 1990 1995 2000 2004
Year
MW
per
yea
r
0
5,000
10,000
15,000
20,000
25,000
30,000
35,000
40,000
45,000
50,000
Cum
ulat
ive
MW
Source: BTM Consult ApS - March 2005
World Market Update 2004
March 2005
Average size WTG (kW) installed each year Year China Denmark Germany India Spain Sweden UK USA2000 600 931 1,101 401 648 802 795 6862001 681 850 1,281 441 721 1,000 941 9082002 709 1,443 1,397 553 845 1,112 843 8932003 726 1,988 1,650 729 872 876 1,773 1,3742004 771 2,225 1,715 767 1,123 1,336 1,695 1,309
Source: BTM Consult ApS - March 2005
Global Average Annual WTG in kW
0
200
400
600
800
1,000
1,200
1,400
1997 1998 1999 2000 2001 2002 2003 2004
kW
Source: BTM Consult ApS - March 2005
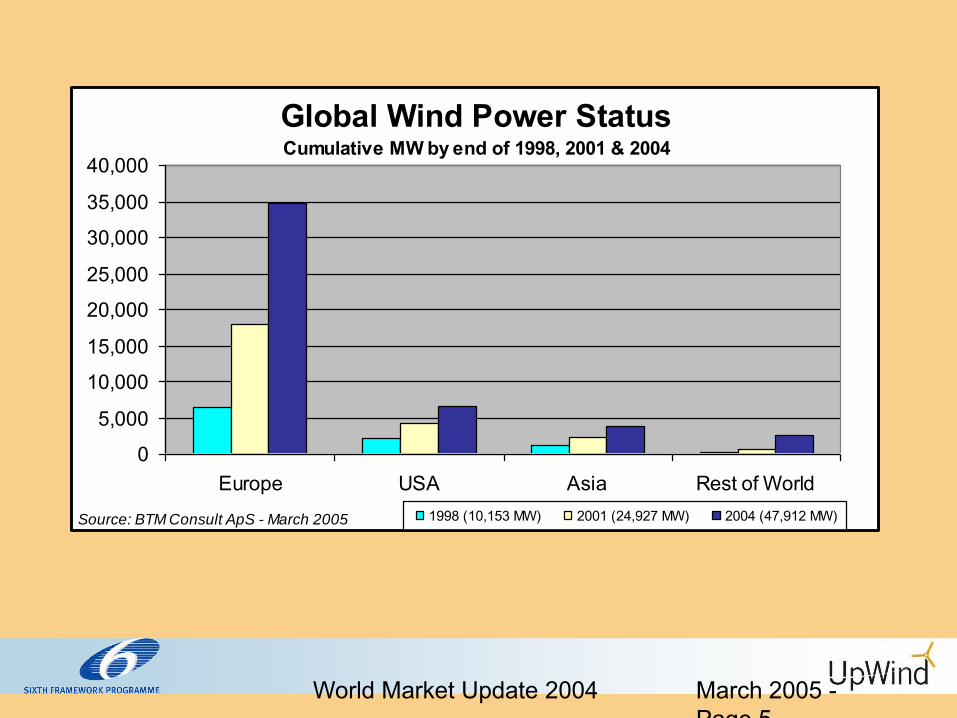
World Market Update 2004 March 2005 - Page 5
Global Wind Power StatusCumulative MW by end of 1998, 2001 & 2004
0
5,000
10,000
15,000
20,000
25,000
30,000
35,000
40,000
Europe USA Asia Rest of World1998 (10,153 MW) 2001 (24,927 MW) 2004 (47,912 MW)Source: BTM Consult ApS - March 2005
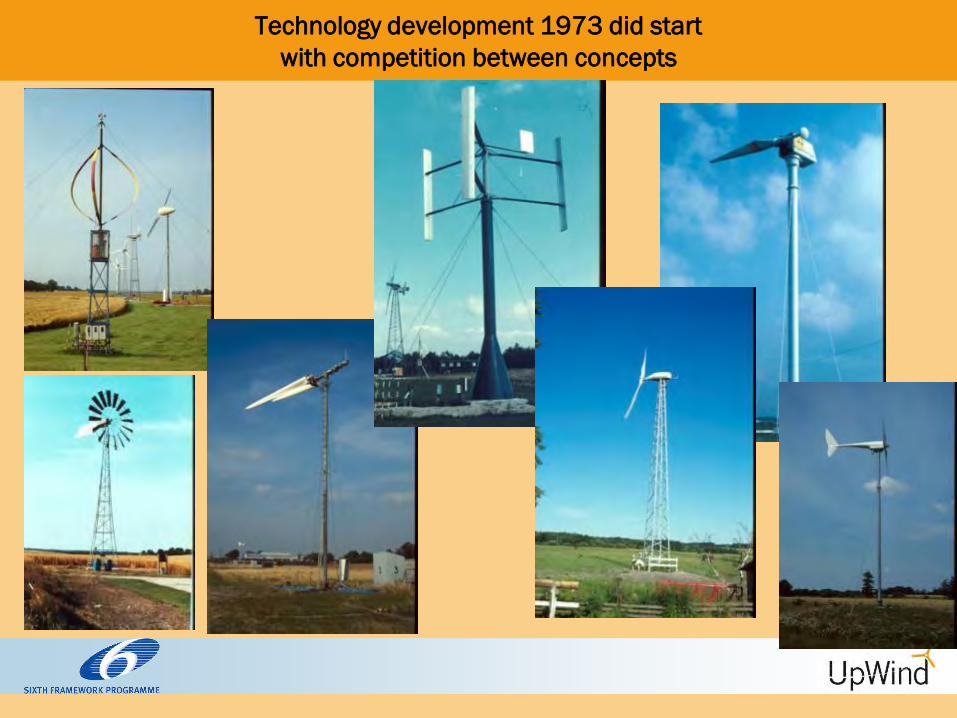
Technology development 1973 did start
with competition between concepts

A temporary winner around 1990
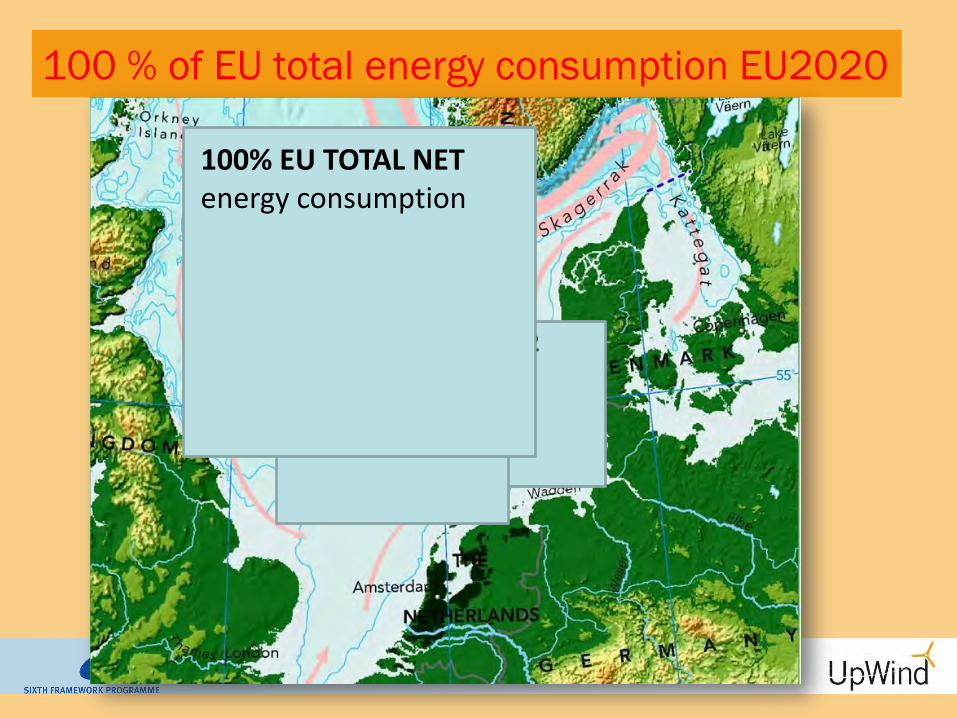
100 % of EU total energy consumption EU2020
20% EU2 Electric
50% EU27 Electric
100% EU TOTAL NET energy consumption

How deep is the NorthSee?
50-100m
25-50m

Super-grid in the North See
Repower
Jos Beurskens
Jos Beurskens
????
2008
Repower
Jos Beurskens
Jos Beurskens
??????
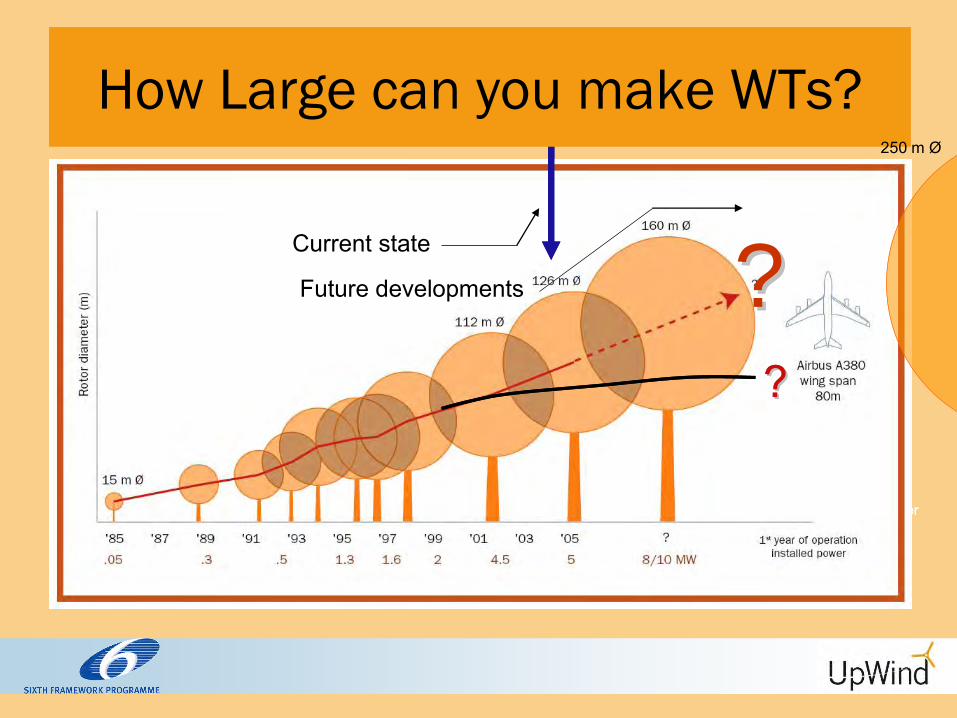
20082008How Large can you make WTs? 250 m Ø
Current state
Future developments
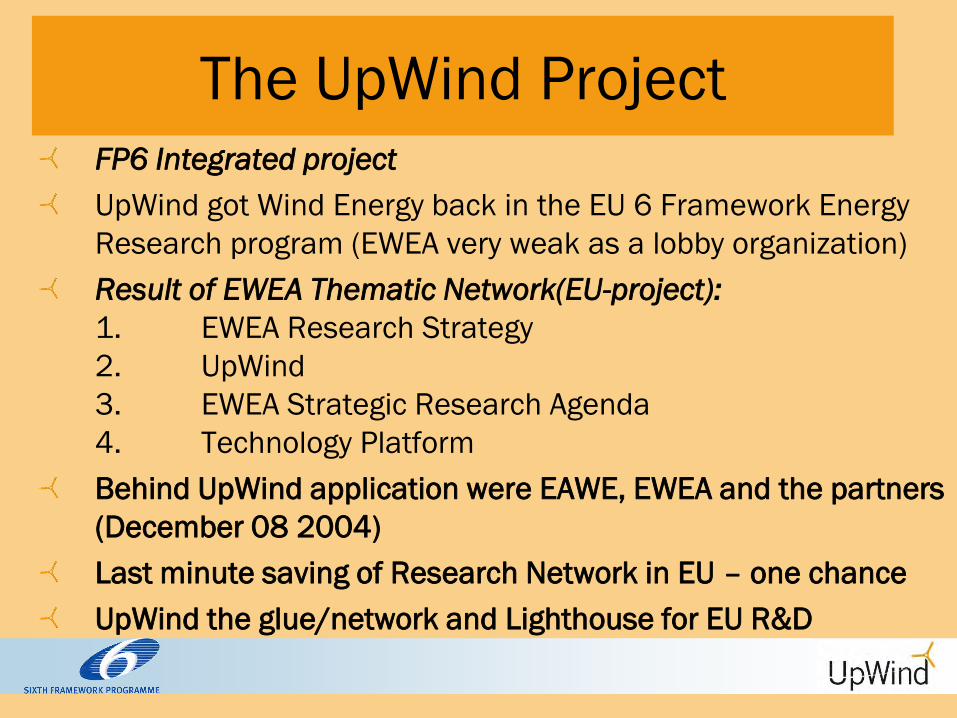
The UpWind Project
FP6 Integrated project
UpWind got Wind Energy back in the EU 6 Framework Energy
Research program (EWEA very weak as a lobby organization)
Result of EWEA Thematic Network(EU-project):
1. EWEA Research Strategy
2. UpWind
3. EWEA Strategic Research Agenda
4. Technology Platform
Behind UpWind application were EAWE, EWEA and the partners
(December 08 2004)
Last minute saving of Research Network in EU – one chance
UpWind the glue/network and Lighthouse for EU R&D
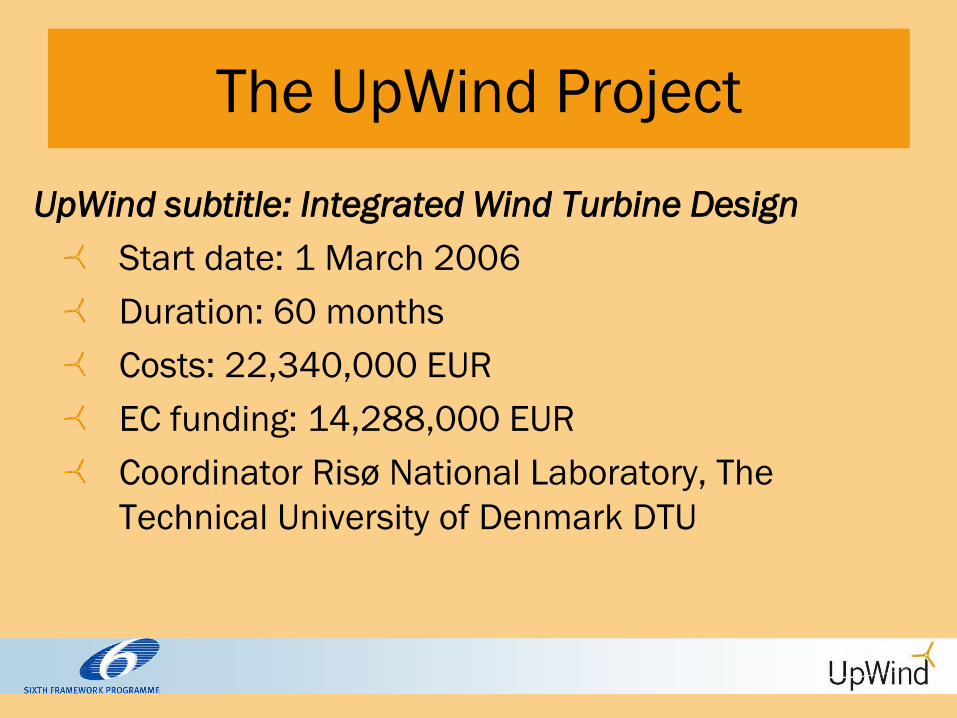
The UpWind Project
UpWind subtitle: Integrated Wind Turbine Design
Start date: 1 March 2006
Duration: 60 months
Costs: 22,340,000 EUR
EC funding: 14,288,000 EUR
Coordinator Risø National Laboratory, The
Technical University of Denmark DTU
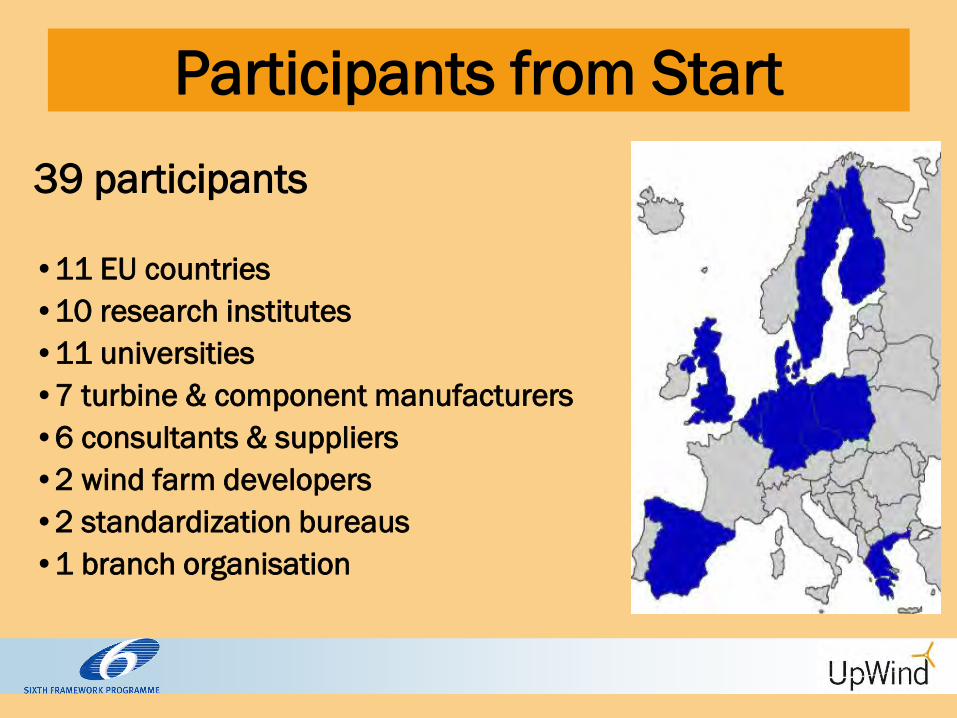
Participants from Start
39 participants
•11 EU countries
•10 research institutes
•11 universities
•7 turbine & component manufacturers
•6 consultants & suppliers
•2 wind farm developers
•2 standardization bureaus
•1 branch organisation
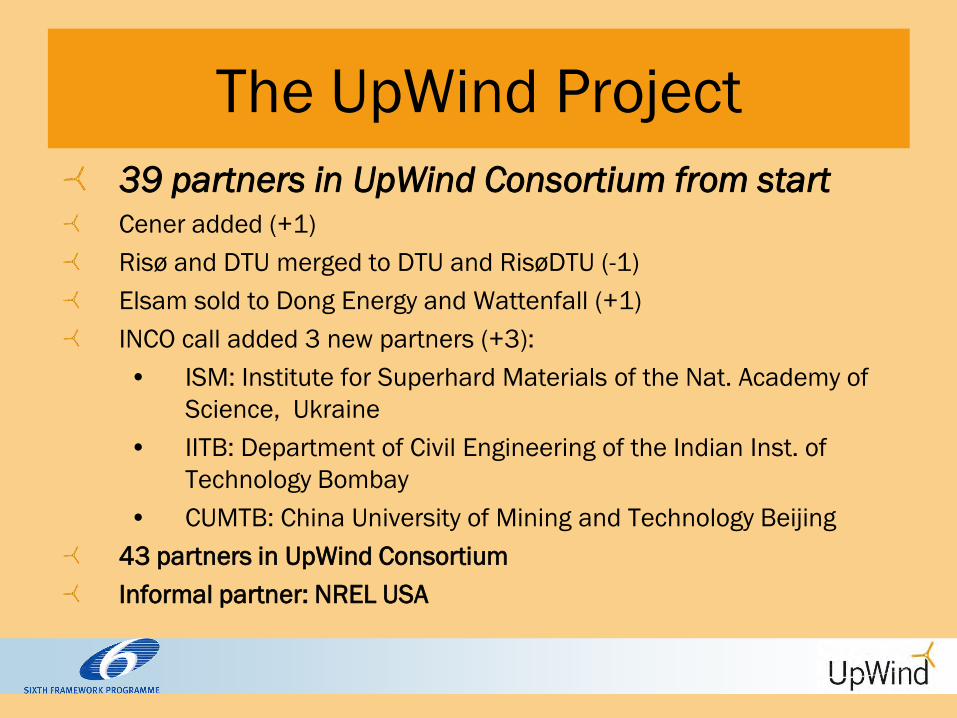
The UpWind Project
39 partners in UpWind Consortium from start Cener added (+1)
Risø and DTU merged to DTU and RisøDTU (-1)
Elsam sold to Dong Energy and Wattenfall (+1)
INCO call added 3 new partners (+3):
• ISM: Institute for Superhard Materials of the Nat. Academy of
Science, Ukraine
• IITB: Department of Civil Engineering of the Indian Inst. of
Technology Bombay
• CUMTB: China University of Mining and Technology Beijing
43 partners in UpWind Consortium
Informal partner: NREL USA
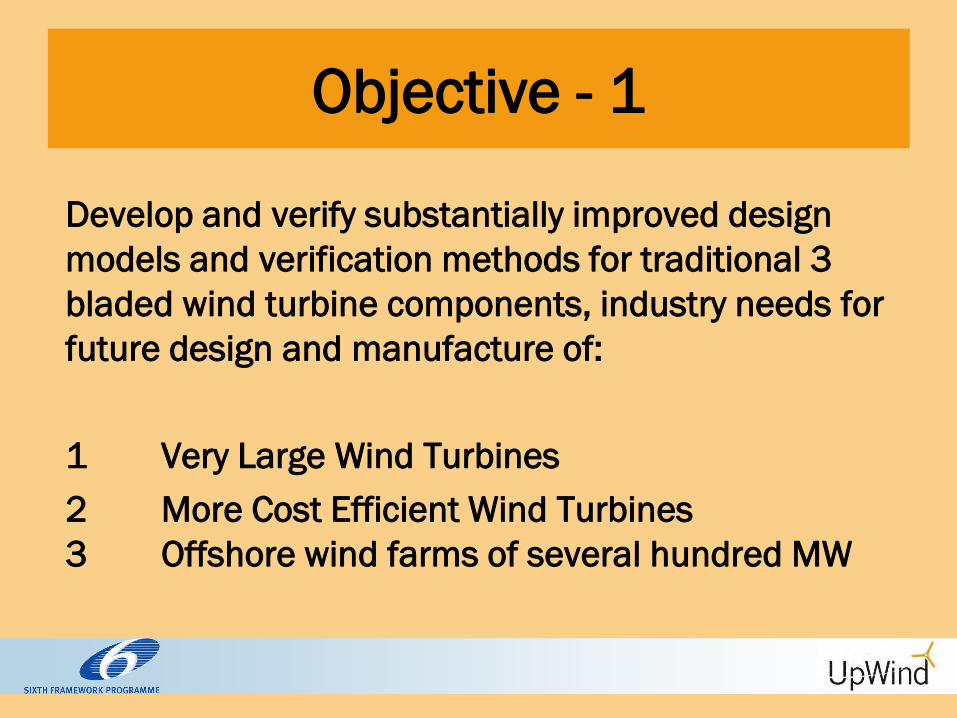
Objective - 1
Develop and verify substantially improved design
models and verification methods for traditional 3
bladed wind turbine components, industry needs for
future design and manufacture of:
1 Very Large Wind Turbines
2 More Cost Efficient Wind Turbines
3 Offshore wind farms of several hundred MW
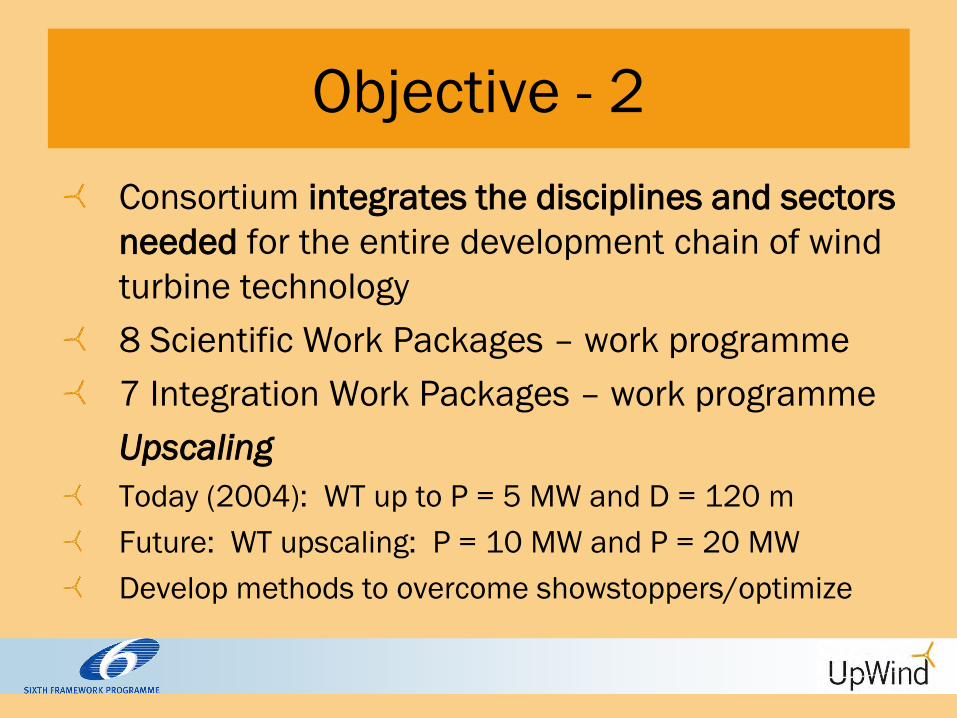
Objective - 2
Consortium integrates the disciplines and sectors
needed for the entire development chain of wind
turbine technology
8 Scientific Work Packages – work programme
7 Integration Work Packages – work programme
Upscaling
Today (2004): WT up to P = 5 MW and D = 120 m
Future: WT upscaling: P = 10 MW and P = 20 MW
Develop methods to overcome showstoppers/optimize
Overall results answering the
fundamental question?
Is a 20 MW wind turbine possible
to build and is it feasible?

UpWind develop cost functions for
offshore wind turbines over project
• Rotor (blades, hub)
• Drivetrain (main shaft, gear, generator,
converter etc.)
• Nacelle (bed plate, yawing system etc.)
• Tower and foundation
• Grid connection system
• Control and sensor systems
• Condition monitoring system
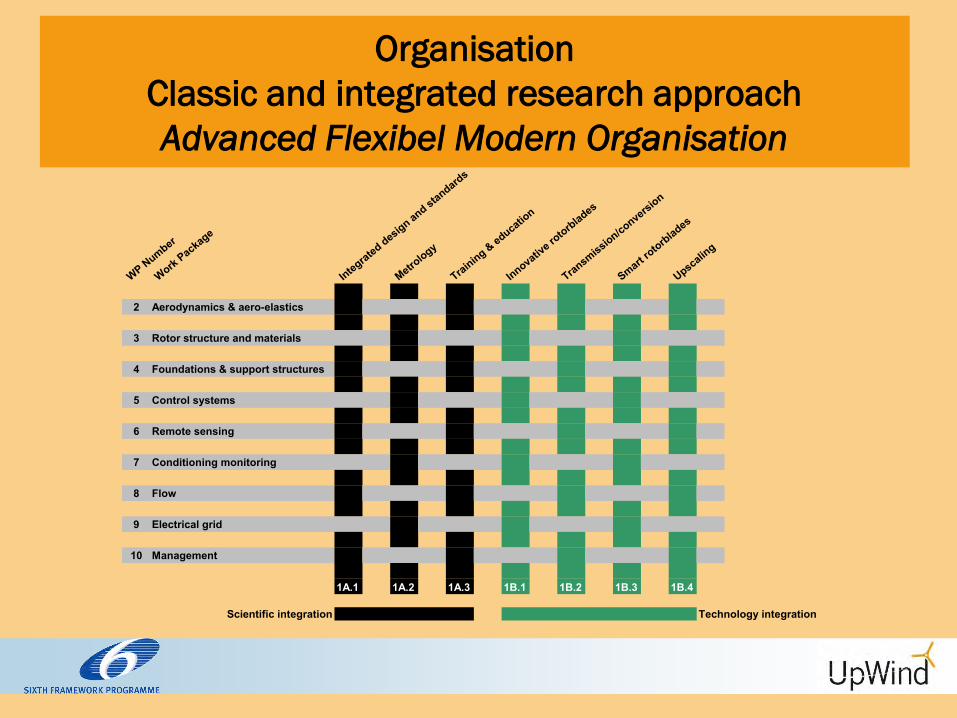
Organisation
Classic and integrated research approach
Advanced Flexibel Modern Organisation
WP Number
Work Package
Integrated design and standards
Metrology
Training & education
Innovative ro
torblades
Transmission/conversion
Smart rotorblades
Upscaling
2 Aerodynamics & aero-elastics
3 Rotor structure and materials
4 Foundations & support structures
5 Control systems
6 Remote sensing
7 Conditioning monitoring
8 Flow
9 Electrical grid
10 Management
1A.1 1A.2 1A.3 1B.1 1B.2 1B.3 1B.4
Scientific integration Technology integration

Overall result from cost functions
Levelised cost increases with
scale
Reasons:
Rotor and nacelle costs
scale ~s3 (?)
Spare parts costs follow
Cost of energy over lifetime
increase more than 20 % for
increasing the Wind Turbine size
from 5 to 20 MW so the power
law for the rotor
Up scaling – levelised cost
0%
20%
40%
60%
80%
100%
120%
140%
5 MW 10 MW 20 MW
1,00 1,41 2,00
scale
leve
lised
cos
t
O&M: retrofit
O&M; spare parts
O&M; equip
O&M; crews
Installation; electric infrastructure,transmissionInstallation; electric infrastructure,collectionInstallation; wind turbine includingfoundationHardware; electric infrastructure
Hardware; tower and foundation
Hardware; rotor nacelle assembly

Warsaw, April 21, 2010
Economical viability of 20MW
W/Ts Case study: Blades
PAST FUTUREGl-P HLU Gl-P RI Gl-Ep RI Gl-Ep Prep Gl-C Hybrid 1 Gl-C Hybrid 2 New Tech 1 New Tech 2 New Tech 3
Single Step r(t)/r(t-1) 1,00 0,59 0,79 0,93 0,86 0,87 0,93 0,93 0,93Cummulative r(t) 1,00 0,59 0,47 0,44 0,38 0,33 0,31 0,28 0,26
Single Step a(t)/a(t-1) 1,00 1,08 1,08 1,10 1,10 1,00 1,03 1,03 1,03Cummulative a(t)/a(t0) 1,00 1,08 1,17 1,28 1,41 1,41 1,45 1,50 1,54
WT Power (MW) Rotor Radius (m) Mass (tn) Mass (tn) Mass (tn) Mass (tn) Mass (tn) Mass (tn) Mass (tn) Mass (tn) Mass (tn)
0,125 10 0,25 0,15 0,12 0,11 0,09 0,08 0,08 0,07 0,070,281 15 0,85 0,50 0,40 0,37 0,32 0,28 0,26 0,24 0,220,500 20 2,00 1,19 0,94 0,88 0,76 0,66 0,61 0,57 0,530,781 25 3,91 2,33 1,84 1,71 1,48 1,28 1,19 1,11 1,031,125 30 6,76 4,02 3,17 2,96 2,55 2,22 2,06 1,92 1,781,531 35 10,74 6,39 5,04 4,70 4,05 3,52 3,28 3,05 2,832,000 40 16,02 9,53 7,52 7,01 6,04 5,26 4,89 4,55 4,232,531 45 22,82 13,57 10,71 9,99 8,60 7,49 6,96 6,48 6,023,125 50 31,30 18,62 14,70 13,70 11,80 10,27 9,55 8,88 8,263,781 55 41,66 24,78 19,56 18,23 15,71 13,67 12,71 11,82 11,004,500 60 54,08 32,17 25,40 23,67 20,39 17,75 16,51 15,35 14,285,281 65 68,76 40,90 32,29 30,09 25,93 22,57 20,99 19,52 18,156,125 70 51,09 40,33 37,58 32,38 28,19 26,21 24,38 22,677,031 75 62,84 49,60 46,23 39,83 34,67 32,24 29,98 27,898,000 80 76,26 60,20 56,10 48,34 42,07 39,13 36,39 33,849,031 85 72,20 67,29 57,98 50,47 46,93 43,65 40,59
10,125 90 79,88 68,82 59,91 55,71 51,81 48,1911,281 95 93,95 80,94 70,45 65,52 60,94 56,6712,500 100 94,40 82,18 76,42 71,07 66,1013,781 105 109,29 95,13 88,47 82,28 76,5215,125 110 125,65 109,38 101,72 94,60 87,9816,531 115 124,98 116,23 108,09 100,5318,000 120 142,00 132,06 122,81 114,2219,531 125 160,50 149,26 138,81 129,1021,125 130 180,54 167,90 156,15 145,22
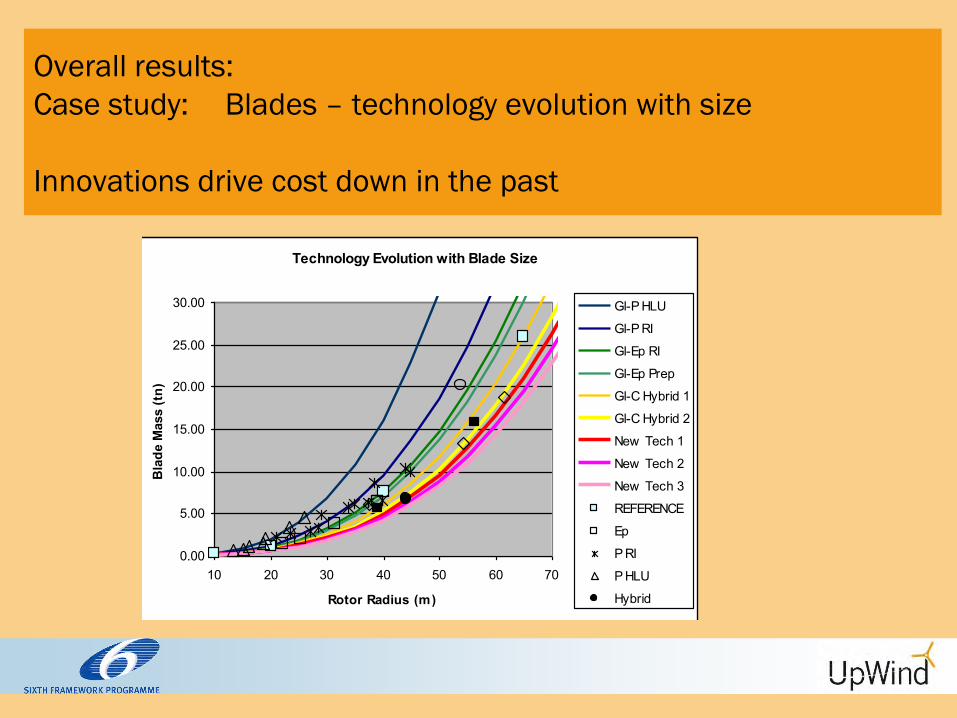
Overall results:
Case study: Blades – technology evolution with size
Innovations drive cost down in the past
Technology Evolution with Blade Size
0.00
5.00
10.00
15.00
20.00
25.00
30.00
10 20 30 40 50 60 70
Rotor Radius (m)
Bla
de M
ass
(tn)
Gl-P HLU
Gl-P RI
Gl-Ep RI
Gl-Ep Prep
Gl-C Hybrid 1
Gl-C Hybrid 2
New Tech 1
New Tech 2
New Tech 3
REFERENCE
Ep
P RI
P HLU
Hybrid
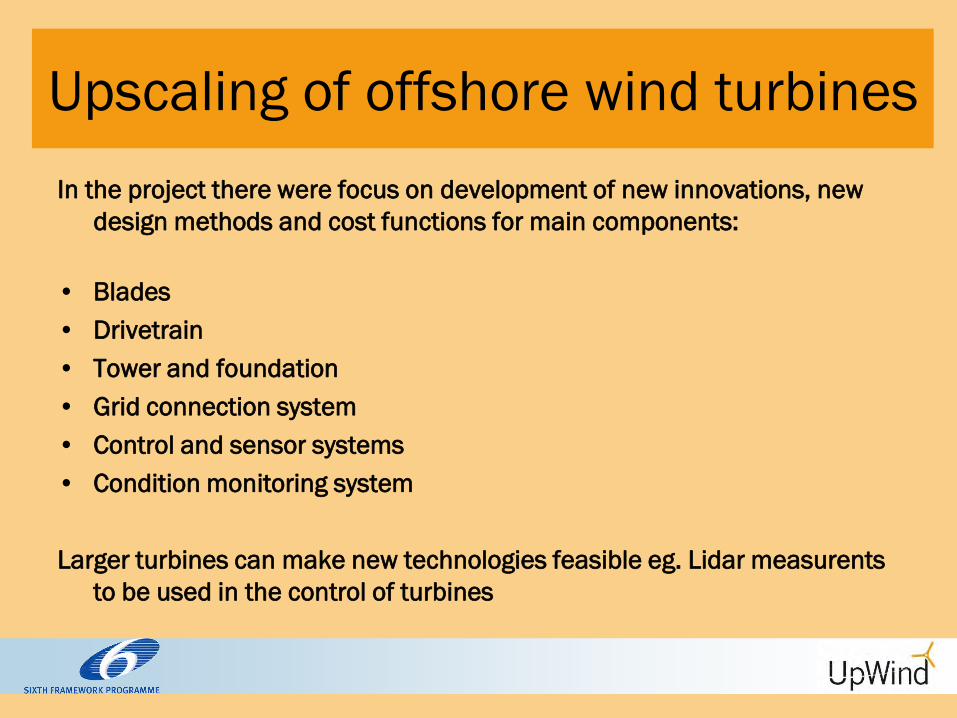
Upscaling of offshore wind turbines
In the project there were focus on development of new innovations, new
design methods and cost functions for main components:
• Blades
• Drivetrain
• Tower and foundation
• Grid connection system
• Control and sensor systems
• Condition monitoring system
Larger turbines can make new technologies feasible eg. Lidar measurents
to be used in the control of turbines

Improvements in Wind Turbine
Design Rotor
Aerodynamic design
Increased tip speed
Different blade shapes
• Thicker sections
• Blunt TE sections
• Multi-element airfoils
80 ~100m/s
Drawing on concepts from aeronautics industry
Large Wind Turbines in the future
The details of the future design may be uncertain
However it is obvious that…
• Up scaling existing designs will not be enough
• Integrated design for large scale should be pursued
• New ideas and technological breakthroughs will be
necessary to make very large wind turbines
economically attractive
It is certain therefore that substantial R&D and industrial
effort is still needed to conquer all technical barriers!

Warsaw, April 21, 2010
Feasibility of 20MW wind turbines
The answers from available technical expertise and
UPWIND project experience:
Manufacturing is possible
Transportation and installation are possible
BUT…
…this does not mean that a 20MW version of a
current state-of-the-art 5MW W/T will offer any
cost/performance advantages

Presentation of some of the results from the working
groups
WP Number
Work Package
Integrated design and standards
Metrology
Training & education
Innovative ro
torblades
Transmission/conversion
Smart rotorblades
Upscaling
2 Aerodynamics & aero-elastics
3 Rotor structure and materials
4 Foundations & support structures
5 Control systems
6 Remote sensing
7 Conditioning monitoring
8 Flow
9 Electrical grid
10 Management
1A.1 1A.2 1A.3 1B.1 1B.2 1B.3 1B.4
Scientific integration Technology integration

Integration – and priorities
Teamwork in UpWind

1.A.1 Integrated design and standards
Development of integral design approach methodology
Development of (pre)standards for application of the integral
design approach
Coordinate and support pre-standardisation work
Develop cost models for application in other WP for comparisons and for demonstration of potentials and benefits of design developments Evaluate pros and cons of different design options by calculation of cost of energy Define the technological bottlenecks for successful up-scaling of wind turbines to 20MW
1A2 Metrology
• The scale of UpWind made it possible to make a metrology
work package covering very broad
• Identify the relevant measurands, the needed accuracies,
influence parameters, traceability, accuracy and
technically achievable accuracy (D1A2.1)
• For each identified problem in the list, different ways-out
are proposed (D1A2.2)
• Successful measurement protocols for solution methods
are described and demonstrated and will serve as
recommended future testing methods. (D1A2.3)
1.A.3 Education and training
Development of a number of training modules for international “new” courses in the field of WE and of the necessary supporting education/training materials.
(in other words) Provision of the necessary infrastructure for the specialized training of:
researchers, post-graduate students → PhD level,
industrial engineers (working in SMEs), energy planners, project developers, consultants.. → CPD units,
- on the state-of-art knowledge and expertise produced lately in all Wind Power related topics,
- especially on the results/outputs of the other WPs of the UpWind project.

WP1B1 Innovative Rotor Blade: Segmented blade
Task WP1B1.1 Aerodynamic Design and Loads Calculation
Task WP1B1.2 Materials Selection, Structural Design and
Structural Verification
Task WP1B1.3 Sensors and Monitoring Technologies
Task WP1B1.4 Blade Joints Design
Task WP1B1.5 Sub-component Testing
Task WP1B1.6 Manufacturing and Assembly Processes
Task WP1B1.7 Specimen Prototypes Manufacturing
Task WP1B1.8 Specimen Testing
Elements to build the blade were developed and Gamesa has now a segmented
blade

WP1B1 Innovative Rotor Blade: Work Package Task #4 (in progress)
TASK WP1B1.4 BLADE JOINTS DESIGN
PARTICIPANTS: GAMESA
DEFINITION OF MODULAR BLADE JOINTS DESIGN REQUIREMENTS:
1- Functional Requirements • Loads
• Aerodynamic Requirements
• Structural Integrity
• Mass and Stiffness Distribution Limits
• Dynamic Requirements
• Weight
2- Material Requirements
3- Supportability Requirements • Assembly on Site & Interchangeability
• Reliability
• Mainteinability
• Fail Safe
4- Validation and Certification
5- Secondary Systems
• Drainage System
• Lightning System
6- Manufacturing
• Assembly in Factory
• Tolerance
• Toolings
• Materials

Subcomponent Tests
Test #3: Adhesive Joint Test at WMC

1B2 Transmission and conversion
WP 1B2.a – “Mechanical Transmission”
WP 1B2.b – “Generators”
WP 1B2.c – “Power Electronics”

Mechanical Transmission
Modeling example
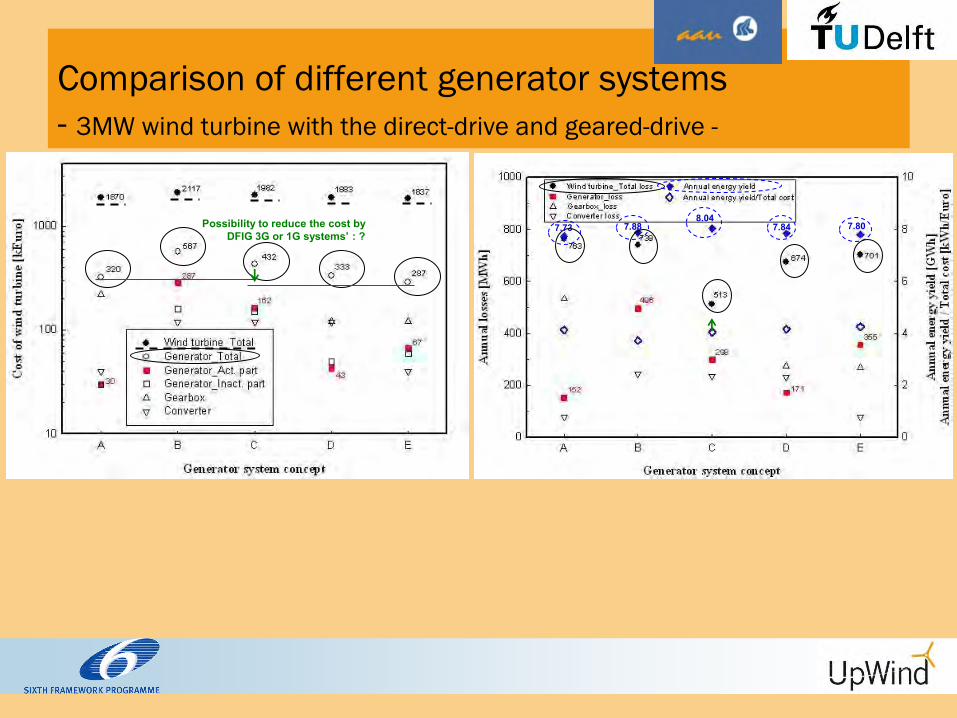
Possibility to reduce the cost by DFIG 3G or 1G systems’ : ?
Comparison of different generator systems
- 3MW wind turbine with the direct-drive and geared-drive -
7.73 7.88 8.04
7.84 7.80
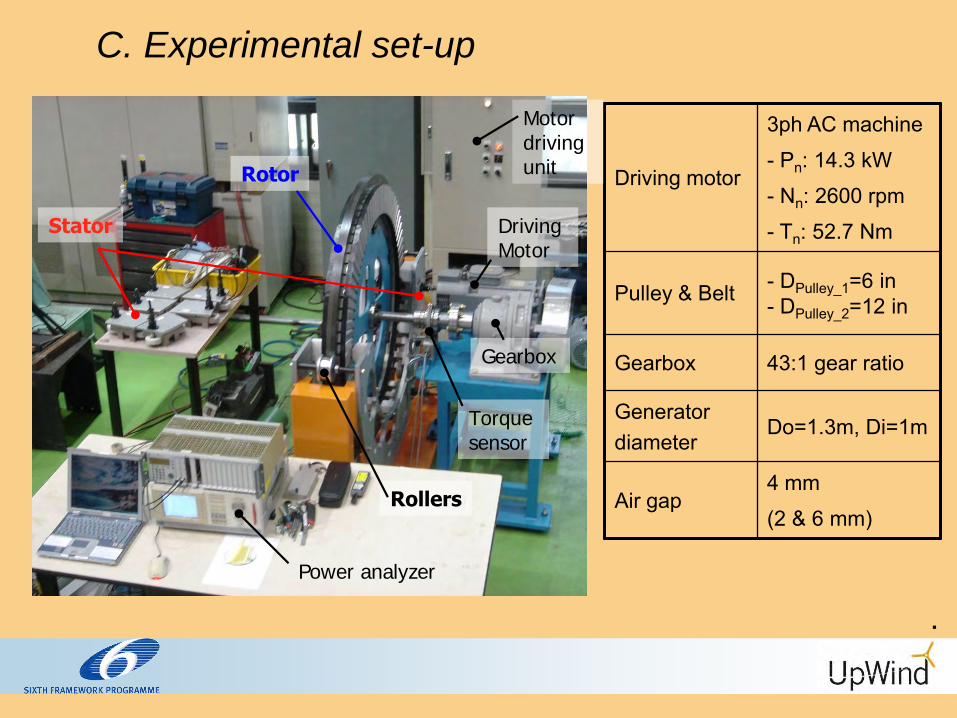
Driving motor
3ph AC machine
- Pn: 14.3 kW
- Nn: 2600 rpm
- Tn: 52.7 Nm
Pulley & Belt - DPulley_1=6 in - DPulley_2=12 in
Gearbox 43:1 gear ratio
Generator diameter
Do=1.3m, Di=1m
Air gap 4 mm
(2 & 6 mm)
Power analyzer
Torque sensor
Rotor
Stator
Rollers
Gearbox
Driving Motor
Motor driving unit
Power analyzer
Torque sensor
Rotor
Stator
Rollers
Gearbox
Driving Motor
Motor driving unit
C. Experimental set-up
.
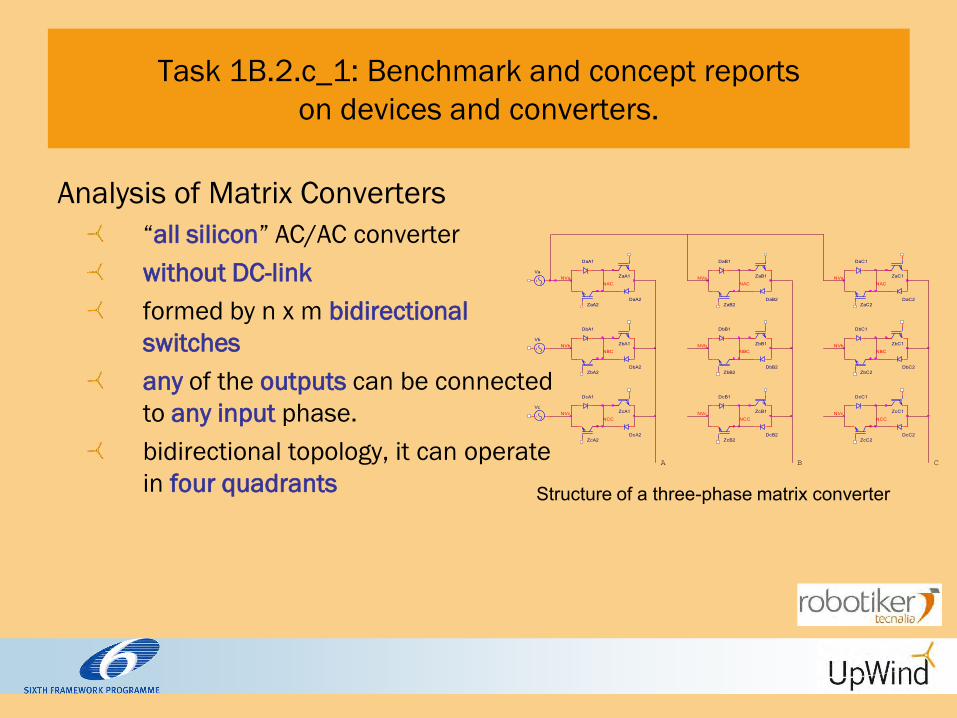
Task 1B.2.c_1: Benchmark and concept reports
on devices and converters.
Analysis of Matrix Converters
“all silicon” AC/AC converter
without DC-link
formed by n x m bidirectional
switches
any of the outputs can be connected
to any input phase.
bidirectional topology, it can operate
in four quadrants
NVb
DaC1
NBCNVb
Vc
ZbA2
NCC
NBC
DaA2
B
DaB2
ZaB1
DcB1
DbC2
NAC
ZaC1
NVc NVc
NAC
C
NVa
DbB2
ZbA1
DaC2
DbC1
ZbB2
ZcC1
DcB2
DcC1
ZcB1NVcNCC
NAC
ZcC2
ZcA1
NVb
DcA2
ZbB1
ZaA2
ZcB2
ZaA1Va
DbA2
ZaC2
NVa
ZcA2
NCC
ZaB2
ZbC2
DbB1
NBC
DaB1
DcC2
Vb
DcA1
DbA1
A
NVa
DaA1
ZbC1
Structure of a three-phase matrix converter

1.B.3 Smart Rotor blades
Aerodynamic devices Test of several actuators at
same flow conditions
in LM wind tunnel:
Model: DU-96W180
Flap
Microtabs
Provide loads data base for
aerodynamics model validation
Setup definition
(Apr 2010)
Building setup
(Aug 2010)
Wind tunnel experiments (Oct 2010)
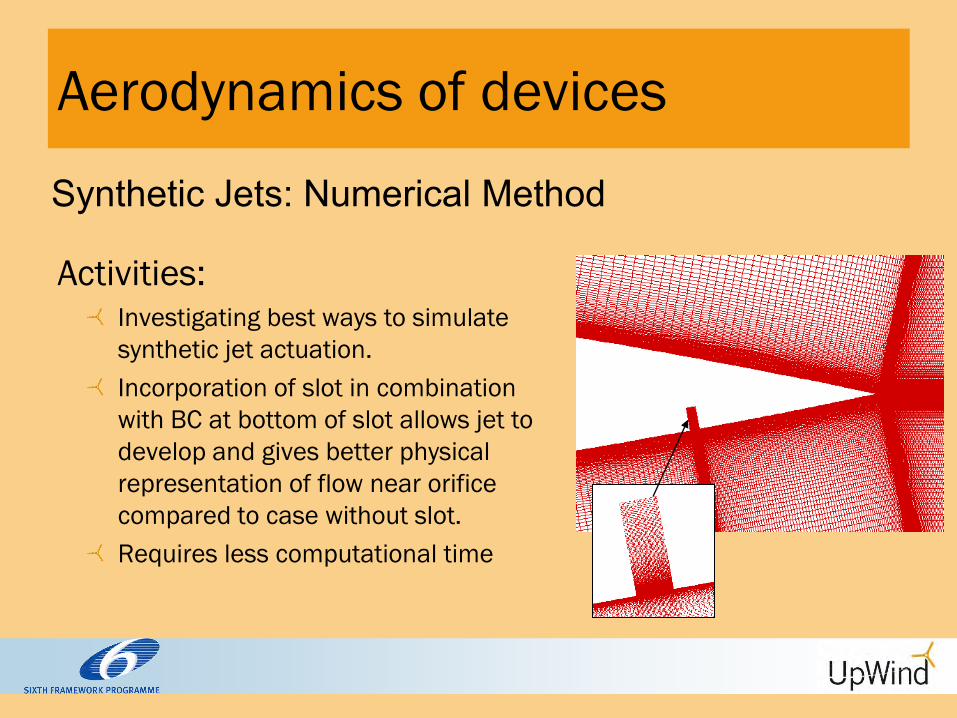
Aerodynamics of devices
Activities: Investigating best ways to simulate
synthetic jet actuation.
Incorporation of slot in combination
with BC at bottom of slot allows jet to
develop and gives better physical
representation of flow near orifice
compared to case without slot.
Requires less computational time
Synthetic Jets: Numerical Method
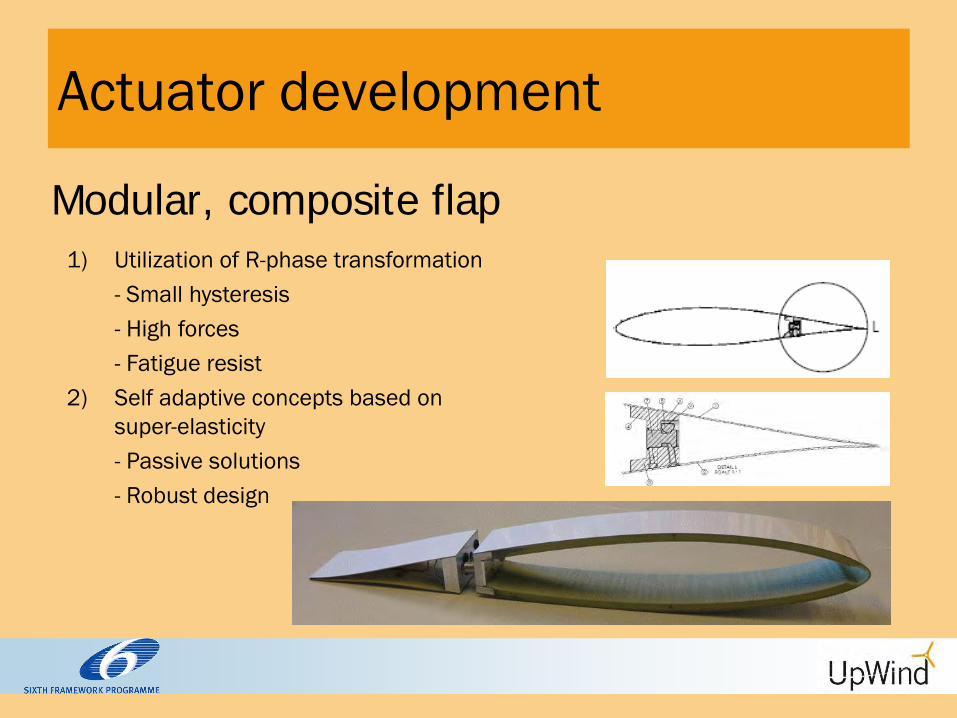
Modular, composite flap
Actuator development
1) Utilization of R-phase transformation
- Small hysteresis
- High forces
- Fatigue resist
2) Self adaptive concepts based on
super-elasticity
- Passive solutions
- Robust design

Summary
Wide range of activities: Topics: Aerodynamics, control, structures&materials
Levels: Experimental, modelling, feasibility studies, design
Results: Load control concepts:
Proven ~50% reduction of signal standard deviation on a scaled rotor
Cust load alleviation through „smart‟ interfaces
Bent-twist coupling: after the potential of coupling, now the potential of achieving coupling at different stages
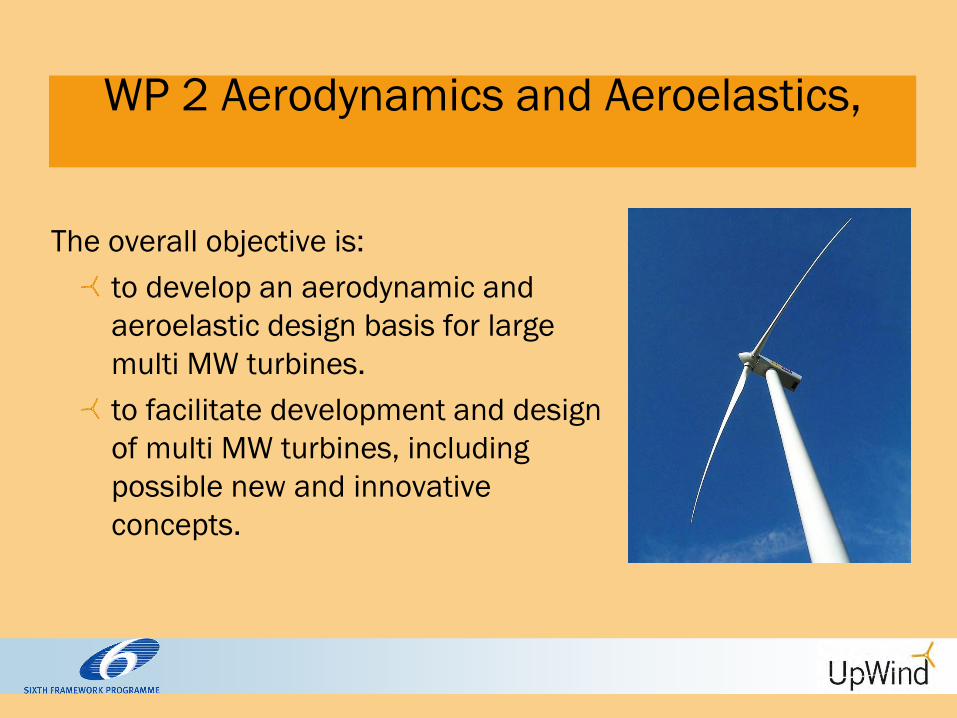
WP 2 Aerodynamics and Aeroelastics,
The overall objective is:
to develop an aerodynamic and
aeroelastic design basis for large
multi MW turbines.
to facilitate development and design
of multi MW turbines, including
possible new and innovative
concepts.
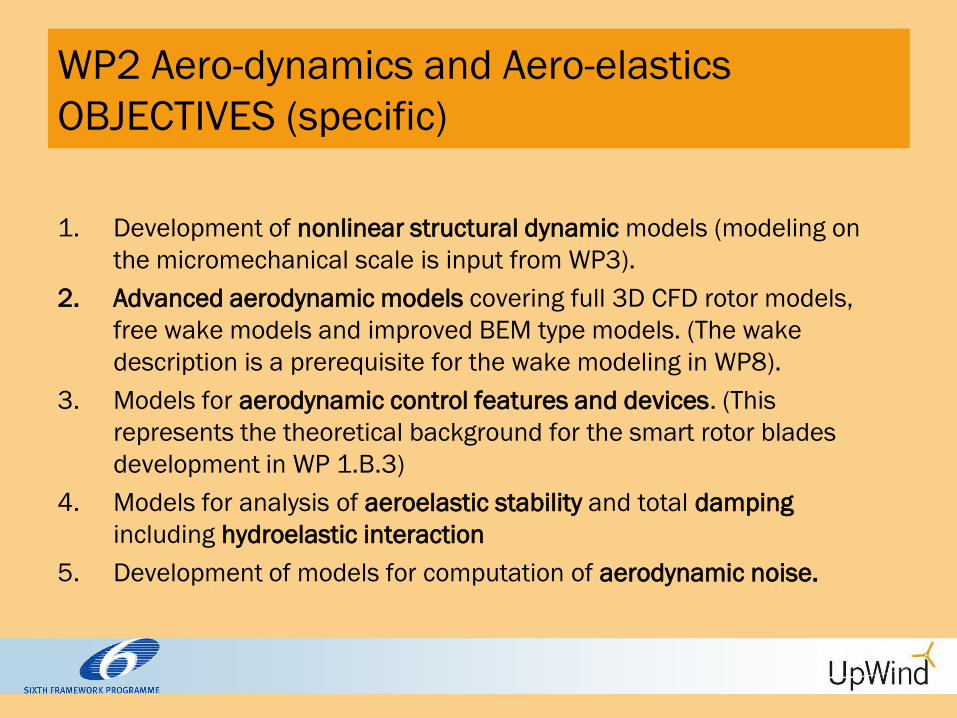
WP2 Aero-dynamics and Aero-elastics
OBJECTIVES (specific)
1. Development of nonlinear structural dynamic models (modeling on
the micromechanical scale is input from WP3).
2. Advanced aerodynamic models covering full 3D CFD rotor models,
free wake models and improved BEM type models. (The wake
description is a prerequisite for the wake modeling in WP8).
3. Models for aerodynamic control features and devices. (This
represents the theoretical background for the smart rotor blades
development in WP 1.B.3)
4. Models for analysis of aeroelastic stability and total damping
including hydroelastic interaction
5. Development of models for computation of aerodynamic noise.
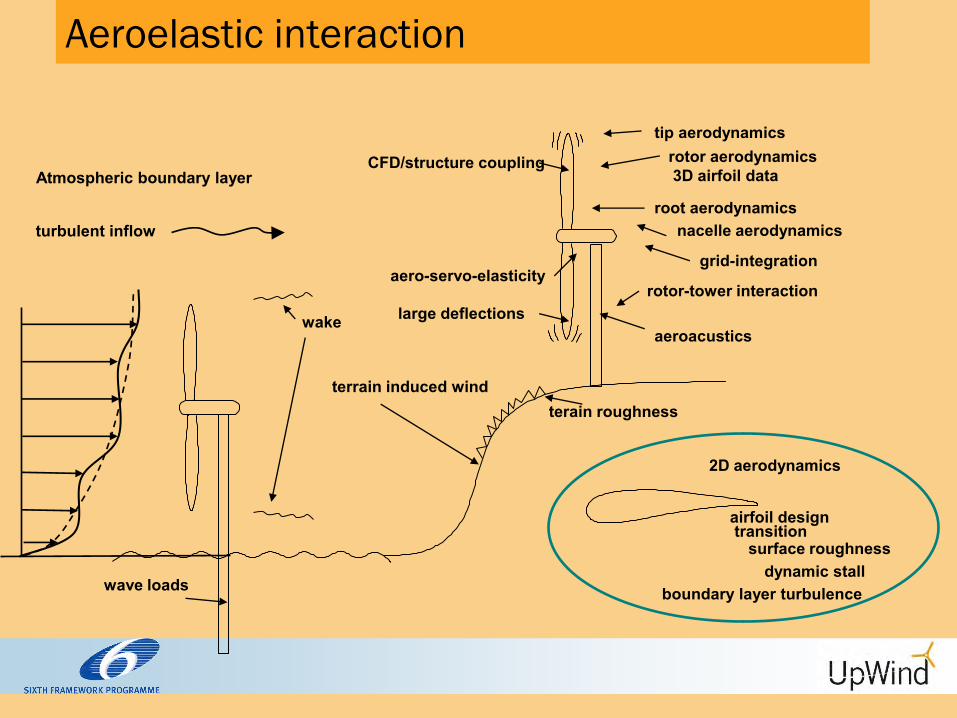
Aeroelastic interaction
terain roughness
turbulent inflow
wave loads
terrain induced wind
tip aerodynamics rotor aerodynamics 3D airfoil data
rotor-tower interaction
root aerodynamics
Atmospheric boundary layer
nacelle aerodynamics
wake
2D aerodynamics
surface roughness transition
dynamic stall
airfoil design
CFD/structure coupling
aeroacustics
boundary layer turbulence
aero-servo-elasticity grid-integration
large deflections
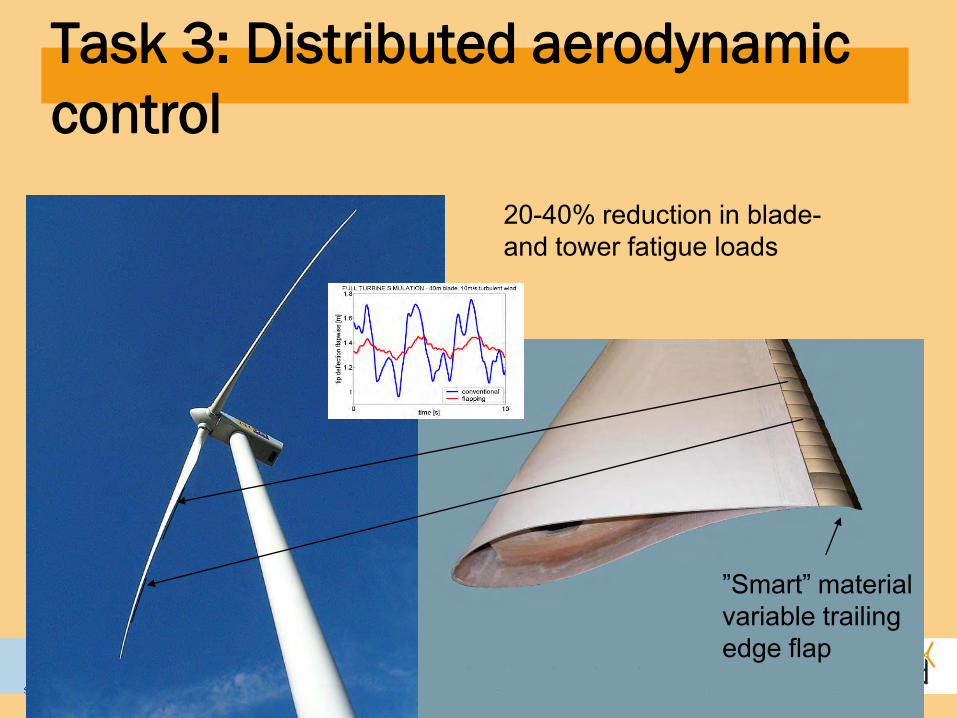
Task 3: Distributed aerodynamic
control
20-40% reduction in blade- and tower fatigue loads
”Smart” material variable trailing edge flap
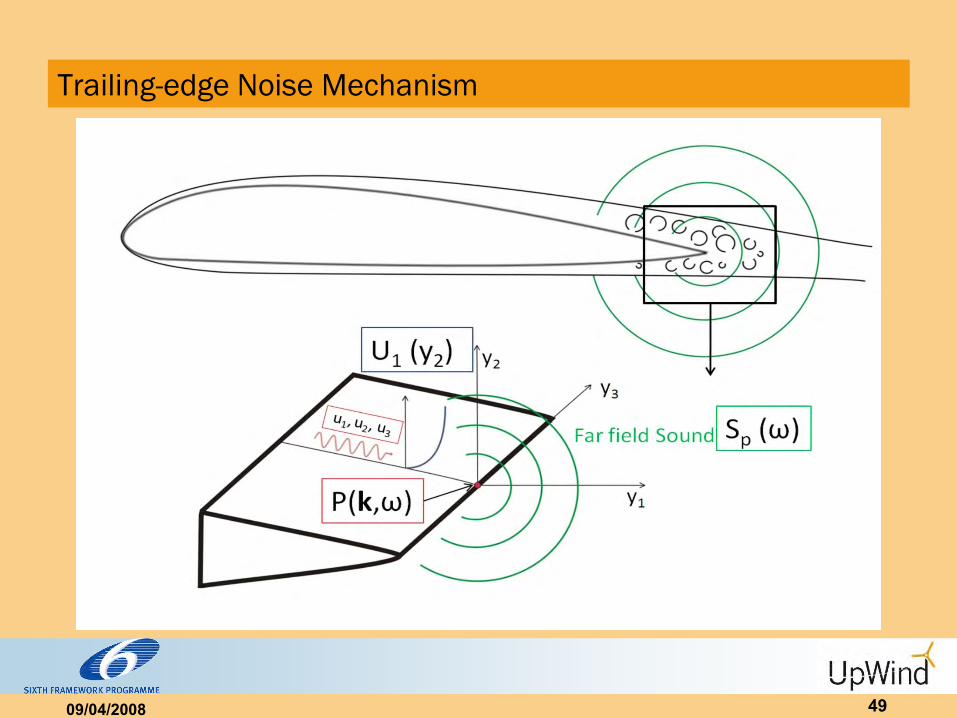
Trailing-edge Noise Mechanism
09/04/2008 49
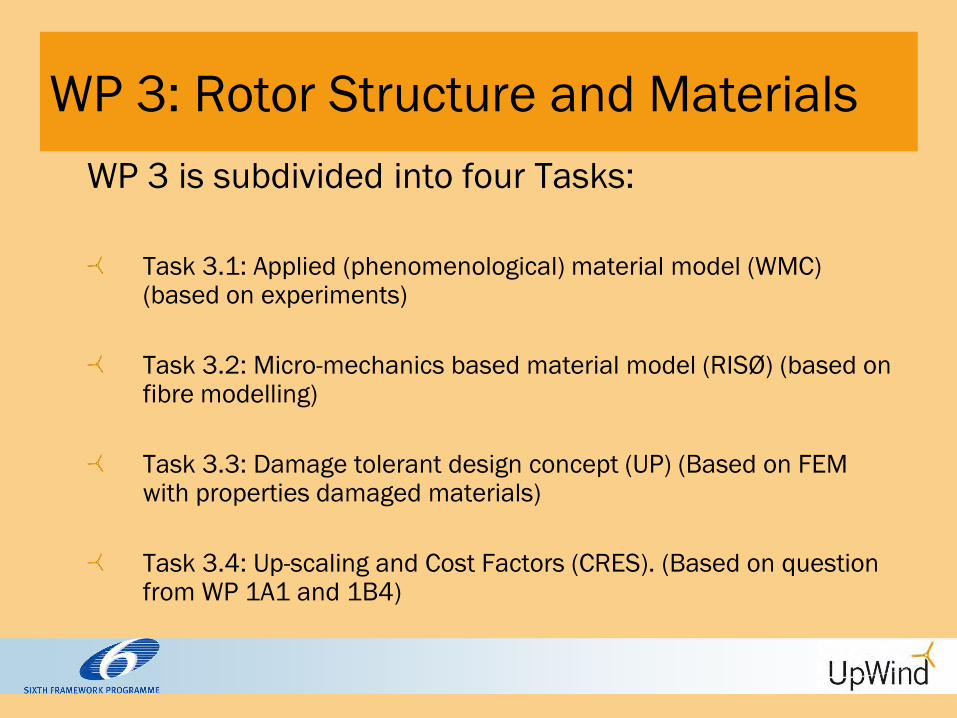
WP 3: Rotor Structure and Materials
WP 3 is subdivided into four Tasks:
Task 3.1: Applied (phenomenological) material model (WMC) (based on experiments)
Task 3.2: Micro-mechanics based material model (RISØ) (based on fibre modelling)
Task 3.3: Damage tolerant design concept (UP) (Based on FEM with properties damaged materials)
Task 3.4: Up-scaling and Cost Factors (CRES). (Based on question from WP 1A1 and 1B4)
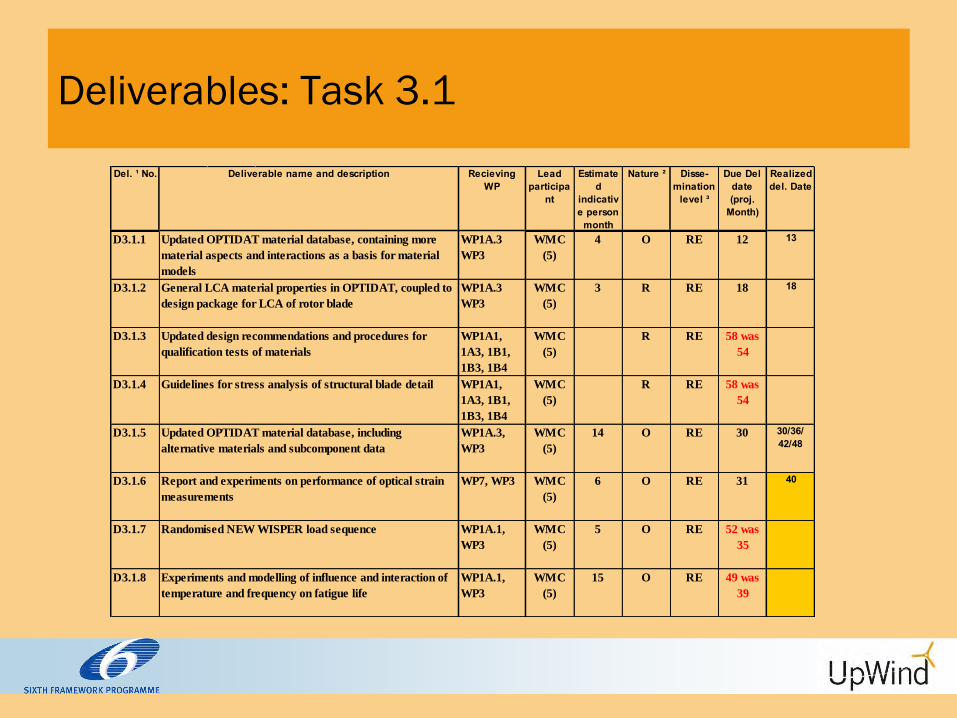
Deliverables: Task 3.1
Del. ¹ No. Recieving WP
Lead participa
nt
Estimated
indicative person
month
Nature ² Disse-mination
level ³
Due Del date (proj.
Month)
Realized del. Date
D3.1.1 WP1A.3
WP3
WMC
(5)
4 O RE 12 13
D3.1.2 WP1A.3
WP3
WMC
(5)
3 R RE 18 18
D3.1.3 WP1A1,
1A3, 1B1,
1B3, 1B4
WMC
(5)
R RE 58 was
54
D3.1.4 WP1A1,
1A3, 1B1,
1B3, 1B4
WMC
(5)
R RE 58 was
54
D3.1.5 WP1A.3,
WP3
WMC
(5)
14 O RE 30 30/36/ 42/48
D3.1.6 WP7, WP3 WMC
(5)
6 O RE 31 40
D3.1.7 WP1A.1,
WP3
WMC
(5)
5 O RE 52 was
35
D3.1.8 WP1A.1,
WP3
WMC
(5)
15 O RE 49 was
39
Updated design recommendations and procedures for
qualification tests of materials
Guidelines for stress analysis of structural blade detail
Deliverable name and description
Updated OPTIDAT material database, including
alternative materials and subcomponent data
Report and experiments on performance of optical strain
measurements
Updated OPTIDAT material database, containing more
material aspects and interactions as a basis for material
models
General LCA material properties in OPTIDAT, coupled to
design package for LCA of rotor blade
Randomised NEW WISPER load sequence
Experiments and modelling of influence and interaction of
temperature and frequency on fatigue life
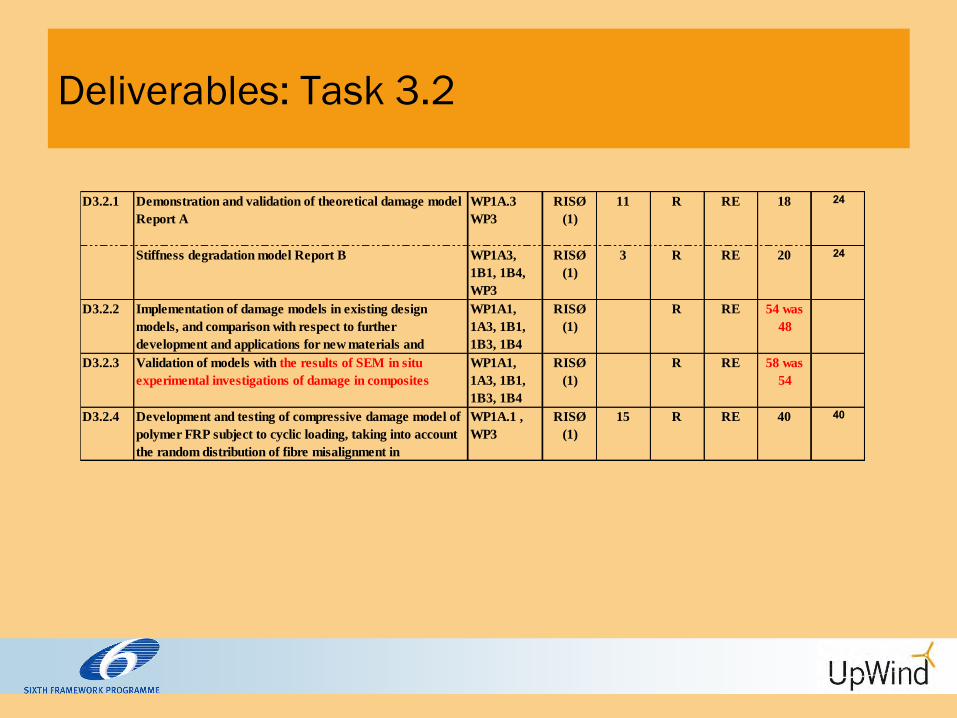
Deliverables: Task 3.2
D3.2.1 WP1A.3
WP3
RISØ
(1)
11 R RE 18 24
WP1A3,
1B1, 1B4,
WP3
RISØ
(1)
3 R RE 20 24
D3.2.2 WP1A1,
1A3, 1B1,
1B3, 1B4
RISØ
(1)
R RE 54 was
48
D3.2.3 WP1A1,
1A3, 1B1,
1B3, 1B4
RISØ
(1)
R RE 58 was
54
D3.2.4 WP1A.1 ,
WP3
RISØ
(1)
15 R RE 40 40
Stiffness degradation model Report B
Validation of models with the results of SEM in situ
experimental investigations of damage in composites
Demonstration and validation of theoretical damage model
Report A
Implementation of damage models in existing design
models, and comparison with respect to further
development and applications for new materials and
Development and testing of compressive damage model of
polymer FRP subject to cyclic loading, taking into account
the random distribution of fibre misalignment in
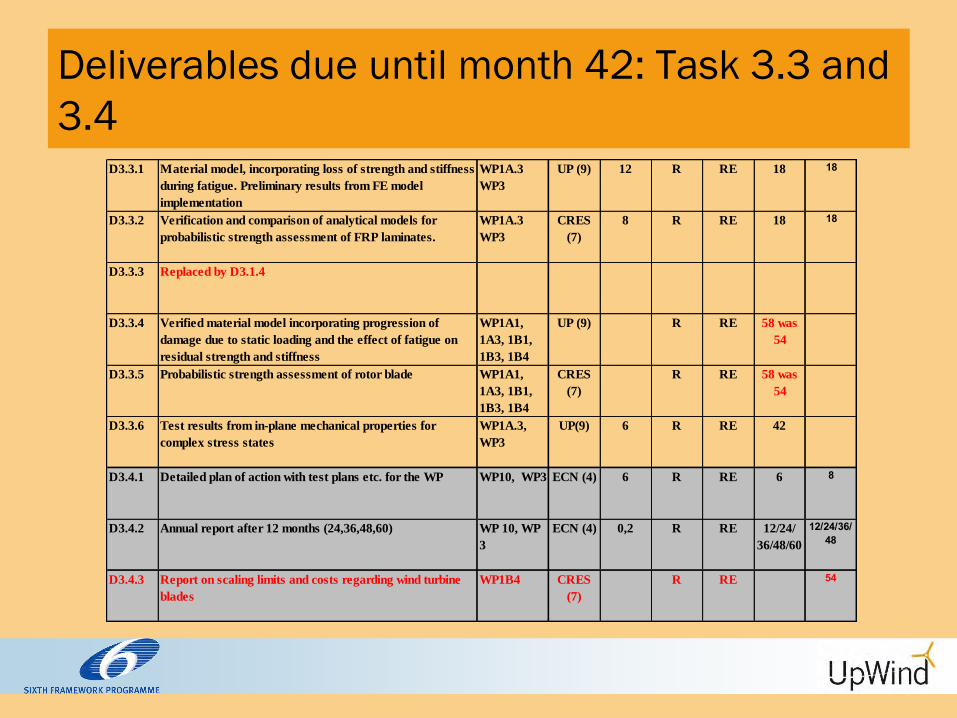
Deliverables due until month 42: Task 3.3 and
3.4 D3.3.1 WP1A.3
WP3
UP (9) 12 R RE 18 18
D3.3.2 WP1A.3
WP3
CRES
(7)
8 R RE 18 18
D3.3.3
D3.3.4 WP1A1,
1A3, 1B1,
1B3, 1B4
UP (9) R RE 58 was
54
D3.3.5 WP1A1,
1A3, 1B1,
1B3, 1B4
CRES
(7)
R RE 58 was
54
D3.3.6 WP1A.3,
WP3
UP(9) 6 R RE 42
D3.4.1 WP10, WP3 ECN (4) 6 R RE 6 8
D3.4.2 WP 10, WP
3
ECN (4) 0,2 R RE 12/24/
36/48/60
12/24/36/48
D3.4.3 WP1B4 CRES
(7)
R RE 54
Annual report after 12 months (24,36,48,60)
Report on scaling limits and costs regarding wind turbine
blades
Material model, incorporating loss of strength and stiffness
during fatigue. Preliminary results from FE model
implementation
Verification and comparison of analytical models for
probabilistic strength assessment of FRP laminates.
Verified material model incorporating progression of
damage due to static loading and the effect of fatigue on
residual strength and stiffness
Probabilistic strength assessment of rotor blade
Replaced by D3.1.4
Detailed plan of action with test plans etc. for the WP
Test results from in-plane mechanical properties for
complex stress states
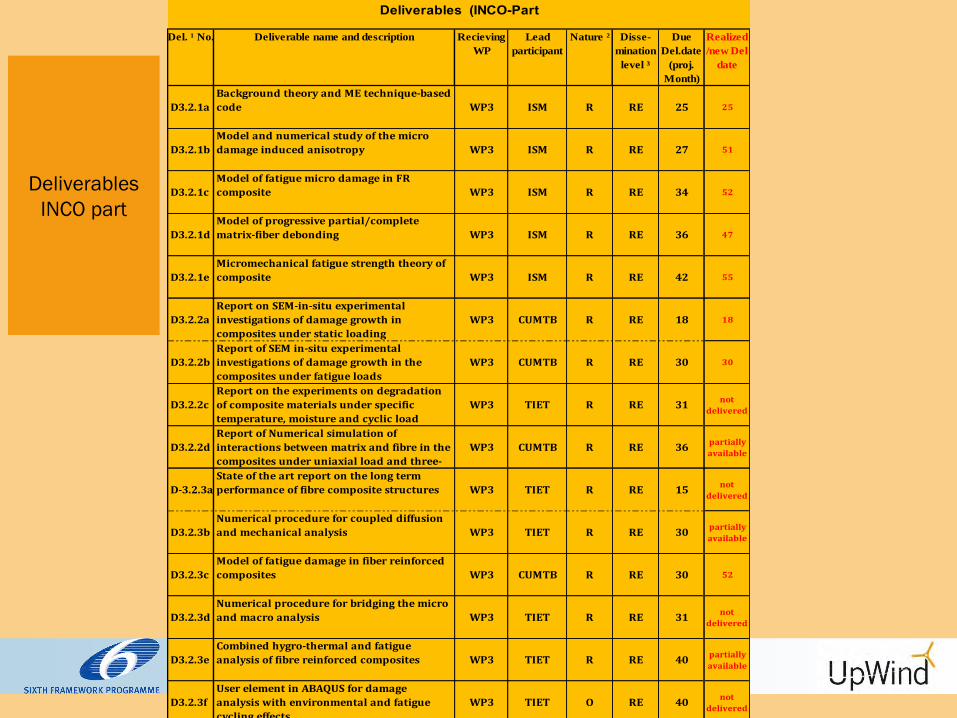
Del. ¹ No. Recieving
WP
Lead
participant
Nature ² Disse-
mination
level ³
Due
Del.date
(proj.
Month)
Realized
/new Del
date
D3.2.1a WP3 ISM R RE 25 25
D3.2.1b WP3 ISM R RE 27 51
D3.2.1c WP3 ISM R RE 34 52
D3.2.1d WP3 ISM R RE 36 47
D3.2.1e WP3 ISM R RE 42 55
D3.2.2a WP3 CUMTB R RE 18 18
D3.2.2b WP3 CUMTB R RE 30 30
D3.2.2c WP3 TIET R RE 31not
delivered
D3.2.2d WP3 CUMTB R RE 36partially
available
D-3.2.3a WP3 TIET R RE 15not
delivered
D3.2.3b WP3 TIET R RE 30partially
available
D3.2.3c WP3 CUMTB R RE 30 52
D3.2.3d WP3 TIET R RE 31not
delivered
D3.2.3e WP3 TIET R RE 40partially
available
D3.2.3f WP3 TIET O RE 40not
delivered
User element in ABAQUS for damage
analysis with environmental and fatigue
cycling effects
Combined hygro-thermal and fatigue
analysis of fibre reinforced composites
Model of fatigue damage in fiber reinforced
composites
Numerical procedure for bridging the micro
and macro analysis
Model of fatigue micro damage in FR
composite
Model of progressive partial/complete
matrix-fiber debonding
Micromechanical fatigue strength theory of
composite
Numerical procedure for coupled diffusion
and mechanical analysis
Report on SEM-in-situ experimental
investigations of damage growth in
composites under static loading
Report of SEM in-situ experimental
investigations of damage growth in the
composites under fatigue loads
Report on the experiments on degradation
of composite materials under specific
temperature, moisture and cyclic load
Report of Numerical simulation of
interactions between matrix and fibre in the
composites under uniaxial load and three-
State of the art report on the long term
performance of fibre composite structures
Deliverables (INCO-Part
Deliverable name and description
Background theory and ME technique-based
code
Model and numerical study of the micro
damage induced anisotropy
Deliverables
INCO part
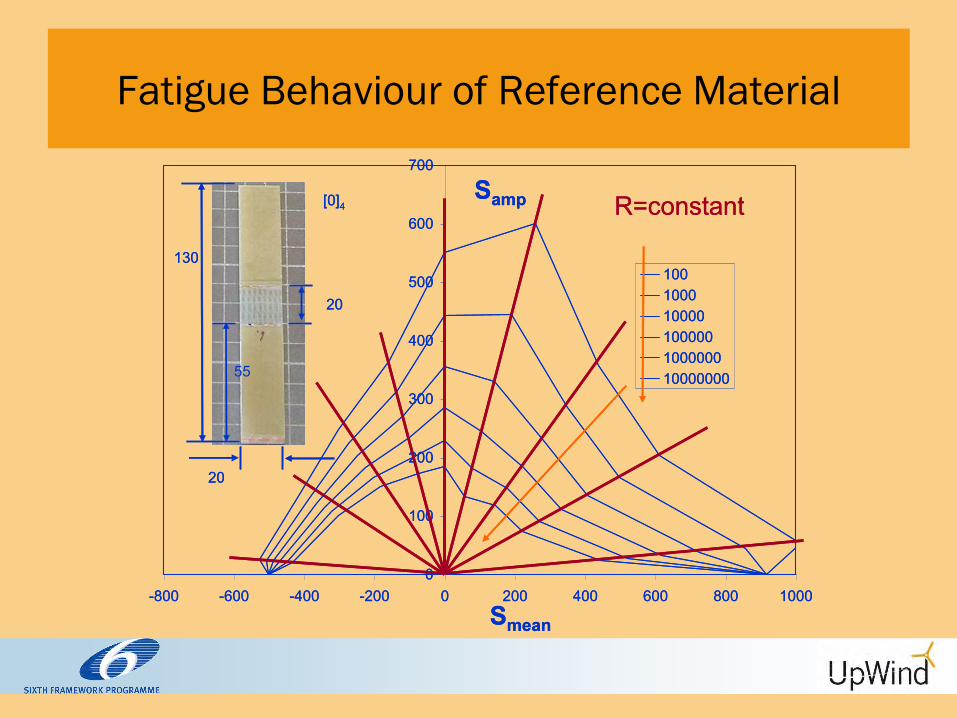
Fatigue Behaviour of Reference Material
0
100
200
300
400
500
600
700
-800 -600 -400 -200 0 200 400 600 800 1000
100100010000100000100000010000000
20
20
130
55
[0]4Samp
Smean
R=constant
0
100
200
300
400
500
600
700
-800 -600 -400 -200 0 200 400 600 800 1000
100100010000100000100000010000000
20
20
130
55
[0]4Samp
Smean
R=constant
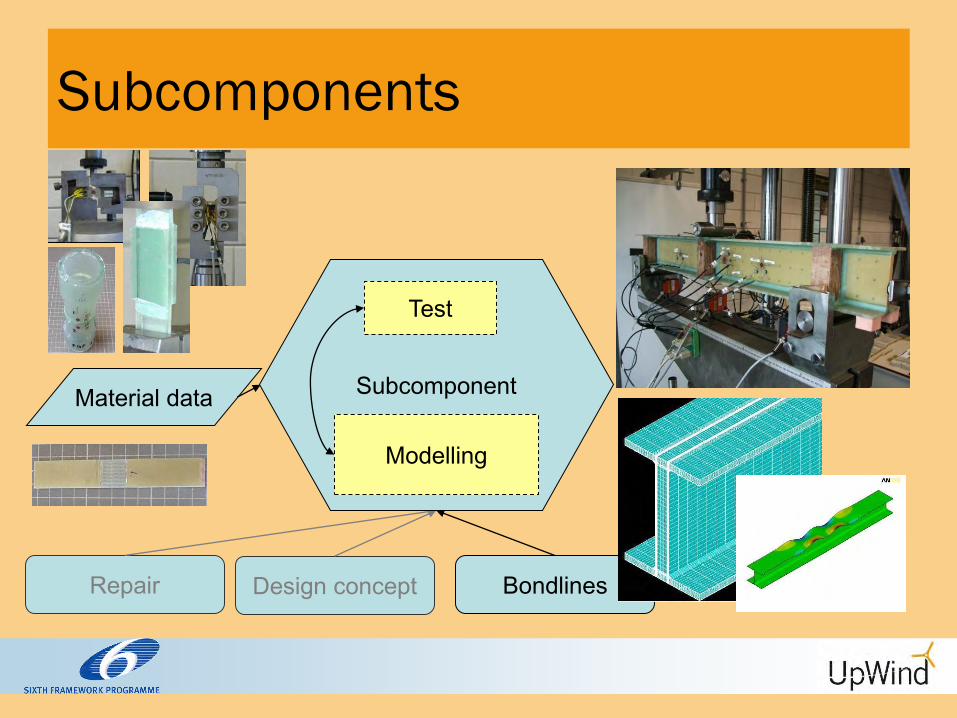
Subcomponents
Material data
Repair Design concept Bondlines
Subcomponent
Test
Modelling
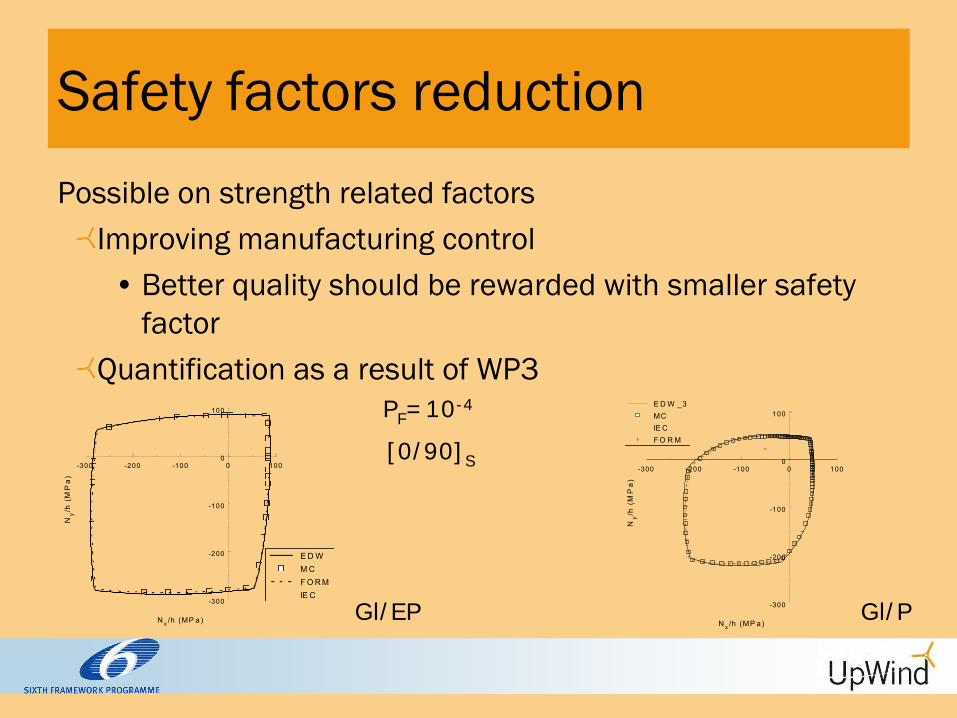
Safety factors reduction
Possible on strength related factors
Improving manufacturing control
• Better quality should be rewarded with smaller safety
factor
Quantification as a result of WP3
-300 -200 -100 0 100
N x /h (MP a)
-300
-200
-100
0
100
Ny/h
(M
Pa
)
E D WM CF O R MIE C
-300 -200 -100 0 100
N x /h (MP a)
-300
-200
-100
0
100
Ny/h
(M
Pa
)
E D W _3MCIE CF O R M
[0/90]S
PF=10-4
Gl/EP Gl/P

0
5
10
15
20
25
15 25 35 45 55 65
Blade length (m)
Bla
de m
ass (
tn)
Gl/P
Gl/Ep
Gl-C/Ep
Materials & Manufacturing
Hand lay-up
RIM
Pre-pregs
Probabilistic stress analysis
Specific objectives for the 4th year:
Integration of the Response Surface Method (RSM/MC) in
shell FE models of rotor blades and THIN-probabilistic
Implementation of extreme load probabilistic analysis as
per IEC 61400-1 ed.3 for determining structural reliability
of a rotor blade in ultimate loading

RESULTS: Probability of failure

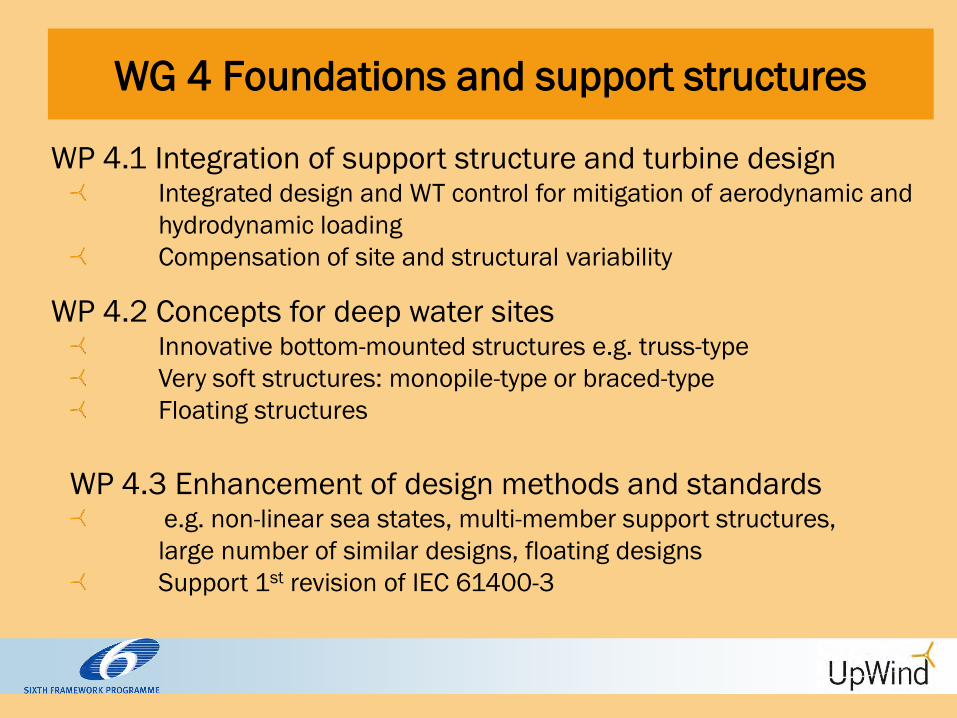
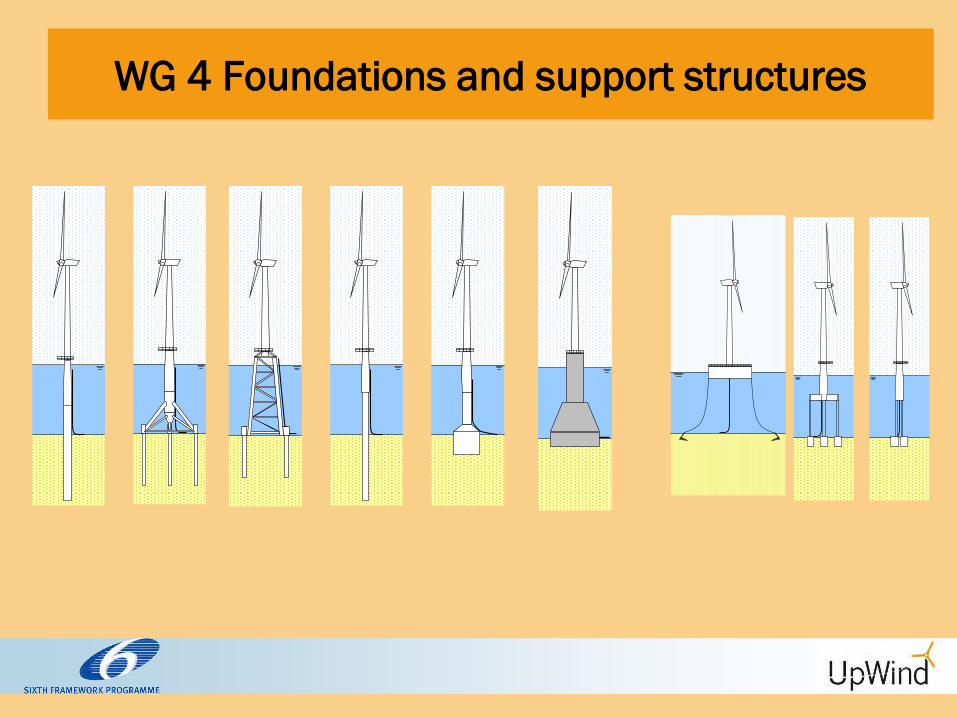
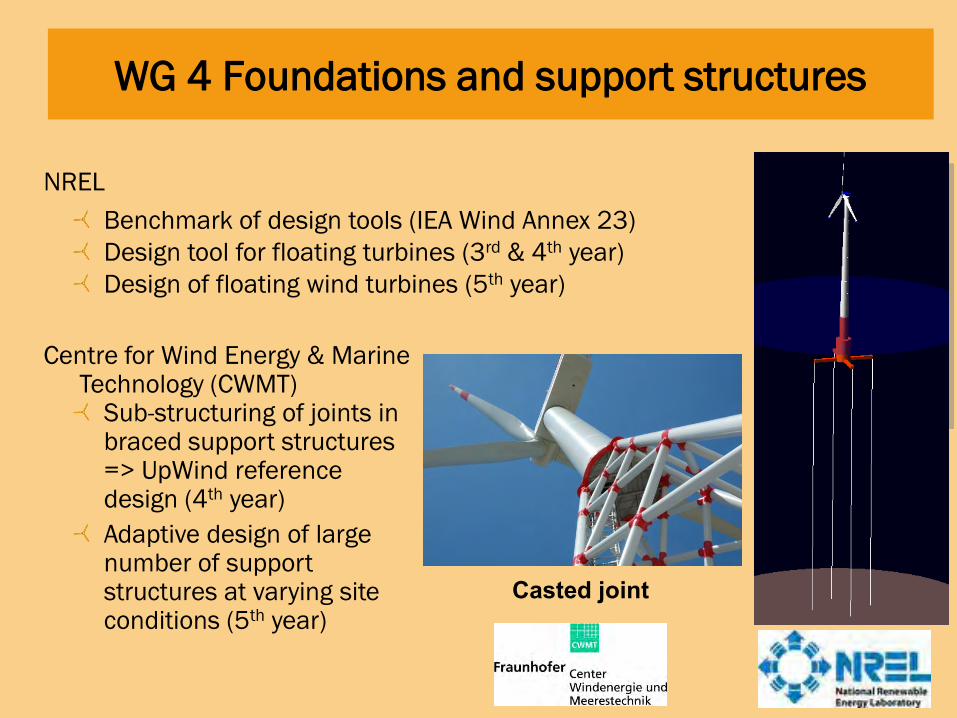
WG 4 Foundations and support structures
WG 4 Foundations and support structures
WP 4.1 Integration of support structure and turbine design Integrated design and WT control for mitigation of aerodynamic and
hydrodynamic loading
Compensation of site and structural variability
WP 4.2 Concepts for deep water sites Innovative bottom-mounted structures e.g. truss-type
Very soft structures: monopile-type or braced-type
Floating structures
WP 4.3 Enhancement of design methods and standards e.g. non-linear sea states, multi-member support structures,
large number of similar designs, floating designs
Support 1st revision of IEC 61400-3
WG 4 Foundations and support structures
WG 4 Foundations and support structures
Centre for Wind Energy & Marine Technology (CWMT)
Sub-structuring of joints in braced support structures
=> UpWind reference design (4th year)
Adaptive design of large number of support structures at varying site conditions (5th year)
NREL
Benchmark of design tools (IEA Wind Annex 23)
Design tool for floating turbines (3rd & 4th year)
Design of floating wind turbines (5th year)
Casted joint
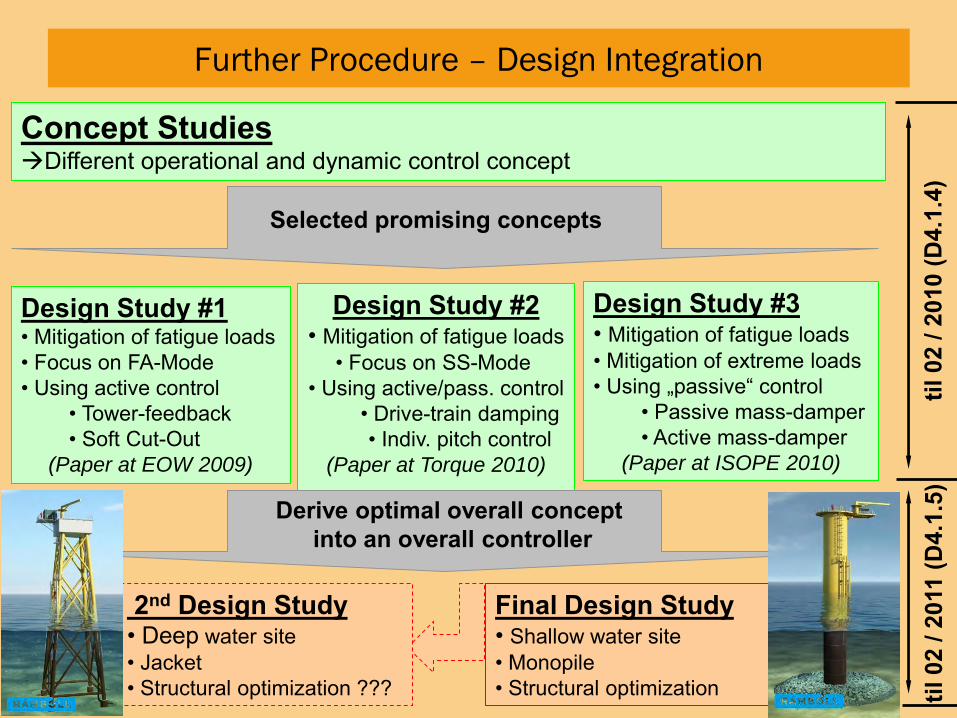
Design Study #1 • Mitigation of fatigue loads • Focus on FA-Mode • Using active control
• Tower-feedback • Soft Cut-Out
(Paper at EOW 2009)
til 0
2 / 2
010
(D4.
1.4)
til
02
/ 201
1 (D
4.1.
5)
Further Procedure – Design Integration
Design Study #2 • Mitigation of fatigue loads
• Focus on SS-Mode • Using active/pass. control
• Drive-train damping • Indiv. pitch control
(Paper at Torque 2010)
Design Study #3 • Mitigation of fatigue loads • Mitigation of extreme loads • Using „passive“ control
• Passive mass-damper • Active mass-damper
(Paper at ISOPE 2010)
Concept Studies Different operational and dynamic control concept
Selected promising concepts
Derive optimal overall concept into an overall controller
Final Design Study • Shallow water site • Monopile • Structural optimization
2nd Design Study • Deep water site • Jacket • Structural optimization ???
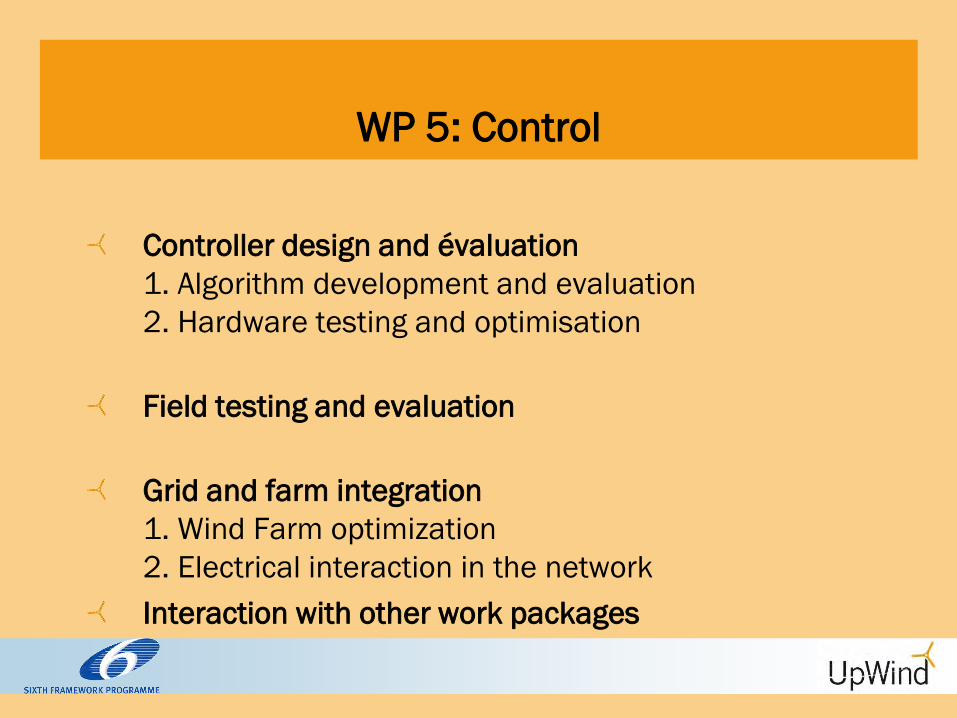
WP 5: Control
Controller design and évaluation
1. Algorithm development and evaluation
2. Hardware testing and optimisation
Field testing and evaluation
Grid and farm integration
1. Wind Farm optimization
2. Electrical interaction in the network
Interaction with other work packages

5 Control Deliverables
D5.1.1 Controller for 5MW reference turbine GH
D5.1.2 Load case and supervisory control implications of advanced control
GH
D5.1.3 Use of Lidar in control USTUTT D5.2 Promising Load Estimation Methodologies for Wind
Turbine Components ISET
D5.3 Load estimation ISET D5.4 Hardware test facility ISET/GH D5.5.1 Cart2 field tests GH D5.5.2 Cart3 field tests GH D5.5.3 REpower field tests REpower D5.7 Wind farm controller : replaced by new deliverable D5.1.3 D5.8 Review of electrical drive train topologies GH D5.9.1 Fast VAr control GE D5.9.2 DFIG modelling and low voltage ride-through Alstom D5.11 Closed loop system identification CENER D5.10 WP5 Final report GH
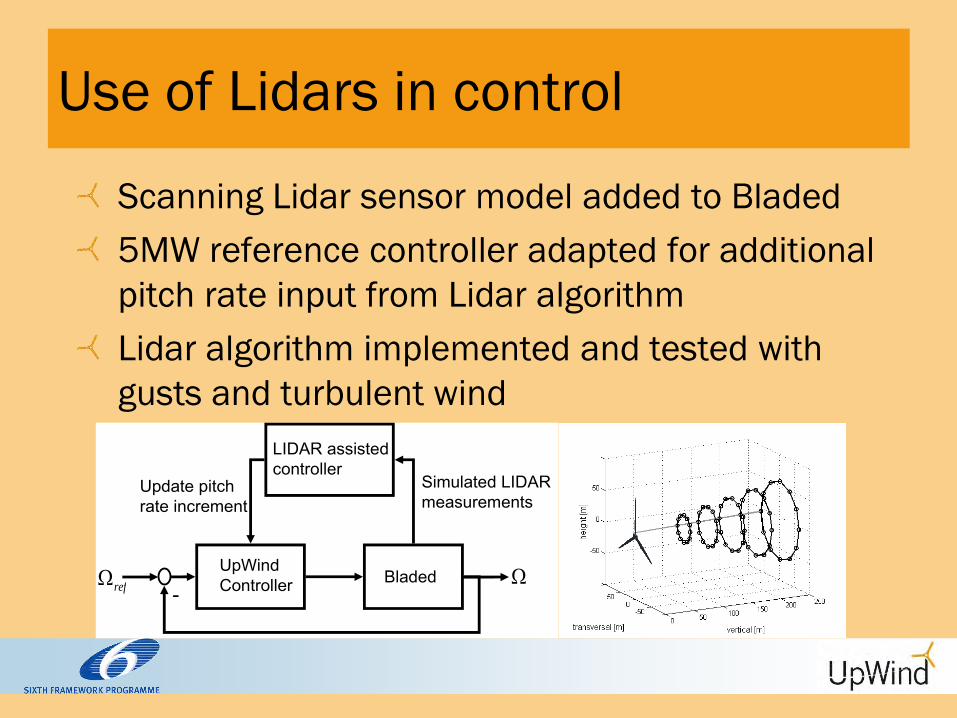
Use of Lidars in control
Scanning Lidar sensor model added to Bladed
5MW reference controller adapted for additional
pitch rate input from Lidar algorithm
Lidar algorithm implemented and tested with
gusts and turbulent wind
-
ref BladedUpWindController
LIDAR assistedcontroller
Simulated LIDARmeasurements
Update pitchrate increment
Field testing
NREL CART2 IPC tests • Gearbox repair delayed testing until November 2009
• Exceptionally poor winds over the winter
• First data at the very end of January 2010
• Data collected in February/March, and most already analysed
• Excellent results right from the start
• More data hoped for if winds permit.
NREL CART3 IPC tests • Controller designed and tested in simulations
• Fully implemented on turbine and ready to start
• Awaiting completion of turbine commissioning - ongoing
REpower tower damping tests • Everything in place
• Only a small amount of data has been collected so far due to very poor winds over the winter.
WG 6 Remote sensing

WP6. Remote sensing
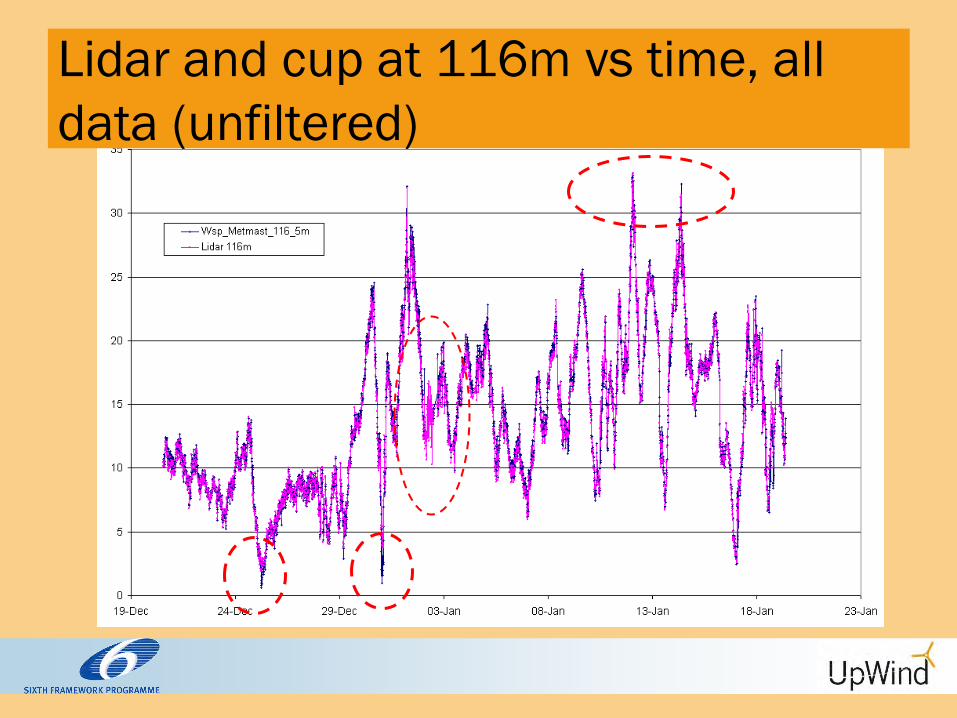
Lidar and cup at 116m vs time, all
data (unfiltered)

WP 6 Development of Wind Sensing Lidars 2006: Zephir commercial model introduced. Hardware issues.
2007: Ceilometer installed, screening on clouds: positive bias and σ reduced, availability drops. Leosphere introduces Windcube.
2008: Cloud correction: availability increases. Cone angle accuracy: bias reduced.
2008.5: Cone angle accuracy Estimator improved: nonlinear problems reduced.
2009: Improved test conditions, lower RIN. Improved test conditions.
Vindicator and Galion commercial
Mean < ~±0.05 m/s σ ~0.20
Mean < ~±0.05 m/s σ ~0.10
Mean Lidar Error [m/s]
-0.2-0.15
-0.1-0.05
00.05
0.10.15
2006 2007 2008 2009
Zephirs
WindCubes
Standard Deviation of Lidar Error [m/s]
0
0.1
0.2
0.3
0.4
0.5
2006 2007 2008 2009
ZephirsWindCubes

Good lidars are
getting accurate
in flat terrain!
Best lidars are within ±1.5% of
traceable cup (for the heights
we can test).
Very low noise
We are approaching the limit of
what we can be verified with
mast-mounted cup
anemometers.

WP7 Condition monitoring
7.1 Next Generation CMS for use in
multi MW turbines
7.2 Flight Leader Turbine concept for cost
optimised O&M on offshore wind farm WTs
7.3 Fault statistics to identify fault
critical components of WTs
7.4 Integration of WP7 results into international
standards and technical guidelines

WG 7 Condition monitoring
CMS for use in multi MW turbines; material properties
Risø-DTU
Before test
After test
Embedded sensor.
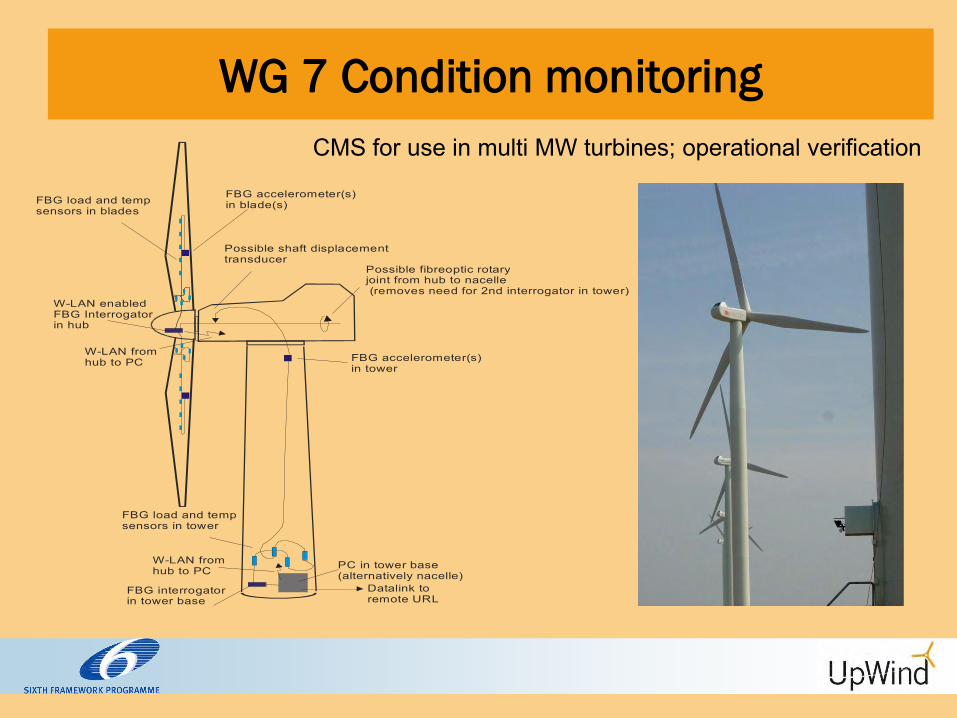
WG 7 Condition monitoring
W-LAN fromhub to PC
W-LAN fromhub to PC
Possible fibreoptic rotaryjoint from hub to nacelle (removes need for 2nd interrogator in tower)
Possible shaft displacementtransducer
W-LAN enabledFBG Interrogatorin hub
FBG load and tempsensors in blades
FBG load and tempsensors in tower
FBG accelerometer(s)in blade(s)
FBG accelerometer(s)in tower
PC in tower base(alternatively nacelle)
FBG interrogatorin tower base
Datalink to remote URL
CMS for use in multi MW turbines; operational verification
WP 8 Flow
•Data collection from Wind Farms - Wakes
• Comparison with existing flow models
•Participate in international standardization (IEC)

Flow
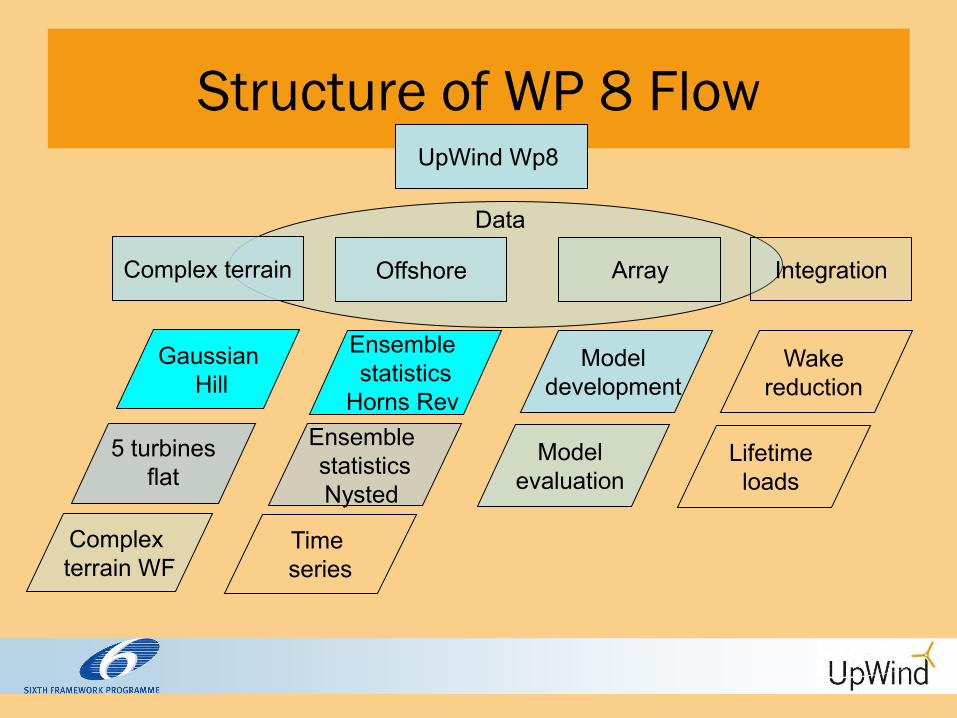
Structure of WP 8 Flow UpWind Wp8
Complex terrain Offshore
Gaussian Hill
Complex terrain WF
5 turbines
flat
Ensemble statistics
Horns Rev
Time series
Array Integration
Data
Ensemble statistics Nysted
Model development
Wake reduction
Lifetime loads
Model evaluation

Horns Rev case studies - 7D spacing
0 1 2 3 4 5 6 7 8Turbine number
0.2
0.4
0.6
0.8
1
Nor
mal
ised
pow
er
0 1 2 3 4 5 6 7 8
0.2
0.4
0.6
0.8
1
Nor
mal
ised
pow
er
0 1 2 3 4 5 6 7 8
0.2
0.4
0.6
0.8
1
Nor
mal
ised
pow
er
±1o
0 1 2 3 4 5 6 7 8
0.2
0.4
0.6
0.8
1
Nor
mal
ised
pow
er
±5o
±10o
±15o
Direct down the row
wake losses are the
largest esp. at low wind
speeds
Defining narrow rows
and wind sectors gives
few values
Not representative for all
wind speeds and
directions
Case 1 270, 7D
spacing
ObservedModel A Model BModel CModel D
8±0.5 m/s

WP 9 Grid
• Emphasis on grid reliability and design conditions
for WT coming from grid conditions
•Participate in international standardization (IEC)
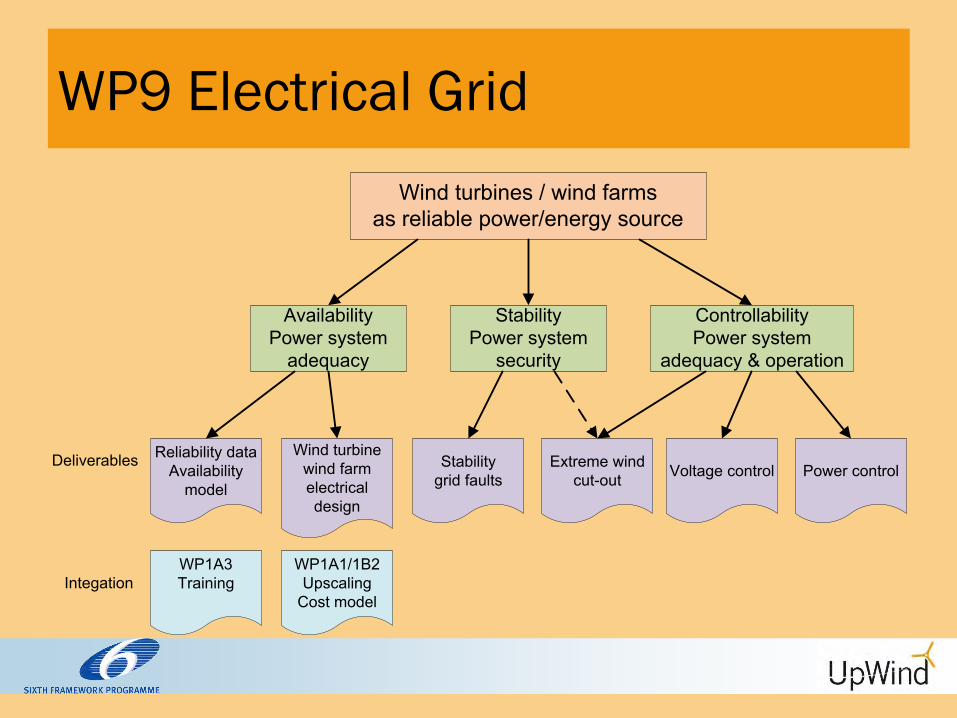
WP9 Electrical Grid
WP1A1/1B2Upscaling
Cost model
Wind turbines / wind farmsas reliable power/energy source
AvailabilityPower system
adequacy
StabilityPower system
security
ControllabilityPower system
adequacy & operation
Reliability dataAvailability
model
Stabilitygrid faults
Extreme wind cut-out Voltage control Power control
Wind turbine wind farm electrical design
WP1A3Training
Deliverables
Integation

Cost model - Main design parameters
Wind turbine type: reference WT (based on NREL 5 MW)
500 MW (1000 MW) offshore wind farm
North Sea wind and wave conditions
Water depth: 30m and 60m
Distance to shore: 25 km and 100 km
Power 5 MW 10 MW 15 MW 20 MW
Rotor diameter 126 m 178 m 218 m 252 m
Tip speed 80 m/s 80 m/s 80 m/s 80 m/s
Hub height 90 m 116 m 136 m 153 m
WP 11 Information and dissemination
1. External web site
2. Work shop on EWEC every year with presenations
3. Worksob
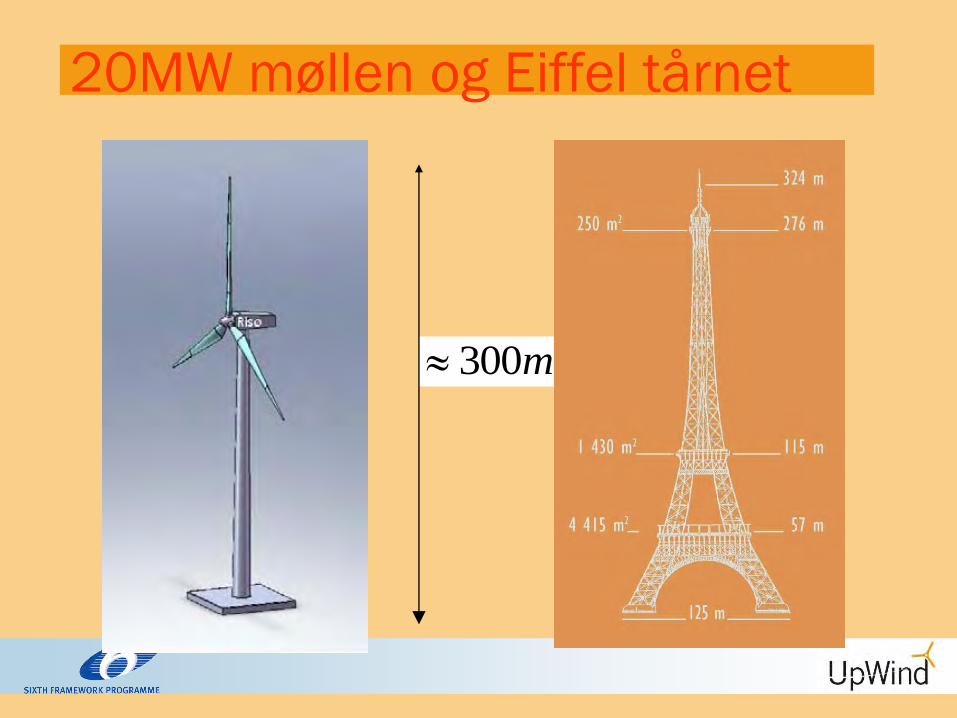
20MW møllen og Eiffel tårnet
m300

World Market Update 2010 March 2011
0
25,000
50,000
75,000
100,000
125,000
150,000
175,000
200,000
0
5,000
10,000
15,000
20,000
25,000
30,000
35,000
40,000
1983 1990 1995 2000 2005 2010
Cum
ulat
ive
MW
MW
per
yea
r
Year
Installed Wind Power in the World- Annual and Cumulative -
Source: BTM Consult - A Part of Navigant Consulting - March 2011

World Market Update 2010 March 2011
Average size WTG (kW) installed each year Year China Denmark Germany India Spain Sweden UK USA2005 897 1381 1634 780 1105 1126 2172 14662006 931 1875 1848 926 1469 1138 1953 16672007 1079 850 1879 986 1648 1670 2049 16692008 1220 2277 1916 999 1837 1738 2256 16772009 1360 2368 1976 1117 1904 1974 2241 17312010 1,469 2,514 2,047 1,293 1,929 1,995 2,568 1,875
Source: BTM Consult - A Part of Navigant Consulting - March 2011
0
200
400
600
800
1,000
1,200
1,400
1,600
1,800
1997 1998 1999 2000 2001 2002 2003 2004 2005 2006 2007 2008 2009 2010
kW
Global Average Annual WTG in kW Source: BTM Consult - A Part of Navigant Consulting - March 2011
World Market Update 2010 March 2011
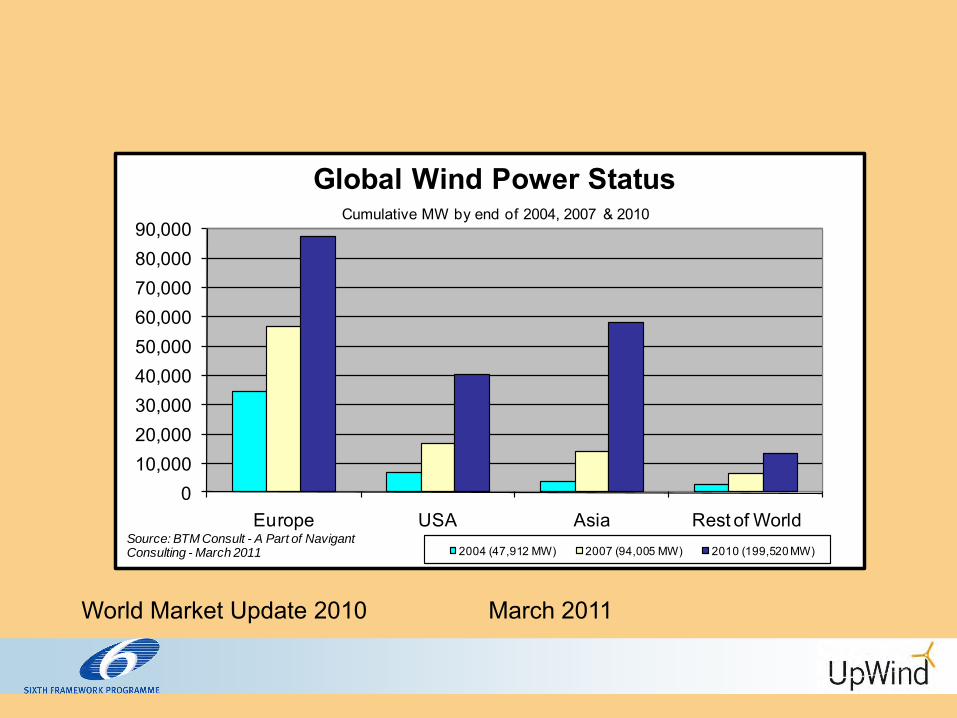
010,00020,00030,00040,00050,00060,00070,00080,00090,000
Europe USA Asia Rest of World
Global Wind Power Status
2004 (47,912 MW) 2007 (94,005 MW) 2010 (199,520 MW)Source: BTM Consult - A Part of Navigant Consulting - March 2011
Cumulative MW by end of 2004, 2007 & 2010
World Market Update 2010
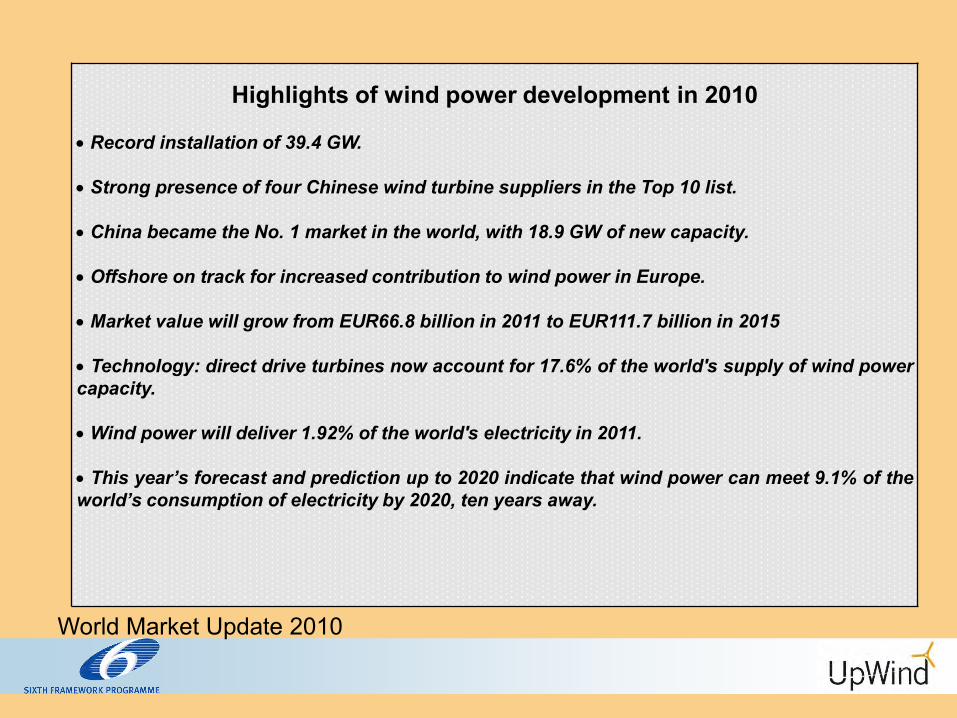
Highlights of wind power development in 2010
Record installation of 39.4 GW. Strong presence of four Chinese wind turbine suppliers in the Top 10 list. China became the No. 1 market in the world, with 18.9 GW of new capacity. Offshore on track for increased contribution to wind power in Europe. Market value will grow from EUR66.8 billion in 2011 to EUR111.7 billion in 2015 Technology: direct drive turbines now account for 17.6% of the world's supply of wind power capacity. Wind power will deliver 1.92% of the world's electricity in 2011. This year’s forecast and prediction up to 2020 indicate that wind power can meet 9.1% of the world’s consumption of electricity by 2020, ten years away.
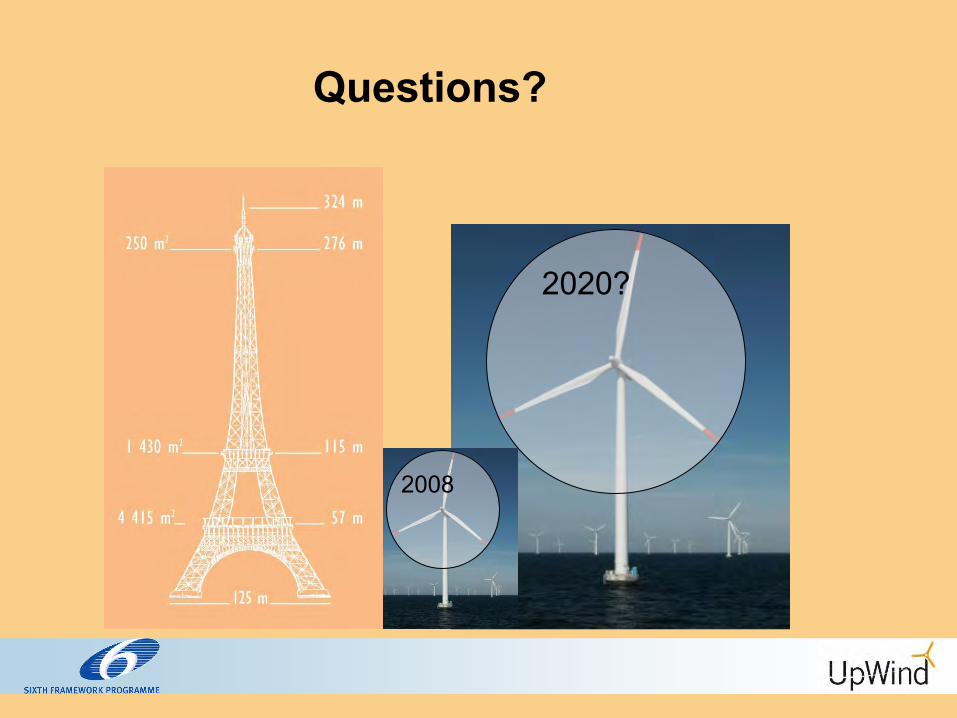
2008
2020?
Questions?