
SP295C Manual Form7271A - AudioToolbox.USaudiotoolbox.us/images/SP295C_Manual_Form7271A.pdf ·...
88
SP295C SoundPro Contractor Version (Firmware version 4.19) Operation Manual 3200 Sencore Drive, Sioux Falls, SD 57107
-
Upload
nguyenngoc -
Category
Documents
-
view
217 -
download
0
Transcript of SP295C Manual Form7271A - AudioToolbox.USaudiotoolbox.us/images/SP295C_Manual_Form7271A.pdf ·...

SP295C SoundPro
Contractor Version (Firmware version 4.19)
Operation Manual
3200 Sencore Drive, Sioux Falls, SD 57107

SP295 SoundPro Contractor Version Form7271A Operation Manual
ii
WARNING
PLEASE OBSERVE THESE SAFETY PRECAUTIONS
There is always a danger present when using electronic test equipment. Unexpected voltages can be present at unusual locations in defective
equipment and distribution systems. Become familiar with the equipment with which you are working, and observe the following safety precautions.
Every precaution has been taken in the design of the SP295C to insure that it is as safe as possible. However, safe operation depends on you, the operator. 1. Never exceed the limits of the SP295C as given in the specifications section or
other special warnings provided in this manual.
2. Always be sure that your equipment is in good working order. Broken or frayed test leads or cables can be extremely dangerous and may expose you to high voltages.
3. Remove test leads immediately following measurements to reduce the possibility of shock.
4. Do not work alone when working under hazardous conditions. Always have another person available in case of an accident.
5. Never assume that a cable shield is at earth ground potential. Both static and electrical voltages can be present on a cable’s sheath. Do not connect the SP295C to a cable having a hot shield. Doing so may place lethal voltages on the SP295C.
6. Always follow standard safety procedures.
When in doubt, be careful.

SP295 SoundPro Contractor Version Form7271A Operation Manual
iii
SP295C SoundPro Contractor Version
(Firmware version 4.19) Operation Manual
3200 Sencore Drive, Sioux Falls, SD 57107

SP295 SoundPro Contractor Version Form7271A Operation Manual
iv
TABLE OF CONTENTS DESCRIPTION Introduction .......................................... 1 Features ............................................... 1 Specifications ....................................... 2 Controls................................................ 7 Supplied Accessories ........................... 8 Optional Accessories............................ 8 QUICK START..................................... 9 INPUTS AND OUTPUTS ................... 12 OPERATING THE SoundPro............ 14 SPL Sound Level Meter ............................. 16 Sound Study Graph............................ 19 ACOUSTICS Real-Time Analyzer............................ 22 FFT Analyzer...................................... 23 Energy-Time Graph............................ 27 Speaker Reflection......................... 31 Initial Time Delay Gap.................... 32 Reverb Decay Time............................ 33 Noise Criteria ..................................... 37 TECHBENCH Level/Freq Counter............................. 39 Level Meter .................................... 39 VU/PPM Meter ............................... 41 Signal Generator ................................ 43 Sine/SQ/Polarity............................. 43 White & Pink Noise ........................ 44 Impedance ..................................... 44 Sweeps .............................................. 48 Sine Wave...................................... 48 Impedance ..................................... 49 Amplitude....................................... 49 Distortion Meter.................................. 53 Signal/Noise Ratio.............................. 56
TESTS Auto HT Tests .................................... 58 Setup ............................................. 59 Review1 ......................................... 59 Review2 ......................................... 59 Auto Time Delay................................. 63 Polarity Test ....................................... 65 Speaker Mode................................ 67 Microphone Test Mode .................. 68 Equipment Test Mode.................... 68 Power Tests ....................................... 69 Battery Level .................................. 69 Phantom Power ............................. 69 Cable Test.......................................... 70 UTILITIES Audio Scope....................................... 72 Monitor Amplifier ................................ 74 Save Settings ..................................... 76 Setup & Calibration ............................ 77 General Setup................................ 77 PC Interface/About ............................. 78 APPENDIX A dB SPL Scale................................. 79 APPENDIX B ANSI Weighting Curves ................. 80 APPENDIX C ANSI Noise-Criterion Curves ......... 81 WARRANTY AND SERVICE INFORMATION ...........inside back cover

SP295 SoundPro Contractor Version Form7271A Operation Manual
1
DESCRIPTION Introduction The Sencore SP295C SoundPro Contractor is a quality, high-end audio and acoustic analyzer designed for audio professionals, commercial audio installers, audio system engineers, and civil engineers. It utilizes DSP technology, FFT analysis, and octave-based filters for accurate, real-time acoustic analysis. The SoundPro combines the testing functionality of numerous audio test instruments into a single portable, easy-to-use unit. The SP295C SoundPro Contractor version is the only audio/acoustic analyzer that provides all the features required to perform extended-time sound surveys, noise criteria measurements, room reverberation analysis, acoustic modal analysis, sound system component and level calibration, system troubleshooting, speaker phasing calibration, and system wiring and component setup verification. The SoundPro features a graphical back-lit LCD display, AC or portable battery operation, a detachable microphone, internal audio test generator, and balanced and unbalanced stereo inputs and test signal outputs. Features
� Acoustic analysis tools to calibrate and maintain all types of sound systems. � Stereo XLR, 1/4" and phono analog audio inputs � Internal audio signal and test generator � SPL meter to 1/12th octave resolution � Sweep generator and Impedance tester � 64 x 128 pixel graphic backlight LCD is viewable in all lighting conditions. � Complete test functions for acoustical analysis and audio component calibration. The test
functions are grouped under five menu categories: SPL:
Sound Level Meter (weighting: A, B, C, flat, 1 and 1/3 octave; averaging: slow, fast, impulse, peak, or LEQ)
Sound Study Graph (1, 5, 10, and 15 min, 1, 2, 8, and 24 hours, automatically saves up to 40 studies to memory)
Acoustics:
Real-Time Analyzer (1 and 1/3 octave filter based) FFT Analyzer (1, 1/3, 1/6 and1/12 octave) Energy-Time Graph (Calibrated in time and distance) Reverb Decay Time (Reverb decay and RT60, 1 and 1/3 octave filters) Noise Criteria (Displays NC rating or Speech Interference Level and limiting band)
TechBench:
Level/Freq Counter (Stereo level meter, frequency counter and VU/PPM display) Signal Generator (Sine and square waves: adjustable level and frequency, white and pink
noise: adjustable level, impedance test) Sweeps (Amplitude/frequency response, impedance, programmable sine wave) Distortion Meter (Speaker comparison to locate defects and component distortion test) Signal/Noise Ratio (Computes a component's S/N, simultaneous 2 channel analysis)

SP295 SoundPro Contractor Version Form7271A Operation Manual
2
Specifications
SPL Sound Level Meter Method: True RMS measurement of ambient sound energy levels. Inputs: Microphone and line Display: Digital and analog with peak hold Accuracy: ± 0.3 dB SPL, steady state Resolution & Range: 0.1 dB; 35 –125 dBA with supplied microphone. Weighting networks: ANSI Type 1
A, B, and C-weighting, Flat, 1 and 1/3 octave filters Averaging: ANSI Type 1:
Slow (1000 ms exponential decay, time-averaged) Fast (125 ms exponential decay, time-averaged) Impulse (35 ms exponential decay) Peak LEQ (10 sec. 1, 5, 10, or 15 min. 1, 8, or 24 hour or manual)
Sound Study Graph Method: Graphically displays SPL level over a period of time. Inputs: Microphone and line Averaging: Peak or average Weighting: ANSI Type 1: A, B, and C-weighting, Flat, 1 and 1/3 octave filters Time Range: 1, 5, 10, and 15 min., 1, 2, 8, and 24 hr. Resolution: Time range divided into 120 equal time segments Range: 35-125 dBA with supplied microphone in 2 selectable ranges
Acoustics Real-Time Analyzer Method: Uses ANSI Class 1 octave-band or 1/3 octave-band filters to show relative sound levels by frequency band. Inputs: Microphone and line Band Filters: Selectable 1 or 1/3 octave Filter Accuracy: ± 0.20 dBu at band center frequency Frequency Range: Full (20Hz to 20kHz) or Low (10Hz to 332Hz) Averaging: Exponential Decay (1, 3, 6, 10, 30, 60 sec.), Equal-weighted Time (Avg), and Peak Hold Display: Graphic, digital SPL, digital SPL of band selected by cursor Range and Resolution: 17 or 35 dB window (0.5 dB/pixel or 1.0/pixel) within a 25 to 170 dB range, adjustable in 5 dB steps and 2 input ranges Level Accuracy: ±1.5 dB with supplied microphone Weighting: Flat, A-weighted, C-weighted, Cinema X (ANSI PH22.202M-1984) FFT Analyzer Method: Plots sound energy levels vs. octave band filtered spectrum. Inputs: Microphone and line Band Filters: Full octave, 1/3 octave, 1/6 octave, 1/12 octave Filter Accuracy: ±0.20 dBu at band center frequency Averaging: Exponential Decay (1, 3, 6, 10, 30, 60 sec.), Equal-weighted Time (Avg), Peak Hold

SP295 SoundPro Contractor Version Form7271A Operation Manual
3
Display: Graphic, digital SPL, digital SPL of band selected by cursor Range and Resolution: 17 or 35 dB window (0.5 dB/pixel or 1.0/pixel) within a 25 to 170 dB range, adjustable in 5 dB steps and 2 input ranges Level Accuracy: ± 1.5 dB with supplied microphone Frequency discrimination: ± 1% Weighting: Flat, A-weighted, C-weighted, Cinema X (ANSI PH22.202M-1984) Energy Time Graph Method: Real time plot of impulse sound decay energy vs. time or sound propagation distance. Inputs: Microphone and line Graph y-axis units: ms (milliseconds), ft (feet), m (meters) Maximum time: 7680 msec. Maximum distance: 8678 ft, 2641 m Display: Graphical display in real-time or freeze, measuring cursor displays time/distance and dB level, delay time to initial pulse, RT0 marker, RT10 - RT60 reverberation times using cursors Display Accuracy: ± 1 pixel Weighting: ANSI A, B, C, octave, and 1/3 octave-band Reverb Decay Time Method: Measures reverberation decay time and RT60 using pink noise. When a 60 dB dynamic range is not available, RT60 is linearly extrapolated from available dynamic range. Weighting: A-Weighted, B-Weighted, C-Weighted, Flat, 1 and 1/3 octave band Range: 5 msec to 14.5 seconds, RT60 time to 11 sec. Ambient Noise: Ambient noise level must be at least 26 dB lower than test signal Accuracy: ± 2% full signal Resolution: 10 msec. RT60 Time: Extrapolated from Decay Time measurement. Noise Criteria Method: Implements ANSI S12.2-1995 for comparison of background noise level in nine octave bands to standard noise criterion curves. Inputs: Microphone and line Displays: NC curve, limiting band, SPL of selected octave band, Speech Interference Level
TechBench Level Meter/Frequency Counter Level Meters Display Types: Digital left and right line input levels. Analog bar graph and digital left and right line input VU levels. Peak Program Material line input levels. Inputs: Line inputs Reference Level: -30 to +20 dBu (VU/PPM meter) Range: -95 dBu to +40 dBu, auto or manual range Units: dBu (0 dB referenced to 0.775Vrms), v (0 dB referenced to 1.00Vrms), Vave (average voltage), Vrms (true RMS voltage calculation), Vp-p (true peak-to-peak algorithm) Accuracy: ± 0.5 dB, 20 Hz to 20 kHz, +40 dBu to –85 dBu

SP295 SoundPro Contractor Version Form7271A Operation Manual
4
Frequency Counter Inputs: Line inputs Display: L & R displayed independently Range: 16 Hz to 50 kHz Accuracy: ± 1Hz mixed font Signal Generator Signals: Sine wave, square wave, white noise, pink noise (full, 1 or 1/3 octave band limited), Polarity waveform (square wave top and sine wave bottom for signal tracing) Distortion: <0.1% sine wave output Output Frequency Range: Sine wave 1 Hz to 22 kHz, square waves 1 Hz to 1.6 kHz in 1 Hz, 1/3 octave or 1 octave steps Output Level: Sine wave, –78 dBu to +17 dBu Square wave, –78 dBu to +17 dBu White noise, –78 dBu to +2 dBu Pink noise, –78 dBu to 0 dBu Level Accuracy: ±0.05 dBu @1000 Hz, ±0.10 dBu 16 Hz to 20 kHz Filter Accuracy: Pink noise filters <0.05 dB, 20 Hz to 19 kHz, < 1 dB at 20 kHz Resolution: Fine: 0.05 dB from –9.95 to +9.95, 0.1 dB all others Coarse: 1.5 dB Display: Signal type, frequency, level set, output jack, level measurement units, actual signal level at output (compensated for loading) Impedance Meter: Measures impedance of external device at any frequency from 20 Hz to 20 kHz, in 1/3 octave steps. Impedance Range: 1 ohm to 8000 ohms, 20 - 20kHz. Impedance Display: Test frequency, impedance, equivalent Wattage for 25V, 50V, 70V, or 100V at selected frequency Impedance Accuracy: 2 ohms to 50 ohms: +/-2%, 50 Hz - 16 kHz; 1 ohm to 8000 ohms: +/-10%, 20 - 20 kHz.
Sweeps Signals: Sine wave sweep Smooth sweep between two selected frequencies over selected 10 to 99 seconds time duration. Amplitude sweep Plots average level in each 1/3 or 1/12 octave band within selected sine wave sweep band. Impedance sweep Plots average impedance in each 1/3 or 1/12 octave band within selected sine wave sweep band. Frequency Range: 20Hz to 20kHz Impedance Range: 20 Ohms to 8000 Ohms Display: Impedance & Amplitude - graphic, Sine wave - digital Resolution: 1/3 octave - 30 points, 1/12 octave - 120 points Accuracy: ± 0.5 dB or 1 pixel mixed fonts Distortion Meter Method: Compares level of harmonics and noise in input signal to the applied fundamental test frequency. Inputs: Microphone and line Display: Digital and log scale bar graph

SP295 SoundPro Contractor Version Form7271A Operation Manual
5
Display Range: 0.02% to 50% THD+N Accuracy: ± 5% Test Frequencies: 63 Hz, 125 Hz, 250 Hz, 500 Hz, 1 kHz, 2 kHz, 4 kHz
Signal-to-Noise Ratio Method: Samples the device’s full-scale signal output and its noise floor and computes the device’s S/N ratio. Inputs: Microphone and line Display Simultaneous display of left and right channel Range 120 dB; minimum noise level -80dBu, maximum signal level +40dBu
Tests Auto HT Tests Method: Controls DAG5161 for automated calibration procedures. Tests: Speaker Level Balance, Speaker Polarity, Speaker Time Delay, Reverb Decay, Early Reflections, Ambient Noise, LFE Frequency Response, System Frequency Response Auto Time Delay Method: Uses test signal from DAG5161 for time delay calibration. Tests: Time Delay Speaker Calibration Polarity Tests Method: Uses DSP analysis to determine the polarity of the applied test pulse vs. the signal picked up by mic or applied to the line input. Tests: Speaker, Mic, or Equipment (audio signal chain) polarity Range: Speaker test: 0 to 500 feet, speaker to SoundPro.
Power Tests Cable Test Method: Applies digital wiremap test to check for opens, shorts, crosses, and analog transmission test to compare transmission loss at 1 kHz and 20 kHz. Connector Types Tested: RCA, XLR, ¼" balanced and unbalanced, XLR to ¼" Display: Graphical wiremap, attenuation loss
Utilities Audio Scope Sample Rate: 48 kHz Displays: mV vs. time (line in), mPa vs. time (mic in), or X-Y phase display Display Amplitude: 15.6 – 1000 mV/div (line in), 7.8 – 500 mPa/div (mic in) Accuracy: ± one pixel of display, 20 Hz to 22 kHz
Monitor Amplifier Frequency response: Signal sampled at 48kHz 16-bit Amplification: Line input: variable 0-22 dB gain with selectable 40 dB amp or 40 dB pad, 60 dB gain maximum Mic input: variable 0-22 dB gain Load impedance: 32 ohms minimum Inputs: Microphone and stereo line

SP295 SoundPro Contractor Version Form7271A Operation Manual
6
Outputs: Summed into mono, line outputs (XLR, 1/4", RCA phono jack), built-in speaker, headphone jack. Output Level: Variable from -79 to 0 dB
Save Settings Setup & Calibration PC Interface/About Phantom Power Test Method: Measures DC voltage on XLR "+" and "-" pins (pins 2 & 3) Accuracy: ± 0.2 volts
General Display: 64 x 128 pixel super-twist LCD, w/LED backlight Size: 10 3/8” x 6” x 3 3/4” (HWD) Weight: 3 lbs. 5 oz., 1502 g. Battery: 6 volt rechargeable lead-acid cell provides 2-4 hours of service Battery Life Display: accurate to +/- .02VDC. AC Adapter/Charger: 6v @ 800ma Non-Volatile Memory: 40 graph data storage locations Inputs:
Connector(s) Impedance Range Min. Level Max. Level Microphone N/A MicL 30 dB SPL 95 dB SPL MicH 70 dB SPL 130 dB SPL XLR, ¼" 40k ohms RCA Phone 20k ohms ExtL –95 dBu –35 dBu Ext –75 dBu +7 dBu ExtH –40 dBu +40 dBu
Outputs: Connector(s) Impedance Polarity XLR balanced mono 300 ohms + (hot) on pin 2 ¼" balanced mono 300 ohms + (hot) on tip RCA unbalanced mono 150 ohms + (hot) on tip ¼" unbalanced stereo 300 ohms + (hot) on tip and sleeve

SP295 SoundPro Contractor Version Form7271A Operation Manual
7
Controls
1/4" balanced
mono output
XLR balanced mono output
RCA phono unbalancedL&R inputs
Speaker Microphone
input
XLR & 1/4" balanced
L&R inputs
1/4" Stereo Headphone
output
RCA phono
unbalanced mono
output
Power On/Off
AC Power input/battery
charger
Control Knob
Serial Interface

SP295 SoundPro Contractor Version Form7271A Operation Manual
8
Accessories Supplied
Power Adapter/Charger TC600CD Installer's Guide to Home Theater Audio Microphone extension cable; 15 ft., BNC male to BNC female Serial interface adapter cable; 6 ft
Optional:
CC294 Soft Carry Case
Specifications and accessories subject to change without notice.

SP295 SoundPro Contractor Version Form7271A Operation Manual
9
QUICK START No time for manuals? You can be up and running the SoundPro's FFT Real-Time Analyzer function in just 5 minutes. Work through this quick start example to jump-start your SoundPro and learn the basics of SoundPro operation. Turn it on. Plug the AC adapter into an AC outlet and into the SoundPro Power Input jack. Turn on the power switch and the unit identification screen appears with a loading countdown at the bottom of the screen. (Don't turn the control knob clockwise during this loading countdown or you'll enter the Serial Download mode. If you do, turn off the power switch to exit.)
Navigate the menus. Soon you'll see the main menu with five line items: SPL, Acoustics, TechBench, Tests, and Utilities. Turn the control knob either way to highlight the desired menu. Set the highlight to the Utilities menu item and press the knob straight down to click it. The Utilities menu appears along with a number of function choices. Turn the knob to highlight PC Interface /About and click. You have entered the About function, which displays the unit’s software version and tech support info. This function is just an information display function and does not have any user-selectable data fields. The ‘<’ character means “go back”. With the ‘<’ highlighted, click the control knob and you will return to the About... menu. Move the highlight to the ‘<’ and click again, and you’re back at the main menu. Running a Function. Select Acoustics in the main menu, and then select FFT Analyzer. This is a typical SoundPro function, and it has many more fields than the "About" function has. At the top of the screen you will see the letters FFT in a small box. This is the function name, and is displayed in all function screens as a reminder where you are. Change the display mode. Just to the right of the function name is the word Full. This is an example of a user input field. In this function, Full indicates the display mode; Full (20 Hz –20 kHz analysis), and Low (10 Hz to 332 Hz). Turn the control knob one click clockwise to highlight the display mode field. Click on the field and the screen will re-draw in the “Low” mode.
The name of the function that you are currently using is shown in the upper left of the display.
Rotate the control knob to highlight the desired menu and “click” to select it. Highlight and click '<' to return to the previous menu.

SP295 SoundPro Contractor Version Form7271A Operation Manual
10
Change a data field. Unless you are in a loud environment, the display will be mostly blank. If you see MicH below the FFT function name, turn the control knob to highlight it and click to select MicL. Turn the control knob until the dB range field in the lower left corner is highlighted. Click, and notice that the highlight changes to an underline. You have entered a “control-lock” field. While you are in a control-lock field the data value changes as you turn the knob. Reduce the value until you get visible bars on the graph, then click to release the control-lock.
Change another data field. Turn the knob to move the highlight around the screen. Stop when you get to the number field to the right of the display mode (Full) that has a number 1, 3, 6, or 12 in it. This is the octave band field. Click and this field will change – there is no need for control-lock since there are only four choices. Only fields that have a lot of values use control-lock; on/off fields and fields with a few values change with every click. To change the octave band, continue clicking the knob. You'll see the width of the bars change as you change octave bands.
Try the measurement cursor. Each bar on the FFT graph represents the SPL level of a band of frequencies. To see the exact level and center frequency of each band, turn the knob until the measurement cursor frequency field (Hz) in the lower right corner is highlighted. Click, and the highlight changes to an underline, indicating that you have activated the cursor field control-lock. Now as you turn the knob, you'll see a vertical line move back and forth on the graph; this is the graph measurement cursor. Notice that the numbers both above and to the right of the underline are also changing. They identify the frequency band that the measurement cursor is on and the dB SPL of that band. Click the knob to release the control-lock.
A control-lock field is indicated by an underline. Turn the control knob to change the data. Then click to save and exit the field.

SP295 SoundPro Contractor Version Form7271A Operation Manual
11
Turn on the generator. Turn the knob to highlight the off field just to the right of the word Gen. Click to change it to on. If you plug any SoundPro output except the headphone output into an amplifier and a speaker, you will hear sound. NOTE: In all other SoundPro functions Gen is a selection field that you can click on to jump directly into the Signal Generator function and make adjustments. Because the RTA function uses only pink noise, the Gen field isn’t active.
Save to memory. With a sound RTA graph displayed, highlight the Run field at the upper right of the display. Clicking it turns the test off and freezes the display. The field changes to Hld, indicating that the test is not running. Highlight and click Mem. This takes you to the Memory screen, which allows you to store, recall and manage stored data. The number to the right of the word Memory is the memory storage location, and the word next to the storage location indicates what type of data is currently stored in that memory location (AHT, Noise Std, FFT, RTA, ETG or Unused). To write the data to the location, highlight and click Store. The data is stored and the display returns the test function. To recall stored data, select a memory that has RTA data stored in it, then highlight and click Recall. The RTA function appears displaying the recalled graph data. Note: If you attempt to recall data that is different from the test function you are using, the display will indicate Type mismatch.
SPL field. The SPL field is at the bottom center of the screen. Move the highlight to that field, click to activate control-lock, then turn the knob to choose dB SPL (unweighted), dBA (A-weighted), dBC (C-weighted), or Hz max SPL displays. Now you’re an expert. At this point you know just about everything you need to operate the SoundPro. You can navigate menus, change data values, use the cursor, and store and recall memories. Most of the other SoundPro functions use the same principles of operation, so you should be able to apply what you have just learned to the other functions.
SP295 SoundPro Contractor Version Form7271A Operation Manual
12
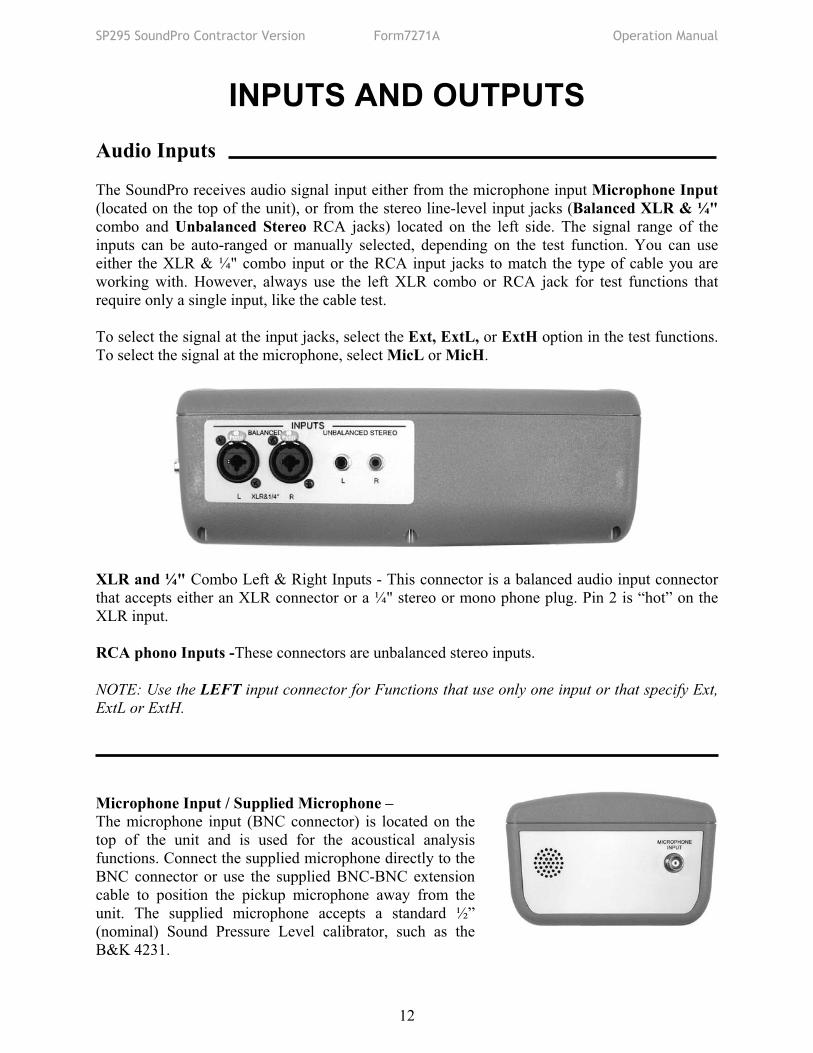
INPUTS AND OUTPUTS Audio Inputs The SoundPro receives audio signal input either from the microphone input Microphone Input (located on the top of the unit), or from the stereo line-level input jacks (Balanced XLR & ¼" combo and Unbalanced Stereo RCA jacks) located on the left side. The signal range of the inputs can be auto-ranged or manually selected, depending on the test function. You can use either the XLR & ¼" combo input or the RCA input jacks to match the type of cable you are working with. However, always use the left XLR combo or RCA jack for test functions that require only a single input, like the cable test. To select the signal at the input jacks, select the Ext, ExtL, or ExtH option in the test functions. To select the signal at the microphone, select MicL or MicH.
XLR and ¼" Combo Left & Right Inputs - This connector is a balanced audio input connector that accepts either an XLR connector or a ¼" stereo or mono phone plug. Pin 2 is “hot” on the XLR input. RCA phono Inputs -These connectors are unbalanced stereo inputs. NOTE: Use the LEFT input connector for Functions that use only one input or that specify Ext, ExtL or ExtH. Microphone Input / Supplied Microphone – The microphone input (BNC connector) is located on the top of the unit and is used for the acoustical analysis functions. Connect the supplied microphone directly to the BNC connector or use the supplied BNC-BNC extension cable to position the pickup microphone away from the unit. The supplied microphone accepts a standard ½” (nominal) Sound Pressure Level calibrator, such as the B&K 4231.

SP295 SoundPro Contractor Version Form7271A Operation Manual
13
Audio Outputs The Generator test signals and Monitor Amplifier output is fed to each of the output jacks (XLR, ¼" phone plug and RCA jack) simultaneously. Any of these jacks may be used for performing the Cable test.
Stereo Headphone / Speaker - This jack provides a 1/4" headphone and stereo line level output. It is the only stereo output on the SoundPro. The headphone output monitors the test signal during many of the test functions. To turn the output on or off for all available functions, set the Sp/Hd field in the Signal Generator control menu to On or Off, and use the Gain field to adjust the volume. The monitor amplifier function provides its own control for the headphone signal. If the headphone output is turned on without a plug inserted in the headphone jack, the audio is routed to the internal speaker. The built-in speaker is located on the front of the unit. It provides an audible pass/fail indication in the Cable Test function. Unbalanced Mono - This jack provides an unbalanced mono audio output, available as a standard RCA phono jack. XLR Balanced Mono - Use this connector when a balanced XLR audio output is needed. Pin 2 is “hot”. ¼" Balanced Mono - This connector is wired in parallel with the XLR output jack above. It provides a phone plug balanced audio output (tip & ring hot, sleeve ground).
Power Input The SoundPro power input takes 6-8 VDC unregulated at a minimum of 500mA. The input connector is a 2.1mm coaxial power connector, positive on the center pin. Use the supplied AC power adapter.
Serial Interface The serial interface jack is used with the supplied Serial Interface Adapter cable for serial computer communications to download stored memory graph data to a computer for use with the SoundPro Audio Report software.

SP295 SoundPro Contractor Version Form7271A Operation Manual
14
OPERATING the SoundPro Power On & Off When you turn on the power switch, a unit identification screen appears momentarily before the main menu appears. The first unit identification screen includes the unit's software serial number and a loading countdown. During this time the main SoundPro software and software upgrades are loaded. The unit is ready to use as soon as the main menu appears; no warm-up time is needed. The SoundPro can be powered off at any time - there is no required shutdown procedure. The SoundPro firmware can be updated or upgraded, as new versions become available. To enter the software firmware upgrade mode, turn the control knob clockwise during the loading countdown. This places the unit in the Serial Download mode. (Complete instructions for updating the software included with the software updates.) Turn off the power switch to exit this mode. A low battery indicator is located at the upper left of the display. Power the SP295C with the AC Adapter when this indicator is on. Allow the SP295C to charge for 8 hours with the power off to completely recharge the battery.
User Interface The SoundPro is controlled by turning and pressing (clicking) the control knob. Turning the control knob moves a display highlight (inverted text) between menu options and fields on the screen. Clicking a highlighted choice selects it. To exit from a function and return to the previous menu or screen, highlight and click on the ‘<’ symbol that is located in the upper left corner of the display. To change the value of a selected field, click the control knob. The highlighted field will either toggle to a new value (fields with only a few possible values) or will change to an underlined “control-lock” (data fields with many possible values). To change the value of a "control-lock" field, click the control knob to "lock" (underline) the field and then turn the knob to change the value. When the desired value is shown, click the control knob again to unlock the control highlight and move to the next field.
Power the SP295 with the AC Power adapter to charge the internal battery when the low battery indicator is visible.
Turn the control knob to highlight a field; then press it (click) to select the field.

SP295 SoundPro Contractor Version Form7271A Operation Manual
15
Menus & Navigation The main menu with five main function categories appears shortly after the SoundPro is turned on. By default the first item is highlighted. Turn the control knob to highlight the different menu items, and select the submenu by clicking the control knob. The submenu lists all of the functions for that category. To select a function, turn the control knob to highlight the desired function and click the knob. The selected function is now displayed. To exit from any function back to the function menu, highlight ‘<’ and click the control knob. To return to the main menu from any function menu, highlight ‘<’ and click the control knob.
Gen and Mem Fields Several functions have Gen and Mem "jump" fields. These "jump" fields allow you to jump directly into the Generator or Memory display functions, perform a task, and return to the first function without navigating through the menus. Functions with a Gen jump field are SLM, Sweeps, Level Meters and Audio Scope. Click Gen to go directly to the Signal Generator display where you can adjust the signal generator's settings. Click the ‘<’ field to return to the previous test function. The
Signal Generator remembers the last modified field and highlights that field the next time you jump to the Generator. The Real-Time Analyzer, FFT Analyzer, ETG, Sound Study, Sweeps, and Auto HT functions provide a Mem jump field. Click this field to go directly to the Memory screen where you can save the current data, recall stored data, or manage stored data. Recalling stored data or clicking ‘<’ returns you to the previous test function.
Saving favorite user settings The SoundPro allows you to store a set of favorite values. Set up the SoundPro the way you like it, then select the Utilities menu and go to the Save Settings function. Click on the Save control. Your settings will be stored in non-volatile memory, and will be restored each time you re-power the SoundPro.
Click the < field that is located in the upper left corner of every display to return to the previous menu.
Click “Gen” to jump directly to the Signal
Generator setup display screen.
Click “Mem" to jump directly to the Memory function to save, recall and manage stored data.

SP295 SoundPro Contractor Version Form7271A Operation Manual
16
SPL Menu Sound Level Meter Description A sound pressure level meter measures the change in air pressure that is created by a sound wave and displays this pressure, relative to the threshold of hearing sound pressure. Weighting curves are usually added to SPL measurements to make SPL readings correspond to the perceived loudness. The SP295C's Sound Pressure Level function measures the loudness of the ambient sound level in standard dB SPL measurement units, autoranged from 30 to 130 dB (A-weighted). Use the SPL function when you need to know objective sound volume, such as when balancing speaker output levels and adjusting room sound levels. The SP295C SPL level is a true-RMS measurement that uses ANSI Type 1 standard
display time averages and weighting. Weighting networks include A, B, and C, plus octave and 1/3 octave filters up to 8 kHz. Slow, Fast, Impulse, Peak, and LEQ averaging modes are provided. SPL measurements may be made using the supplied microphone connected to the Microphone Input, or by connecting a signal to the external inputs. The large, digital display shows the ambient sound level in standard units of dB SPL and the level is also shown on an analog bar graph meter (one pixel equals one dB). An output signal from the internal signal generator is available in the SPL meter function.
SPL Display/Controls The following fields and parameters are displayed in SPL function: (LEQ mode is shown)
Generator Averaging Generator Weighting Input On/Off Level
Max Hold SPL Max Hold Clear Range LEQ Duration
Generator Jump
SPL Analog
SPL
LEQ Control

SP295 SoundPro Contractor Version Form7271A Operation Manual
17
Averaging Use this field to select the averaging that is applied to the SPL reading. Select the averaging field and click the control knob to toggle between the following modes: Slow - 1000 msec. Fast - 125 msec. Imp - Impulse mode 35 msec.
(The above ANSI-standard averaging modes use exponential decay time averaging where more recent sounds have more bearing in the average.) Peak - shows peak SPL, rather than RMS. In
this mode, peak sound levels are held until the mode is changed.
LEQ - equal-weighted average (or time-average SPL). In this mode the SPL is averaged over the period of time selected by the LEQ duration field, with all sounds counting equally in the running average.
Weighting Use this field to select the weighting that is applied to the SPL reading. The following selections are available:
Flat - unweighted A-Wtd - A-weighted B-Wtd - B-weighted C-Wtd - C-weighted O - Full octave-band filters: 31, 63, 125, 250,
500, 1k, 2k, 4k, 8k t - 1/3 octave-band filters: 50, 63, 80, 100, 125,
160, 200, 250, 315, 400, 500, 630, 800, 1k, 1.2k, 1.6k, 2k, 2.5k, 3.1k, 4k, 5k, 6.3k, 8k
ANSI guidelines suggest using A-weighting for SPLs less than 55 dB and C-weighting for SPLs greater than 85 dB. To change the weighting, highlight the field and click the control knob to select the desired weighting. Input The SLM function is calibrated for use with the supplied microphone, or with a signal applied to the external inputs. The SPL range is 30 dBA to 130 dBA with two autoranged microphone ranges. Highlight the Input Range field and click the control knob to toggle between these ranges and inputs:
Mic - microphone input. Auto ranges between 25 dB to 90 dB SPL (L), and 70 dB to 130 dB SPL (H).
ExtL - external input, -80 dBu to -30 dBu Ext - external input, -50 dBu to +7 dBu ExtH - external input, -10 dBu to +40 dBu
Range Provides an indication of which measurement range is selected. The displayed value corresponds to the selected input.
L - Mic input, autoranged to low H - Mic input, autoranged to low X - External input selected O - overrange; if this appears when an
external input is selected, select the next higher input range. This indication may momentarily appear when the mic input is selected as the SP295C auto ranges.
Max Hold SPL This field displays the highest SPL reading. The reading is constantly updated and displayed. Max Hold Clear Click to reset the Maximum Hold SLM value. Generator Jump - Click this field to jump to the Signal Generator control screen and return to the SPL function. Generator On/Off Click this to toggle the signal generator on and off. Generator Level This field allows you to adjust the signal generator level. Highlight the field and click to select it (underlined). Turn the control knob to the desired level, and click to set the level. LEQ Duration (visible only in LEQ average mode) Use this field to set the time period that is used for the LEQ average mode. Once started, the test will run for the selected time. All SPL measurements during this time period will be averaged together.
manual - user controls start and stop time 10 sec 1 min, 5 min, 10 min, 15 min 1 hr, 8 hrs, 24 hrs

SP295 SoundPro Contractor Version Form7271A Operation Manual
18
LEQ Time (visible only in LEQ average mode) This field shows how long the LEQ average has been running. During the test the running LEQ average SPL is displayed. LEQ Control (visible only in LEQ average mode) Use this field to start and stop the LEQ averaging mode. Click to toggle between start and reset.
SPL The numeric display shows the measured SPL with the selected averaging and weighting applied. SPL Analog This bar graph provides an analog indication of the measured SPL, which is useful for quickly interpreting changing SPL levels. The indication has the same averaging and weighting as the numerical SPL reading.
SPL Operation
1. Connect a constant-level signal to the audio system. SPL tests require a constant-level signal, such as a single-frequency test tone or wide-band pink noise. To use the SP295C as the signal source, connect a cable from an output connector to the desired audio system input. Caution: Preset the amplifier gain to minimum to prevent speaker damage when the SPL test is turned on. There will not be an output until the SP295C's signal generator is turned on.
2. Position the microphone. For many tests, such as setting speaker level balance, the
microphone should be positioned in the center of the listening area. 3. Select the averaging mode.
� Use slow (1000 mS time-averaged) for most SPL measurements. This averages transients and provides the best indication of the sound level that our ears hear.
� Use fast (125 mS time-averaged) to see noise spikes or to follow fast audio changes. 4. Select the weighting filter.
� Use A-weighting for low SPL levels below 55 dB. � Use B-weighting for SPL levels between 55-75 dB. � Use C-weighting for louder SPL levels above 75 dB, including most system
measurements. 5. If you are using the SP295C as the signal source for the audio system: � Jump to the Signal Generator function and set up the generator as desired; � Turn the generator on by clicking the "on/off" field. � Adjust the generator output level.
6. Read the SPL level. The SPL reading in the upper right is the peak SPL reading.
Highlight the "Max" field and click the control knob to reset this reading.

SP295 SoundPro Contractor Version Form7271A Operation Manual
19
Sound Study Graph Description Often it is important to view SPL levels over an extended time, such as analyzing noise sources in a room, monitoring outside noises such as traffic, or to track concert or PA sound levels. The SP295C Sound Study Graph function provides a graphical plot of SPL over extended time periods. Time periods are selectable from 1 minute to 24 hours. The selected time period is divided into 120 equal intervals that show either the time-average or peak SPL. Up to 40 plots can automatically be stored to memory. Each stored plot can be recalled and the SPL at each of the intervals can be analyzed. Either peak or average SPL can be measured using A, B, C, octave, or 1/3 octave band filters. As the function is running, either the time-averaged (LEQ) level or peak level is displayed and plotted. After the graph is complete, the LEQ of the entire time is displayed and stored with the plot. Sound Study Display/Controls The following fields and parameters are displayed in Sound Study Graph function:
SPL Mode Weighting Run/Hold
SPL Level
Input
dB Scale
Memory Jump Memory Saves Measurement
Cursor Time Period
Cursor Time Cursor SPL

SP295 SoundPro Contractor Version Form7271A Operation Manual
20
Input The Sound Study Graph function is calibrated for use with the supplied microphone, or with the external inputs. The SPL range is 30 dBA to 130 dBA using two user-selectable ranges. Highlight the Input Range field and click the control knob to toggle between ranges and inputs:
MicL - microphone input, 25 dB to 90 dB SPL MicH - microphone input, 70 dB to 130 dB SPL ExtL - external input, -80 dBu to -30 dBu Ext - external input, -50 dBu to +7 dBu ExtH - external input, -10 dBu to +40 dBu
SPL Level When the test is running, this field displays either the peak SPL of the current sound (Peak), or the running average SPL of the measured sounds (Avg), as selected by the SPL Mode field. When the test is in the Hld mode, (after a sound study is completed or when a recalled plot is displayed) the field shows the average SPL of the entire time period. If you stop the test during a sound study, the average includes only the measurements that were made to that point. Note: The SPL Level field shows only the average SPL on recalled graphs, even if they were made in the Peak mode. SPL Mode Use this field to select between Avg or Peak SPL display.
Avg - This mode provides an equal-weighted average SPL (or time-average SPL). In this mode each vertical bar represents the average SPL over a time interval that is 1/120 of the total time selected in the Time Period field. For example, if a 1-hour time period is selected, each vertical bar represents the SPL averaged over 30 seconds. A line will appear over a bar if an SPL level exceeded the SP295C's measurement range during that interval. The SPL Level field shows the running SPL average over the elapsed test time and for the entire sound study graph when the test is completed.
Peak - This mode displays the maximum peak SPL of the measured sound. In this mode, each vertical graph bar represents the peak SPL that occurred during a time interval that is 1/120 if the total time selected in the Time Period field. For example, if a 1-hour time period is selected, each vertical bar represents the peak SPL during a 30-second interval. The SPL Level field indicates the peak SPL level of the current sound that is applied to the SP295C. The Peak reading updates even when the test is in the Hld mode or after the sound study is completed.
Weighting This field selects the ANSI weighting that is applied to the measurements:
Flat - no weighting A-Wtd - applies A-weighting curve B-Wtd - applies B-weighting curve C-Wtd - applies C-weighting curve t 25 - 8k - applies selected 1/3 octave band
filter o 31 - 8k - applies selected full octave band
filter Run/Hold Click on this field to run the sound study or to stop the measurement and hold the display. Click to toggle between Run and Hld. Memory Jump (Mem) Clicking on this field stops the sound study test and opens the Memory display screen, where you can save the current Sound Study plot or recall a previously stored plot. Sound Study plots can be stored in any of 40 non-volatile memories (0-39), and can be saved automatically as they complete by setting the Memory saves field to "1" or higher. A recalled plot can be analyzed by using the cursor to read the SPL levels at desired time intervals. Memory Saves Up to 40 individual sound study plots can be automatically saved. This allows you to perform a sound study over an extended time.

SP295 SoundPro Contractor Version Form7271A Operation Manual
21
Also, saving several shorter time duration plots rather than one longer plot (i.e. 12, 5-minute plots vs. a single 1-hour plot) allows you to analyze SPL variations in more detail. As each plot is completed, the SP295C automatically saves the plot in the next available unused memory location and then begins a new plot. Each plot uses the same time duration, input and SPL mode that you select before beginning the test. Set the Memory Saves field to the number of plots that you want to have automatically saved:
0 - The sound study plot will not be automatically saved when it completes (you can save it manually).
1 - One sound study plot will be performed and automatically saved
2 - 40 - The selected number of sound study plots will be made and automatically saved
Note: To use auto save, you must have at least as many unused memory locations as plots that you want to save. Additionally, you must select the lowest available memory location before beginning, as the auto save will not wrap around from location 39 to 0. Use the Memory screen to erase memories and set the starting location. As each sound study plot completes, this number decreases to show the remaining sound studies that will be made and saved to memory. At the completion of each sound study plot, the display momentarily switches to the memory screen while the plot is being saved. When all of the plots are completed, the screen returns a blank Sound Study display screen with "0" in the Memory Saves field. Measurement Cursor The measurement cursor is a vertical bar that you can position horizontally along the plot. It allows you to read the SPL at each of the
measurement intervals. To position the measurement cursor, highlight the "Cursor Time" field and click to select it (underlined). Rotate the control knob to move the cursor. Time Period Use this field to select the total time duration of the sound study plot. Each vertical bar in the plot represents a time interval that is 1/120th of the selected time period. You can select 1min, 5min, 10min, or 15min (minutes), or 1hr, 2hr, 8hr, or 24hr (hours). Cursor SPL This field shows the average or peak SPL of the time interval that is under the measurement cursor. You can make cursor measurements in the Run, and Hld modes, and on recalled plots. When you recall a stored plot, the SPL will be either average or peak as indicated by the value that gets recalled in the SPL Mode field. (Toggling between Ave and Peak on a recalled graph will not change the dB reading). Cursor Time As you move the measurement cursor, this field shows the time of the highlighted plot interval, referenced to time 0 at the left side of the plot. The time changes in increments that are 1/120th of the selected Time Period. When you recall a stored plot, the time period is indicated by the value that gets recalled in the Time Period field. dB Scale This scale shows a reference of the dBSPL level. The 10 dB reference marks are provided only for quick reference. Use the measurement cursor to determine the exact SPL levels at the desired times on the plot.

SP295 SoundPro Contractor Version Form7271A Operation Manual
22
ACOUSTICS Menu
Real-Time Analyzer Functions
Description A Real-Time Analyzer provides a graphic display of an audio system's frequency response that shows frequency vs. sound pressure level. To produce this graph the audio frequency spectrum is analyzed in sections. The 20 Hz to 20 kHz audio frequency spectrum consists of ten octave bands. However, displaying the spectrum in 1-octave band segments provides insufficient detail to see many frequency response peaks and dips. Usually a smaller frequency band, such as 1/3, 1/6 or 1/12 octave is desired for making acoustic measurements and adjustments. The SoundPro Contractor provides two RTA octave band analyzer functions – “Real-Time Analyzer” and “FFT Analyzer”. The two RTA functions differ only in how the internal measurements are made, and the corresponding analyzing speed and resolution. Both RTA functions have the same weighting, averaging and other control options. Use the RTA functions to analyze the frequency response of audio systems and listening rooms, and to monitor the results as you re-position subwoofers, adjust room treatments, or change equalizer settings for the most acceptable response. The Real-Time Analyzer function uses fixed filters to provide a very fast, real-time analysis, especially suitable for live voice and music analysis. However, to achieve this speed, only 1 and 1/3 octave band resolutions are available. The FFT Analyzer function uses multiple Fast Fourier Transform analysis to provide a slightly slower, near-real-time display that updates approximately twice per second. The FFT Analyzer provides 1, and 1/3 octave-band resolution, but also adds narrower 1/6 and 1/12 octave bands, especially suitable for analyzing narrow band room frequency response anomalies. Both
RTA functions provide a Full (22 Hz to 21 kHz), and Low (10 Hz to 332 Hz) frequency range. The Filter RTA display shows a single narrow line segment for each octave or 1/3 octave band frequency. The line segments move up and down as they graph changes in the incoming audio.
In the FFT Analyzer, each octave frequency band is graphed as a vertical bar, with the height representing the SPL level of the individual octave or sub-octave bands within the audio spectrum. Both functions include a measurement cursor that allows you to read the actual SPL of the selected octave or sub-octave band.
The Filter RTA function provides real-time audio analysis, limited to either 1 or 1/3 octave band resolution.
The FFT RTA function provides near real-time display with 1, 1/3, 1/6 and 1/12 octave-band resolution.

SP295 SoundPro Contractor Version Form7271A Operation Manual
23
Both RTA functions allow you to use the internal signal generator as a pink noise source. RTA graphs can be stored and recalled for viewing and analyzing at a later time, and the data can also be sent to a computer for the SoundPro Audio Report. The remainder of this section explains the control fields and parameters in both of the RTA functions. RTA Displays/Controls Filter RTA
FFT RTA
Frequency Range
Graph Resolution
Input Range
Graph Range
Average SPL
Run/Hold
Memory Jump
Measurement Cursor
Signal Generator Octave Averaging on/off Band Time
Average SPL Cursor Cursor Weighting Frequency SPL
Frequency Range
Graph Resolution
Input Range
Graph Range
Average SPL
Test Run/Hold
Memory Jump
Measurement Cursor
Signal Generator Octave Averaging on/off Band Time
Average SPL Cursor Cursor Weighting Frequency SPL

SP295 SoundPro Contractor Version Form7271A Operation Manual
24
Frequency Range Highlight this field and press the control knob to toggle between two frequency ranges:
Full - 22 Hz to 21 kHz Low - 10 Hz to 332 Hz
Octave Band This field controls the width of the bands into which the frequency spectrum is “sliced”. Highlight the field and press the control knob to toggle between the octave bandwidths.
1 = full octave 3 = 1/3 octave 6 = 1/6 octave (FFT RTA only) 12 = 1/12 octave (FFT RTA only)
Averaging The RTA functions provide three different types of averaging - exponential decay, equal-weighted time, and peak hold. To select the averaging, highlight the field and click the control knob to select (underline) the field. Turn the control knob until the desired averaging is displayed, then click to select the new value. Exponential decay averaging - 1, 3, 6, 10, 30 or 60 In this averaging, the more recent sounds have a larger bearing on the displayed average. Sound is averaged over the selected time in seconds. Use this averaging when you want the display to reflect changes that are occurring in real time, such as analyzing music, or adjusting an EQ. Longer time constants produce a more stable display, but slower response to changing sounds. Equal-weighted Time Averaging - Avg All sounds count equally in the running average. The time duration of this mode needs to be started and stopped manually by clicking Run/Hld. A typical application for this averaging is to walk around a room and average read pink noise levels at several locations. You can pause the measurement as you move to a new location.
Peak Hold Mode - Hld In this mode, peak sound levels are held until the mode is changed. Use this to monitor maximum sound levels by frequency over time. Run/Hold Click on this field to run the RTA measurement or to stop the measurement and hold the display. Select Run to collect ambient sound energy data. Select Hld to temporarily stop Equal-weighted Time Averaging tests, to "freeze" the displayed graph to make cursor measurements, or to store the graph data to memory. Memory Jump (Mem) Clicking this field pauses the RTA measurement and opens the Memory display screen, where you can save the current RTA graph or recall a previously stored graph. RTA graphs can be stored in any of 40 non-volatile memories (0-39). Each location can store either a Full or Low frequency graph. When recalling a stored graph, the RTA Frequency Range must be set to the same frequency mode (Full or Low) as the graph being retrieved, otherwise "type mismatch" will be displayed. Additionally the RTA function must match the stored data; RTA data must be recalled by the Filter RTA, and FFT data must be recalled by the FFT RTA. A recalled graph can be analyzed exactly the same as a live graph - by changing the octave band filter size, graph amplitude range, and using the cursor to read individual band frequencies and dB levels. Weighting Curve Use this field to select the weighting that is applied to the displayed graph. Select F (flat, no weighting), A or C ANSI weighting, or X (inverse of Cinema X curve). With "X" selected, the RTA will show a flat line when analyzing pink noise if the sound meets the ANSI Cinema X curve standard.

SP295 SoundPro Contractor Version Form7271A Operation Manual
25
Measurement Cursor The measurement cursor is a vertical bar that you can position horizontally along the graph. It allows you to analyze the RTA display graph in detail. To position the measurement cursor along the graph, highlight the "Hz" Measurement Cursor Data field and click to select it (underlined). Rotate the control knob to move the cursor. Cursor Frequency and Cursor SPL As you move the measurement cursor, the center frequency of the selected octave band and the band's corresponding dB SPL level are shown in the lower right fields of the graph display. You can make cursor measurements in either the Run or Hold modes, and on recalled graphs. Average SPL The average SPL level of the sound applied to the SP295C is displayed digitally. This SPL is calculated from the RTA bands and is slightly less accurate than the SP295C's main SPL function. Use the Average SPL Weighting field to apply the desired weighting curve to the reading. Average SPL Weighting This field selects the weighting that is applied to the average SPL reading. Select SPL (flat, unweighted), A (A-weighted) or C (C-weighted). To change the weighting, highlight the weighting field and click the control knob to select it (underlined). Turn the control knob until the desired weighting value is displayed and then click to select the new value. Input Range The Real-Time Analyzer functions are calibrated for use with the supplied microphone, or with the external inputs. The SPL range is 30 dBA to 130 dBA using two user-selectable ranges. Highlight the Input Range field and click the control knob to toggle between ranges and inputs:
MicL - microphone input, 25 dB to 90 dB SPL MicH - microphone input, 70 dB to 130 dB SPL
ExtL - external input, -80 dBu to -30 dBu Ext - external input, -50 dBu to +7 dBu ExtH - external input, -10 dBu to +40 dBu
Graph Range This field sets the lowest dB SPL level within the selected input range that is measured and displayed on the graph. The graph range is adjustable in 5 dB steps from 25-135 dB (MicL range) or 70-135 dB (MicH range). Highlight the field and click the control knob to select the field (underlined). Turn the control knob until the desired value is displayed and click to select the new value. Graph Resolution Click the dB number at the top of the left graph axis to change the vertical graph resolution to either 1 dB/pixel (provides a 35 dB graph range) or 0.5 dB/pixel (provides a 17 dB graph range). Note: The graph resolution dB number changes as the graph range changes, but it is always either 17 or 35 dB higher than the graph range number at the bottom of the axis. Signal Generator The FFT and Filter RTA generator function provides a pink noise signal for system testing. Only a pink noise signal is provided because RTA octave-band analysis requires pink noise for proper amplitude vs. frequency display. Click On/Off to toggle the pink noise generator on or off as desired. The output signal level defaults to the level that is set in the Signal Generator control screen. Note: Setting the RTA function to Hld turns off the pink noise output.

SP295 SoundPro Contractor Version Form7271A Operation Manual
26
RTA Operation
1. Connect a constant-level pink noise signal to the audio system. Accurate and meaningful RTA tests require a pink noise sound source. To use the SP295C as the pink noise signal source, connect a cable from an output connector to the desired input on the audio system. There will not be an output from the system until both the RTA and Signal generator are turned on in the RTA display. The output level of the RTA pink noise is adjustable in the Signal Generator setup menu. Caution: Preset the amplifier gain to minimum to prevent speaker damage when the RTA test is turned on.
2. Position the microphone. For home theater calibration, an RTA reading should be taken at
each seat in the listening area with the microphone placed at ear level. Adjust the system for the best overall RTA response at all seating locations.
3. Select the frequency range:
� Use low (10Hz to 332Hz) to analyze and perform low frequency equalization. � Use full (20Hz to 20kHz) to analyze and equalize the entire audio spectrum
4. Select the octave band filter resolution. Use 1/12 octave (12) for most RTA analysis, as
this provides the best spectrum resolution.
5. Select the averaging time constant. Longer times provide a more stable display, while slower times respond more quickly to changing sounds and noise. Use 6 second (or longer) averaging when performing low frequency equalization.
6. Select the desired weighting. Use C-weighting for most applications.
7. Set the input range. Use MicL for most applications. If an input overload occurs
(“Overload” indication on the display) select the MicH range.
8. Turn on the pink noise. If you are using the SP295C as the signal source, turn on both the RTA function (Run) and the generator (On).
9. Adjust the Graph Range and Graph Resolution. Adjust the range and resolution so that
the entire graph display fits on the vertical axis. Depending on the SPL difference between the highest and lowest levels, you may need to use 35 dB resolution to see the entire graph
� If the vertical bars are too short or not visible: � set the Input Range to MicL � set the Graph Amplitude Range to a lower dB value � If the vertical bars are too tall or appear clipped: � select 35 dB Graph Resolution � set the Graph Range to a higher dB value
10. Use the measurement cursor to read the exact dB level and frequency of any
frequency band on the graph. Select Hld to freeze the display.

SP295 SoundPro Contractor Version Form7271A Operation Manual
27
Energy-Time Graph Description Because sound travels only about 1130 feet/second, sound time delays caused by even relatively short distances can cause audible effects. An energy-time graph shows the relationship between time and SPL. The SoundPro's ETG function applies an exciting pulse through an external amplifier and speaker, and graphically displays the resulting energy decay of the sound reaching the microphone. The graph represents the instantaneous SPL levels at specific times after the exciting pulse occurs, and is calibrated vertically in dB (SPL), and horizontally in either time or equivalent distance (based on a sound travel speed of 1130 ft/sec). In the external trigger mode, an impulse sound such as a hand clap can be used to trigger the EGT measurement. The function runs in real time, so you can view changes as they occur.
Standard A, B or C weighting, as well as octave and 1/3 octave weighting may be applied to the graph. A weighting is usually used with this function to minimize the undesired graph interference from low frequency ambient noise. Use the ETG function to pinpoint room or speaker reflections, measure the Initial Time Delay Gap (ITDG) to characterize room acoustics, accurately set A/V processor time delay, calibrate speaker phasing delay times in multi-zone sound reinforcement systems, and compute reverberation times. Use shorter time/distances to identify early speaker reflections and check PA speaker phasing, and longer time/distances to determine room reverberation times and ITDG.
Energy-Time Display Controls
Horizontal Trigger Memory Horizontal Axis Units Mode Jump Axis Range
Input Range
RT0 Marker
dB Scale
Weighting
Measurement Cursor
RT0 Marker Set/ Cursor Cursor H. Axis Full Graph Offset Location SPL Scale
Test Run/Hold Initial Delay RT Time RT Select

SP295 SoundPro Contractor Version Form7271A Operation Manual
28
Run/Hold Click on this field to run the ETG measurement or to stop the measurement and hold the display. Select Run to collect sound energy decay data. Select Hld to "freeze" the displayed graph, to make cursor and RT time measurements, or to store the graph data to memory. Initial Delay This field displays the time or equivalent distance of the first pulse that arrives at the microphone. The number will be in whatever units you select in the Horizontal Axis Units field. Initial time delay is very helpful in finding speaker system delay times. Note: Initial delay time is only displayed on an active measurement graph - graphs that are recalled from memory display 0.00. Use the measurement cursor to determine the initial delay time on a stored graph. Memory Jump (Mem) Clicking on this field pauses the ETG measurement and opens the Memory display screen where you can save the current graph or recall a previously stored graph. ETG graphs can be stored in any of 40 non-volatile memories (0-39). Recalled ETG graphs can be analyzed for RT10-60 times and for SPL using the measurement cursor and RT0 marker. The horizontal range, measurement units and weighting of a recall graph cannot be changed. Weighting Use this field to select the ANSI weighting that is applied to active graph (Run mode). The following selections are available:
Flat - unweighted AWtd - A-weighted BWtd - B-weighted CWtd - C-weighted o - Full octave-band filters: 31, 63, 125,
250, 500, 1k, 2k, 4k, 8k
t - 1/3 octave-band filters: 50, 63, 80, 100, 125, 160, 200, 250, 315, 400, 500, 630, 800, 1k, 1.2k, 1.6k, 2k, 2.5k, 3.1k, 4k, 5k, 6.3k, 8k
To change the weighting, highlight the field and click the control knob to select the desired weighting. dB Scale This scale shows the dBSPL energy level with 10 dB reference marks and is provided only for quick reference. It has a fixed 70 dB range (30-100 dB Ext and MicL, 60-130 dB MicH) Use the measurement cursor to determine the exact dBSPL levels at the desired location on the graph. Horizontal Axis Units This field controls what measurement unit is displayed along the horizontal (X) graph axis. The axis can display time (milliseconds), or the equivalent sound travel distance (feet or meters). This field also determines the measurement units of the Initial Delay reading. Use the Horizontal Axis Range field to set the full-scale range. The following options are available:
ms - milliseconds (7680 full scale range) ft - feet (8678 full scale range) m - meters (2641 full scale range)
To change the measurement units, turn the control knob until the field is highlighted and click to toggle between units. Horizontal Axis Range This field controls the full-scale range of the horizontal (X) axis. The selected full-scale range is also displayed in the Horizontal Axis Full Scale field located in the far bottom right corner of the display. The following range selections are available:
mS units - 15, 30, 60, 120, 240, 480, 960, 1920, 3840, 7680
ft units - 16, 33, 67, 135, 271, 542, 1084, 2169, 4339, 8678
Meter units - 5, 10, 20, 41, 82, 165, 330, 660, 1320, 2641

SP295 SoundPro Contractor Version Form7271A Operation Manual
29
To change the time/distance range, highlight the field and click the control knob to select it (underlined). Turn the control knob to select the desired range, and click to select it. Measurement Cursor The measurement cursor allows you to analyze the ETG graph in detail as you move the cursor horizontally along the graph. Use it along with the Cursor Location and Cursor SPL fields to determine the time/distance and SPL level of points on the graph. The measurement cursor can be used on active and recalled ETG graphs. To move the measurement cursor, highlight the Measurement Cursor field and click the control knob to select it (underlined). Rotate the knob to move the measurement cursor. Cursor Location The Cursor Location field shows the time or equivalent sound travel distance from the source pulse (left edge of the graph) to the current cursor position. The displayed units are determined by the selection in the Horizontal Axis Units field. Cursor SPL The Cursor SPL field shows the peak dBSPL level of the sound at the current cursor position. The SPL reading has the selected weighting applied. Input Range The ETG function is calibrated for use with the supplied microphone, or with the external inputs (left channel only). The SPL range is 30 dBA to 130 dBA using two user-selectable ranges. The display shows "Overload" when the peak level of the applied signal exceeds the measurement range.
MicL - microphone input, 30 dB to 100 dB SPL MicH - microphone input, 60 dB to 130 dB SPL Ext - external input, -10 dBu to +40 dBu
Highlight the Input Range field and click the control knob to toggle between ranges and inputs.
Note: Use only the left input connectors with the Ext input. RT0 Marker Set/ Graph Offset This field performs two different functions, depending on whether the test is in the Run or Hld mode. Graph Offset - When the ETG test is in the Run mode, this field allows you to shift the horizontal axis to the left, allowing you to see times or distances that would normally be off the right side of the graph. Each turn of the control knob shifts the axis by 20% of the full scale range, up to 8x the selected range. As the graph shifts, the Cursor Location and Horizontal Axis Full-Scale fields are updated. RT0 Marker Set - When the ETG test is in the Hld mode, this field positions the RT0 Marker. The location of the RT0 marker is show in time or distance, depending on the setting of the Horizontal Axis Units field. "RT 0" also appears in the display field. Set the Test Run/Hold field to Run to offset the graph, or to Hld to position the RT0 marker. Then highlight the field and click the control knob to select the value (underlined). Turn the control knob to shift the graph or position the marker. Click the control knob again to accept the value. RT0 Marker The RT0 marker is a small marker located just above the graph that looks like a "T". It is used to set the starting point for RT10-60 calculations. You can move the marker to any point to the left of the measurement cursor, and you should position it at the start of the decay slope. Use the RT0 Marker Set field to position the marker. RT Select RT60 is defined as the time it takes a sound to decay by 60dB. It is often used to characterize rooms for reverberation decay time. The ETG function allows you to calculate reverberation times from a sound energy decay slope, using

SP295 SoundPro Contractor Version Form7271A Operation Manual
30
the RT0 Marker and measurement cursors. Select from the following:
RT10, RT20, RT30, RT40, RT50, RT60. RT Time This field shows the desired RT10-60 time that is extrapolated from the points marked on the decay slope by the RT0 Marker and measurement cursor. Measured decay times that are less than the desired decay range (i.e.; 60 dB for RT60) are mathematically projected, at the measured decay rate, to the desired RT measurement. The RT time is shown in milliseconds.
Trigger Mode The ETG graph shows the time relationships of sounds, based on a trigger sound pulse. This trigger pulse is time/distance 0 at the far-left side of the graph. Two trigger modes are provided. I - Internal trigger: Use this mode when the SP295C output is connected to an amplified speaker. The graph updates repeatedly with each new output pulse. This is the most common way to use the ETG function. X - External trigger: Use this mode to trigger the ETG using an external sound impulse, such as a handclap. In this mode the graph updates only when it detects a trigger pulse of sufficient SPL level.
ETG Operation Obtaining an Energy-Time Graph (follow these preliminary steps for all ETG applications.)
1. Connect the SP295C Output to the amplifier input. Connect a cable from an SP295C output connector to the input of the audio amplifier. Apply the signal to each speaker individually. Caution: Preset the amplifier gain to minimum to prevent speaker damage when the ETG test is turned on. You will not hear an output from the speakers until the test is turned on.
2. Select the Horizontal Axis Measurement. Use a distance display (ft, m) for locating
reflections and the ms time display for ITDG measurements.
3. Select the Horizontal Axis Range. To locate reflections, select a distance that is just longer than the total distance from the speaker, to the rear wall, to the center of the listening position (microphone location). Use 60 ms for measuring ITDG in a typical-sized home theater room, and use longer times for large rooms.
4. Turn on the test. Be sure the amplifier volume is set to minimum.
5. Adjust the amplifier volume for a good graph. Increase the amplifier volume to obtain
the highest possible signal reading on the ETG graph without signal clipping or excessive speaker distortion. If the signal picked up by the microphone is too loud, the display will indicate "Overload".
6. Select the desired weighting. A-weighting often provides better results because it rolls off
most of the low frequency resonances created by room modes.

SP295 SoundPro Contractor Version Form7271A Operation Manual
31
Identifying Speaker Reflections Reflections occur whenever sound waves strike a hard surface, causing the sound wave to be redirected. Reflections that occur too close to the arrival of the direct sound cause interference.
1. Follow steps 1 -6 above for obtaining an Energy-Time graph. Enable only one speaker at a time to display early reflections from that speaker.
2. Position the SP295C microphone in the center of the listening area.
3. Set the Horizontal measurement to either feet or meters.
4. Select the range that is just longer than the total distance (in feet) of the path from the
speaker, to the furthest wall from the microphone, then back to the microphone.
5. Set ETG function to Hld after obtaining a representative graph.
6. Analyze the data from the graph: � Direct sound -The first peak is the direct sound and is the distance (or time) that the
sound traveled in a straight line from the speaker to the microphone. The time or distance to this peak is shown in the Initial Delay field.
� Reflections -The next peak(s) are reflections. Each peak is the distance that a reflection
traveled from the speaker to the microphone. The peaks that occur within 5-10 milliseconds after the direct sound (a reflection path 5-10 foot longer than the direct sound path) are called early reflections. The peaks should be at least 10-12 dB lower than the direct sound level to prevent stereo imaging degradation.
Direct Sound
Time to direct sound Reflections

SP295 SoundPro Contractor Version Form7271A Operation Manual
32
Determining Initial Time Delay Gap (ITDG) ITDG is the time between the direct sound and the first wall reflection that is within 10 dB of the direct sound level. This time clues the brain as to the room size - longer ITDG equates to larger spaces and “cold” sounding rooms; short ITDG causes early reflection problems. For good home theater acoustics, the ITDG for all speakers should be about 25-30 msec.
1. Follow the steps outlined above for Identifying Speaker Reflections.
2. Set the Horizontal measurement to time (ms).
3. Set the ETG function to HLD after obtaining a good graph.
4. Set the cursor to the direct sound (first peak). Note the dB level and the time.
5. Move the cursor to the right until you encounter a next peak that has an SPL level that is within 10 dB of the direct sound level. Note this time.
6. Subtract the reflection time (step #5) from direct sound time (step #4).
Measuring RT Times Reverberation time is how long it takes for the sound pressure level to decay by a specified dB amount after the sound source is removed. The ETG function allows you to determine RT times from RT10 to RT60.
1. Follow steps 1 -6 above for obtaining an Energy-Time graph. Use A-weighting.
2. Select the desired RT time (RT10, RT20, RT30, RT40, RT50, or RT60).
3. Position the RT 0 marker to the start of the decay curve.
4. Position the measurement cursor to the end of the decay slope.
5. Read the equivalent RT time for the decay slope.

SP295 SoundPro Contractor Version Form7271A Operation Manual
33
Reverb Decay Time
Description When a steady sound is applied to an enclosed space, the sound energy builds until it reaches a constant level. When the sound source is removed, the energy decays over a short period of time. How long the sound energy reflects off multiple surfaces, before it is absorbed by the contents, is decay time. The time for the sound level to decay 60 dB after the sound source is removed, is called reverberation time or RT60. Optimum RT60 depends on the room's size, whether you are listening to speech or music, and listener preferences. Reverberation creates room ambiance - the sense that the performance is taking place in either a large or small space. Too long RT60 causes echoes, too short RT60 makes the room sound "cold" and unnatural. Music requires longer RT60 times for best sound, while speech requires shorter RT60 times to be intelligible. An average-sized home theater should have a RT60 between 0.3 to 0.6 seconds. A room's volume (physical dimensions) and the amount of sound absorption inside the
room (i.e.: carpet, drapery, wall treatment, amount of people etc.) determine it's decay time. Make RT60 decay time measurements with all of the furnishings are in place and, if possible, with someone seated in each listening position. If the final acoustical panels aren't available, place temporary panels at the speaker mirror points to eliminate early reflections. The SoundPro's Reverb Decay Time test works by first measuring the room's ambient noise level, and then the sound level with the test pink noise applied. The difference in levels is the decay range (at least 26 dB is required for the test to continue). After the decay range dB is determined, the test outputs an interval of pink noise, followed by silence. As soon as the pink noise is halted, the test measures the time needed for the sound level to drop by the decay range dB amount. This time is displayed as the Decay time reading. The RT60 time is determined by extrapolating the decay time to 60 dB.
Reverb Decay Time Display/Controls The following fields and parameters are displayed in Reverb Decay Time function:
Test Control Weighting Max Noise Level Min Noise Level
Decay Range Test Interval
Decay Time RT60 Time
Generator Level
Speaker Distance: value
Speaker Distance: units

SP295 SoundPro Contractor Version Form7271A Operation Manual
34
Test Mode Clicking this field sequences through 4 modes: Off, Set Min, Set Max, and Run RT60. The Reverb Decay function requires you to manually set the ambient noise and maximum sound levels so that the test can determine the dB decay range.
Set Min - Click to store the ambient noise level.
Set Max - The internal pink noise turns on and the room is filled with sound energy. Click to store the maximum noise level.
Run RT60 - The test is performed and the pink noise test signal automatically cycles on and off. The decay and RT60 times automatically update.
Off - The test is stopped and the last readings are displayed.
Weighting This field selects the ANSI weighting that is applied to the measurements, and the filtering that is applied to the pink noise test signal. To change the weighting or filter, highlight the field and click to select the desired weighting:
Flat - no filtering or weighting applied A-Wtd - A-weighting is applied to
measurements (use when measuring SPL levels from 25-55 dB); pink noise is not filtered.
B-Wtd - B-weighting is applied to measurements (use when measuring SPL levels from 55-85 dB); pink noise is not filtered.
C-Wtd - C-weighting is applied to measurements (use when measuring SPL levels from 85-140 dB); pink noise is not filtered.
t 25 - 8k - applies selected 1/3 octave band filter to pink noise
o 31 - 8k - applies selected 1 octave band filter to pink noise.
Max Noise Level This is the maximum sound energy measured with the pink noise test signal applied. Adjust the amplifier's volume and/or SP295C generator output to increase the sound level to approximately 75-85 dB. The Max Noise needs to be least 26 dB higher than the Min Room level to perform a Reverb Decay Time test. Store the maximum noise using the Test Control field. Min Room Level This is the level of the ambient room noise. The minimum room noise must be at least 26 dB lower than the Max Noise Level. If the Min Room level is greater than 50 dB, you need to lower the ambient noise for best test results. Store the minimum noise using the Test Control field. Decay Range This is the dB difference between the Max Noise and Min Room levels minus 6 dB to allow for 6 dB of test headroom. The Reverb Decay test measures the time for the sound energy to decrease by this dB amount. The display automatically updates, and displays '--dB' if the difference between the maximum and minimum sound levels is less than 20 dB. Adjust the sound system's amplifier, the SP295C Generator Level, or reduce the ambient background noise to obtain a decay range greater than 20 dB. Larger dB decay ranges produce better test results; if possible try to attain a decay range greater than 35-45 dB Test Interval Use this field to set the cycle time duration of the pink noise test signal (equal on/off time) in 1-second steps from 2 to 15 seconds. A cycle time that is too short will not allow the sound to build up fully and decay completely. Larger rooms require longer test intervals to allow the sound to build and decay. (Test accuracy is not affected by an unnecessarily long time).

SP295 SoundPro Contractor Version Form7271A Operation Manual
35
Use the following guidelines for selecting test times: Room Volume (cubic feet) Test Time
< 1000 ft3 2 sec 2000 - 5500 ft3 3 sec 5500 - 13,000 ft3 4 sec 13,000 - 25,000 ft3 5 sec 25,000 - 43,000 ft3 6 sec 43,000 - 66,000 ft3 7 sec 66,000 - 100,000 ft3 8 sec 100,000 - 145,000 ft3 9 sec 145,000 - 200,000 ft3 10 sec 200,000 - 265,000 ft3 11 sec 265,000 - 340,000 ft3 12 sec 340,000 - 440,000 ft3 13 sec 440,000 - 550,000 ft3 14 sec 550,000 - 700,000 ft3 15 sec
RT60 Time This field shows the calculated RT60 time. The time is extrapolated from the measured decay time by linearly extending the decay time and dB decay range to correspond to a 60 dB drop in SPL.
Decay Time
This is the actual time needed for the maximum sound level to drop by the dB amount shown in the decay range field.
Speaker Distance (Units & Value) Use these fields to enter the approximate distance that the SP295C microphone is located from the nearest speaker. The Reverb Decay test uses this information to ignore any early sounds that are not part of the normal test, and provides more accurate measurements with transient noise spikes. Select measurement units of either m (meters) or ft (feet). Distances are selectable in 0.1 increments from 4 to 999.9. Generator Level Use this field to adjust the output level of the pink noise test signal. You may need to adjust the generator level to set the maximum noise level for an acceptable decay range. Highlight the field and click to select it (underlined). Turn the control knob to the desired level then click to select the level setting.
Reverb Decay Time Operation
1. Position the SP295C microphone in the center of the listening area.
2. Connect the SP295C output an audio amplifier and speaker system. If you are using an A/V receiver, connect to both the left and right auxiliary inputs using a Y-adapter and select the 5-channel stereo or other DSP mode that drives all the speakers simultaneously without adding reverberation.
3. Set the volume control on the amplifier to MINIMUM.
4. Select the Reverb Decay Time function and desired weighting or filter. Use A-weighing
to roll off the effects of low frequency room modes and provide a better indication of delay time.
5. Adjust the Speaker distance to the distance between the microphone and the closest speaker.
6. Set the Time interval. Use short test times for small rooms and longer test times for larger
rooms and rooms with minimal sound absorption.

SP295 SoundPro Contractor Version Form7271A Operation Manual
36
7. Make sure that only ambient noise is present in the room. The test mode should be Off.
8. Select the Set Min mode. Click to set the Min room level. If this level is greater than 50 dB, decrease the ambient noise for best test results, and better room acoustics.
9. Select the Set Max mode.
10. Increase the amplifier's volume. You should begin to hear pink noise. If you are using one
of the octave or 1/3 octave band filters, you will hear band-limited pink noise.
11. Adjust the amplifier volume and SP295C Generator Level for a Max Noise level of approximately 75-85 dB (without damaging the audio system). This should produce a Decay range reading of at least 30 dB for an accurate reading. If it does not, increase the maximum sound level.
12. Select the Run RT60 mode and read the decay time and RT60 reverberation times. The
test will continue to cycle the pink noise test signal on and off.

SP295 SoundPro Contractor Version Form7271A Operation Manual
37
Noise Criteria
Description All rooms have noise - sound that is present without any energy applied by the audio system. Noise affects the dynamic range of the reproduced audio and interferes with our ability to hear sounds, especially softer sounds. How our ears respond to noise depends on its frequency and loudness. The SP295C Noise Criteria test provides two noise measurements - Noise Criteria (NC) and Speech Interference Level (SIL). Both are methods of measuring the background noise level in a room. The NC and SIL measurements follow ANSI standard S12.2-1995 "Criteria for Evaluating Room Noise". This standard specifies NC curves (Appendix C) that are weighted for the frequencies and sound pressure levels where our ears are most sensitive. NC curves specify the maximum allowable level of noise over the audio spectrum. They are numbered for easy reference, with lower numbers corresponding to less noise. The NC rating of a room is the number of the lowest curve that is not exceeded by any of the background noise.
The SP295C Noise Criteria Test automatically measures the noise level in the nine lowest frequency octave bands (31 Hz - 8 kHz) and compares them to the ANSI standard NC curves. The display shows the NC rating, noise level in the individual octave bands, and the band that is limiting the NC rating. The Speech Interference Level test measures the simple average of the noise contained in the 500 Hz, 1 kHz, 2 kHz, and 4 kHz octave bands. This is an indication of the noise that interferes most with speech. The test displays the SI level, average noise energy level in the individual octave bands, and the band that is limiting the SIL rating. Reducing the noise in the limiting band may allow you to achieve a lower NC or SIL rating. You should perform noise measurements under typical and worst case conditions, including having the room's ventilation system running and outside noises such as street traffic corresponding to the typical listening times.
Noise Criteria Display/Controls The following fields and parameters are displayed in the Noise Criteria function:
Input Test Mode Input Test Mode
SI Level
NC
Curve
Limiting Band
Octave Band Octave Band Octave Band Octave Band Noise SPL Noise

SP295 SoundPro Contractor Version Form7271A Operation Manual
38
Input The Noise Criteria function can be used with the supplied microphone, or by using an external microphone connected to one of the external inputs. Click to toggle between:
Mic - microphone input; 25 dB to 90 dB SPL Ext. - use external balanced or unbalanced
input, Left input. Test Mode Click to toggle between the NC and SIL noise test modes. NC Curve (NC test mode) This is the background noise, expressed as a NC rating. The number is the lowest-level ANSI noise criteria curve that is not being exceeded by the measured noise. SI Level (SIL test mode) This is the background noise expressed as a Sound Interference Level. The number is the average noise level in SIL octave bands.
Limiting Band The frequency displayed here is the octave band that contains the noise level that, if reduced, would allow the NC or SIL to drop to a lower level. NC Octave Band You can measure the level contained within each of the individual nine ANSI-standard NC octave bands (31, 63, 125, 250, 500, 1000, 2000, 4000 and 8000), or four SIL octave bands (500, 1000, 2000, and 4000). The noise within the selected band is indicated in the Octave Band Noise field. To read the noise level within a band, highlight the Octave Band field and click the control knob to select it (underlined). Turn the knob until the desired octave band is displayed and click to select the band.
Noise Criteria Test Operation
1. Connect the microphone to the SP295C. Position the mic in the center of the room.
2. Select the Noise Criteria function.
3. Select either NC or SIL test mode.
4. Read the NC or SIL background noise rating. The value in the NC Curve or SIL field is the room’s background noise rating.
5. Read the octave band that is limiting the rating. The number in the Limiting Band field
indicates the octave band that contains the noise level that is limiting the NC or SIL rating. If you can lower the noise level in this band you will drop the noise rating to a lower level.
View the noise level for any octave band. The number in the Octave Band field indicates the noise level in that particular band. Use this function to view the noise level in the limiting band as you track down possible sources of that noise. Also use this function to plot the noise levels against the NC curve chart in Appendix C to check whether there are equivalent levels of noise in multiple octave bands or primarily in one band.

SP295 SoundPro Contractor Version Form7271A Operation Manual
39
TECHBENCH Menu Level/Freq Counter Description The Level Meter function includes two meters: a stereo audio level meter and a DIN-standard stereo VU/PPM bar graph meter. The stereo meter display also includes a frequency counter that displays the frequency of the signal at both the left and right inputs. Highlight and click the meter field at the top of the display to switch between the VU/PPM and the Signal Level display modes. The signal generator output is available in either level meter function. The Level Meter measures the Left and Right input levels simultaneously, using either pair of SP295C stereo inputs. The level resolution changes with input level. In the range of -9.95 to +8.50, the output level changes in steps of 0.05 dB. Outside this range, the step size is 0.1 dB. Three line-input ranges may be manually selected to accept levels from -95 dBu to +40 dBu, or use auto
ranging. All measurements are performed in averaging mode, which is the same method used by the meters on most tape recorders, consoles, and outboard equipment, so the SoundPro readings conform to the readings of most recording studio signal level meters. The display also shows the frequency of the input signals from 16 Hz to 50 kHz. The VU/PPM meter provides a standard left and right VU (volume units) display using DIN-standard ballistics. The absolute signal level to which the meter’s 0 VU point is referenced may be adjusted from -30 to +20 dBu. The PPM (Peak Program Meter) indicator is a single bar that bounces above the main bar. It is a DIN standard PPM indicator, which does not show the real peak value, but a quicker measurement than the VU bar. The PPM indicator uses the same reference level as the VU meter.
Level/Freq Counter Display/Controls The following fields and parameters are displayed in the Level/Frequency Counter function:
Units(Left and Right)
Level(Left and Right)
Range(Left)
Mode
Frequency (Left and Right) Range (Right)
Generator Generator Jump On/Off

SP295 SoundPro Contractor Version Form7271A Operation Manual
40
Level (separate left and right) These fields simultaneously display the signal levels that are being measured at the left and right input connectors. Frequency (separate left and right) These fields display the frequency of the signal at the left and right input connectors. The range is 16 Hz to 50 kHz. Range (separate left and right input) Click to toggle between the external input signal ranges. The range for the left and right inputs is selected independently.
ExtL - line input low; –95 dBu to –30 dBu Ext - input normal; –77 dBu to +7 dBu ExtH - line input high; –40 dBu to +40 dBu Auto - autorange; –95 dBu to +40 dBu
Units The same signal level measurement units are selected for both channels. Click to toggle between the following measurement units:
dBu - dB scale with 0 dB referenced to 0.775 Vrms (voltage equivalent of 0 dBm)
dBv - dB scale with 0 dB referenced to 1.00 Vrms
Vave - average voltage level Vrms - true RMS voltage calculation of
waveform Vp-p - true peak-to-peak; uses an algorithm
that is accurate for all of waveform types Generator Jump Click to jump to the Signal Generator control display to set up the generator as desired. Click < to return to the Meter display. Generator On/Off The signal generator can be turned on to provide the selected signal to the output connectors. Click to toggle to turn the generator on or off. Mode Click to toggle between the Signal Level display mode and the stereo VU/PPM Meter bar graph meter display mode.
Level Meter Operation
1. Plug one or two audio sources into any of the audio input connectors. Do not plug two sources into the balance and unbalanced jacks for the same channel or the readings for that channel will not be accurate.
2. Select the Level Meter Test mode. The Signal Level meter function is the default
selection when the Meters display is opened. If the VU/PPM Meters function is displayed, highlight the Mode field and click to toggle functions.
3. Select the desired measurement units. The same units are selected for both inputs.
4. Select the input range. As the SoundPro changes ranges, the display may momentarily
read “OVER” or “UNDER” and you may hear the signal bleed through the internal speaker.
5. Read the signal level and frequency. The frequency field will display -- if the frequency cannot be determined (i.e. not a pure tone).
6. Turn on the signal generator as needed.

SP295 SoundPro Contractor Version Form7271A Operation Manual
41
VU/PPM Meters Display/Controls The following fields and parameters are displayed in the VU/PPM Meters function:
Range Click to toggle between the external input signal ranges. The range for the left and right inputs is selected simultaneously.
Ext - input normal; –77 dBu to +7 dBu ExtH - line input high; –40 dBu to +40 dBu.
Generator Jump Click to jump to the Signal Generator control display to set up the generator as desired. Click ‘<’ to return to the Meter display. Signal Generator On/Off The signal generator can be turned on to provide the selected signal to the output connectors. Click to turn the generator on or off. Mode Click to toggle between the Signal Level display mode and the stereo VU/PPM Meter bar graph meter display mode. VU Reference Level This field sets the absolute signal level that serves as the 0 VU reference point. The reference can be adjusted from –30 to +20 dBu in 0.1 dB steps.
VU Numeric (separate left and right) These fields display the numeric value of the VU of the input signal levels, relative to the reference level. VU Graphic (separate left and right) These two bar graphs are an analog display of the VU of the input signal levels, relative to the reference level. PPM Meter (separate left and right) The PPM (Peak Program Meter) indicator is a single bar that bounces above the main bar on each analog VU display. It uses the same reference level as the VU meter. Peak Hold This is the maximum, actual peak signal value of the input signal. These numbers latch the highest value received for both the Left and Right inputs. Peak Clear Highlight and click to reset the peak readings.
Range (Left and Right)
VU Graph (Left and Right)
Peak (Left and Right)
Generator Generator Jump On/Off
Mode
VU Reference (Left and Right)
VU Digital (Left and Right)
PPM (Left and Right)
Max Clear (Left and Right)

SP295 SoundPro Contractor Version Form7271A Operation Manual
42
VU/PPM Meters Operation
1. Plug one or two audio sources into any of the audio input connectors. Do not plug two sources into the balance and unbalanced jacks for the same channel or the readings for that channel will not be accurate.
2. Select the VU/PPM mode The Signal Level meter function is the default selection when
the Meters display is opened. If the VU/PPM Meters function is displayed, highlight the mode field and click to toggle functions.
3. Select the input range.
4. Set the 0 VU reference level.
5. Read the VU and PPM meter levels.
6. Turn on the signal generator as needed.

SP295 SoundPro Contractor Version Form7271A Operation Manual
43
Signal Generator Description The SoundPro's internal signal generator is a general-purpose, crystal-controlled function that generates sine waves, square waves, white noise, and pink noise that you can use for testing, audio analysis, or recording. All signals are available at all of the output jacks and through the internal speaker. The internal speaker is active only when the signal generator display is active. The sine and square wave signals are available at any audio frequency from 1 Hz to
22,000 Hz in 1 Hz increments using the fine tuning mode, and at ISO standard center frequencies using octave or 1/3 octave tuning. These signals are adjustable in level from –78 dBu to +17 dBu. The maximum white noise level is +2 dBu and the maximum pink noise level is 0 dBu. You can store your own default values for waveform type, frequency, and level, by using the Save Defaults function in the Setup & Calibration function.
Signal Generator Display/Controls The following fields and parameters are displayed in the Signal Generator function: Sine, Square and Polarity waveform mode:
Generator On/Off Frequency Resolution Level Adjust Level Units Calibrated Level Speaker/Headphone Gain
Mode
Frequency Adjust
Level Bar Graph
Coarse/Fine Indicator
Coarse/Auto Select
Output Jack
Lock Output
Speaker/Headphone On/Off

SP295 SoundPro Contractor Version Form7271A Operation Manual
44
White and Pink Noise mode:
Impedance mode:
Mode
Generator On/Off Octave Bandwidth Level Set Level Adjust Level Units Calibrated Level Speaker/Headphone Gain
Octave Band
Level Bar Graph
Output Jack
Speaker/Headphone On/Off
Mode
Generator On/Off Test Frequency Resolution Impedance Equivalent Power
Test Frequency
Instruction Summary
Voltage

SP295 SoundPro Contractor Version Form7271A Operation Manual
45
Mode Click and toggle to switch between the following output modes and signals:
Sine - sine wave output Square - square wave output White - white noise (same sound energy at
all frequencies) Pink - pink noise (equal sound energy per
octave) Impedance - provides an impedance test of
any externally connected device. Requires a test cable.
Polarity - signal for signal tracing that has a square wave top and sine wave bottom that makes it easy to visually determine when the waveform gets inverted.
Generator On/Off Highlight this field and click to toggle the generator output on and off. The internal speaker and headphone outputs are turned on and off with the generator if they are selected. Frequency Resolution The field sets the frequency adjustment increments. Click to toggle between:
fine - sine waves are variable from 1 Hz to 20 kHz, and square waves from 1 Hz to 1,600 Hz. (Not selectable in impedance mode).
octave - steps at ISO-standard center frequencies
1/3 octave - ISO-standard 1/3 octave frequency steps
Frequency Adjust Highlight and click (underline) to select this field. Turn the control knob to change the frequency of the audio signals. Frequency may be varied in 1 octave, 1/3 octave, or fine (1 Hz) steps, depending on the selected Frequency Resolution. Level Bar Graph The Level Bar graph provides an indication of the approximate generator output level when the output is on or off. This allows you set the approximate output level before turning the generator output on. (The actual level at the
output jack is measured and displayed in the Calibrated Level field when the generator is on). The numbers above the graph are course steps from -60 to +14 dBu. Each tick mark represents 10 dBu, with the taller tick mark approximately 0 dBu. In the sine, square, and polarity wave modes the graph also provides a fine adjustment range of ±2 dBu, indicated by the numbers below the graph. Level Adjust Click field to enter the signal level adjustment mode; then turn the control knob to set the level. The level is adjustable in 1.5 dBu steps in coarse mode and 0.05 dBu steps in fine mode. Use the Auto/Coarse Select field to switch between course and fine modes. Coarse/Auto Select Click this field to toggle between the level adjustment modes:
auto - The level steps automatically switch between coarse and fine as you turn the control knob. Turning past the end of the fine scale switches to the coarse mode. Reversing the rotation direction in the coarse mode switches to the fine mode.
coarse - this mode locks out the fine adjustment steps and provides only coarse level adjustment.
Coarse/Fine Indicator The field indicates which level adjustment mode is currently selected. As the control knob is turned in the Level Adjust, the � moves next to the top set of numbers (coarse adjustment) or next to the bottom numbers (fine adjustment). Output Jack Use this field with the Calibrated Level reading to measure and display the actual signal level at the output, including the effects of loading. Select:
XLR ¼ bal - balanced output connector RCA unbal - unbalanced output (level 6
dB lower than balanced output)

SP295 SoundPro Contractor Version Form7271A Operation Manual
46
Calibrated Level This value is the measured signal level that is present at the output connector that is selected by the Output Jack field. It includes any loss due to loading caused by the connected device. Use the Output Level Units field to select the measurement units. Low is displayed when the generator is turned off. Level Units This field selects the signal level measurement units that is displayed in the Output Level field. Click to toggle between: dBu, dBv, Vave (average RMS), Vrms (true RMS), and Vp-p (volts peak-to-peak). Lock Output Locking the output causes the generator to attempt to hold the exact output level setting as measured on the output connector, even if the load on the generator changes, or if you change the output frequency. Click to toggle the Lock Output on (indicated by �) or off. Speaker & Headphone On/Off Set this field to On if you want to hear the generator output through the internal speaker and headphone output. The speaker and headphone turns on and off simultaneously when the generator is turned on and off. Speaker & Headphone Gain The speaker and headphone gain may be adjusted from –81.0 dB to 0.0 dB, independently of the line output level. Note: The Speaker & Headphone fields also control the internal speaker output for other SP295C test functions. You can store this user-default using the Setup & Calibration sub-menu in the Utilities menu. Octave Band (pink noise only) The Octave band and Octave Bandwidth fields allow you to band-filter the pink noise. Set the Octave Bandwidth to either octave or 1/3 octave and then use this field to set the center frequency of the pink noise filter. Click
to highlight the field (underlined) then turn the control knob to set the center frequency. Octave Bandwidth (pink noise only) This field selects the bandwidth of the pink noise filter. Click to toggle between:
full - no filtering octave - full octave bands 1/3 octave - 1/3 octave bands
Test Frequency (impedance mode only) Use this field to select the frequency that is applied to the external device during the impedance test. The frequency can be selected in 1-octave or 1/3-octave steps, as selected by the Test Frequency Resolution field. Click to highlight the field (underlined) then turn the control knob to set the center frequency. Test Frequency Resolution (impedance mode) This field selects the frequency steps that can be selected in the Test Frequency field. Click to toggle between:
octave - octave frequency steps 1/3 octave - 1/3 octave frequency steps
Instruction Summary (impedance mode only) A summary of the connections for performing the impedance test is provided as a quick reference. For complete instructions see the Using the Impedance Test section below. Impedance (impedance mode only) This is the measured AC impedance, in ohms, of the load at the selected test frequency. Voltage (impedance mode only) Select one of the common voltages used in audio systems to display the equivalent power that would be required to drive the measured impedance. This voltage is not applied to the device being tested - it is only used to calculate what the power would be. Click to toggle between: 25V, 50V, 70V, and 100V. Equivalent Power (impedance mode only) This field shows the calculated equivalent power that would be required to drive the measured impedance at the selected voltage.

SP295 SoundPro Contractor Version Form7271A Operation Manual
47
Signal Generator Operation Sine, Square and Polarity waves, Pink Noise, White Noise modes:
1. Connect the SP295C Output to the audio amplifier or component input.
2. Set the Output Jack field to correspond to the connector that you are using. You need to select the Output jack only if you are setting the output level to a specified amount.
3. Select the desired signal type.
4. Set the desired frequency (sine and square wave only). To tune to a frequency other than
a standard octave or 1/3 octave center frequency, use the octave or 1/3-octave steps to tune to the closest frequency, then use the fine-tuning to select an exact frequency.
5. Select the desired measurement unit. You need to change the measurement units only if
you need to set the output level to a specified amount.
6. Adjust the approximate output signal level. Use the Level Bar Graph to set the signal generator output level before turning the generator on. The second (taller) tick mark from the right end is approximately 0 dBu. Each tick mark represents approximately 10 dB. To set an exact level, use the coarse mode to set the output close to the desired level; then switch to the fine mode. Note: White and pink noise levels are adjustable only in coarse steps.
7. Turn the generator on and set the exact output level, if needed. View the digital Output
Level field (displayed only when the signal generator is "on") when setting the exact level.
8. Turn the Lock Output on (�) to maintain a constant output level, if the load changes. Impedance Mode
1. Wire a test cable to connect to the external device. This cable is a 1/4" stereo plug that has only the tip and ring hooked up - do not connect the ground. Connect the other end of the wires to test or alligator clips. (This is the same cable used for the Impedance sweep test).
2. Connect an XLR male-to-female cable (standard mic cable) between the SP295C's output and left XLR input. This hookup should be as short as possible for the most accuracy.
3. Plug the test cable into the 1/4” Balanced Mono output jack on the SP295C.
4. Connect the test clips of the test cable to the device you want to measure the
impedance of.
5. Select the desired test frequency.
6. Read the impedance in the SP295C display. You can vary the frequency and check the load impedance at different frequencies.
7. To display the equivalent power, select a desired voltage reference.

SP295 SoundPro Contractor Version Form7271A Operation Manual
48
Sweeps Description The SP295C provides three sweep functions: amplitude, sine wave, and impedance sweep. The sine wave sweep function defines the parameters for the other sweep functions. You can set the beginning and ending frequencies between 20 Hz and 20 kHz, and sweep time from 1 to 99 seconds. The impedance and amplitude plots may be stored and recalled. The Sweeps function provides a Sweep Cal that can be used to calibrate the Impedance and Cable tests. The amplitude sweep plots amplitude vs. frequency. The average signal level in each 1/3 or 1/12 octave band is measured as the frequency is changed in a smooth, ramped sweep. Use the amplitude sweep to plot the frequency response of audio components. The test works with the SP295C line or microphone input, so any audio device having a line input and output, plus speakers, and rooms can be tested for frequency response. The response is displayed graphically, and the
measurement cursor can be used to read the level at the specific frequencies. The sine wave sweep provides a smooth, ramped sine wave frequency sweep between two chosen frequencies over a chosen time period. Use this function to define the sweep parameters for the amplitude and impedance sweep functions. You can set the beginning and ending frequency, and sweep time. The level is set by clicking the Gen field to jump to the Signal Generator control screen. The impedance sweep plots the impedance of an externally connected load in each 1/3 or 1/12 octave band as the signal generator is swept through the selected frequency range. The results are plotted graphically on the screen. The x-axis scale maximum may be varied from 20 to 8000 ohms full scale. In this mode, the frequency is stepped, not ramped, to obtain the most accurate results.
Sweep Display/Controls The following fields and parameters are displayed in the Sweeps function: Sine Wave Sweep Also used to set sweep parameters for impedance and Amplitude sweep modes
Mode
Test Off/Run Start Frequency End Frequency Sweep Duration
Generator Jump

SP295 SoundPro Contractor Version Form7271A Operation Manual
49
Impedance Sweep
Amplitude Sweep
Mode
Test Off/Run Octave Mode Memory Jump Generator Jump Cursor Impedance
Ohms Range
Measurement Cursor
Cursor Frequency
Mode
Test Off/Run Octave Mode Memory Jump Generator Jump Cursor SPL
Input and Range
Measurement Cursor
Cursor Frequency

SP295 SoundPro Contractor Version Form7271A Operation Manual
50
Mode Click and toggle to switch between the following Sweep modes:
Sine Wave - sine wave sweep. Also used to set sweep parameters for impedance and Amplitude sweep modes
Impedance - impedance sweep Amplitude - amplitude sweep Sweep Cal - provides internal calibration. This
calibration is done at the factory and should only be performed as directed by a Sencore Service Technician.
Test Off/Run Highlight this field and click to toggle the test on and off. The internal speaker and headphone output are turned on and off if they are selected. Octave Mode The field sets the frequency step size and horizontal resolution. Click to toggle between:
1/3 octave - plots 30 impedance or amplitude points across the 20 Hz - 20 kHz band
1/12 octave - plots 120 impedance or amplitude points across the 20 Hz - 20 kHz band
Memory Jump Click this field to open the Memory display screen to save the current impedance plot, or recall a stored impedance plot. Impedance plots can be stored in any of 40 non-volatile memories (0-39). Only impedance plots can be recalled from memory when the Impedance sweep mode is selected. A recalled graph can be analyzed using the measurement cursor. Generator Jump Click this field to jump to the Signal Generator control screen to set the level of the output signal. Then click < to return to the Sweeps function. Measurement Cursor The measurement cursor is a vertical bar that you can position horizontally along the plot. It allows you to read the measured amplitude or
computed impedance values for each frequency point on the plot. To position the measurement cursor, highlight the "Cursor Frequency" field and click to select it (underlined). Rotate the control knob to move the cursor Cursor Impedance The value displayed in this field is the computed impedance in ohms, at the frequency selected by the measurement cursor. Cursor SPL (amplitude sweep) The value displayed in this field is the measured average SPL, at the frequency selected by the measurement cursor. Cursor Frequency The value displayed in this field is the frequency of the plot point, and is selected by the measurement cursor. Ohms Range (impedance sweep) This field sets the ohms full-scale range that is represented by the vertical scale. The full-scale value can be set to 20, 50, 100, 200, 500, 1000, 2000, 4000, or 8000 ohms. To change the full-scale value, use the control knob to highlight the field and click to underline it. Then rotate the control knob to select the desired value, and click to accept the value. Input and Range (amplitude sweep) Use this field to select the SP295C input that is used for the test, and the input range. When using an external input, be sure to use only the Left input. Click to toggle between:
MicL - microphone input; 35 to 95 dB SPL MicH - microphone input; 70 db to 130 dB ExtL - line input low; –95 dBu to –30 dBu Ext - input normal; –77 dBu to +7 dBu ExtH - line input high; –40 dBu to +40 dBu
Start Frequency (sine wave sweep) This field sets the starting sweep frequency for all of the sweep modes (sine wave, amplitude and impedance). The frequency can be selected in 1/3-octave steps.

SP295 SoundPro Contractor Version Form7271A Operation Manual
51
End Frequency (sine wave sweep) This field sets the ending sweep frequency for all of the sweep modes (sine wave, amplitude and impedance). The frequency can be selected in 1/3-octave steps. The end frequency must be set higher than the start frequency in order for the sweep to run.
Sweep Duration (sine wave sweep) This field sets the time duration for all of the sweep modes (sine wave, amplitude and impedance). Times from 1 to 99 seconds can be selected. When the sweep duration completes, the sweep cycle begins again and repeats indefinitely in the sine wave sweep mode. The amplitude and impedance modes sweep through only one sweep cycle.
Sweeps Operation Sine Wave Sweep 1. Select the Sine wave sweep mode. 2. If you are driving speakers, set the volume on the external amplifier to minimum.
WARNING - All of the frequencies in the sine wave sweep are output at the same level. However, our ears are less sensitive to low and high frequencies. When testing speakers with the sweep test be careful that you DO NOT set the output volume of the amplifier too high during the low frequency portions of the sweep when your ears are insensitive to the audio, or you may over-drive the speakers and damage them. If in doubt about where to set the level, set the SP295C to output a 1 kHz tone and adjust the audio system for a good output volume.
3. Connect any of the SP295C's outputs to the device input. 4. Select the starting frequency value. 5. Select the ending frequency value.
6. Select the sweep time in seconds. 7. Set the Test Off/Run field to run. 8. To change the SP295C output signal level, click the Gen field and use the signal generator
control screen to set the output level. Amplitude Sweep 1. Select the Sine wave sweep mode and set the following parameters:
� starting frequency � ending sweep frequency � sweep time in seconds
2. Connect any of the SP295C's outputs to the input of the device being tested. If you need
to change the output signal level, click the Gen field and use the signal generator control screen to set the desired level.
3. Select the Amplitude sweep mode. 4. Select the desired input on the SP295C. Use MicL or MicH for testing the frequency
response of a room or speakers. Use ExtL, Ext, or ExtH for testing the frequency response of audio components other than speakers. Be sure to use the LEFT input on the SP295C.

SP295 SoundPro Contractor Version Form7271A Operation Manual
52
5. Select the desired band resolution, 1/3 or 1/12 octave.
6. If you are driving speakers, set the volume on the external amplifier to minimum. WARNING - All of the frequencies in the amplitude sweep are output at the same level. However, our ears are less sensitive to low and high frequencies. When testing speakers with the sweep test, be careful that you DO NOT set the output volume of the amplifier too high during the low frequency portions of the sweep when your ears are insensitive to the audio, or you may over-drive the speakers and damage them. If in doubt about where to set the level, set the SP295C to output a 1 kHz tone and adjust the audio system for a good output volume.
7. Set the Test Off/Run field to run and wait for the sweep to finish. 8. Read the frequency response plot on the SP295C display. Use the measurement cursor to
read SPL values at individual frequencies. You can also save the plot to memory. 9. If the word OVERLOAD appears, the input at some point in the plot was too high for the
selected input range. Select a higher input range, or lower the output of the device being tested, and run the sweep again. If the input level of the entire sweep is too low to obtain meaningful results, the display will show LOW INPUT. Select a lower input range or increase the output of the device being tested and run the sweep again.
Impedance Sweep 1. Wire a test cable to connect to the external device. This cable is a 1/4" stereo plug that has
only the tip and ring hooked up - do not connect the ground. Connect the other end of the wires to test or alligator clips. (This is the same cable used for the Impedance test in the Signal Generator function).
2. Connect an XLR male-to-female cable (standard mic cable) between the SP295C's output and left XLR input. This hookup should be as short as possible for the most accuracy.
3. Plug the test cable into the 1/4” Balanced Mono output jack on the SP295C. 4. Connect the test clips of the test cable to the device you want to measure the impedance of. 5. Select the Sine wave sweep mode and set the following parameters:
� starting frequency � ending sweep frequency � sweep time in seconds
6. Select the Impedance sweep mode. 7. Select the desired band resolution, 1/3 or 1/12 octave.
8. Set the Test Off/Run field to run and wait for the sweep to finish. 9. Read the impedance plot on the SP295C display. Use the measurement cursor to read SPL
values at individual frequencies. You can also save the plot to memory. Note: The generator level is set to a fixed output level (approximately +6 dBu) to optimize the impedance measurement and is not adjustable in the impedance sweep mode.

SP295 SoundPro Contractor Version Form7271A Operation Manual
53
Distortion Meter Description The SP295C Distortion Meter function allows you to measure distortion through either the microphone or external input jacks. Use the microphone input for testing and locating defective speakers, and use the external inputs for testing and troubleshooting audio system components. The SoundPro distortion test outputs a sine wave test signal and analyzes the return signal using FFT analysis to compare the level of the fundamental test frequency with its harmonics and noise. It sums the energy in the upper harmonics (and residual noise) to calculate the total harmonic distortion plus noise (THD+N). The range is 0.02% to 50%. The display shows the value numerically and on a bar graph, using a log-scale from 100% to 0.01% THD.
Excessive speaker distortion can cause audible problems and may be a sign of speaker damage or pending speaker failure. Speaker distortion typically runs in the 1-5% range with low room noise. Check all speakers, looking for differences between left and right speakers and differences between speakers in matched sets. If one speaker has appreciably higher distortion than the others, it is probably defective or damaged and may fail soon. Several test frequencies are provided to properly test woofers, midrange and tweeter speaker types. Use the external unbalanced left input to check the distortion of audio components that have an audio input and output, such as preamps and mixers, and tape decks (playback/record).
Distortion Meter Display/Controls The following fields and parameters are displayed in the Speaker Distortion test. Use the Speaker Control field in the Signal Generator control screen to turn the internal speaker on and off.
Test On/Off Frequency Distortion Analog Display Output Gain
Input
Input Level

SP295 SoundPro Contractor Version Form7271A Operation Manual
54
Input This field allows you to select the input range of the signal that is picked up by the microphone, or select the external input. Highlight the Input Range field and toggle between inputs:
MicL - microphone input, 30 dB - 95 dB MicH - microphone input, 70 dB - 130 dB Ext - external input. Use the unbalanced
LEFT input only. Test On/Off Click on this field to turn the Speaker Distortion test on and off. Turning the test on and off automatically turns the internal signal generator on and off. Frequency Seven frequencies are available for testing distortion: 63, 125, 250, 500, 1000, 2000 and 4000 Hz. Test distortion of full-range speakers over this full frequency range; test sub-woofers at 63 and 125 Hz; test satellite, bookshelf, and PA speakers at 125 Hz and higher. To set the test frequency, highlight the Test Frequency field and click the control knob to select it (underlined). Turn the control knob until the desired value is displayed and click to select the frequency. Analog Distortion Display This bar graph displays the distortion percentage on an analog bar graph, ranging
from 100% (left) to 0.01% (right). The pointer below the bar indicates the distortion and responds quickly to changes. If no pointer is visible, the test is turned off or the distortion is greater than 100%. Distortion This number is the THD+N percent displayed digitally. Input Level This bar graph indicates when the signal level picked up by the microphone or applied to the external input is within a useable range. Adjust the Output Gain or amplifier volume for a reading that is approximately centered between the Under and Over points. Too little or too much signal will cause an unstable reading. Generator Output Gain This field allows you to adjust the output level of the SP295C's internal signal generator. Set the gain for a useable sound level, as indicated on the Input Level bar graph. The gain is adjustable in 1.5 dB steps, from -64.5 dBu to 15.0 dBu. To change output level, turn the control knob to highlight the Generator Output Gain field and click to select it (underlined). Turn the control knob until the desired value is displayed and then click to select the new output level.
SP295 SoundPro Contractor Version Form7271A Operation Manual
55
Distortion Test Operation
1. Connect the SP295C Output to the amplifier input. The SP295C must be the signal source for the distortion test. Connect one of the SP295C outputs to the amplifier that is driving the speaker to be tested. Set the amplifier to gain at 1/3 to 1/2 volume. (You will not hear an output from the speaker until the test is turned on).
2. Select the Input and range. For best results when testing speaker distortion, perform the test
at SPL levels less than 70 dB, using MicL.
3. Select the desired test Frequency. Test full-range speakers at each frequency; sub-woofers at 63 and 125 Hz; satellite, bookshelf, and PA speakers at 125 Hz and above.
4. Set the SP295C Output Gain to minimum. The speaker volume depends on the SP295C
generator level and the amplifier volume. Caution: Start with SP295C Output gain at minimum (-64.5 dB) to prevent speaker damage when the distortion test is turned on.
5. Turn the Distortion Test on. You can turn the internal speaker on and off using the Speaker
Control field in the Signal Generator control screen.
6. Adjust the output gain for a mid-range reading on the level meter. If you hear test tone at the maximum output gain setting, but the Input Level Bar Graph is not above the minimum level, increase the amplifier volume control. Caution: If you do not begin to hear an output from the speaker with the gain set at 0 dB, set the Output gain to minimum and check the connections between the SP295C and amplifier, the amplifier input and speaker selection switches, and the amplifier volume setting.
7. Read the distortion. The distortion percent is shown on the digital display and on the analog
bar graph.
8. Test speakers at all appropriate test frequencies. � full-range speakers at each test frequency � sub-woofers at 63 and 125 Hz � satellite, bookshelf, and PA speakers at 125 Hz and above Caution: Reduce the SP295C output level before changing the test frequency.

SP295 SoundPro Contractor Version Form7271A Operation Manual
56
Signal to Noise Ratio Description The Signal to Noise function allows you to test the S/N ratio of any device that has an audio input and output, such as mixers and preamps. It compares the noise floor of the device to the full-scale signal and computes the signal-to-noise ratio. S/N levels up to 85 dB can be measured at frequencies in 1/3-octave steps between 20 Hz and 20 kHz. Both Left and Right channels can be tested simultaneously, and balanced or unbalanced outputs may be used.
The test is performed in two steps. First a test signal from the SP295C's internal generator is applied to the device and adjusted to establish a full signal reference. Then the signal is removed, the noise level is measured, and the S/N ratio is computed. The test displays the applied signal level, the measured noise, and the S/N ratio for both channels.
Signal to Noise Display/Controls The following fields and parameters are displayed in the Signal to Noise function. Use the Speaker Control field in the Signal Generator control screen to turn the internal speaker on and off.
Test Mode This field switches the test between Signal and Noise. Select the Signal mode to adjust the level and frequency of the applied test signal. Then switch to Noise to measure the noise floor and read the S/N ratio. Level Range Click this field to toggle the level adjustment between coarse and fine. The level changes in approximately 0.1 dB increments in the fine mode and 3 dB steps in the coarse mode. Level Set Highlight (underline) this field and turn the control knob to adjust the output level. Read the level in the Signal Level field.
Frequency Range Click this field to toggle the frequency adjustment between coarse and fine. The frequency changes in 1/3-octave steps (20 Hz to 20 kHz) in the fine mode and in 1-octave steps (31 Hz to 16 kHz in the coarse mode. Test Frequency Highlight (underline) this field and turn the control knob to adjust the output test signal frequency. Signal Level This field displays the dBu signal level that is applied to the device being tested, which is the “reference” level that the noise floor will
Test Mode Level Set Test Frequency Signal Level Noise Level
Signal/Noise Ratio
Level Range
Frequency Range

SP295 SoundPro Contractor Version Form7271A Operation Manual
57
be compared to. Use the Level Set field to adjust the level and the device's input level to obtain a full-scale signal on the device under test. The level updates only when the Test Mode is set to Signal. Noise Level This field displays the measured noise level of the device under test. The noise level is
measured (valid) only when the Test Mode is set to Noise. S/N Ratio This field displays the S/N ratio, which is the difference between the applied signal level and the measure noise level. The S/N is valid only when the Test Mode is set to Noise.
Signal to Noise Test Operation
1. Connect any of the SP295C's audio outputs to the input(s) of the device to be tested.
2. Connect the device output(s) to the SP295C's audio input(s). Use either the balanced or unbalanced inputs.
3. Set the Test mode to Signal. This turns on the SP295C's internal signal generator. You can
turn the internal speaker on and off using the Speaker Control field in the Signal Generator control screen.
4. Set the desired test frequency.
5. Adjust the signal output level and the device input level to obtain a full-scale,
undistorted signal on the device under test. This is the “reference” level to which the noise floor will be compared. � If you are testing an analog tape recorder, use 0 dB as shown on the machine's meters. � If the device has output metering, adjust the levels for 0 dB on the meters. � If the device has no level meters, set the SP295C output to +4 for balanced inputs, and -
10 for unbalanced inputs.
6. Set the Test mode to Noise.
7. Read the S/N ratio. The internal signal generator is turned off and the SP295C switches its input to the most sensitive range. The noise floor of the device under test is measured, and the S/N ratio is computed and displayed.

SP295 SoundPro Contractor Version Form7271A Operation Manual
58
TESTS Menu
Auto HT Tests Description The Auto HT tests can be used to greatly simplify setup and calibration of a Home Theater surround sound system. These tests are designed to be used in conjunction with the DAG5161 SurroundPro Digital Audio Generator. The SP295C controls the DAG5161 to generate the necessary signals for these tests. The following set of tests is performed automatically:
1. Loudspeaker Reference Level for each of the 5.1 or 6.1 channels (six or seven tests)
2. Loudspeaker Polarity test for the 5 or 6 main channels (five or six tests)
3. Loudspeaker Time Synchronization (one test of all main channel speakers)
4. Reverb Decay Time (one test) 5. Early Reflection Analysis for left & right
channel speakers (two tests) 6. Ambient Noise Analysis (one test) 7. Subwoofer Frequency Response (one test) 8. System Frequency Response (one test)
The results of these tests are stored in the memories on the SP295C. These results can be used for immediate adjustments to the system, as well as for importing into the SoundPro Report Software. Background: In setting up a home theater surround sound system, it is necessary to calibrate each channel’s speaker individually, as well as together. During this procedure, various test signals must be played through the appropriate channel only. In the past, this has been accomplished by sending an analog generator signal to the left and right inputs of an A/V receiver in a “multi-channel stereo” mode, where the signal is sent to all channels; then disconnecting all of the other speakers. This can be a very time consuming, tedious, and error-prone task.
So if we set out to improve this process, what can we do? With an analog line-level signal generator / meter, there really isn’t much. We
can only generate stereo (two channel signals); there is not even a “multi-channel analog input” on A/V receivers. The only multi-channel input is digital. This means that, at a minimum, we must have a digital signal generator. If the generator is a digital multi-channel generator, capable of sending signals to individual channels, then we can save all of the cable juggling by just sending the appropriate test signals to the correct channels. Then it is a fairly simple process to read the audio meter and set up each channel correctly.
The SP295C has a signal generator, but unfortunately it is analog only, so it will only be useful in the connection-juggling scheme outlined above. On the other hand, the DAG5161 is a fully digital generator, capable of sending signals to any arbitrary channel in a multi-channel system. The problem with the DAG5161 is that it doesn’t contain any of the processing circuits necessary to analyze the system that is playing these test signals. The Fix: The answer is to use the analyzing power of the SP295C with the digital signal generating capabilities of the DAG5161. This is exactly what the newest set of firmware for the SP295C and the DAG5161 allow. This update allows the SP295C to control the DAG5161’s internal generator to play test signals to individual channels.
This combined functionality allows for even more refinement of the calibration process. We have developed a set of “Auto Home Theater (HT) Tests” for the SP295C and DAG5161. The SP295C automatically goes through a set of eight tests (for individual channels where appropriate) that can capture a “snapshot” of the system. This can be used to generate “before and after” reports, as well as doing the actual calibration of the system.

SP295 SoundPro Contractor Version Form7271A Operation Manual
59
Auto HT Tests Display/Controls
Selecting “Tests / Auto HT Tests” from the menu brings up the AHT Setup screen. This screen contains the following controls: Setup This control changes between the three screens (Setup, Review1, and Review2). Setup is used to change the settings for the test, as well as to initiate the tests. Review1 and Review2 contain the results of previously run tests. HLD/RUN This controls the state of the test; initially it is set to “HLD”, meaning that the test is not running. Select this control to toggle its state to “RUN”. Once the test starts running, it cannot be stopped; nor can the other settings be changed. Channel Selection This toggles the mode between 6.1 (DTS-ES), and 5.1 (Dolby AC3). Starting Memory Selection This controls which memory locations are used by the Auto HT tests. The tests use seven memory locations, starting at the location specified (the base). The memory locations are used as follows:
Base – The numeric results from the first three AHT tests, including speaker level, polarity, and time synchronization. Base+1 –Energy Time Graph for reverberation evaluation Base+2 –Energy Time Graph for left channel early reflection evaluation Base+3 –Energy Time Graph for right channel early reflection evaluation
Base+4 –RTA for ambient noise analysis Base+5 –RTA-Low for subwoofer equalization evaluation Base+6 –RTA for main channel equalization evaluation
Memory Jump This control jumps to the memory management screen. When data is recalled through this jump screen, the results of that test can be seen in the Reveiw1 and Review2 screens. Speaker Delay Units This control toggles the delay units between feet (ft), milliseconds (ms), and meters (m). Set this to match the settings used for speaker time synchronization on the A/V receiver. Reverb Decay Range This selects the range to be used during the Reverb Decay test; the values are 960 ms and 480 ms. The range will usually be set to 480, use 960 only when the reverberation decay time is greater than 4 seconds (a fairly large room). The default for this parameter can be changed with the “Save Settings” option. Early Reflections Range This toggles between 15/30/60 ms ranges to be used for the Early Reflection tests. This setting is the range of the difference between the direct sound path and the reflected path. This will generally be set to 15. If the reflection path difference is longer, use a higher setting. The default for this parameter can be changed with the “Save Settings” option.

SP295 SoundPro Contractor Version Form7271A Operation Manual
60
Auto HT Tests Operation The SP295C’s Auto HT test battery goes through the following sequence:
1. Loudspeaker Reference Level for each of the 5.1 or 6.1 channels (six or seven tests). The SP295C will be set to “Sound Level Meter, Slow, C-Weighted”, and the DAG5161 will generate the following signals:
Dolby AC-3 5.1 DTS 6.1 500Hz - 2kHz Pink L 500Hz - 2kHz Pink L 500Hz - 2kHz Pink C 500Hz - 2kHz Pink C 500Hz - 2kHz Pink R 500Hz - 2kHz Pink R 500Hz - 2kHz Pink RS 500Hz - 2kHz Pink RS 500Hz - 2kHz Pink LS 500Hz - 2kHz Pink CS 40Hz - 80Hz Pink LFE 500Hz - 2kHz Pink LS 40Hz - 80Hz Pink LFE
2. Loudspeaker Polarity test for the 5 or 6 main channels (five or six tests). The SP295C
will be set to “Speaker Polarity”, and the DAG5161 will generate the following signals: Dolby AC-3 5.1 DTS 6.1 Polarity L Polarity L Polarity C Polarity C Polarity R Polarity R Polarity RS Polarity RS Polarity LS Polarity CS Polarity LS
3. Loudspeaker Time Synchronization (one test). The SP295C will be set to “Auto Time
Delay” mode, and the DAG5161 will generate the “Auto Time Delay” signal
Note: These first three tests are the only ones that need to be repeated for adjustments on the receiver / speakers. The rest are for more in-depth analysis of the theater room, i.e. acoustical treatments, speaker placement, etc.
4. Reverb Decay Time (one test). The SP295C will be set to “Energy Time Graph”, A-
Weighting. The DAG5161 will generate the “Impulse C” signal.
5. Early Reflection Analysis for left & right (two tests). The SP295C will be set to “Energy Time Graph”, A-Weighting for both tests. The DAG5161 will generate “Impulse L”, and “Impulse R” signals.
6. Ambient noise analysis (one test). The SP295C will be set to “Real-Time Analyzer”, Full,
1 Octave, or Flat. The DAG5161 will not generate any signals for this test.
7. Subwoofer Frequency Response (one test). The SP295C will be set to “Real-Time Analyzer”, Low, 1/3 Octave, Flat. The DAG5161 will generate the “20Hz – 220Hz Pink LFE” signal.
8. System Frequency Response (one test). The SP295C will be set to “Real-Time Analyzer”,
Full, 1/3 Octave, Flat. The DAG5161 will generate the “20Hz – 20KHz Pink All” signal.

SP295 SoundPro Contractor Version Form7271A Operation Manual
61
These tests take about five minutes to run for the 5.1 and about six minutes for the 6.1 tests. There is no way to run these tests individually. You can stop the tests at a desired point in the test sequence by power cycling both the SP295C and DAG5161. The minimum number of times you will have to run the test sequence is twice, once to capture a “before” snapshot of system performance, and once to verify the adjustments you make to the system. The following suggested workflow will help to make better use of your time. Verify that the A/V receiver and the Digital Audio Generator work well together. Note: Some A/V receivers output pops and bursts when the digital signals stop and start. The best way to deal with this is by careful testing before calibration. Because these pops happen only when changing signals, we recommend thoroughly testing the DAG5161 with the A/V receiver before setting the volume to reference level. Set the volume to a moderately low level, start and stop a few signals, switch between 5.1 and 6.1 signals, let a signal loop a few times, etc. Only proceed with calibration once you are comfortable with how the receiver handles the signal changes.
1. Preset the A/V receiver channel level trim controls to 0 dB and the time/distance trim controls to the approximate distance of each of the loudspeakers from the main listening position (or center of the listening area).
2. Connect the SP295C and DAG5161 together and to the system as necessary.
� The SP295C and the DAG5161 must be connected together with the SP295C’s serial cable and the adapter supplied with the DAG5161. NOTE: The communication link between the SP295C and the DAG5161 is very sensitive to RF noise on the line. For this reason, only use the cables and adapters supplied with the SP295C and DAG5161. Other cables and adapters may work, but the errors from poorly connected equipment can result in physical damage to loudspeakers.
� The DAG5161 must be connected to the A/V receiver with a digital cable, either S/PDIF or TOSLINK.
� Start the “500Hz-2kHz Pink L” test signal on the DAG5161, then set input and volume level on the A/V receiver for approximately 75 dB SPL at the main listening position (or center of the listening area).
3. Run the Auto HT Tests from the SP295C’s “Tests” menu, selecting the appropriate
parameters. While this is running, you can do other things, just be sure to not make any noises that will affect the testing. � If you are calibrating with a microphone multiplexer, disable it for the first five tests
(during the ambient noise analysis test); then re-enable it for the final tests.
4. After the tests have completed, review the results from the levels, polarity, and time sync. Make adjustments as necessary and repeat. After the first run, make sure you change the starting memory location, to preserve the pre-calibration results. � To review the results of the test, highlight and select the “Setup” title on the main
screen. This will cycle between “Setup”, “Review1”, and “Review2”. You can also re-save this data to (or recall another test from) a new location by using the memory jump control.
� If you are having difficulty getting the time delay set, it can sometimes be easier to select the “Auto Time Delay” test from the “Tests” menu, and manually select the

SP295 SoundPro Contractor Version Form7271A Operation Manual
62
“Auto Time Delay” signal on the DAG5161. The DAG5161 will repeat the signal and the SP295C will repeatedly sync and display the results of the test.
� When working with dipolar surround channel loudspeakers, the results from the automatic polarity tests, taken from the listening position, may be incorrect or indeterminate. This is caused by an excessively “live” or reflective rear wall surface. The reflected, reversed polarity sounds reflecting off the rear wall are likely combining with the normal polarity sounds reaching the microphone. This can be corrected by acoustical treatments on these walls (either absorbing or diffusive). The individual drivers can be tested manually by selecting the appropriate test signal on the DAG5161 (i.e. Polarity RS) and using the SP295C Speaker Polarity Test with Ext Trigger. In this case, the microphone should be placed at a distance of 1 – 2 times the driver diameter.
� The automatic polarity tests are designed to work with the loudspeaker levels set to 75dB reference, if levels are set too low initially, these polarity tests may be inconclusive.
� In extreme cases, the tests can be aborted by resetting both units. In order to preserve the results of the tests up to the point of cycling the power, wait until “AHT SVE!!” is displayed in the title area. This is done immediately after completing the “Time Synchronization” test, so resetting any time after that test will work.
5. After the levels, polarity, and delays are set, run the tests one final time to capture the
ETGs and RTAs from the final tests.
6. Disconnect the DAG5161 from the system and from the SP295C; connect the SP295C to your laptop.
7. Run the SoundPro SP295C Report software to import data and create the report for the
system.
8. If you want to create pre- and post-calibration reports, you can do this relatively easily by setting the “starting memory location” in the Auto-HT test. � Initially, select location “26” (which will fill up locations 26-32); then select location
“33” after the first run. � After the calibration, the pre-calibration results will be in locations 26-32, and the post-
calibration will be in 33-39. � You can set the default starting memory location by selecting “33”, then using the Save
Settings function. Setting “33” to be the default will also make it a little easier in the extreme case where the unit must be reset, as mentioned previously in step 4.

SP295 SoundPro Contractor Version Form7271A Operation Manual
63
Auto Time Delay Description This test will test the time delay from each speaker in a home theater surround sound system, as compared to the left channel speaker. It is designed to be used with the DAG5161 SurroundPro Digital Audio Generator.
Auto Time Delay Display/Controls
Units This selects the units displayed during the tests. The options are meters (m), milliseconds (ms), and feet (ft). Channel Selection This selects the number of channels tested during the test. The choices are 5.1 and 6.1. Input Selection This selects either MicL or MicH for the input source. Hld/Run This starts and stops the test.
Units
Channel Selection Input
Selection Hld/Run

SP295 SoundPro Contractor Version Form7271A Operation Manual
64
Auto Time Delay Operation In this test, the DAG5161 is used to generate the “Auto Time Delay” signal. This signal sends out pulses to each of the five or six main channels, spaced 100ms apart. The SP295C’s microphone detects these pulses and calculates the times between them to determine the time synchronization for each of the speakers. Always make sure there is a direct, unobstructed path between the loudspeaker and the listening position. Obstructions and reflections will degrade the performance of the system, and can affect the accuracy of this test. The procedure for using this test is as follows:
1. Connect the DAG5161 to the A/V receiver using a digital connection (either S/PDIF or Toslink). Make sure the A/V input selection is set to the input the DAG5161 is using.
2. Set the parameters for the test.
� The units should match the unit settings on the A/V receiver. � Set 5.1/6.1 appropriately for the system being calibrated. � Set the input source to MicL.
3. Select the “Hld/Run” control to start the test running.
The test will display either “wait mode” or “trig mode” indicating that the SP295C is either waiting for the first pulse or is processing the subsequent pulses from the test signal.
4. On the DAG5161, select either 5.1 or 6.1 mode, then select the “Auto Time Delay”
signal. At this point, the SP295C will trigger on the first pulse received, and then calculate the delays relative to this reference.

SP295 SoundPro Contractor Version Form7271A Operation Manual
65
Polarity Tests Description Correct audio wavefront polarity is critical for achieving good stereo imaging, wide sound stage, and proper frequency response. An out-of-phase wavefront from a speaker can degrade the performance of the entire audio system. The sound wavefront reproduced by the speakers should follow the polarity of the sound wave that energized the recording microphone. For example, the beat of a drum should move the speaker cone outward. To achieve proper phasing throughout the system, all active components must maintain the correct phase, and all microphones in a sound reinforcement system must produce in-phase signals. Determining proper polarity by listening to a speaker output is very difficult and inaccurate, and observing cable polarity does not guarantee correct polarity. The SP295C Polarity Test provides a simple, reliable way of determining absolute speaker, microphone, and component polarity.
The speaker polarity test outputs pulses to the amplifier/speakers. The reproduced sound is picked up by the SP295C's microphone, and the polarity of the sound is compared to the applied test signal. All speakers in an audio system can be checked quickly by driving them simultaneously and positioning the SP295C microphone closer to one speaker at a time. The microphone polarity test outputs pulses through the SP295C's internal speaker. The microphone under test is connected to the SP295C's input and picks up these pulses. The polarity of the applied signal is compared with the microphone output. In the equipment polarity test, a pulse is output from the SP295C output jack, fed through the active system component, and back in to the SP295C's external input.
Polarity Test Displays/Controls The following fields and parameters are displayed in the Polarity test function:
Mic Range Test Mode Test On/Off Input Reminder Test Mode
Output Reminder
Polarity
Confidence Indicators
Signal Level
Output Gain Input Gain Test On/Off

SP295 SoundPro Contractor Version Form7271A Operation Manual
66
Test Mode Click to toggle between the different polarity test functions:
Spkr - Speaker test. Connect SP295C output
to amp/speaker. Use SP295C mic to pickup sound from speaker.
Mic - Microphone test. Connect mic under test to SP295C input. Place mic near SP295C's internal speaker.
Equip - Equipment test. Connect SP295C output to component input, and component output to SP295C input.
Mic Range (Speaker Test mode only) This field matches the sound level picked up by the SP295C's microphone to the speaker sound level. Click to toggle between:
MicL - 30 dB to 95 dB (typical level) MicH - 70 dB to 130 dB
Signal Level This bar graph indicates when the signal that is being input to the SP295C (SP295C's mic in Spkr mode, or external input in Mic and Ext mode) is within a useable range. Select the Mic Range (Spkr mode) that produces a display closest to mid range, or adjust the Output Gain or external amplifier volume to produce a near mid-scale reading. Output Gain This field adjusts the output level of the test pulse. Adjust the gain to produce a mid-scale reading on the Input Level bar graph. To adjust the gain, highlight the Output Gain field and click the control knob to select it (underlined). Input Gain (Mic test only)
This field provides a coarse adjustment of the signal level that is applied to the SP295C input from the microphone/preamp. Select the gain needed to provide a mid-scale reading on the Signal Level display. Click to toggle between:
0 dB - no gain or attenuation +40 - provides 40 dB gain Pad - provides 40 dB attenuation
Polarity This field indicates '+' if the output of the device under test is in phase with the test signal (good test result), or '--' if the signal is out of phase (bad test result). Confidence Indicators The two confidence bars indicate if the test receiving a good sound to insure an accurate test. Only one bar should be tall at a time - it does not matter which one, or if they alternate. If both bars are either tall or low, the test is picking up background noise or multiple speaker sounds. Reduce room noise and/or move the mic closer to the speaker. Test On/Off Click the control knob to toggle the Polarity Test on and off. Input Reminder This field provides a reminder of which SP295C input to use for the selected polarity test mode. Output Reminder This field provides a reminder of which SP295C output to use for the selected polarity test mode.

SP295 SoundPro Contractor Version Form7271A Operation Manual
67
Polarity Test Operation Speaker Test Mode
1. Select the Spkr test mode. 2. Connect the SP295C microphone to the SP295C's Microphone Input connector. 3. Connect the SP295C Output to the speaker amplifier input. Set the amplifier to power
all speakers simultaneously. Adjust the amplifier volume to about 1/3 gain. Note: Use an unbalanced output (either the RCA output or the ¼” output) instead of the XLR output.
4. Set the Input Range to MicL. 5. Set the SP295C Output Gain to minimum. Caution: Start with SP295C's Output Gain
at minimum to prevent speaker damage when the Polarity Test is turned on. 6. Turn the Speaker Polarity Test on. 7. Position the SP295C microphone closer to one speaker than to the others if you are
driving all speakers simultaneously, and make sire that there is a direct audio path from the speaker to the microphone.
8. Adjust the SP295C Output Gain for a mid-range reading on the Input Level Bar
Graph. 9. Observe the confidence indicators to see that the SP295C is getting good audio. Only
one bar should be tall. If both bars are tall or low there may be excessive background noise or the signal from another speaker may be interfering. Reduce room noise and/or move the microphone closer the speaker you are testing.
10. Observe the speaker phase on the SP295C display. A plus sign indicates that the
speaker output is the same polarity as the test signal applied to the amplifier input. Note: Some loudspeakers are intentionally wired with one driver in the enclosure out of phase. This is done to provide a smoother phase response at the crossover point of the crossover network.

SP295 SoundPro Contractor Version Form7271A Operation Manual
68
Microphone Test Mode
1. Select the Mic test mode. 2. Plug the microphone to be tested into a microphone pre-amp. High-level output
dynamic microphones can be plugged directly into the SP295C external input. 3. Plug the microphone pre-amp output into one of the left external audio inputs on the
SP295C. 4. Turn the Microphone Polarity test on. You will hear audio pulses coming from the
SP295C's internal speaker. 5. Hold the microphone near the SP295C's internal speaker. You may need to hold it
directly up to the microphone to get a good reading. 6. Adjust the Output Gain and Input Gain levels to obtain a mid-scale reading on the
level meter. 7. Read the polarity on the SP295C display. A plus sign indicates that the microphone
output is the same polarity as the test signal applied to the amplifier input. All microphones in the audio system should have the same polarity.
Equipment Test Mode
1. Select the Eqt test mode. 2. Connect the SP295C output to the component's input. 3. Connect the component's output to the left, unbalanced external audio input on the
SP295C. 4. Turn the Equipment Polarity test on. 5. Hold the microphone near the SP295C's internal speaker. You may need to hold it
directly up to the microphone to get a good reading. 6. Adjust the Output Gain to obtain a mid-scale reading on the level meter. 7. Read the polarity on the SP295C display. A plus sign indicates that the component
output is the same polarity as the test signal applied to the input.
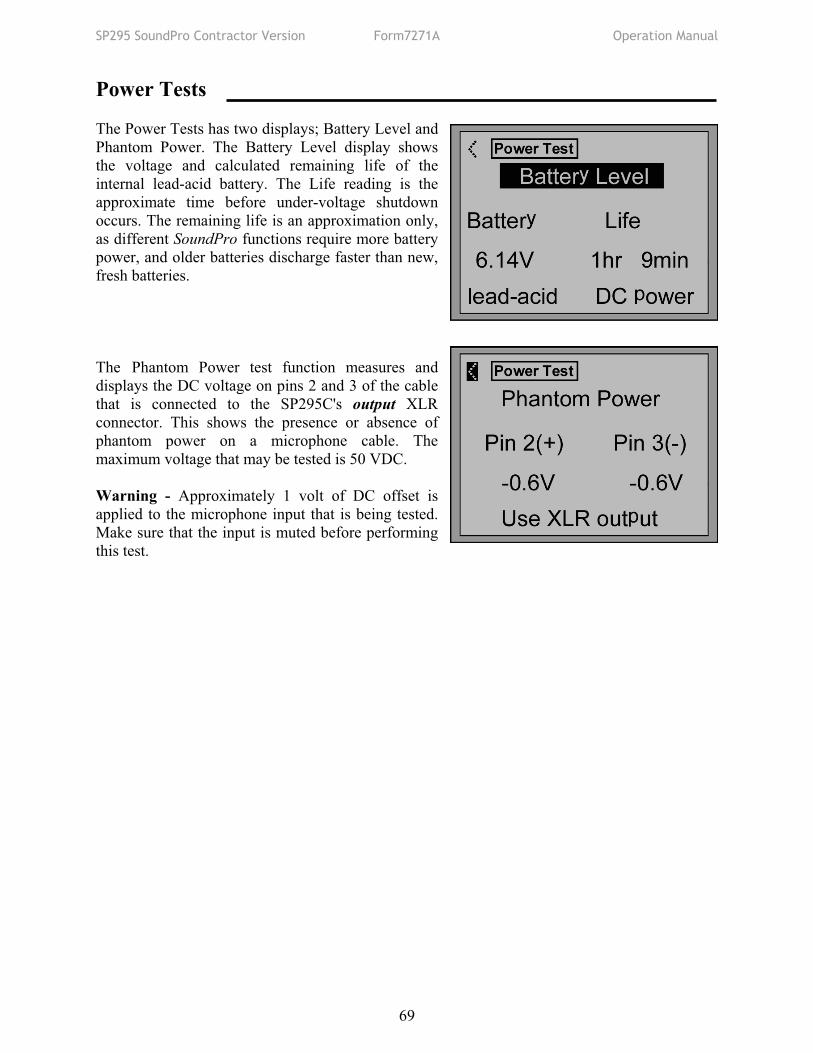
SP295 SoundPro Contractor Version Form7271A Operation Manual
69
Power Tests The Power Tests has two displays; Battery Level and Phantom Power. The Battery Level display shows the voltage and calculated remaining life of the internal lead-acid battery. The Life reading is the approximate time before under-voltage shutdown occurs. The remaining life is an approximation only, as different SoundPro functions require more battery power, and older batteries discharge faster than new, fresh batteries. The Phantom Power test function measures and displays the DC voltage on pins 2 and 3 of the cable that is connected to the SP295C's output XLR connector. This shows the presence or absence of phantom power on a microphone cable. The maximum voltage that may be tested is 50 VDC. Warning - Approximately 1 volt of DC offset is applied to the microphone input that is being tested. Make sure that the input is muted before performing this test.

SP295 SoundPro Contractor Version Form7271A Operation Manual
70
Cable Test Description The SP295C Cable Test verifies the wiring and integrity of all audio cables. Connect one end of the cable being testing to the appropriate input connector on the left side of the SP295C (use the "L" input) and the other end to the corresponding output connector on the right side of the SP295C. Two tests are preformed - a digital wiremap test and an analog audio transmission test. The Cable tester can also be used as a continuity tester. The wiremap test checks all connections for opens, shorts, or crossed wires and displays
the results graphically. If the cable is wired correctly, straight lines are shown. If the cable is open or wired wrong, the display shows the wiring. The internal speaker beeps for good wiring and buzzes for incorrect wiring. After the digital test completes, an analog transmission test is performed. This test passes a 1 kHz and a 20 kHz signal through the cable and displays the dB loss at each frequency. Good cables should have less than 0.5 dB loss at both frequencies. Poor cables have a substantially higher loss at 20 kHz.
Cable Test Display/Controls The following fields and parameters are displayed in the Cable Test function:
Cable Type Use this field to select the type of audio cable that you are testing. Select one of the following types:
Unbal > Unbal - unbalanced-to-
unbalanced cables Bal > Bal - balanced-to-balanced Bal > Unbal - balanced-to-unbalanced Unbal > Bal - unbalanced-to-balanced Continuity - allows the SP295C to
function as a continuity tester. (You will need a test cable to test continuity).
Test Status Click this field to start the Cable Test and monitor the test. The field changes to indicate Test Done (click to start the test) or Test Running. Speaker Control The internal speaker can provide an audible indication of the digital wiremap test results. It beeps if a cable is wired properly and buzzes if the wiring is incorrect. No audio indication is provided for the analog test, as different cable types have different performance characteristics. Highlight and click this field to turn the speaker on or off.
Cable Type Speaker Control Wiremap Test Analog Test Results
Test Status
SP295 SoundPro Contractor Version Form7271A Operation Manual
71
Wiremap Test This display shows a graphical wiremap of the cable's wiring. It indicates normal through connections, shorts, opens, or crossed connections. Good cables will show a straight line from the input pins to the output pins.
Analog Test This is the result of the 1 kHz and 20 kHz transmission test. The numbers are the dB attenuation loss through the cable. Better cables show readings closer to 0, indicating no signal attenuation. For most audio cables the 1 and 20 kHz levels should be less than 0.5 dB. Unequal response indicates a bad cable, or a faulty solder connection.
Cable Test Operation Testing Cables
1. Select the Cable Test function. 2. Connect the cable to be tested to the SP295C input and output connectors. Connect
one end of the cable to the "L" input on the SP295C and the other end to the SP295C's output connector.
3. Select the Cable Type. The left designator corresponds to the input connector and the
right designator corresponds to the output connector. 4. Turn the speaker On or Off. The speaker provides an audible indication of the wiremap
test. 5. Start the test. Highlight and click the Test Status field and click to begin the test. The
field displays Test Running while the test is in progress and Test Done when completed. 6. Read the results of the cable tests.
� Wiremap Test - Properly wired cable show straight lines from input to output. A missing line indicates an open connection, and lines that cross indicate incorrect wiring.
� Signal Transmission Test - Good cables have little loss (0 - 0.5 dB) at 1 kHz and 20 kHz.
Note: The SoundPro uses XLR pin 2 hot. If your system is wired pin 3 hot you will get wrong results. A simple way around this is to use an unbalanced output, either the RCA output or the ¼” output with an unbalanced ¼” plug. Audio Pads - An in-line audio pad shows a line from + to G in the wiremap test, and will show the signal attenuation of the pad in the Signal Transmission test.
Continuity Tester
1. Wire a pair of continuity test cable adapters. Connect one end of the test cable to the tip of a ¼” plug and the other end of the test cable to a probe, such as a test probe or alligator clip.
2. Connect one test cable to the SP295C's "L" input and the other to the SP295C's
output. 3. Select Continuity test mode and turn the speaker to On.
4. A short beep will be heard whenever there is continuity through the test probes.

SP295 SoundPro Contractor Version Form7271A Operation Manual
72
UTILITIES Menu Audio Scope
Description The Audio Scope is an audio-bandwidth digital oscilloscope. It has a sample rate of 48 kHz, meaning that is useful for viewing signals up to 10 kHz. It provides AC-only input coupling to 3 Hz for viewing the AC component of waveforms. Use the Audio Scope to look for gross waveform distortion, obvious clipping, input over-ranges, polarity, identifying repetitive waveforms, and verifying the presence of signal. The X-Y mode can be used as a graphical phase meter to view accurate phase relationships for signals up to approximately 22 kHz.
The Audio scope auto-triggers on repeating waveforms with a trigger level automatically set to 1/256th of the maximum vertical scale. The display is refreshed approximately every 1/2 second. Input signals may be applied using the left or right external line inputs, or the microphone input. A bar graph and digital readout show the level of the applied signal. The table below lists the input modes and the corresponding scope, bar graph and level meter displays.
Audio Scope Display/Controls
Input Mode The audio scope works with either the left or right Line in, or the microphone input. The table below lists the input modes and shows the resultant display on the scope screen and the bar graph level meter.
Input Mode Scope Signal Displayed Bar Graph Level Meter L Left Line Input Left input signal, dBu R Right Line Input Right input signal, dBu
L&R Both inputs, overlaid, triggered on the left input
Sum of left and right signals, dBu
L+R Both inputs, summed Sum of left and right signals, dBu L-R Both inputs, difference Left signal minus right signal, dBu Mic Microphone Input MicL in level, dB SPL, unweighted
Mode
Range
Input Mode
Generator Jump
Generator On/Off
Amplitude/division
Run/Hold Level Meter Time/division

SP295 SoundPro Contractor Version Form7271A Operation Manual
73
Range The vertical display corresponds to the amplitude of the input signal. When any of the line input modes are selected, the vertical display is calibrated in volts/div or mV/div. The microphone input is calibrated in SPL units of mPa/ div. It has only one range. The ranges for the line inputs are:
ExL (0.156 - 10 mV/div.) Ext (15.6 - 1000 mV/div) ExH (1 - 4 volts/div.)
Display Mode Click to toggle the horizontal axis display between X-Y and ms/Div (time). In the X-Y mode, accurate phase relationships can be seen up to approximately 22 kHz Time/Div The horizontal axis has 8 divisions marked along the center horizontal line. This field sets the time that corresponds to each division in milliseconds. Highlight this field (underlined) and turn the control knob to cycle through the available times: 0.1, 0.2, 0.5, 1.0, 2.5, 5.0, and 10.0 mS/div. Run/Hold Click this field to turn the Audio Scope on and off. Select Hld to freeze the waveform that is currently displayed. Changing the time/div or amplitude/div while the display is in Hld will not change the display.
Amplitude/Div. The vertical scale has 6 divisions. Use this field to select the amplitude that corresponds to each division. When the external inputs are selected, the amplitude/division ranges are in millivolts/division or volts/division. When the Mic input mode is selected, the vertical scale units are in Pa/division, where 1 Pa (Pascal) = 94 dB SPL. To set the vertical scale, highlight the field (underlined); then turn the control knob to select the desired setting. Level Meter The vertical bar graph displays the relative level of the input signal. The numeric value is the dBu signal level at the line inputs, or the dB SPL level for the Mic input. Generator Jump Click to jump to the Signal Generator control display to set up the generator as desired. Clicking '<' returns to the Audio Scope display. Generator On/Off The signal generator can be turned on to provide the selected signal to the output connectors. Click to toggle to turn the generator on or off.
Audio Scope Operation
1. Connect the input signal. Use the SP295C's L or R line inputs, or microphone input.
2. Select the input mode. Toggle the Input Mode to match the input.
3. Set the Audio Scope function to Run.
4. Select the input range.
5. Adjust the amplitude/division for a display that has sufficient height, but is not clipped. Selecting too low of a V/div setting will cause the waveform display to be clipped.
6. Select the Display Time or X-Y mode.
7. View the input signal. Select Hld to freeze the display.
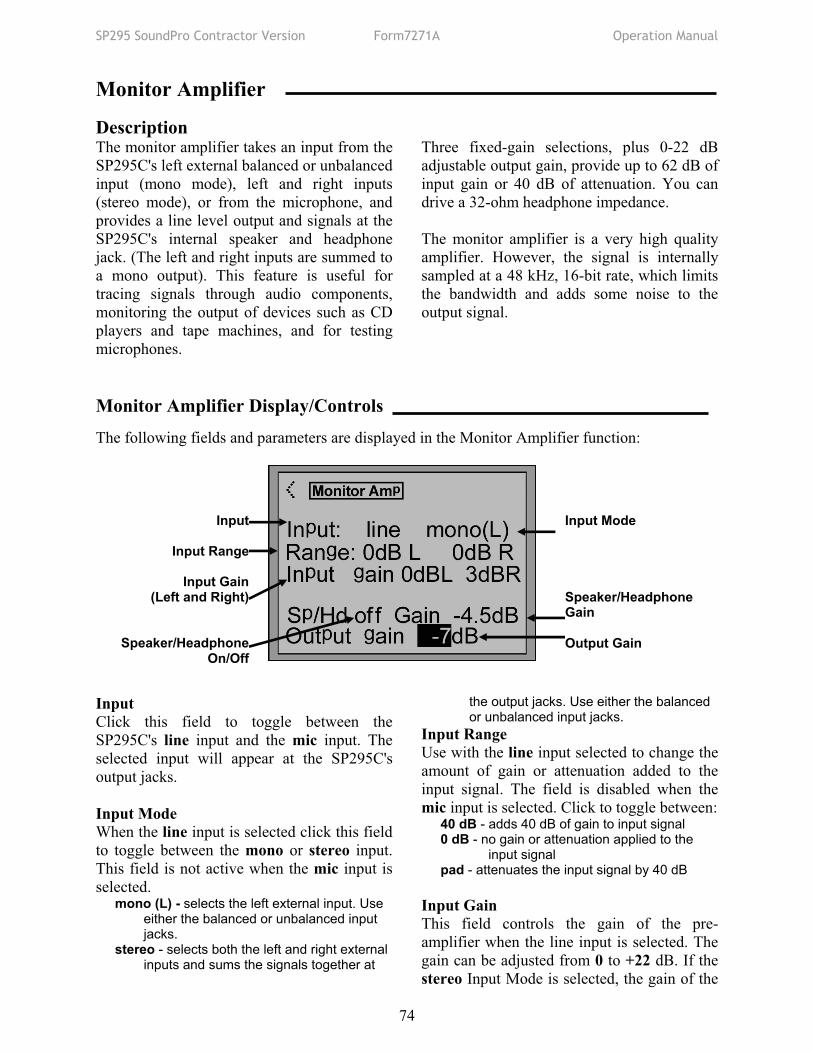
SP295 SoundPro Contractor Version Form7271A Operation Manual
74
Monitor Amplifier Description The monitor amplifier takes an input from the SP295C's left external balanced or unbalanced input (mono mode), left and right inputs (stereo mode), or from the microphone, and provides a line level output and signals at the SP295C's internal speaker and headphone jack. (The left and right inputs are summed to a mono output). This feature is useful for tracing signals through audio components, monitoring the output of devices such as CD players and tape machines, and for testing microphones.
Three fixed-gain selections, plus 0-22 dB adjustable output gain, provide up to 62 dB of input gain or 40 dB of attenuation. You can drive a 32-ohm headphone impedance. The monitor amplifier is a very high quality amplifier. However, the signal is internally sampled at a 48 kHz, 16-bit rate, which limits the bandwidth and adds some noise to the output signal.
Monitor Amplifier Display/Controls The following fields and parameters are displayed in the Monitor Amplifier function:
Input Click this field to toggle between the SP295C's line input and the mic input. The selected input will appear at the SP295C's output jacks. Input Mode When the line input is selected click this field to toggle between the mono or stereo input. This field is not active when the mic input is selected.
mono (L) - selects the left external input. Use either the balanced or unbalanced input jacks.
stereo - selects both the left and right external inputs and sums the signals together at
the output jacks. Use either the balanced or unbalanced input jacks.
Input Range Use with the line input selected to change the amount of gain or attenuation added to the input signal. The field is disabled when the mic input is selected. Click to toggle between:
40 dB - adds 40 dB of gain to input signal 0 dB - no gain or attenuation applied to the
input signal pad - attenuates the input signal by 40 dB
Input Gain This field controls the gain of the pre-amplifier when the line input is selected. The gain can be adjusted from 0 to +22 dB. If the stereo Input Mode is selected, the gain of the
Input
Input Range
Input Gain (Left and Right)
Speaker/Headphone On/Off
Input Mode Speaker/Headphone Gain Output Gain

SP295 SoundPro Contractor Version Form7271A Operation Manual
75
left and right channels can be adjusted separately. Headphone & Speaker Gain Use this field to set the amount of gain (-79.5 to 0 dB) for the signal at the headphone and internal speaker outputs. Connecting a plug to the headphone jack disables output from the internal speaker. Headphone & Speaker On/Off
Click this field to turn the internal speaker and headphone signal on and off. Output Gain Use this field to control the gain (attenuation) of the output amplifier that provides the signal at the balanced and unbalanced output jacks, and internal speaker and headphone outputs. The attenuation is variable from 0 to -79 dB.
Monitor Amplifier Operation
1. Connect the input signal to be monitored to the SP295C balanced or unbalanced input. Use either the left input, or both the left and right inputs, or use the microphone.
2. Select the corresponding input and input mode.
� If you are applying a signal to the left line input only, select line input, and mono(L) input mode. This will route the left input signal to both outputs.
� If you are applying a signal to both the left and right inputs, select line input, and stereo input mode. This will sum the signals from the left and rights inputs and send it to the output.
� If you are using the SP295C's microphone to pickup the signal, select mic input.
3. Select the desired line input range (0 dB, +40 dB amp, 40 dB pad). Be careful when selecting 40 dB gain as this often provides enough gain to over-drive the output or headphones.
4. Select the desired input and output gain settings for proper level and to avoid
distortion. If desired, turn on the headphone/speaker output. Note: if you select the Stereo input mode and connect a signal to only one of the inputs, you may hear noise in the output at high gain settings.

SP295 SoundPro Contractor Version Form7271A Operation Manual
76
Save Settings This screen allows you to store the following default instrument setup values:
� all of the last selected sub-menus. � last selected signal generator waveform type,
frequency, and level. � last selected RTA graph settings. � last selected audio scope settings. � last selected level settings for most functions. � last selected input selections for most functions. � last selected AHT reverb / early reflection
settings. The default setup values are stored in non-volatile memory and are retrieved whenever the SoundPro is turned on. All stored settings are updated with the current settings each time you restore the values. To store a set of user defaults:
1. Go to the Save Settings screen on the Utilities menu. 2. Move the cursor to the Save field and click. 3. Click on the '<' field to exit the function. All current settings are now stored, and will be
recalled each time the SoundPro is turned on.

SP295 SoundPro Contractor Version Form7271A Operation Manual
77
Setup & Calibration The Setup and Calibration utility has two options: General and SPL Calib. Each SoundPro is fully tested and calibrated before it leaves the factory. All calibration constants are stored in non-volatile memory. Accurate
operation of the SoundPro depends on this calibration. For this reason, only the General Setup menu is covered here. Contact the Sencore Service Department if you feel your unit needs re-calibration.
General Setup Screen: This menu has fields for miscellaneous data values that are stored in the SoundPro. Each is described below. Since you can alter the contents of the calibration values stored in the SoundPro, be careful with these data fields! If you are unsure of what to do, contact Sencore technical support before altering any setting. DC Backlight On - This field controls how many seconds the display backlight stays on after the control knob is last turned or clicked. Enter any number of seconds from 0 to 999. Keeping the backlight off conserves battery power. The backlight stays on continuously under AC power. Burn-in - This field indicates whether or not the SoundPro has been through the burn-in process. When a SoundPro is first powered up during the manufacturing process, it enters a burn-in and self-calibrate state. Several constants are stored at this time. The unit may be forced through the burn-in process again by setting the burn-in data field on the General Setup menu to No, exiting the menu, and powering the unit off and back on. The burn-in procedure takes one hour to complete. Note that this may affect the main calibration. Contact Sencore technical support before changing this field.
Factory Calibration - This field indicates whether or not the SoundPro has been through the factory calibration process. The factory calibration process requires a special calibration fixture. Contact Sencore technical support before changing this field. Restore Factory Calibration - The factory calibration constants are stored in non-volatile memory. A second copy of the constants is also stored so that, if the first set is altered, the original factory calibration can be restored. To do this, set the Restore Cal data field on the General Setup menu to Yes and exit the menu. The original factory calibration will be restored.

SP295 SoundPro Contractor Version Form7271A Operation Manual
78
PC Interface/About This screen provides unit information and technical support contact information about your SoundPro. It displays the version number and date of the installed firmware. This function allows you to transfer data to a computer for storage, further analysis or printing. The data is in a comma-delimited ASCII format, and includes headers that identify the data. To transfer data, connect the supplied serial adapter cable between the Serial Interface port on the SoundPro and an open serial port on the host computer. You will need to run an application program such as the SoundPro Audio Report software to transfer the data.

SP295 SoundPro Contractor Version Form7271A Operation Manual
79
Appendix A - dB SPL Scale The 0 dB SPL reference level is set at 20 μPa (pressure equal to the threshold of hearing at 1 kHz). This places the upper threshold of pain near 135 dB SPL. Unless otherwise noted, SPL readings use this reference and omit the "SPL" notation. For example, a sound level expressed as 60 dB is actually 60 dB SPL, referenced to 20 μPa.
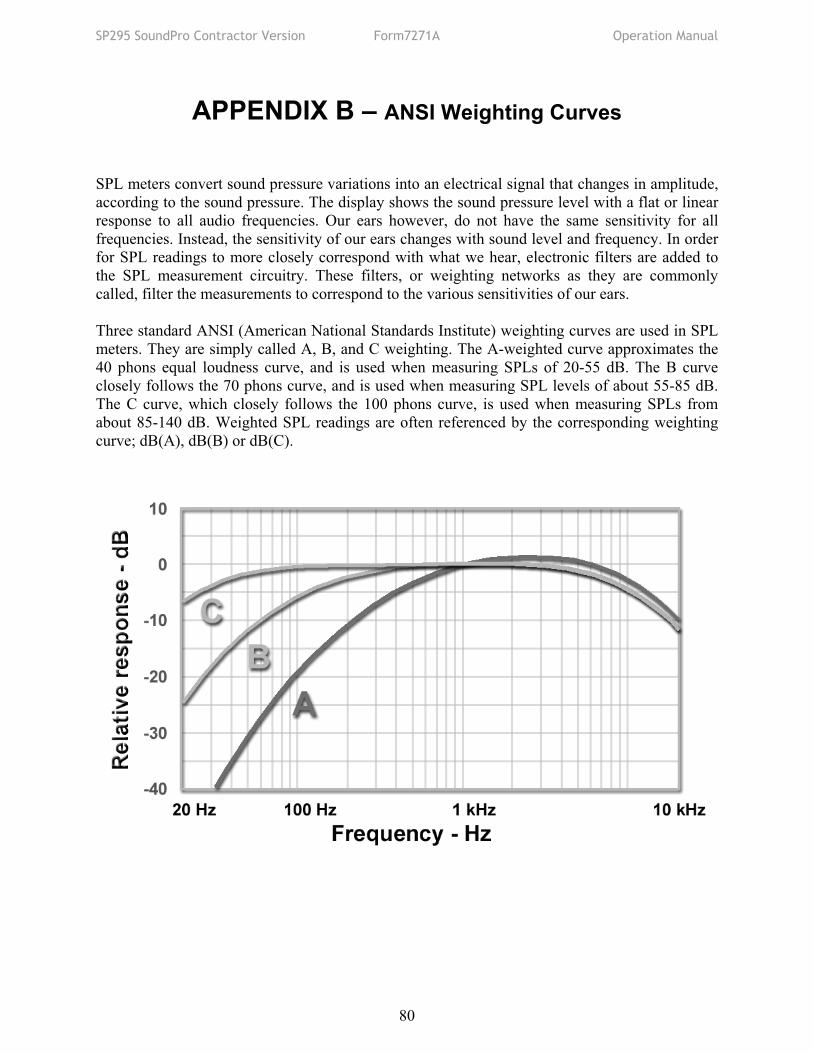
SP295 SoundPro Contractor Version Form7271A Operation Manual
80
APPENDIX B – ANSI Weighting Curves SPL meters convert sound pressure variations into an electrical signal that changes in amplitude, according to the sound pressure. The display shows the sound pressure level with a flat or linear response to all audio frequencies. Our ears however, do not have the same sensitivity for all frequencies. Instead, the sensitivity of our ears changes with sound level and frequency. In order for SPL readings to more closely correspond with what we hear, electronic filters are added to the SPL measurement circuitry. These filters, or weighting networks as they are commonly called, filter the measurements to correspond to the various sensitivities of our ears. Three standard ANSI (American National Standards Institute) weighting curves are used in SPL meters. They are simply called A, B, and C weighting. The A-weighted curve approximates the 40 phons equal loudness curve, and is used when measuring SPLs of 20-55 dB. The B curve closely follows the 70 phons curve, and is used when measuring SPL levels of about 55-85 dB. The C curve, which closely follows the 100 phons curve, is used when measuring SPLs from about 85-140 dB. Weighted SPL readings are often referenced by the corresponding weighting curve; dB(A), dB(B) or dB(C).

SP295 SoundPro Contractor Version Form7271A Operation Manual
81
APPENDIX C – ANSI Balanced Noise-Criterion Curves Simple SPL measurements do not represent the background noise our ears hear. Because our ears are less sensitive to low frequency noise than to high frequency noise, noise levels at higher frequencies must be given more weight than levels at lower frequencies. This results in a set of curves called Noise Criterion or NC curves. The curves are arbitrarily numbered for easy reference. The Noise Criteria (NC) rating of a room is the number of the lowest curve that is not exceeded by any of the noise in the room. To determine an NC rating, the noise levels at 8 different octave band frequencies are measured and compared to the Noise Criteria curves.

SP295 SoundPro Contractor Version Form7271A Operation Manual
82
Notes

SP295 SoundPro Contractor Version Form7271A Operation Manual
83
WARRANTY AND SERVICE INFORMATION WARRANTY Your SP295C SoundPro Contractor Version has been built to the highest quality standards in the industry. Each unit has been tested, aged under power for at least 24 hours and then every function and range was retested to insure it met all published specifications. Your instrument is fully protected with a 1-year warranty. SERVICE Save the original shipping carton and packing material for reuse if you ever need to ship your SP295C, or return it to the Sencore factory for repair.
1. If you are returning the unit to Sencore for service, call the service department at the number below and enclose the following information: owner's address, billing information, purchase order (if applicable), name and phone number of contact person, description of problem and reason for return. No return authorization is required.
2. Completely enclose the unit inside a plastic bag to protect its finish and prevent foreign
material from getting inside.
3. Cushion the unit equally on all sides with a minimum of 3 inches of padding material. Pack the padding tightly enough to prevent the unit from shifting during shipment.
4. Seal all seams on the container with strapping tape.
5. Send the packed unit to the following address (we recommend shipping via United Parcel
Service): SENCORE FACTORY SERVICE 3200 Sencore Drive Sioux Falls, SD 57107 Most service repairs are completed within 72 hours. If you need to ask about your unit, the Sencore Service Department phone number is: 1-605-339-0100 or 1-800-SENCORE (736-2673) or FAX (605) 339-7032 Fill in for your records:
Purchase date: _________________________ Serial Number (on opening power-on display) _______________________ Software version (in Utilities ABOUT menu) _________________________

SP295 SoundPro Contractor Version Form7271A Operation Manual
84
3200 Sencore Drive Sioux Falls, SD 57107 Call 1-800-SENCORE (736-2673) Innovatively designed www.sencore.com with your time in mind. Form7271A Printed in U.S.A.


![Transcend: [verb] to go beyond the limits of; exceed; be above and independent of the physical universe.](https://static.fdocuments.net/doc/165x107/56649dd35503460f94acae37/transcend-verb-to-go-beyond-the-limits-of-exceed-be-above-and-independent.jpg)


