SOVEREIGN RATING MODEL - Piraeus Bank · To accomplish the above objective we needed to develop a...
35
SOVEREIGN RATING MODEL: GREEK SOVEREIGN RATING WORSE THAN WE DESERVE FEBRUARY 2017 Ilias Lekkos Dimitria Rotsika Haris Giannakidis ECONOMIC RESEARCH & INVESTMENT STRATEGY
Transcript of SOVEREIGN RATING MODEL - Piraeus Bank · To accomplish the above objective we needed to develop a...

SOVEREIGN RATING MODEL:
GREEK SOVEREIGN RATING WORSE THAN WE DESERVE
FEBRUARY 2017
Ilias Lekkos
Dimitria Rotsika
Haris Giannakidis
ECONOMIC RESEARCH & INVESTMENT STRATEGY
CONTENTS
2
Introduction
Aim of the Study & Conclusion
Sovereign Ratings Analysis
Greek Credit Rating
Appendix I: Methodology
Appendix II: Factor-Driven Credit Rating Decisions vs. Actual
Full Sample

3
INTRODUCTION

INTRODUCTION
4
One of the main factors exerting –one could even argue excessive- influence on the decisions andconsiderations of both policy makers and market participants is the sovereign rating assigned by themain rating agencies to each economy.
The significance of sovereign ratings stems from the influence they exert on the ability of eachgovernment to issue debt on local and global bond markets as well as on the pricing of this debt.
Furthermore, sovereign ratings in most cases impose a ceiling on the ratings of all financial and non-financial corporates, thus affecting both the cost of funding and the cost of capital of the entire economy.
The profound effect of sovereign credit ratings on economic activity is all too well known in the case ofGreece, where the downgrade of the Hellenic Republic to below investment grade led to the “financialisolation” of the Greek state from the global financial system.
Yet, given that the Greek economy stands once again on the cusp of recovery and the Greek bankingsystem is confident and robust enough to start planning forward for the upcoming three to five years,the rating outlook of the Greek sovereign debt is coming back to the fore with a vengeance.
For that reason, we have developed a sovereign rating model that allows us to examine and forecast thecredit rating of the Hellenic Republic – as well as the sovereign rating of a large number of othereconomies - under various macroeconomic scenarios in an objective and transparent way.

AIM OF THE STUDY
5
As we have already stated, the ultimate objective of this study is to explain and forecast the credit rating ofthe Greek Sovereign. To accomplish the above objective we needed to develop a fully-fledged sovereignrating model able to describe the sovereign ratings of more than 120 countries. The main features of ourmodel are:
Objectivity: contrary to most rating agencies that base their ratings on both quantitative and qualitative criteria(and delegate the final ratings decision to “Rating Committees”), we used only publicly available data andindicators as inputs to our model.
Sensitivity: most agencies pride themselves on the “stability” of their ratings. Instead, we believe that ratingsshould change when data change. For that reason, we used cross-sectional data (instead of pooled panel data)to allow our ratings to vary at each particular point in time.
Non-recursiveness: one way to improve the in-sample performance of the model is to include a laggeddependent variable (in our case past credit ratings) as an explanatory factor. We chose not to go down this roadsince we desired to identify a pure relationship between macro-factors and ratings.

SUMMARY OF RESULTS
6
The main conclusion of our research is that Greece’s actual rating was out of step with macroeconomicfundamentals throughout the period we examine.
In the pre-crisis period, rating agencies over-rated Greece perhaps taking into consideration an implicit“positive” premium from Greece’s participation in a strong monetary union such as the EuroArea, its robustbanking system and a history of a strong economic performance. This translated into a rating in the Single-A rating band as opposed to our fundamentals-based rating assessment in the Baa rating band.
This “premium” turned negative as the crisis broke out. As a result, Greece is now being penalised beyondfundamentals. This penalty is carried over into the future depriving Greece of a rating upgrade into thesingle-B rating band. Finally, we run a sensitivity analysis where we examined the evolution of Greece’ssovereign rating under both an adverse and a positive macro scenario for 2016 – 2017.
The findings revealed that the size of the “negative Premium” currently embedded in Greece’s rating is ofsuch a magnitude that Greece deserves an upgrade to the single-B band even under the pessimist'sassumption incorporated in the adverse scenario.

7
SOVEREIGN RATINGS ANALYSIS

SOVEREIGN RATINGS: DEFINITION
8
In principle sovereign ratings (like any other form of credit rating) fall in one of two categories:
1. The ones that try to capture the relative likelihood of a borrower defaulting on itsobligations.
2. The ones that try to reflect not only the probability of a default, but also the relative loss inthe event of default.
In our case, we focus on the second type of sovereign ratings (such as Moody’s) because we believe that –given the PSI experience- it is the assessment of total loss that is relevant for the rating of Greek sovereigndebt and not just the probability of default, which could occur for purely technical reasons and withoutany material loss to bondholders.

SOVEREIGN RATINGS: DESCRIPTION
9
Source: Piraeus Bank Research, Moody’s, IMF, World Bank
Analytical Rating Grouped Rating Band Indicates
Aaa Aaa Highest quality with minimal risk.
Aa1
Aa High quality, subject to very low default risk.Aa2
Aa3
A1
A Upper-medium grade, subject to low credit risk.A2
A3
Baa1
BaaMedium-grade, moderate credit risk, may have
speculative characteristics.Baa2
Baa3
Ba1
Ba Substantial credit risk, have speculative characteristics.Ba2
Ba3
B1
B High credit risk, considered speculative.B2
B3
Caa1
Caa Very high credit risk, poor standing.Caa2
Caa3
Ca CaHighly speculative. Likely in or very near default with
some prospect of recovery of principal or interest.
C CLowest rated class of bonds. Typically in default with
little prospect for recovery of principal or interest.

SOVEREIGN RATINGS: RATINGS EVOLUTION
10
Source: Piraeus Bank Research, Moody’s, IMF, World Bank
Moody’s Sovereign Ratings 2006-16
0
10
20
30
40
C Ca Caa B Ba Baa A Aa Aaa
Fre
qu
en
cy
2006
2016
o In the past ten years we witnessed important fluctuations in the sovereign
rating scores with a downward shift towards the lower end of the rating
distribution. In 2006, for example, only 15% of the total number of
countries examined had been rated by Moody’s in the B rating band.
However, in 2016 the percentage of countries rated in the same rating
band had doubled. Interestingly, the very low rating band Caa, which
stands just one step before the characterization “very near default”,
increased substantially in absolute terms from four countries in 2006 to
eight in 2016.
o On the other hand, rating scores in the upper bands of the rating
distribution declined by half in 2016 in comparison to their sovereign
ratings ten years ago. In particular, the percentage of countries rated in
the Aaa and A rating bands, which in 2006 was 19% and 24% respectively,
declined in 2016 by ten percentage points.
o The severity of the economic events after 2007-2008 and the emphasis
given to debt sustainability and fiscal prudence had an important impact
on rating decisions. Specifically, from a total of 124 countries, only 14%
were upgraded to a higher rating while 31% were downgraded.
Furthermore, the ratio of downgrades/upgrades differed with respect to
geographic regions. For example, only one out of 38 (3%) European
countries was upgraded compared to non-European regions where this
number was 13 out of 86 (15%). On the contrary, the percentage of
downgrades in Europe reached 42% while in non-European countries it
was 18%, i.e. less than half.
Sovereign Rating Revisions in a Decade
19
16
1
38
16
13
0%
10%
20%
30%
40%
50%
60%
70%
80%
90%
100%
neutral downgrade upgrade
Europe Non-Europe
55%31%
14%
neutral
downgrade
upgrade

SOVEREIGN RATINGS: METHODOLOGY
11
Rating decisions are initiated by the implementation of three steps:
i) data collection and aggregation,
ii) creation of a scoring system and
iii) the rating decision
The factors that drive Moody’s rating procedure are identified as:
i) Economic Strength
ii) Institutional Strength
iii) Fiscal Strength
iv) Event Risk, which represents the sensitivity of each country’s economy to unanticipatedevents such as market crashes, political uncertainty or geopolitical risks.
In particular, the publicly available methodology of Moody’s is based on 31 macroeconomic and survey-based indicators which are aggregated into four broad indicators or factors. We follow the same procedurewith slight modifications in the variable construction process whenever data are not available.

12
Source: Piraeus Bank Research, Moody’s, IMF, World Bank
SOVEREIGN RATINGS: METHODOLOGY
Rating
Economic
Strength
Institu-
tional
Strength
Event
Risk
Fiscal
Strength
Growth Dynamics
Average Real GDP Growth, Volatility of
Real GDP Growth, WEF Competitiveness
Index
Scale of Economy Nominal GDP ($bn)
National Income GDP/Capita (PPP,$)
Adjustment FactorCredit Boom (Credit Growth/NGDP
Growth)(t-2-->t) >2
Political Risk
Domestic Political Risk (Voice &
Accountability, GDP per capita),
Geopolitical Risk (Global Conflict Risk
Index)
Government
Liquidity Risk
Fundamental Metrics (Government
External Debt to Government Debt)
Banking Sector Risk
Banking System Size (Total Bank Assets to
GDP), Funding Vulnerabilities (Gross Loans
to Deposits)
External
Vulnerability Risk
(Current Account Balance & FDI) to GDP,
External Vulnerability Indicator t+2, Net
International Investment Position to GDP
Debt BurdenGeneral Govt. Debt to GDP, General Govt.
Debt to Revenues
Debt Affordability
General Govt. Interest Payments to
Revenues, General Govt. Interest Payments
to GDP
Adjustment Factor
Debt to GDP Trend (t-4-->t+1), General
Govt. Foreign Currency Debt to General
Govt. Debt
Institutional Framework & Effectiveness
Government Effectiveness, Rule of Law,
Control of Corruption
Policy & Credibility Inflation Level, Inflation volatility

ECONOMIC STRENGTH FACTOR
o The economic factor is constructed by aggregating five indicators of
economic activity representing three aspects of economic activity, namely
growth dynamics, economy’s size and income per individual. Following that,
the aforementioned five economic indicators are adjusted to account for the
diversification in the country’s economic activities as well as to the degree of
growth that is generated by credit growth.
o The standardised values of the economic factor in 2015 for the 124 countries
rated by Moody’s ranged between -4.81 standard deviations (std) for
Azerbaijan and 28.3 std for the United States because of its relatively large
size indicated by its Nominal GDP in US dollars.
o In terms of economic strength, Greece stands at -1.13 std due to its very low
average real GDP growth rate over the past seven years. Clearly, the debt crisis
in Europe has significantly affected the economic potential for several
countries in the Eurozone. However, after 2012 there are signs of recovery for
all these countries, albeit with great differences on the speed of returning to a
positive growth environment.
13
Distribution of Economic Strength Factor: 2015
Economic Strength Comparisons
0
5
10
15
20
25
30
35
40
-4.8
-2.6
-0.4
1.8
4.0
6.2
8.4
10
.6
12
.8
15
.1
17
.3
19
.5
21
.7
23
.9
26
.1
28
.3
Fre
qu
en
cy
US
Greece
Source: Piraeus Bank Research, Moody’s, IMF, World Bank
-3
-2
-1
0
1
2
3
Greece Cyprus Ireland Portugal Spain
Economic Strength
2007 2009 2012 2015
Economic Growth
Volatility of GDP
Competitiveness Index
Nominal GDP
Per Capita GDP
Credit Expansion

FISCAL STRENGTH FACTOR
14
Fiscal Strength Comparisons
Distribution of Fiscal Strength Factor: 2015
0
2
4
6
8
10
12
14
16
-7.0
-6.3
-5.7
-5.0
-4.3
-3.6
-2.9
-2.2
-1.6
-0.9
-0.2
0.5
1.2
1.8
2.5
3.2
Fre
qu
en
cy
Lebanon
Greece
Source: Piraeus Bank Research, Moody’s, IMF, World Bank
-5
-4
-3
-2
-1
0
1
2
3
Greece Cyprus Ireland Portugal Spain
Fiscal Strength
2007 2009 2012 2015
Debt to GDP
Debt to GDP Trend
Debt to Revenues
Interest Payments to Revenues
Interest Payments to GDP
o Similarly, the fiscal factor is based on five ratio indicators related to
public fiscal position and more specifically to the collection of
revenues, the interest paid on government debt and most importantly
to the government debt level. We can therefore conclude that the fiscal
strength factor provides a picture of the debt burden and the ability of
a country’s government to repay it.
o The standardised values of the fiscal factor in 2015 ranged between -7
std for Lebanon and 3.2 std for Hong Kong. Despite the fact that
Greece was under a significant fiscal adjustment, its fiscal strength lies
at the lower left region of the distribution at -2.56 std. This relates
mostly to its very high debt level rather than to the interest paid or the
revenue collection. For example, in Greece the debt/GDP ratio stands at
5.83 std compared to the other countries in our extensive sample.
o Clearly the picture is pretty much the same in the countries that were in
a programme during the Eurozone debt crisis. Typically the fiscal
strength factor plummeted by more than one std in the period 2007-
2012 and there are no signs of a noteworthy improvement during the
more recent years with the exception of Ireland.

INSTITUTIONAL STRENGTH FACTOR
o Perhaps the most important, but at the same time the most overlooked,
aspect in economic analysis is a country’s ability to function properly. The
institutional strength factor relates to two inflation-based variables that
correspond to policy effectiveness and three World Bank indicators that
represent the government efficiency and the level of corruption in a country.
o The standardised values of the institutional indicator in 2015 ranged between
-8.1 std for the Republic of Congo and 5.4 std for Singapore. In Greece, the
institutional strength stands in the middle of the factor’s distribution.
Nevertheless, it is important to note that the institutional strength decreased
from two std in 2007 to less than 0.5 std in 2015 in sharp contrast to the rest
of the Eurozone members.
o With respect to the World Bank’s indicators, the Greek debt crisis resulted in
severe instability in the political stage. As a result, over the 7-year period since
2007, government effectiveness deteriorated by 50%, law enforcement and
law acceptance by the citizens declined by 72% and the control of corruption
plummeted by 150%.
15
Distribution of Institutional Strength Factor: 2015
Distribution of Event Risk Factor: 2015
Source: Piraeus Bank Research, Moody’s, IMF, World Bank
0
2
4
6
8
10
12
14
16
-8.1
-7.2
-6.3
-5.4
-4.5
-3.6
-2.7
-1.8
-0.9
0.0
0.9
1.8
2.7
3.6
4.5
5.4
Fre
qu
en
cy
Congo
Greece
0.0
0.5
1.0
1.5
2.0
2.5
3.0
3.5
4.0
4.5
5.0
Greece Cyprus Ireland Portugal Spain
Institutional Strength
2007 2009 2012 2015
Government Effectiveness
Rule of Law
Control of Corruption
Inflation Level
Inflation Volatility
EVENT RISK FACTOR
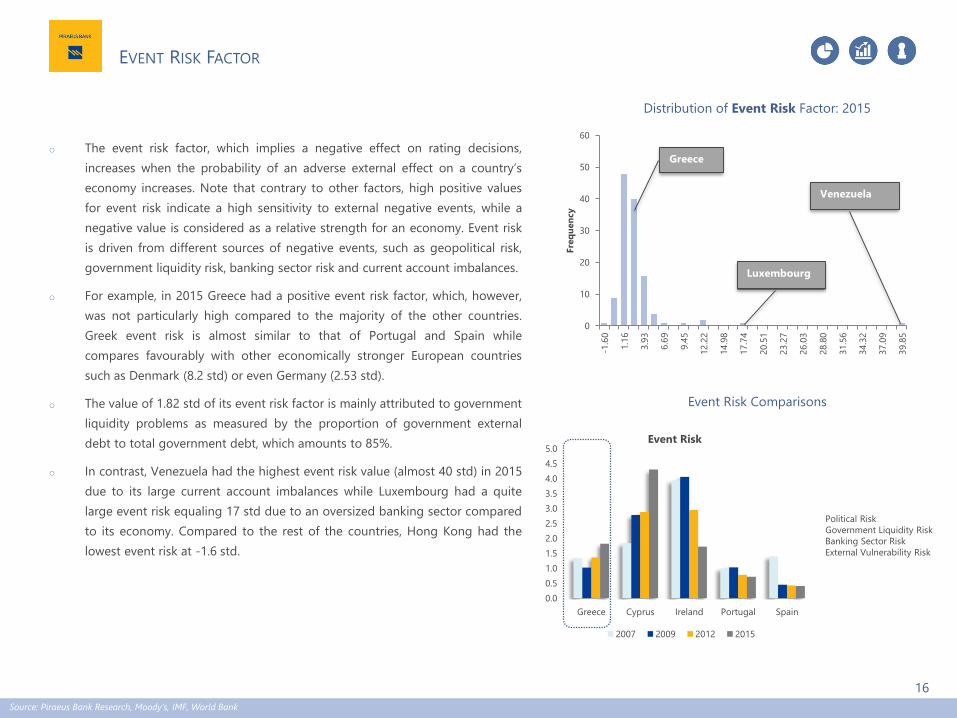
o The event risk factor, which implies a negative effect on rating decisions,
increases when the probability of an adverse external effect on a country’s
economy increases. Note that contrary to other factors, high positive values
for event risk indicate a high sensitivity to external negative events, while a
negative value is considered as a relative strength for an economy. Event risk
is driven from different sources of negative events, such as geopolitical risk,
government liquidity risk, banking sector risk and current account imbalances.
o For example, in 2015 Greece had a positive event risk factor, which, however,
was not particularly high compared to the majority of the other countries.
Greek event risk is almost similar to that of Portugal and Spain while
compares favourably with other economically stronger European countries
such as Denmark (8.2 std) or even Germany (2.53 std).
o The value of 1.82 std of its event risk factor is mainly attributed to government
liquidity problems as measured by the proportion of government external
debt to total government debt, which amounts to 85%.
o In contrast, Venezuela had the highest event risk value (almost 40 std) in 2015
due to its large current account imbalances while Luxembourg had a quite
large event risk equaling 17 std due to an oversized banking sector compared
to its economy. Compared to the rest of the countries, Hong Kong had the
lowest event risk at -1.6 std.
16
Distribution of Event Risk Factor: 2015
Source: Piraeus Bank Research, Moody’s, IMF, World Bank
0
10
20
30
40
50
60
-1.6
0
1.1
6
3.9
3
6.6
9
9.4
5
12
.22
14
.98
17
.74
20
.51
23
.27
26
.03
28
.80
31
.56
34
.32
37
.09
39
.85
Fre
qu
en
cy
Luxembourg
Greece
Venezuela
0.0
0.5
1.0
1.5
2.0
2.5
3.0
3.5
4.0
4.5
5.0
Greece Cyprus Ireland Portugal Spain
Event Risk
2007 2009 2012 2015
Political Risk
Government Liquidity Risk
Banking Sector Risk
External Vulnerability Risk
Event Risk Comparisons

DATA DESCRIPTION
17
Source: Piraeus Bank Research, Moody’s, IMF, World Bank
# of Countries 124
# of Years 11 years
Time Span 2007-2017
Outliers
To facilitate the statistical properties of our scoring
model we truncate outliers in each of the four
factor variables. As a result, we avoid extreme
values that distort the statistical analysis. The
maximum and minimum values used for
truncation purposes are decided on a factor by
factor case and are affected by qualitative and
judgmental criteria.
Standardisations
We standardise each variable with a mean and
standard deviation that are consistent with the
rating system of Moody’s. In particular for the
mean we take the average for Moody’s middle (or
‘M’) rating band. Similarly for the standard
deviation we get the average range of the 15
notch rating system and divide it by 0.4 which is
the value (in std’s) of each notch value change
Data SourcesMoody’s Rating Agency, International Monetary
Fund, World Bank.

STATISTICAL ANALYSIS: MULTINOMIAL RATING SCORE MODELS
o Our main goal is to extract implied ratings from actual agency
rating decisions and more specifically those made by Moody’s.
One helpful statistical tool for this task is the multinomial ordered
logit models (in the appendix we provide a thorough explanation
on how these models work), which are considered useful when
the variable of interest takes discrete values. The specific model
can be used to test which of the underlying factors are
statistically relevant in explaining rating decisions as well as to
enable projecting the probability distribution of rating decisions
in a forward-looking context.
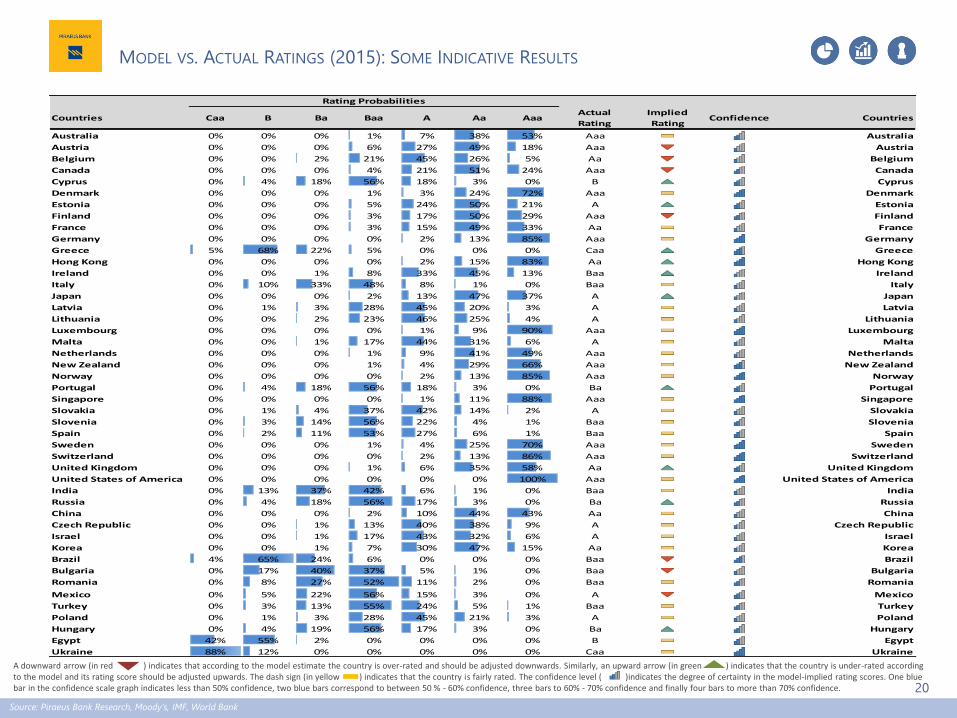
o The results presented in the table are based on the model
estimates for 2015. We should keep in mind that the
interpretation of the parameter estimates for non-linear
regression models is not straightforward as in more standard
models. However, if the coefficient sign is positive, the higher the
value of the corresponding factor the more likely it is for a
country to be assigned the highest rating band (i.e. Aaa), while
the opposite holds for a negative coefficient value.
o According to our methodology, the four factors that are used to
explain credit ratings are jointly statistically significant and
consequently their use is considered helpful in explaining and
projecting rating decisions. On the other hand, the standalone
coefficient of the event risk factor (i.e. domestic political
uncertainty, liquidity risk, banking sector strength and current
account imbalances) is not statistically significant. This might be
explained by the fact that these events occur rather infrequently
and as a result the impact of this factor is difficult to be reflected
on the rating decisions.
18
Multinomial Logit Estimates & Performance
Source: Piraeus Bank Research, Moody’s, IMF, World Bank
Variable coefficient z-statistic p-value
Economic Strength 0.43 3.04 0.00
Institutional Strength 0.95 6.63 0.00
Fiscal strength 1.06 6.29 0.00
Event Risk 0.08 0.56 0.58
Pseudo-R² 0.44
Overall Developed Developing
Hit ratio 57% 61% 56%
Over Rated 21% 13% 24%
Under Rated 22% 26% 20%
o The performance of the model estimates is better assessed by
the hit ratio of the implied versus the actual rating scores. The
hit ratio indicates the percentage of implied ratings that are in
line with the actual ratings. In general, the multinomial logit
model performs relatively well since more than 50% of the
implied ratings were the same with the actual ratings.
Furthermore, the hit ratio of developed countries is higher than
the hit ratio of developing countries indicating the importance
of other factors in the rating decision process for emerging
market economies. Interestingly, according to our findings
based on our model’s estimates for 2015, it is more likely for a
developed country to be under-rated rather than over-rated.

MULTINOMIAL RATING SCORE MODELS
o It is important to note that we can perform comparisons of each
factor’s impact on the likely outcome of a rating decision. We showed
previously that not all factors are of equal importance from the credit
rating agencies’ perspective. In particular, according to the coefficient
of our statistical model the most important factors are those that
measure economic, institutional and fiscal strength.
o Interestingly, economic strength is only half as important as
institutional and fiscal strength. For example, the marginal effect (i.e.
neglecting the impact from all other factors) for Greece’s Baa
probability from an increase in the economic factor by 1 standard
deviation is 5%, while the corresponding effect of a similar increase in
the fiscal factor is 18%. A probable explanation can be the high debt
to GDP levels in the Eurozone and in developed economies as well as
the substantial impact of political uncertainty and governance
indicators on the soundness of fiscal policies management in a
country.
19
Marginal Factor Effects
-30%
-25%
-20%
-15%
-10%
-5%
0%
5%
10%
15%
20%
Caa B Baa
Economic Fiscal Institutional
Source: Piraeus Bank Research, Moody’s, IMF, World Bank
20
MODEL VS. ACTUAL RATINGS (2015): SOME INDICATIVE RESULTS
Source: Piraeus Bank Research, Moody’s, IMF, World Bank
A downward arrow (in red ) indicates that according to the model estimate the country is over-rated and should be adjusted downwards. Similarly, an upward arrow (in green ) indicates that the country is under-rated according to the model and its rating score should be adjusted upwards. The dash sign (in yellow ) indicates that the country is fairly rated. The confidence level ( )indicates the degree of certainty in the model-implied rating scores. One blue bar in the confidence scale graph indicates less than 50% confidence, two blue bars correspond to between 50 % - 60% confidence, three bars to 60% - 70% confidence and finally four bars to more than 70% confidence.
Countries Caa B Ba Baa A Aa AaaActual
Rating
Implied
RatingConfidence Countries
Australia 0% 0% 0% 1% 7% 38% 53% Aaa Australia
Austria 0% 0% 0% 6% 27% 49% 18% Aaa Austria
Belgium 0% 0% 2% 21% 45% 26% 5% Aa Belgium
Canada 0% 0% 0% 4% 21% 51% 24% Aaa Canada
Cyprus 0% 4% 18% 56% 18% 3% 0% B Cyprus
Denmark 0% 0% 0% 1% 3% 24% 72% Aaa Denmark
Estonia 0% 0% 0% 5% 24% 50% 21% A Estonia
Finland 0% 0% 0% 3% 17% 50% 29% Aaa Finland
France 0% 0% 0% 3% 15% 49% 33% Aa France
Germany 0% 0% 0% 0% 2% 13% 85% Aaa Germany
Greece 5% 68% 22% 5% 0% 0% 0% Caa Greece
Hong Kong 0% 0% 0% 0% 2% 15% 83% Aa Hong Kong
Ireland 0% 0% 1% 8% 33% 45% 13% Baa Ireland
Italy 0% 10% 33% 48% 8% 1% 0% Baa Italy
Japan 0% 0% 0% 2% 13% 47% 37% A Japan
Latvia 0% 1% 3% 28% 45% 20% 3% A Latvia
Lithuania 0% 0% 2% 23% 46% 25% 4% A Lithuania
Luxembourg 0% 0% 0% 0% 1% 9% 90% Aaa Luxembourg
Malta 0% 0% 1% 17% 44% 31% 6% A Malta
Netherlands 0% 0% 0% 1% 9% 41% 49% Aaa Netherlands
New Zealand 0% 0% 0% 1% 4% 29% 66% Aaa New Zealand
Norway 0% 0% 0% 0% 2% 13% 85% Aaa Norway
Portugal 0% 4% 18% 56% 18% 3% 0% Ba Portugal
Singapore 0% 0% 0% 0% 1% 11% 88% Aaa Singapore
Slovakia 0% 1% 4% 37% 42% 14% 2% A Slovakia
Slovenia 0% 3% 14% 56% 22% 4% 1% Baa Slovenia
Spain 0% 2% 11% 53% 27% 6% 1% Baa Spain
Sweden 0% 0% 0% 1% 4% 25% 70% Aaa Sweden
Switzerland 0% 0% 0% 0% 2% 13% 86% Aaa Switzerland
United Kingdom 0% 0% 0% 1% 6% 35% 58% Aa United Kingdom
United States of America 0% 0% 0% 0% 0% 0% 100% Aaa United States of America
India 0% 13% 37% 42% 6% 1% 0% Baa India
Russia 0% 4% 18% 56% 17% 3% 0% Ba Russia
China 0% 0% 0% 2% 10% 44% 43% Aa China
Czech Republic 0% 0% 1% 13% 40% 38% 9% A Czech Republic
Israel 0% 0% 1% 17% 43% 32% 6% A Israel
Korea 0% 0% 1% 7% 30% 47% 15% Aa Korea
Brazil 4% 65% 24% 6% 0% 0% 0% Baa Brazil
Bulgaria 0% 17% 40% 37% 5% 1% 0% Baa Bulgaria
Romania 0% 8% 27% 52% 11% 2% 0% Baa Romania
Mexico 0% 5% 22% 56% 15% 3% 0% A Mexico
Turkey 0% 3% 13% 55% 24% 5% 1% Baa Turkey
Poland 0% 1% 3% 28% 45% 21% 3% A Poland
Hungary 0% 4% 19% 56% 17% 3% 0% Ba Hungary
Egypt 42% 55% 2% 0% 0% 0% 0% B Egypt
Ukraine 88% 12% 0% 0% 0% 0% 0% Caa Ukraine
Rating Probabilities

21
GREEK SOVEREIGN RATING

22
GREEK SOVEREIGN RATING
Source: Piraeus Bank Research, Moody’s, IMF, World Bank
The next step is to employ our estimated sovereign ratings model to compare our model’s implied ratingfor Greece against Moody’s actual rating, but also to project the evolution of Greece’s sovereign rating in2017 under three alternative scenarios:
i) A Baseline
ii) An Adverse Case
iii) A Best Case
The way we operationalise these projections is by translating our macroeconomic views regarding GDP,unemployment rate, inflation, etc. into values for the four factors (Economic, Fiscal, Institutional Strengthand Event Risk) and examine the assessed rating distribution.

23
GREECE: FACTOR EVOLUTION UNDER THE BASELINE SCENARIO
Source: Piraeus Bank Research, Moody’s, IMF, World Bank
o In our Baseline scenario the four rating factors reflect the central tendency of our macroeconomic projections.
o Specifically, we assume that the Greek government will reach an agreement on the Programme Review with the Institutions in H1 2017. As a result, the ongoing
political stability will continue and there will be no derailment of the 3rd Economic Adjustment Programme. The latter will be implemented gradually and thus
restoring the market’s confidence and boost domestic sentiment.
o The growth prospects in the base scenario underline a robust real GDP growth of circa 2.1% in the current year and a respective nominal GDP at 2.8% on an
annual basis. Inflation is expected to turn to a positive in 2017, at 0.8%, whereas the unemployment rate will continue to moderate at about 22%.
o From an Institutional and Event risk perspective, the capital controls regime introduced in mid-2015 is expected to continue being in force. We expect this will
continue in 2017, but there will be a further relaxation of the capital controls that are mainly related to payments and imports/exports activity.
0
1
2
3
4
5
6
-3.0
-2.0
-1.0
0.0
1.0
2.0
20
06
20
07
20
08
20
09
20
10
20
11
20
12
20
13
20
14
20
15
20
16
e
20
17
f
Avg. Real GDP Growth (in pp) (LHS) Vol. Real GDP Growth (in pp) (RHS)
Economic Strength
0.0
0.1
0.2
0.3
0.4
0.5
0.6
0.7
0.8
0.0
0.5
1.0
1.5
2.0
2.5
20
06
20
07
20
08
20
09
20
10
20
11
20
12
20
13
20
14
20
15
20
16
e
20
17
f
Inflation Volatility (in pp) (LHS) Government Effectiveness (RHS)
Institutional Strength
0
50
100
150
200
0.0
5.0
10.0
15.0
20.0
20
06
20
07
20
08
20
09
20
10
20
11
20
12
20
13
20
14
20
15
20
16
e
20
17
f
Gen. Government Interest Payments/ Revenue (in pp) (RHS)
Gen. Government Debt/ GDP (in pp) (LHS)
Fiscal Strength
0
50
100
150
200
-20.0
-15.0
-10.0
-5.0
0.0
5.0
20
06
20
07
20
08
20
09
20
10
20
11
20
12
20
13
20
14
20
15
20
16
e
20
17
f
(Current Account Balance+FDI)/GDP (in pp) (RHS)
Gross Loans to Deposits (in pp) (LHS)
Event Risk

o The model-implied ratings for Greece differ from
the rating agency’s actual decisions in all years we
examined. In the pre-crisis period Greece’s actual
rating was better than it deserved purely based
on macro-fundamentals. During the crisis period
the opposite holds true, with Greece being heavily
penalised, far beyond what is justified by macro
data.
o These results are consistent with a “positive”
premium in the early years (possibly due to EA
participation), which has turned massively
“negative” in the post-PSI era.
o Looking forward, the case for a rating upgrade
towards the single B rating band increases under
our baseline projections. Our 2016 and 2017
projections for the evolution of the main
economic indicators imply a rating upgrade to the
range of B3 to B1.
o Consequently, current judgment about Greece’s
rating decision might be more dependent on
qualitative factors (economic programme, MoU)
rather than on quantitative factors and economic
indicators.
24
Year Estimated Rating Probabilities Actual
C Ca Caa3-Caa1 B3-B1 Ba3-Ba1 Baa3-Baa1 A3-A1 Aa3-Aa1 Aaa
2007 - - - 5% 14% 39% 37% 3% 1% A
2009 - - - 10% 40% 43% 7% 1% - A
2012 3% - 8% 83% 5% 1% - - - C
2015 - - 5% 68% 22% 5% - - - Caa
2016f - - 4% 61% 27% 7% 1% - - Caa
2017f - - 1% 41% 40% 16% 1% - - na
0%
10%
20%
30%
40%
50%
Aaa
AaA
Baa
BaB
Caa
CaC
0%
20%
40%
60%
80%
100%
Aaa
AaA
Baa
BaB
Caa
CaC
Actual
2007 2012
0%
20%
40%
60%
80%
Aaa
AaA
Baa
BaB
Caa
CaC
2015
2017f
2016
GREECE: OUR CREDIT RATING PROJECTIONS – WE DESERVE BETTER
Source: Piraeus Bank Research, Moody’s, IMF, World Bank

25
GREECE: FACTOR EVOLUTION UNDER ALTERNATIVE SCENARIOS - ADVERSE
Source: Piraeus Bank Research, Moody’s, IMF, World Bank
o Under the adverse case scenario (RED-DOTTED LINE) we anticipate a decline in economic growth with a further deterioration in institutional strength and an
increase in the debt level followed by higher interest payments.
o Specifically, we assume that the Greek government will reach an agreement on the Programme Review with the Institutions with a delay, hence in
H2 2017. As a result, the ongoing political stability will be shaken leading to a minor chance for early elections. This will cause a further decline in
the disposable income due to the extensive fiscal measures.
o Growth prospects in the Adverse Scenario are negative with real GDP ranging between -1.0%-0.5% and nominal GDP between -1.5%-0.6% on an
annual basis. The deflationary pressures will continue, whereas the unemployment rate will increase.
o From an Institutional and Event risk perspective, the capital controls regime is assumed to remain in force throughout 2017.
Economic Strength
Event Risk
Institutional Strength
Fiscal Strength
0
1
2
3
4
5
6
-3.0
-2.0
-1.0
0.0
1.0
2.0
Avg. Real GDP Growth (in pp) (LHS) Vol. Real GDP Growth (in pp) (RHS)
0
1
1
2
2
3
0.0
0.1
0.2
0.3
0.4
0.5
0.6
0.7
0.8
Government Effectiveness (RHS) Inflation Volatility (in pp) (LHS)
0
5
10
15
20
0.0
50.0
100.0
150.0
200.0
Gen. Government Debt/ GDP (in pp) (LHS)
Gen. Government Interest Payments/ Revenue (in pp) (RHS)
-20
-15
-10
-5
0
5
0.0
50.0
100.0
150.0
200.0
Gross Loans to Deposits (in pp) (LHS)
(Current Account Balance+FDI)/GDP (in pp) (RHS)

26
GREECE: FACTOR EVOLUTION UNDER ALTERNATIVE SCENARIOS - BEST
Source: Piraeus Bank Research, Moody’s, IMF, World Bank
o Conversely, our best case scenario (GREEN-DOTTED LINE) is associated with stronger economic growth and a substantial relief in the debt level. We also allow for a
slight improvement in government effectiveness in 2017 which is relevant under the scenario of higher economic growth.
o Specifically, we assume that the Greek government will reach an agreement on the Programme Review with the Institutions with no delays in Q1 2017. As a
result, the ongoing political stability will continue and there will be no derailment of the 3rd Economic Adjustment Programme. The latter will be
implemented gradually, thus restoring market confidence and boosting domestic sentiment. The growth prospects in the Best Scenario underline a robust
real GDP growth with balanced prices and a further decline in unemployment rates.
o Moreover, Greece will be able to enter the international debt markets by end-2017 and the Greek Government bonds will participate in the QE programme.
o From an Institutional and Event risk perspective, the capital controls regime is expected to remain in force but with significant relaxation of restrictions.
o A combination of implementing a strong reform agenda and investment approach along with the implementation of the measures passed by the Greek
parliament (e.g. privatisations) are catalysts. Several infrastructure projects (e.g. construction of highways) are expected to be finished by the end of 2017.
Economic Strength
Event Risk
Institutional Strength
Fiscal Strength
0
1
2
3
4
5
6
-3.0
-2.0
-1.0
0.0
1.0
2.0
2006 2007 2008 2009 2010 2011 2012 2013 2014 2015 2016e2017f
Avg. Real GDP Growth (in pp) (LHS) Vol. Real GDP Growth (in pp) (RHS)
0
1
1
2
2
3
0.0
0.1
0.2
0.3
0.4
0.5
0.6
0.7
0.8
2006 2007 2008 2009 2010 2011 2012 2013 2014 2015 2016e2017f
Government Effectiveness (RHS) Inflation Volatility (in pp) (LHS)
0
5
10
15
20
0.0
50.0
100.0
150.0
200.0
2006 2007 2008 2009 2010 2011 2012 2013 2014 2015 2016e2017f
Gen. Government Debt/ GDP (in pp) (LHS)
Gen. Government Interest Payments/ Revenue (in pp) (RHS)
-20
-15
-10
-5
0
5
0.0
50.0
100.0
150.0
200.0
Gross Loans to Deposits (in pp) (LHS) (Current Account Balance+FDI)/GDP (in pp) (RHS)

27
Year Scenario Estimated Rating Probabilities Estimated
C Ca Caa3-Caa1 B3-B1 Ba3-Ba1
Baa3-
Baa1 A3-A1
Aa3-
Aa1 Aaa
2016 Base - - 4% 61% 27% 7% 1% - - B
Worst - - 4% 64% 25% 6% 0% - - B
Best - - 3% 54% 33% 10% 1% - - B
2017 Base - - 1% 41% 40% 16% 1% - - B
Worst - - 2% 51% 35% 11% 1% - - B
Best - - 1% 38% 42% 17% 2% - - Ba
GREECE: SCENARIO ANALYSIS
Source: Piraeus Bank Research, Moody’s, IMF, World Bank
o We evaluated the rating model’s sensitivity to
underlying factors by evaluating alternative
scenarios related to the evolution of the Greek
economy.
o Since our main conclusions depend on the
baseline scenario, we created Best and Worst
case settings by varying the anticipated
evolution of the underlying factors in the
Greek economy.
o We concluded that the implied rating band
does not change under the alternative
assumptions, with the exception of a higher
likelihood of an upgrade from the current
actual rating of Caa towards the Ba band
under the best case scenario in 2017. In
particular, under the worst case scenario the
implied probability of a B3-B1 rating remains
almost unchanged for 2016. Still, in 2017 the
probability of a B3-B1 rating increases
substantially compared to the base case
scenario.
o In contrast, under the best case scenario, the
whole ratings distribution shifts upwards. The
probability of a B3-B1 rating declines to 38%,
while the probability for a Ba3-Ba1 rating
increases to 42%.
0%
10%
20%
30%
40%
50%
60%
70%
80%
90%
100%
AaaAaABaaBaBCaaCaC
2016
Base Worst Best
0%
10%
20%
30%
40%
50%
60%
70%
80%
90%
100%
AaaAaABaaBaBCaaCaC
2017
Base Worst BestActualActual

28
APPENDIX I: METHODOLOGY

FROM DATA TO RATINGS: ORDERED CHOICE MODELS
o Rating agency decisions fit naturally with ordered choice models where an individual, i.e. the
rating agency in our case, must choose among an ordered set of discrete scores that characterise
the capacity of a country to pay off its debt obligations. By ordered set, we mean that the scores
follow a natural ordering from low ability (C) to high ability of debt repayment (Aaa). Ordered
choice models can be thought of as an indirect regression of the observed rating decisions (𝑦) to a
set of instrument variables (𝑥) that define several economic and qualitative characteristics of the
country’s debt repayment ability.
o The difference with the standard linear regression framework is that it is not possible to relate
discrete rating scores in a linear way with the continuum of values observed in 𝑥. In order to
overcome this problem we assume that the underlying process of choosing a country’s discrete
rating score is driven by a continuous preference strength random variable (𝑧) that relates
indirectly the rating decision 𝑦 with the economic characteristics of each country 𝑥. In particular
we relate the observed rating decisions 𝑦 with the unobserved preference strength 𝑧 which in turn
is related with the observed characteristics in 𝑥.
o Perhaps the notion of ordered choice models can be better understood in the context of two
country-two-rating scores example (binary choice model). For the sake of simplicity lets say that
the rating agency must choose between two scores for Greece and Italy, C and Aaa, where the first
rating indicates low ability of debt repayment and the second a high ability of debt repayment. For
each country the rating agency observes a single characteristic that indicates the country’s
GDP growth 𝑥𝐺 for Greece and 𝑥𝐼 for Italy. We further assume that the rating agency assigns an
Aaa rating to Italy and an C rating to Greece based on the GDP growth and on some other
unobserved factors that we cannot measure accurately or are not available publicly.
o Our goal is to estimate how the rating score outcome is related to the observed characteristic. For
this reason we assume that the rating agency makes decisions according to a preference index 𝑧
that is positively related to the observed characteristic (GDP growth) and the unobserved factors.
In other words we assume that as GDP growth increases, the tendency (or preference) of the
rating agency to assign an Aaa rating is greater. Additionally, preferences are also affected
(positively or negatively) by some other unknown factor 𝜀, (𝑧𝑖 = 𝛽0 + 𝛽1 ∗ 𝑥𝑖 + 𝜀𝑖).
29
Source: Piraeus Bank Research, Moody’s, IMF, World Bank
o Now assume that the values of 𝑧 can be partitioned into two areas
representing the two observed rating score choices, those that lie
above a specific threshold 𝑚0 and those that lie below. For example,
since 𝑧G < 𝑚0 then 𝑦G = C while for Italy 𝑧I > 𝑚0 so 𝑦I = Aaa.
o Up to now we managed to relate the rating decisions for the two
countries with their GDP growth indirectly through the preference
strength variable 𝑧. Since 𝑧 depends also on the unobserved term 𝜀
which is random, the next step is to make assumptions on the
distribution of this unobserved term.
Italy
0
Greece
𝑥
𝑧
𝑚0
𝑦 =
𝑦 =
𝑥𝐼
𝑥𝐺
Ordered Choice Models

FROM DATA TO RATINGS: THE MULTINOMIAL LOGIT MODEL
o The model suggested provides a crude description of the mechanism underlying an observed rating decision. The next crucial assumption is that of the
distribution of the random error component 𝜀, i.e. the country’s unobserved or unmeasured features.
o The standard assumption here is that errors are randomly drawn from some theoretical distribution allowing us to attach probabilities to each rating
decision. In other words, by specifying the error distribution in the model we transform the rating score preferences 𝑧 to a probability function of the rating
score outcome conditional on 𝑥, 𝛽0, 𝛽1 and 𝑚0. Intuitively, the conditional probability function works as the preference strength variable transformed in
such a way so that it takes values between zero and one and changes analogously with the economic characteristics of the country. That is, if 𝑥𝐺 increases,
then the probability of assigning a higher rating to Greece increases as well.
o For each choice of error distribution we should apply an appropriate transformation. Usually these transformations are non-linear function and the most
common are the probit function (for normally distributed errors) and the logit function (for errors drawn from a logistic distribution). In our study we prefer
to work with the latter S-shaped function as shown in the figure above.
o Multinomial logit or probit models are extensions of this simple binary choice example to a setting where the rating agency has to choose among more than
two rating scores. The parameters that we estimate in the multinomial logit model are the β from the linear equation as well as the 𝑛 − 1 threshold
parameters 𝑚 that correspond to the 𝑛 rating scores.
30
Logit Transformation and Error Distribution
Source: Piraeus Bank Research, Moody’s, IMF, World Bank
1
Italy
0
Greece
0
𝑥
𝑧
𝑚0
𝑦 =
𝑦 =
𝑥
𝑥𝑖
𝑦 = 𝑥

31
APPENDIX II: FACTOR-DRIVEN CREDIT RATING DECISIONS vs.
ACTUAL RATINGS

32
FACTOR-DRIVEN CREDIT RATING DECISIONS IN LINE WITH ACTUAL RATINGS IN 2015
FULL SAMPLE – 1/3
Source: Piraeus Bank Research, Moody’s, IMF, World Bank
Countries Caa B Ba Baa A Aa Aaa Actual Rating Implied Rating Confidence Countries
Australia 0% 0% 0% 1% 7% 38% 53% Aaa Australia
Austria 0% 0% 0% 6% 27% 49% 18% Aaa Austria
Belgium 0% 0% 2% 21% 45% 26% 5% Aa Belgium
Canada 0% 0% 0% 4% 21% 51% 24% Aaa Canada
Cyprus 0% 4% 18% 56% 18% 3% 0% B Cyprus
Denmark 0% 0% 0% 1% 3% 24% 72% Aaa Denmark
Estonia 0% 0% 0% 5% 24% 50% 21% A Estonia
Finland 0% 0% 0% 3% 17% 50% 29% Aaa Finland
France 0% 0% 0% 3% 15% 49% 33% Aa France
Germany 0% 0% 0% 0% 2% 13% 85% Aaa Germany
Greece 5% 68% 22% 5% 0% 0% 0% Caa Greece
Hong Kong 0% 0% 0% 0% 2% 15% 83% Aa Hong Kong
Ireland 0% 0% 1% 8% 33% 45% 13% Baa Ireland
Italy 0% 10% 33% 48% 8% 1% 0% Baa Italy
Japan 0% 0% 0% 2% 13% 47% 37% A Japan
Latvia 0% 1% 3% 28% 45% 20% 3% A Latvia
Lithuania 0% 0% 2% 23% 46% 25% 4% A Lithuania
Luxembourg 0% 0% 0% 0% 1% 9% 90% Aaa Luxembourg
Malta 0% 0% 1% 17% 44% 31% 6% A Malta
Netherlands 0% 0% 0% 1% 9% 41% 49% Aaa Netherlands
New Zealand 0% 0% 0% 1% 4% 29% 66% Aaa New Zealand
Norway 0% 0% 0% 0% 2% 13% 85% Aaa Norway
Portugal 0% 4% 18% 56% 18% 3% 0% Ba Portugal
Singapore 0% 0% 0% 0% 1% 11% 88% Aaa Singapore
Slovakia 0% 1% 4% 37% 42% 14% 2% A Slovakia
Slovenia 0% 3% 14% 56% 22% 4% 1% Baa Slovenia
Spain 0% 2% 11% 53% 27% 6% 1% Baa Spain
Sweden 0% 0% 0% 1% 4% 25% 70% Aaa Sweden
Switzerland 0% 0% 0% 0% 2% 13% 86% Aaa Switzerland
United Kingdom 0% 0% 0% 1% 6% 35% 58% Aa United Kingdom
United States of America 0% 0% 0% 0% 0% 0% 100% Aaa United States of America
Botswana 0% 2% 9% 50% 31% 7% 1% A Botswana
Chile 0% 0% 0% 6% 28% 48% 17% Aa Chile
China 0% 0% 0% 2% 10% 44% 43% Aa China
Czech Republic 0% 0% 1% 13% 40% 38% 9% A Czech Republic
Israel 0% 0% 1% 17% 43% 32% 6% A Israel
Korea 0% 0% 1% 7% 30% 47% 15% Aa Korea
Kuwait 0% 1% 7% 46% 35% 9% 1% Aa Kuwait
Macao 0% 0% 1% 10% 36% 43% 11% Aa Macao
Malaysia 0% 1% 4% 35% 43% 15% 2% A Malaysia
Mexico 0% 5% 22% 56% 15% 3% 0% A Mexico
Peru 0% 8% 29% 51% 9% 2% 0% A Peru
Poland 0% 1% 3% 28% 45% 21% 3% A Poland
Qatar 0% 0% 1% 14% 41% 36% 8% Aa Qatar
Rating Probabilities
A downward arrow (in red ) indicates that according to the model estimate the country is over-rated and should be adjusted downwards. Similarly, an upward arrow (in green ) indicates that the country is under-rated according to the model and its rating score should be adjusted upwards. The dash sign (in yellow ) indicates that the country is fairly rated. The confidence level ( ) indicates the degree of certainty in the model-implied rating scores. One blue bar in the confidence scale graph indicates less than 50% confidence, two blue bars correspond to between 50 % - 60% confidence, three bars to 60% - 70% confidence and finally four bars to more than 70% confidence.

33
Source: Piraeus Bank Research, Moody’s, IMF, World Bank
FACTOR-DRIVEN CREDIT RATING DECISIONS IN LINE WITH ACTUAL RATINGS IN 2015
FULL SAMPLE – 2/3
Countries Caa B Ba Baa A Aa Aaa Actual Rating Implied Rating Confidence Countries
Saudi Arabia 0% 0% 1% 15% 42% 35% 7% Aa Saudi Arabia
Taiwan 0% 0% 1% 8% 31% 47% 14% Aa Taiwan
United Arab Emirates 0% 0% 0% 2% 13% 48% 36% Aa United Arab Emirates
Bahamas 0% 5% 21% 56% 15% 3% 0% Baa Bahamas
Bulgaria 0% 17% 40% 37% 5% 1% 0% Baa Bulgaria
Colombia 1% 24% 43% 28% 3% 0% 0% Baa Colombia
Iceland 0% 0% 1% 8% 32% 46% 14% Baa Iceland
India 0% 13% 37% 42% 6% 1% 0% Baa India
Indonesia 0% 11% 34% 47% 7% 1% 0% Baa Indonesia
Kazakhstan 0% 8% 28% 52% 10% 2% 0% Baa Kazakhstan
Mauritius 0% 2% 10% 52% 29% 6% 1% Baa Mauritius
Namibia 0% 4% 16% 56% 20% 4% 0% Baa Namibia
Oman 0% 1% 4% 37% 42% 14% 2% A Oman
Panama 0% 19% 41% 35% 4% 1% 0% Baa Panama
Philippines 0% 9% 30% 50% 9% 1% 0% Baa Philippines
Romania 0% 8% 27% 52% 11% 2% 0% Baa Romania
South Africa 0% 6% 25% 54% 12% 2% 0% Baa South Africa
Thailand 0% 2% 8% 48% 34% 8% 1% Baa Thailand
Trinidad & Tobago 0% 15% 39% 40% 5% 1% 0% Baa Trinidad & Tobago
Turkey 0% 3% 13% 55% 24% 5% 1% Baa Turkey
Uruguay 0% 3% 13% 55% 24% 5% 1% Baa Uruguay
Azerbaijan 5% 68% 22% 5% 0% 0% 0% Baa Azerbaijan
Bahrain 0% 9% 31% 50% 9% 1% 0% Baa Bahrain
Bangladesh 1% 32% 43% 21% 2% 0% 0% Ba Bangladesh
Bolivia 2% 49% 36% 12% 1% 0% 0% Ba Bolivia
Brazil 4% 65% 24% 6% 0% 0% 0% Baa Brazil
Costa Rica 0% 17% 40% 37% 5% 1% 0% Ba Costa Rica
Cote d'Ivoire 0% 6% 24% 54% 13% 2% 0% Ba Cote d'Ivoire
Croatia 0% 12% 35% 45% 7% 1% 0% Ba Croatia
El Salvador 7% 72% 17% 4% 0% 0% 0% Ba El Salvador
Georgia 0% 12% 35% 45% 7% 1% 0% Ba Georgia
Guatemala 2% 44% 39% 14% 1% 0% 0% Ba Guatemala
Hungary 0% 4% 19% 56% 17% 3% 0% Ba Hungary
Morocco 0% 14% 37% 42% 6% 1% 0% Ba Morocco
Paraguay 2% 44% 39% 14% 1% 0% 0% Ba Paraguay
Russia 0% 4% 18% 56% 17% 3% 0% Ba Russia
Suriname 3% 56% 32% 9% 1% 0% 0% Ba Suriname
Tunisia 1% 42% 40% 15% 1% 0% 0% Ba Tunisia
Albania 1% 32% 43% 21% 2% 0% 0% B Albania
Angola 26% 69% 5% 1% 0% 0% 0% Ba Angola
Rating Probabilities
A downward arrow (in red ) indicates that according to the model estimate the country is over-rated and should be adjusted downwards. Similarly, an upward arrow (in green ) indicates that the country is under-rated according to the model and its rating score should be adjusted upwards. The dash sign (in yellow ) indicates that the country is fairly rated. The confidence level ( )indicates the degree of certainty in the model-implied rating scores. One blue bar in the confidence scale graph indicates less than 50% confidence, two blue bars correspond to between 50 % - 60% confidence, three bars to 60% - 70% confidence and finally four bars to more than 70% confidence.
34
Source: Piraeus Bank Research, Moody’s, IMF, World Bank
FACTOR-DRIVEN CREDIT RATING DECISIONS IN LINE WITH ACTUAL RATINGS IN 2015
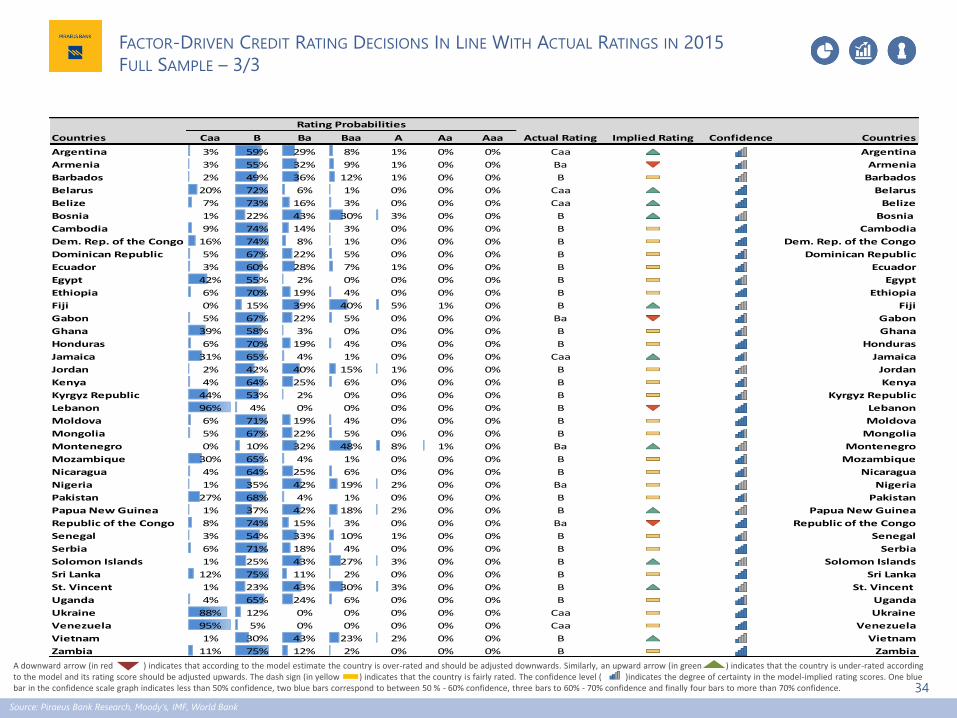
FULL SAMPLE – 3/3
Countries Caa B Ba Baa A Aa Aaa Actual Rating Implied Rating Confidence Countries
Argentina 3% 59% 29% 8% 1% 0% 0% Caa Argentina
Armenia 3% 55% 32% 9% 1% 0% 0% Ba Armenia
Barbados 2% 49% 36% 12% 1% 0% 0% B Barbados
Belarus 20% 72% 6% 1% 0% 0% 0% Caa Belarus
Belize 7% 73% 16% 3% 0% 0% 0% Caa Belize
Bosnia 1% 22% 43% 30% 3% 0% 0% B Bosnia
Cambodia 9% 74% 14% 3% 0% 0% 0% B Cambodia
Dem. Rep. of the Congo 16% 74% 8% 1% 0% 0% 0% B Dem. Rep. of the Congo
Dominican Republic 5% 67% 22% 5% 0% 0% 0% B Dominican Republic
Ecuador 3% 60% 28% 7% 1% 0% 0% B Ecuador
Egypt 42% 55% 2% 0% 0% 0% 0% B Egypt
Ethiopia 6% 70% 19% 4% 0% 0% 0% B Ethiopia
Fiji 0% 15% 39% 40% 5% 1% 0% B Fiji
Gabon 5% 67% 22% 5% 0% 0% 0% Ba Gabon
Ghana 39% 58% 3% 0% 0% 0% 0% B Ghana
Honduras 6% 70% 19% 4% 0% 0% 0% B Honduras
Jamaica 31% 65% 4% 1% 0% 0% 0% Caa Jamaica
Jordan 2% 42% 40% 15% 1% 0% 0% B Jordan
Kenya 4% 64% 25% 6% 0% 0% 0% B Kenya
Kyrgyz Republic 44% 53% 2% 0% 0% 0% 0% B Kyrgyz Republic
Lebanon 96% 4% 0% 0% 0% 0% 0% B Lebanon
Moldova 6% 71% 19% 4% 0% 0% 0% B Moldova
Mongolia 5% 67% 22% 5% 0% 0% 0% B Mongolia
Montenegro 0% 10% 32% 48% 8% 1% 0% Ba Montenegro
Mozambique 30% 65% 4% 1% 0% 0% 0% B Mozambique
Nicaragua 4% 64% 25% 6% 0% 0% 0% B Nicaragua
Nigeria 1% 35% 42% 19% 2% 0% 0% Ba Nigeria
Pakistan 27% 68% 4% 1% 0% 0% 0% B Pakistan
Papua New Guinea 1% 37% 42% 18% 2% 0% 0% B Papua New Guinea
Republic of the Congo 8% 74% 15% 3% 0% 0% 0% Ba Republic of the Congo
Senegal 3% 54% 33% 10% 1% 0% 0% B Senegal
Serbia 6% 71% 18% 4% 0% 0% 0% B Serbia
Solomon Islands 1% 25% 43% 27% 3% 0% 0% B Solomon Islands
Sri Lanka 12% 75% 11% 2% 0% 0% 0% B Sri Lanka
St. Vincent 1% 23% 43% 30% 3% 0% 0% B St. Vincent
Uganda 4% 65% 24% 6% 0% 0% 0% B Uganda
Ukraine 88% 12% 0% 0% 0% 0% 0% Caa Ukraine
Venezuela 95% 5% 0% 0% 0% 0% 0% Caa Venezuela
Vietnam 1% 30% 43% 23% 2% 0% 0% B Vietnam
Zambia 11% 75% 12% 2% 0% 0% 0% B Zambia
Rating Probabilities
A downward arrow (in red ) indicates that according to the model estimate the country is over-rated and should be adjusted downwards. Similarly, an upward arrow (in green ) indicates that the country is under-rated according to the model and its rating score should be adjusted upwards. The dash sign (in yellow ) indicates that the country is fairly rated. The confidence level ( )indicates the degree of certainty in the model-implied rating scores. One blue bar in the confidence scale graph indicates less than 50% confidence, two blue bars correspond to between 50 % - 60% confidence, three bars to 60% - 70% confidence and finally four bars to more than 70% confidence.

35
Disclaimer: This document is produced by the Economic Research & Investment Strategy Department of Piraeus Bank (hereinafter "the Bank"), which is supervised by the Bank of Greece and is
sent or provided to third parties, without any obligation of its author. This document or any part of it should not be duplicated in any way without the prior written consent of its author.
The information or opinions included in this document are addressed to existing or potential clients in a general manner, without taking into account the particular circumstances, the investment
objectives, the financial ability, the experience and/or knowledge of the potential recipients of this document and, as a result, they do not constitute or should not be considered neither as a
solicitation or offer for the conduct of transactions in financial instruments or currencies nor as a recommendation or advice for decision making in relation to those. Taking into account the
aforementioned, the recipient of the information contained in this document should proceed with his/her own research, analysis, and confirmation of the information which is included in this
document and seek for independent and professional legal, tax and investment advice, before proceeding with any investment decision making.
The information depicted in this document is relied on sources that the Bank considers to be reliable and is provided on an "as is" basis, however, the Bank cannot warrant as to their accuracy and
completeness. The opinions and estimates herein are related to the trend of the local and international financial markets at the indicated date (prices at closing time) and are subject to changes
without any prior notice. Notwithstanding the above, the Bank might include in this document investment researches, which have been conducted by third persons. In this case, the Bank does not
modify those researches, but it presents them on an "as is" basis, therefore, no responsibility is assumed in relation to the content of the aforementioned investment researches. The Bank is under
no duty to update the information contained in this document. Considering the above, the Bank, the members of its Board of Directors and the relevant persons assume no responsibility for the
information included in the present document and/or for the outcome of any investment decisions made according to such information.
Piraeus Bank Group is an organisation with a significant presence in the Greek market and an increasing one in the international markets providing a wide range of investment services. In the
context of investment services offered by the Bank and/or any other Piraeus Group companies in general, there might be cases whereby conflict of interests may arise in relation to the information
provided herein. Reference should be made to the fact that the Bank, the relevant persons and/or other Piraeus Group companies indicatively:
a. Are not subject to any prohibition in relation to trading on own account or in the course of providing portfolio management services prior to the publication of this
document or the acquisition of any shares prior to any public offering or the acquisition of any other securities.
b. May offer upon remuneration investment banking services to issuers for whom this document may contain information.
c. May participate to the issuers' share capital or acquire other securities issued by the aforementioned issuers or attract other financial interests from them.
d. Might provide market making or underwriting services to issuers that might be mentioned in this document.
e. Might have published papers the content of which is different or incompatible to the information presented herein.
The Bank as well as the other Piraeus Group's companies have enacted, implement and maintain an effective policy, which prevents circumstances that may give rise to conflicts of interests and
the dissemination of any information among the departments ("chinese walls") and they also constantly comply with the provisions and regulations relevant to inside information and market
abuse. Also, the Bank confirms that it doesn't have any kind of interest or conflict of interest with a) any other legal entity or person that could have participated in the preparation of the present
document and b) with any other legal entity or person that couldn't have participated in the preparation of the present document, but had access to it before its publication.
It is duly stated that: the investments described in the present document include investment risks, among which the risk of losing the entire capital invested. In particular, it is stated that;
a. The figures presented herein refer to the past and that the past performance is not a reliable indicator of future performance.
b. In case the figures refer to simulated past performance, that past performance is not a reliable indicator of future performance.
c. The return on investments might be positively or negatively affected as a result of currency fluctuations, in case the figures are denominated in a foreign currency (other than
Euro).
d. Any forecasts in relation to future performance, may not be a reliable indicator of future performance.
e. The tax treatment of the information as well as transactions pertained in this document, depends on each investor's individual circumstances and may be subject to change in
the future. As a result, the recipient should seek for independent advice in relation to the applicable tax legislation.
The distribution of the present document outside Greece and/or to persons governed by foreign law may be subject to restrictions or prohibitions according to the applicable legislation.
Therefore, the recipient of the present should seek for independent advice in relation to the applicable legislation, in order to look into such restrictions and/or prohibitions.