Sustainable Biofuels in Minnesota: Opportunities of Small-Scale On-Farm Biofuel Production
annual report
Southwestern MinnesotaFarm Management Association
COOPERATING AGENCIES:
University of Minnesota, Institute of AgricultureCounty Extension Services of the 16 Southwestern CountiesSouthwestern Minnesota Farm Management Association
Economic Report ER85-2Department of Agricultural and Applied EconomicsInstitute of AgricultureSt. Paul, Minnesota 55108May, 1985
MA AA
Contents of this report become public property upon
publication. The written material may be reprinted if
no endorsement of a commercial product is stated or
implied. Please use the following credit line: "1984
Annual Report of the Southwestern Minnesota Farm
Business Management Association, Economic Report ER85-2
Department of Agricultural and Applied Economics,
University of Minnesota."
The University of Minnesota, including the Agricultural Extension Service, Is committed to the policy that all persons shall have equal access to itsprograms, facilities, end employment without regard to race, religion, color, sex, national origin, handicap, age or veteran status.
1
1984 ANNUAL REPORT OF THE SOUTHWESTERN MINNESOTAFARM MANAGEMENT ASSOCIATION
byDelane E. Welsch, Brian Keefe, Erlin J. Weness, Perry A. Fales, & Dary E. Talley*
INTRODUCTION
The Department of Agricultural and Applied Economics and the AgriculturalExtension Service of the University of Minnesota, and the Agricultural ExtensionAgents of several southwestern Minnesota counties are cooperating with the South-western Minnesota Farm Management Association in maintaining a farm managementservice. The Association was organized in the fall of 1939 by farmers in that partof the state for the purpose of studying the farm business through farm records.Each farmer pays an annual fee which covers a large part of the cost, with thebalance defrayed by the Agricultural Extension and research programs of the Univer-sity of Minnesota. The analysis of the records and the preparation of the reportare handled jointly by the Department of Agricultural and Applied Economics, underthe direction of Delane Welsch and Brian Keefe, and by the fieldmen, Erlin Weness,Perry Fales and Dary Talley. Dennis Seefeldt was the District Program Leader inAgriculture with the Agricultural Extension Service in 1984 working with thecounties which are served by the Association. The analysis of each individualfarm was performed by the fieldmen during the closeout procedure using IBM-PC micro-computers and FINANX, Release 1.1 software. The input data were sent to theDepartment where the individual analyses were loaded onto the IBM 4341 mainframe.The data base manager, NOMAD, was used to compute the tables for this report.Brian Keefe was responsible for creating all programs for uploading data and com-puting the tables in this report.
Of the 215 farms in the Southwestern Association, 190 farms submitted recordsat the time of this report. The data for 168 farms are shown in the tables onsucceeding pages. The rest were omitted from the information in the tables becausethe records were not sufficiently complete for a full analysis. No claim is madeas to whether the farmers who belong to the Association are or are not representa-tive of southwestern Minnesota. However, this report should be of value to farmersand others interested in agriculture in that it illustrates how farm records maybe used as a basis for making an analysis of a farm business. It also shows typicalenterprise costs and returns for 1984 and the variation in enterprise earnings aswell as in total farm earnings.
The content of this report is somewhat different from those prior to 1983.While the roots of the analysis lie in the work of the Department of Agriculturaland Applied Economics and its predecessor units over the past 70 years, the moredetailed analysis found in this report was developed by the Extension Farm Manage-ment faculty of the Department. Special acknowledgement is due to Ken Thomas forthe conceptual development of the analysis, Dick Hawkins for the testing andextension of the analysis to diverse groups throughout the state and region, andto Dale Nordquist and Bob Craven for adapting the analysis to microcomputers andfor substantial further conceptual and programming development of the core analysis,FINANX, during 1983 and 1984. Their work has been especially noteworthy andcrucial to generating the data for the report.
*Welsch is Professor of Farm Management; Keefe is Research Assistant; Weness, Falesand Talley are jointly Area Farm Management Extension Agents and Fieldmen for theAssociation. The authors wish to thank the following people for their contributionsto this report: Janet Froslan, Alan Langseth, Paul Mattison, Gene Metz, Carol Theis,Glenda Mellema and Gary Hippe for their assistance in Account Book closing and coding;Ron and Terri Schultz for special computer programming; Lai Chun Kan and Rann Loppnowfor computer programming and use of the data base in compiling this report; VernonEidman, Kenneth Thomas and Burt Sundquist for review; and Carol Hansen for secretarialand clerical work throughout the project and especially for putting this report together.
2
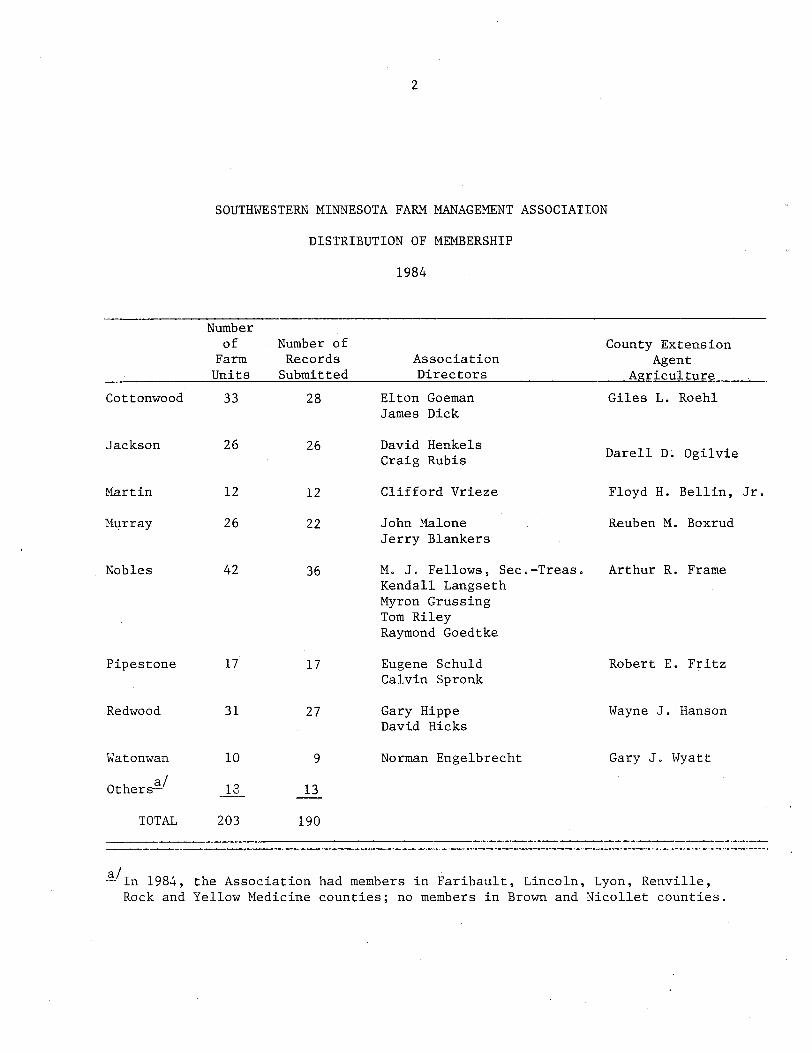
SOUTHWESTERN MINNESOTA FARM MANAGEMENT ASSOCIATION
DISTRIBUTION OF MEMBERSHIP
1984
Numberof Number of County Extension
Farm Records Association AgentUnits Submitted Directors Agriculture
Cottonwood 33 28 Elton Goeman Giles L. RoehlJames Dick
Jackson 26 26 David Henkels . OgiCraig Rubis Darell D. OgilvieCraig Rubis
Martin 12 12 Clifford Vrieze Floyd H. Bellin, Jr.
Murray 26 22 John Malone Reuben M. BoxrudJerry Blankers
Nobles 42 36 M. J. Fellows, Sec.-Treas. Arthur R. FrameKendall LangsethMyron GrussingTom RileyRaymond Goedtke
Pipestone 17 17 Eugene Schuld Robert E. FritzCalvin Spronk
Redwood 31 27 Gary Hippe Wayne J. HansonDavid Hicks
Watonwan 10 9 Norman Engelbrecht Gary J. Wyatt
a/Others- 13 13
TOTAL 203 190
a/In 1984,Rock and
the Association had members in Faribault, Lincoln, Lyon, Renville,Yellow Medicine counties; no members in Brown and Nicollet counties.
3
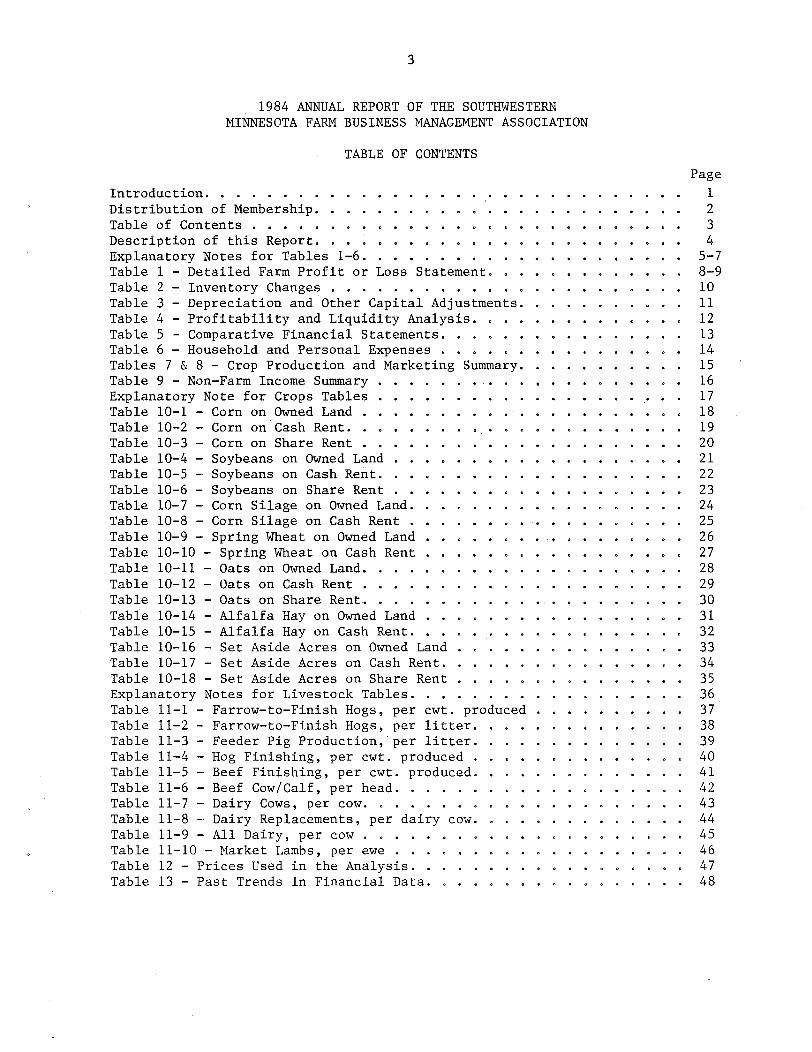
1984 ANNUAL REPORT OF THE SOUTHWESTERNMINNESOTA FARM BUSINESS MANAGEMENT ASSOCIATION
TABLE OF CONTENTS
Page
Introduction. .. ... ... ....... o ............. 1Distribution of Membership. ...... ....... . . ........ 2Table of Contents ..... ..... ........ ........ 3
Description of this Report. ............... ...... . 4Explanatory Notes for Tables 1-6 ...... ..... . . .... . . 5-7Table 1 - Detailed Farm Profit or Loss Statement ........... 8-9
Table 2 - Inventory Changes ..................... . 10Table 3 - Depreciation and Other Capital Adjustments. ......... 11Table 4 - Profitability and Liquidity Analysis. .... ... . 12Table 5 - Comparative Financial Statements. . .... ......... 13Table 6 - Household and Personal Expenses ............... 14Tables 7 & 8 - Crop Production and Marketing Summary. ...... . 15Table 9 - Non-Farm Income Summary ..... ..... ..... .. 16Explanatory Note for Crops Tables ................. . 17Table 10-1 - Corn on Owned Land .... ......... .. ...... 18
Table 10-2 - Corn on Cash Rent. . .. ............... . . 19Table 10-3 - Corn on Share Rent .................. .. 20Table 10-4 - Soybeans on Owned Land ... . . .. 21Table 10-5 - Soybeans on Cash Rent. . ........... . . . . 22Table 10-6 - Soybeans on Share Rent .................. 23Table 10-7 - Corn Silage on Owned Land. ........... .... .. 24Table 10-8 - Corn Silage on Cash Rent ............ ..... . 25Table 10-9 - Spring Wheat on Owned Land ......... ..... . . . 26Table 10-10 - Spring Wheat on Cash Rent .... ....... ..... . 27Table 10-11 - Oats on Owned Land ................... . 28Table 10-12 - Oats on Cash Rent ................... . 29Table 10-13 - Oats on Share Rent .... ... . . . . . . . . 30Table 10-14 - Alfalfa Hay on Owned Land .. ............ . 31Table 10-15 - Alfalfa Hay on Cash Rent. ............... . 32Table 10-16 - Set Aside Acres on Owned Land .............. 33Table 10-17 - Set Aside Acres on Cash Rent. ............... 34Table 10-18 - Set Aside Acres on Share Rent ... ............ 35Explanatory Notes for Livestock Tables. ................. 36Table 11-1 - Farrow-to-Finish Hogs, per cwt. produced .......... 37Table 11-2 - Farrow-to-Finish Hogs, per litter. ............ 38Table 11-3 - Feeder Pig Production, per litter. ......... .... 39Table 11-4 - Hog Finishing, per cwt. produced .............. 40Table 11-5 - Beef Finishing, per cwt. produced. ............. 41Table 11-6 - Beef Cow/Calf, per head. .. ............ .... 42Table 11-7 - Dairy Cows, per cow. ............... . .. . . 43Table 11-8 - Dairy Replacements, per dairy cow. ........... .. 44Table 11-9 - All Dairy, per cow ................... .. 45Table 11-10 - Market Lambs, per ewe . .. ........... . 46Table 12 - Prices Used in the Analysis. . ... . . . ...... .. . . 47Table 13 - Past Trends in Financial Data. ... ... o .. . .. . . 48
4
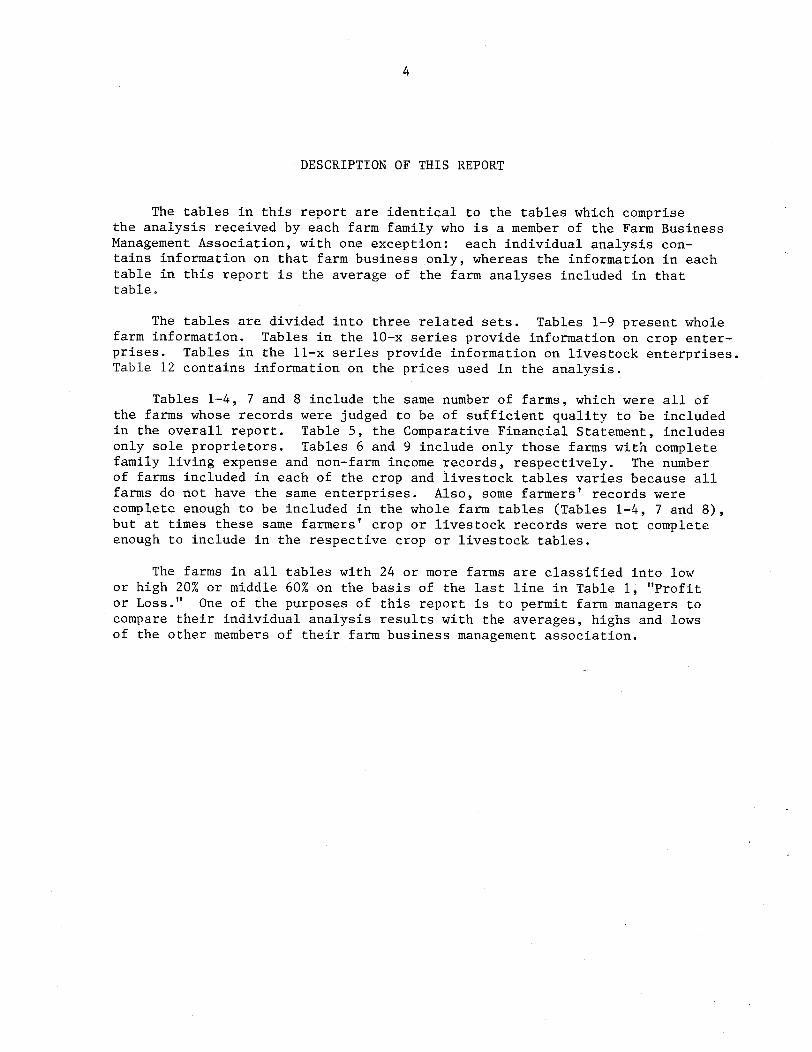
DESCRIPTION OF THIS REPORT
The tables in this report are identical to the tables which comprisethe analysis received by each farm family who is a member of the Farm BusinessManagement Association, with one exception: each individual analysis con-tains information on that farm business only, whereas the information in eachtable in this report is the average of the farm analyses included in thattable.
The tables are divided into three related sets. Tables 1-9 present wholefarm information. Tables in the 10-x series provide information on crop enter-prises. Tables in the 11-x series provide information on livestock enterprises.Table 12 contains information on the prices used in the analysis.
Tables 1-4, 7 and 8 include the same number of farms, which were all ofthe farms whose records were judged to be of sufficient quality to be includedin the overall report. Table 5, the Comparative Financial Statement, includesonly sole proprietors. Tables 6 and 9 include only those farms with completefamily living expense and non-farm income records, respectively. The numberof farms included in each of the crop and livestock tables varies because allfarms do not have the same enterprises. Also, some farmers' records werecomplete enough to be included in the whole farm tables (Tables 1-4, 7 and 8),but at times these same farmers' crop or livestock records were not completeenough to include in the respective crop or livestock tables.
The farms in all tables with 24 or more farms are classified into lowor high 20% or middle 60% on the basis of the last line in Table 1, "Profitor Loss." One of the purposes of this report is to permit farm managers tocompare their individual analysis results with the averages, highs and lowsof the other members of their farm business management association.
5
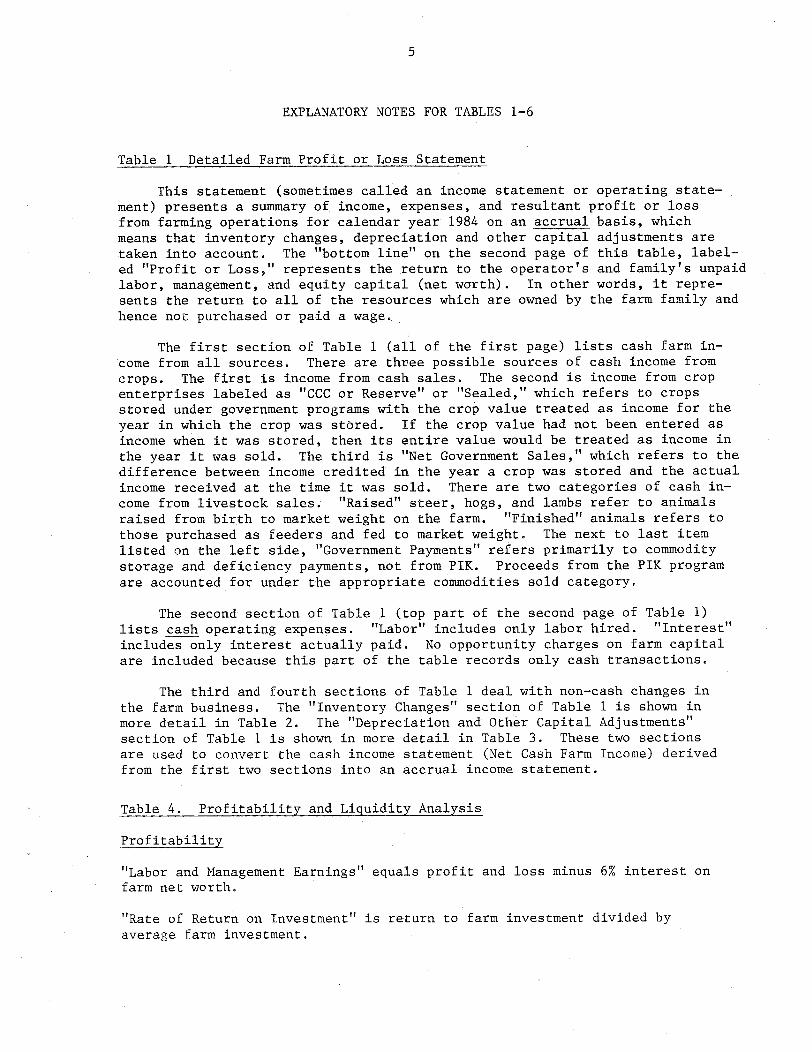
EXPLANATORY NOTES FOR TABLES 1-6
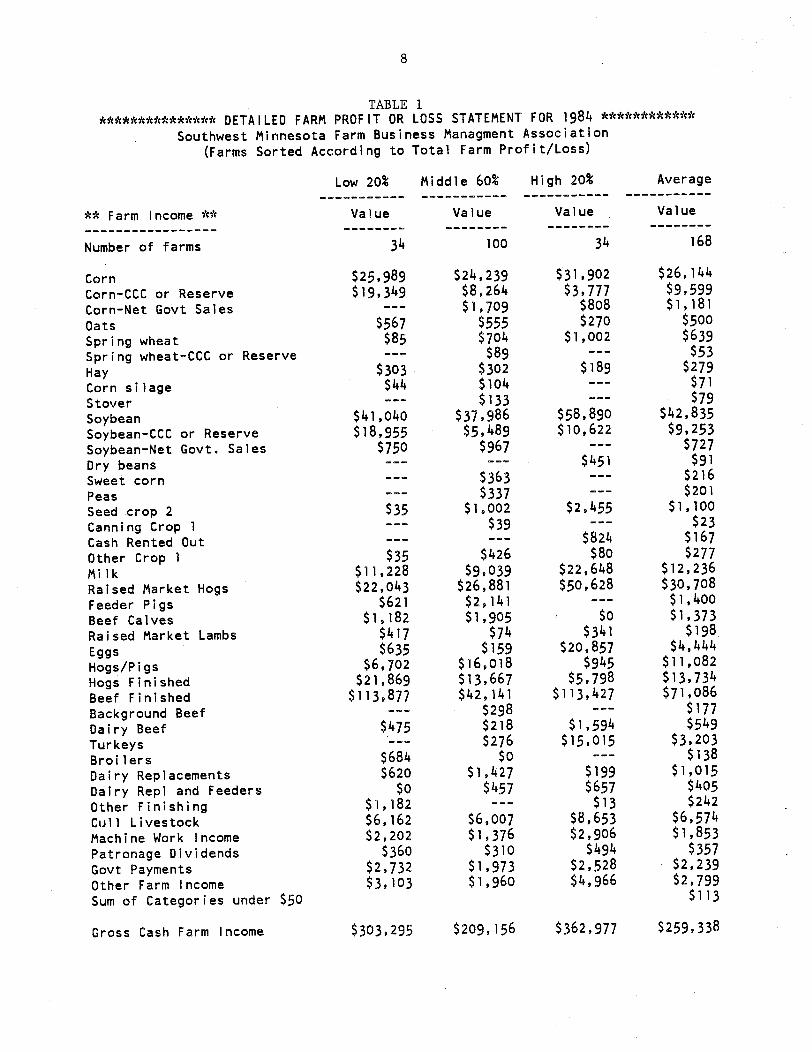
Table 1 Detailed Farm Profit or Loss Statement
This statement (sometimes called an income statement or operating state-ment) presents a summary of income, expenses, and resultant profit or lossfrom farming operations for calendar year 1984 on an accrual basis, whichmeans that inventory changes, depreciation and other capital adjustments aretaken into account. The "bottom line" on the second page of this table, label-ed "Profit or Loss," represents the return to the operator's and family's unpaidlabor, management, and equity capital (net worth). In other words, it repre-sents the return to all of the resources which are owned by the farm family andhence not purchased or paid a wage.
The first section of Table 1 (all of the first page) lists cash farm in-come from all sources. There are three possible sources of cash income fromcrops. The first is income from cash sales. The second is income from cropenterprises labeled as "CCC or Reserve" or "Sealed," which refers to cropsstored under government programs with the crop value treated as income for theyear in which the crop was stored. If the crop value had not been entered asincome when it was stored, then its entire value would be treated as income inthe year it was sold. The third is "Net Government Sales," which refers to thedifference between income credited in the year a crop was stored and the actualincome received at the time it was sold. There are two categories of cash in-come from livestock sales. "Raised" steer, hogs, and lambs refer to animalsraised from birth to market weight on the farm. "Finished" animals refers tothose purchased as feeders and fed to market weight. The next to last itemlisted on the left side, "Government Payments" refers primarily to commoditystorage and deficiency payments, not from PIK. Proceeds from the PIK programare accounted for under the appropriate commodities sold category.
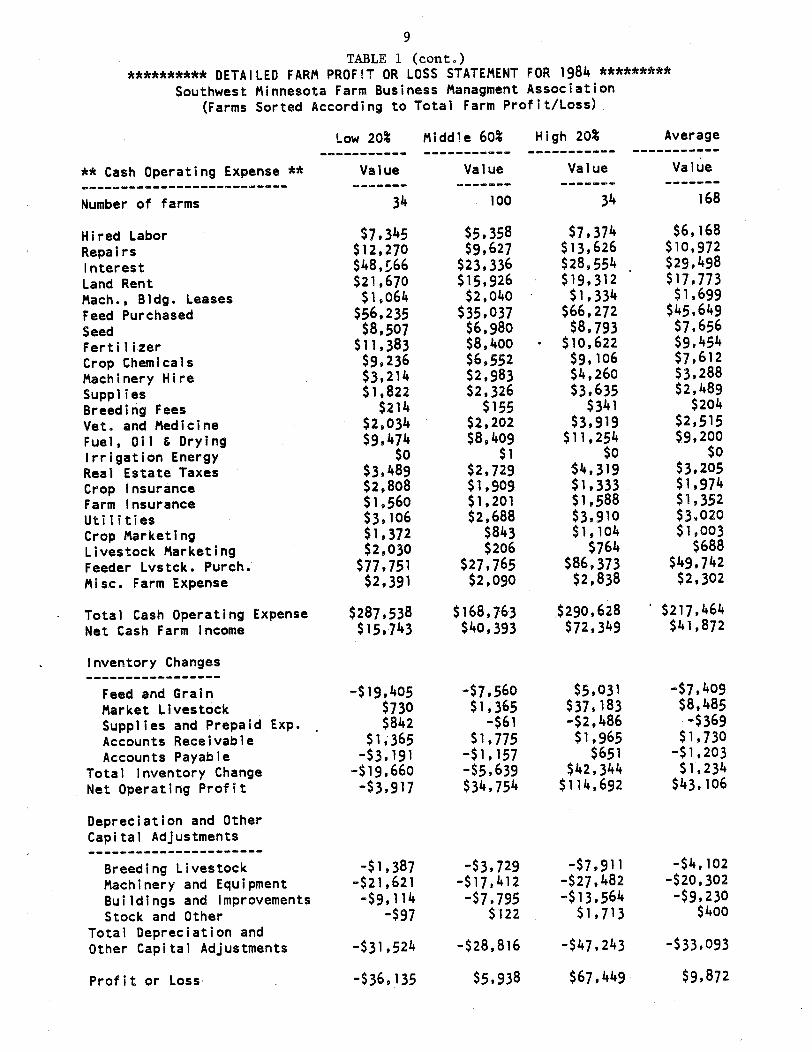
The second section of Table 1 (top part of the second page of Table 1)lists cash operating expenses. "Labor" includes only labor hired. "Interest"includes only interest actually paid. No opportunity charges on farm capitalare included because this part of the table records only cash transactions.
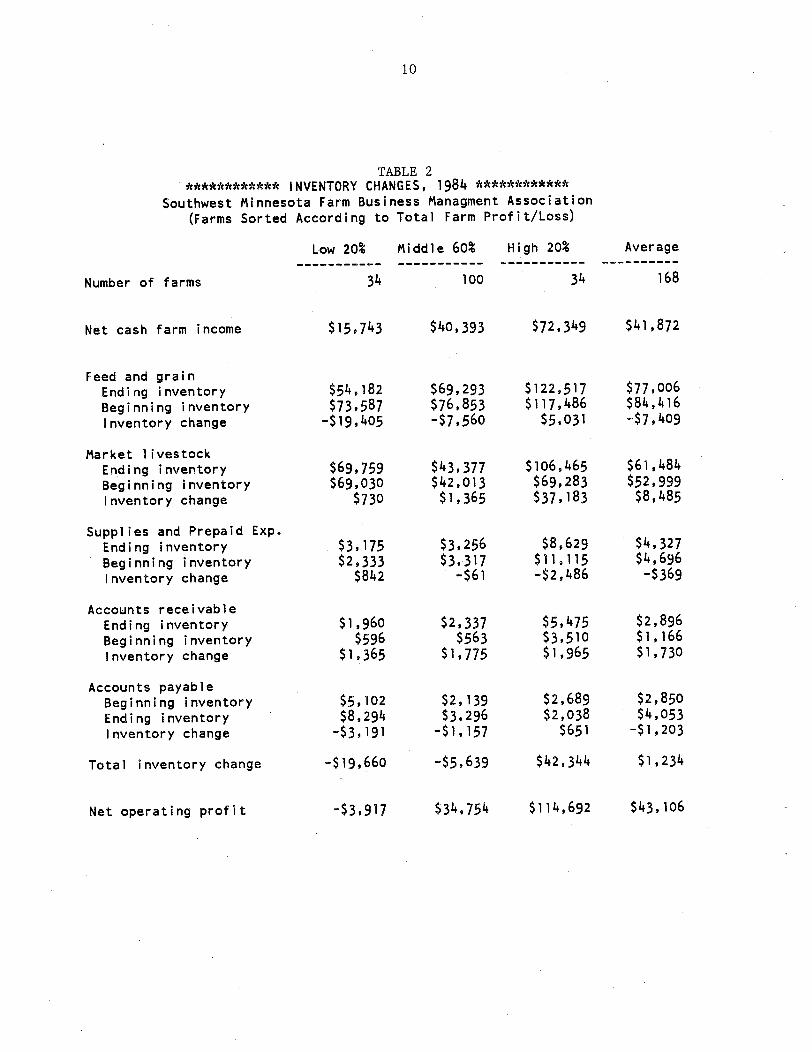
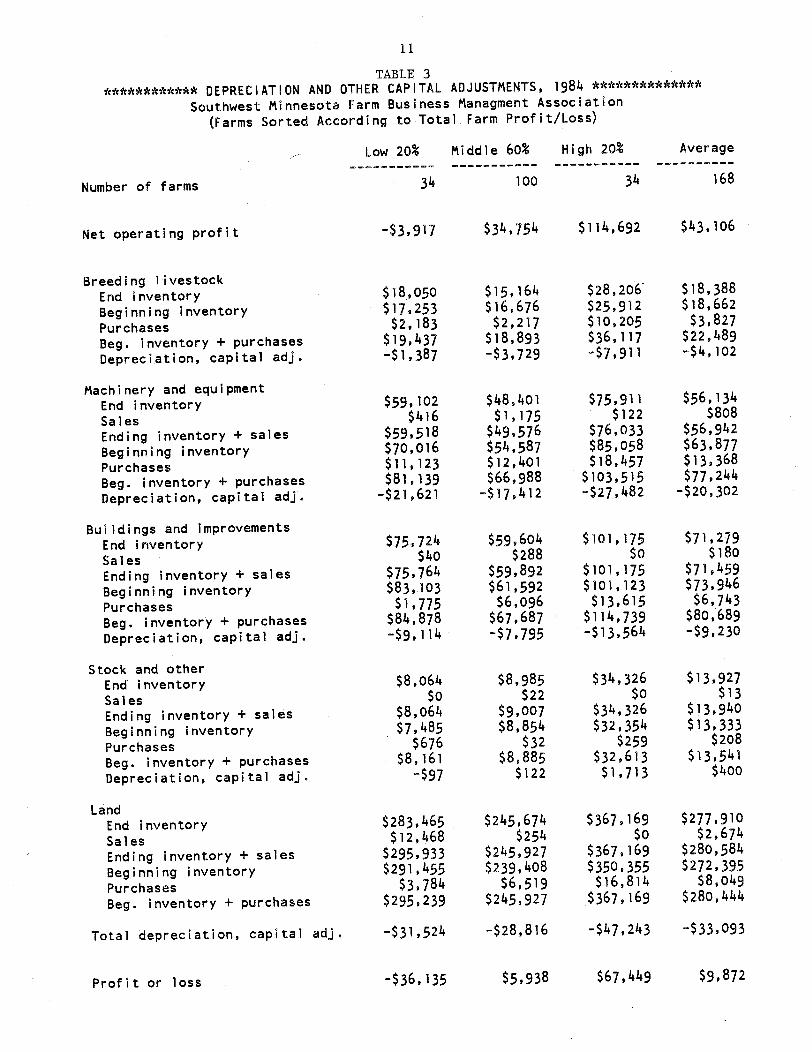
The third and fourth sections of Table 1 deal with non-cash changes inthe farm business. The "Inventory Changes" section of Table 1 is shown inmore detail in Table 2. The "Depreciation and Other Capital Adjustments"section of Table 1 is shown in more detail in Table 3. These two sectionsare used to convert the cash income statement (Net Cash Farm Income) derivedfrom the first two sections into an accrual income statement.
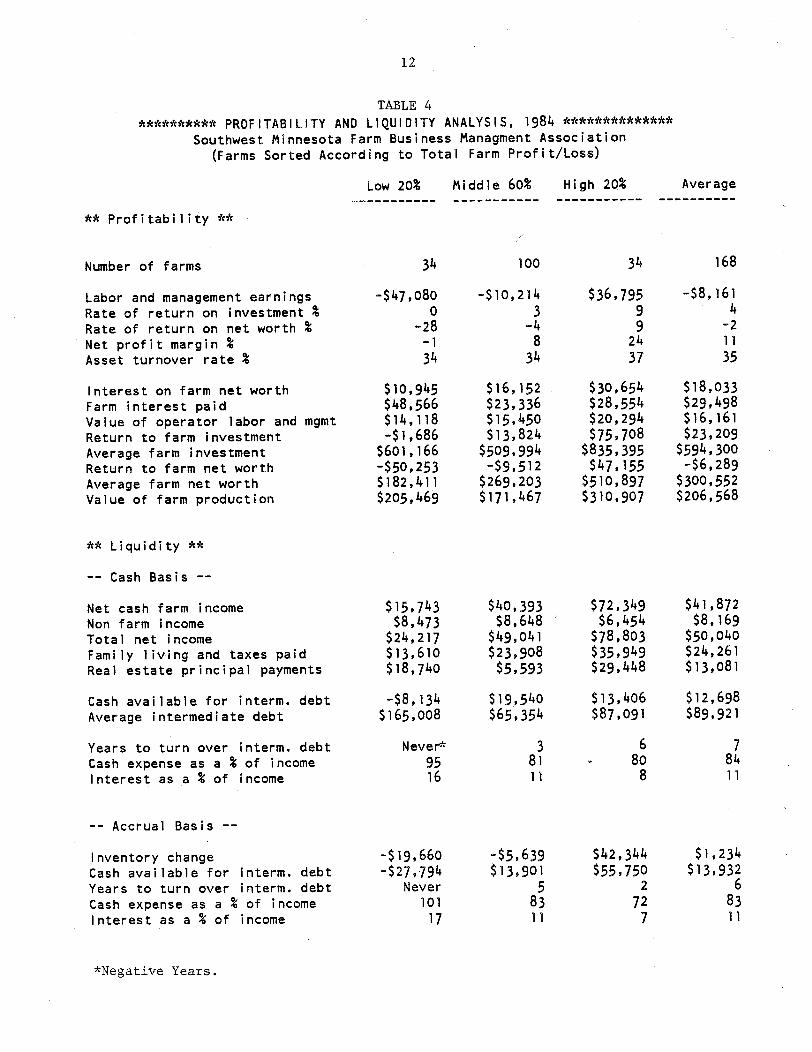
Table 4. Profitability and Liquidity Analysis
Profitability
"Labor and Management Earnings" equals profit and loss minus 6% interest onfarm net worth.
"Rate of Return on Investment" is return to farm investment divided byaverage farm investment.
6
"Rate of Return on Net Worth" is the residual return to farm net worth dividedby average farm net worth.
"Net Profit Margin" is the residual return to farm investment divided by valueof farm production.
"Asset Turnover Rate" is the value of farm production divided by averagefarm investment.
"Interest on Farm Net Worth" is the average farm net worth multiplied bya six percent opportunity cost charge.
"Farm Interest Paid" is interest actually paid.
"Value of Operator's Labor and Management" was evaluated using the suggestedvalues listed at the end of this report.
"Return to Farm Investment" is calculated by adding farm interest paid toprofit or loss and then subtracting the value of operator's labor andmanagement.
"Average Farm Investment" is the average of beginning and ending total farmassets.
"Return to Farm Net Worth" is calculated by subtracting the value of operator'slabor and management from profit or loss.
"Average Farm Net Worth" is the average of beginning and ending farm networth.
"Value of Farm Production" is gross farm income minus feeder livestock purchased,plus/minus inventory increases/decreases in crops, market livestock and breedinglivestock.
Liquidity: Cash Basis
"Cash Available for Intermediate Debt" is total net income minus family livingand taxes paid and real estate principal payment.
"Average Intermediate Debt" is the average of beginning and ending intermediatefarm liabilities.
"Years to Turn Over Intermediate Debt" is average intermediate debt dividedby cash available for intermediate debt. If either the cash based or theaccrual based "cash available for intermediate debt" is a negative number, then"years to turn over intermediate debt" cannot be calculated, and is so indicatedby an asterisk. (Debt repayment is not possible because of negative cash flow.)
"Cash Expense as a % of Income" is total cash operating expense divided bygross cash farm income.
"Interest as a % of Income" is interest paid divided by gross cash farm income.
7
Liquidity: Accrual Basis
"Cash Available for Intermediate Debt" on the accrual basis is calculatedby adding or subtracting inventory change to or from the "cash availablefor intermediate debt" item in the "Cash Basis" section of the table.
"Cash Expense as a % of Income" is total cash operating expense divided bythe sum of gross cash farm income and inventory change.
"Interest as a % of Income" is interest paid divided by the sum of grossfarm cash income and inventory change.
Table 5. Comparative Financial Statement
Current assets are valued at market price at the time of the inventory(January 1, 1984 and December 31, 1984, for the beginning and endinginventories, respectively). Intermediate and long-term assets that aredepreciable are valued at cost remaining (amount remaining to be deprec-iated, plus salvage value). Raised breeding livestock is valued atconservative market replacement costs. Land is valued at conservativemarket price (by county average) for the Southwest Association (seeTable 12).
"Current plus intermediate" roughly corresponds to "non-real estate" and"long term" roughly corresponds to "real estate" in reference to assetsand liabilities, for the use of those readers who prefer to examinesolvency in that way.
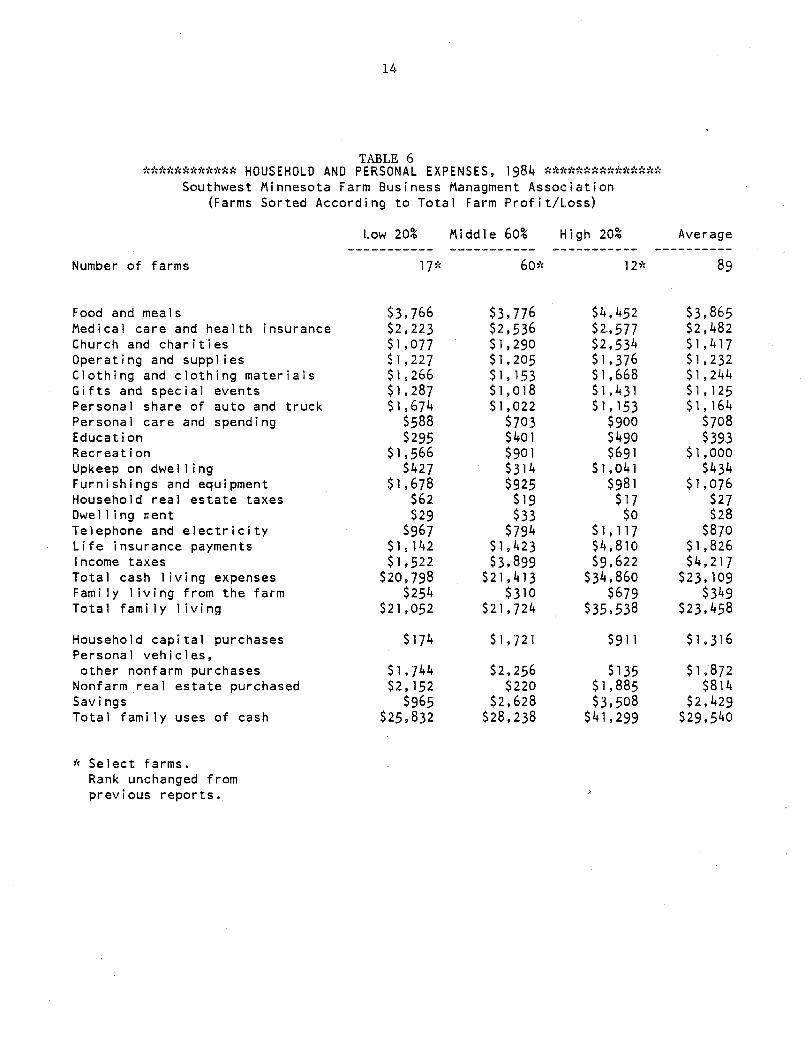
Table 6. Household and Personal Expense
The individual items in this table are mostly self explanatory. The "savings"item may be influenced by a small number of farms which had substantialsavings (ranging from slightly to substantially larger than their profit fromfarming--Table 1) which came from large inheritances which were subsequentlyinvested.
8
TABLE 1*************** DETAILED FARM PROFIT OR LOSS STATEMENT FOR 1984 ************
Southwest Minnesota Farm Business Managment Association(Farms Sorted According to Total Farm Profit/Loss)
** Farm Income **
Number of farms
Low 20%
Value
34
Middle 60%
Value
100
High 20%
Value
34
CornCorn-CCC or ReserveCorn-Net Govt SalesOatsSpring wheatSpring wheat-CCC or ReserveHayCorn silageStoverSoybeanSoybean-CCC or ReserveSoybean-Net Govt. SalesDry beansSweet cornPeasSeed crop 2Canning Crop 1Cash Rented OutOther Crop 1MilkRaised Market HogsFeeder PigsBeef CalvesRaised Market LambsEggsHogs/PigsHogs FinishedBeef FinishedBackground BeefDairy BeefTurkeysBroilersDairy ReplacementsDairy Repl and FeedersOther FinishingCull LivestockMachine Work IncomePatronage DividendsGovt PaymentsOther Farm IncomeSum of Categories under $50
Gross Cash Farm Income
Average
Value
168
$25,989$19,349
$567$85
$303$44
$41,040$18,955
$750
$35
$35$11,228$22,043
$621$1,182
$417$635
$6,702$21,869
$113,877
$475
$684$620$0
$1,182$6,162$2,202
$360$2,732$3,103
$24,239$8,264$19709
$555$704$89
$302$104$133
$37,986$5,489
$967
$363$337
$1,002$39
$426$99039
$26,881$2,141$1,905
$74$159
$16,018$13,667$42,141
$298$218$276
$0$1,427
$457
$6,007$1,376
$310$1,973$1,960
$31,902$3,777
$808$270
$1,002
$189
$58,890$10,622
$451
$2,455
$824$80
$22,648$50,628
$0$341
$20,857$945
$5,798$113,427
$1,594$15,015
$199$657$13
$8,653$2,906
$494$2,528$4,966
$26,144$9,599$1,181
$500$639$53
$279$71$79
$42,835$9,253
$727$91$216$201
$1,100$23
$167$277
$12,236$30,708$1,400$1,373
$198.$4,444
$11,082$13,734$71,o86
$177$549
$3,203$138
$1,015$405$242
$6,574$1,853
$357$2,239$2,799
$113
$362t977 $2599338$3039295 $2099156
9
TABLE 1 (cont.)********** DETAILED FARM PROFIT OR LOSS STATEMENT FOR 1984 *********
Southwest Minnesota Farm Business Managment Association(Farms Sorted According to Total Farm Profit/Loss)
Low 20% Middle 60% High 20% Average
** Cash Operating Expense ** Value Value Value Value
Number of farms 34 100 34 168
Hired Labor $7,345 $5,358 $7,374 $6,168Repairs $12,270 $9,627 $13,626 $10,972
Interest $48,566 $23,336 $28,554 $29,498
Land Rent $21,670 $15,926 $19,312 $17,773
Mach., Bldg. Leases $1,064 $2,040 $1,334 $1,699
Feed Purchased $56,235 $35,037 $66,272 $45,649
Seed $8,507 $6,980 $8,793 $7,656
Fertilizer $11,383 $8,400 $10,622 $9,454
Crop Chemicals $9,236 $6,552 $9,106 $7,612
Machinery Hire $3,214 $2,983 $4,260 $3,288
Supplies $1,822 $2,326 $3,635 $2,489
Breeding Fees $214 $155 $341 $204
Vet. and Medicine $2,034 $2,202 $3,919 $2,515Fuel, Oil & Drying $9,474 $8,409 $11,254 $9,200
Irrigation Energy $0 $1 $0 $0
Real Estate Taxes $3,489 $2,729 $4,319 $3,205
Crop Insurance $2,808 $1,909 $1,333 $1,974
Farm Insurance $1,560 $1,201 $1,588 $1,352
Utilities $3,106 $2,688 $3,910 $3,020
Crop Marketing $1,372 $843 $1,104 $1,003
Livestock Marketing $2,030 $206 $764 $688
Feeder Lvstck. Purch. $77,751 $27,765 $86,373 $49,742
Misc. Farm Expense $2,391 $2,090 $2,838 $2,302
Total Cash Operating Expense $287,538 $168,763 $290,628 $217,464
Net Cash Farm Income $15,743 $40,393 $72,349 $41,872
Inventory Changes
Feed and Grain -$19,405 -$7,560 $5,031 -$7,4o9
Market Livestock $730 $1,365 $37,183 $8,485
Supplies and Prepaid Exp. $842 -$61 -$2,486 -$369
Accounts Receivable $1,365 $1,775 $1,965 $1,730
Accounts Payable -$3,191 -$1,157 $651 -$1,203
Total Inventory Change -$19,660 -$5,639 $42,344 $1,234
Net Operating Profit -$3,917 $34,754 $114,692 $43,106
Depreciation and OtherCapital Adjustments
Breeding Livestock -$1,387 -$3,729 -$7,911 -$4,102Machinery and Equipment -$21,621 -$17,412 -$27,482 -$20,302
Buildings and Improvements -$9,114 -$7,795 -$13,564 -$9,230
Stock and Other -$97 $122 $1,713 $400
Total Depreciation andOther Capital Adjustments -$31,524 -$28,816 -$47,243 -$33,093
-$36,135 $5,938 $67.449 $9,872Profit or Loss-
10
TABLE 2************ INVENTORY CHANGES, 1984 ************
Southwest Minnesota Farm Business Managment Association(Farms Sorted According to Total Farm Profit/Loss)
Low 20% Middle 60% High 20% Average
Number of farms 34 100 34 168
Net cash farm income $15,743 $40,393 $72,349 $41,872
Feed and grainEnding inventory $54,182 $69,293 $122,517 $77,006
Beginning inventory $73,587 $76,853 $117,486 $84,416
Inventory change -$19,405 -$7,560 $5,031 -$7,409
Market livestockEnding inventory $69,759 $43,377 $106,465 $61,484
Beginning inventory $69,030 $42,013 $69,283 $52,999
Inventory change $730 $1,365 $37,183 $8,485
Supplies and Prepaid Exp.Ending inventory $3,175 $3,256 $8,629 $4,327
Beginning inventory $2,333 $3,317 $119115 $4,696
Inventory change $842 -$61 -$2,486 -$369
Accounts receivableEnding inventory $1,960 $2,337 $5,475 $2,896
Beginning inventory $596 $563 $3,510 $1,166
Inventory change $1,365 $1,775 $1,965 $19730
Accounts payableBeginning inventory $5,102 $2,139 $2,689 $2,850
Ending inventory $8,294 $3,296 $2,038 $4,053
Inventory change -$3,191 -$1,157 $651 -$1,203
Total inventory change -$19,660 -$5,639 $42,344 $1,234
-$3,917 $34,754 $114,692 $43,106Net operating profit
11
TABLE 3************ DEPRECIATION AND OTHER CAPITAL ADJUSTMENTS, 1984 **************
Southwest Minnesota Farm Business Managment Association(Farms Sorted According to Total Farm Profit/Loss)
Low 20%
34Number of farms
Middle 60%
100
High 20%
34
Net operating profit
Breeding livestockEnd inventoryBeginning inventoryPurchasesBeg. inventory + purchasesDepreciation, capital adj.
Machinery and equipmentEnd inventorySalesEnding inventory + salesBeginning inventoryPurchasesBeg. inventory + purchasesDepreciation, capital adj.
Buildings and improvementsEnd inventorySalesEnding inventory + salesBeginning inventoryPurchasesBeg. inventory + purchasesDepreciation, capital adj.
Stock and otherEnd inventorySalesEnding inventory + salesBeginning inventoryPurchasesBeg. inventory + purchasesDepreciation, capital adj.
LandEnd inventorySalesEnding inventory + salesBeginning inventoryPurchasesBeg. inventory + purchases
Total depreciation, capital adj. -$31,524 -$28,816 -$47,243 -$33,093
$67,449 $9,872-$36,135 $5,938
Average
168
-$3,917
$18,050$17,253$2,183$19,437-$1,387
$59,102$416
$59,518$70,016$11,123$81,139
-$21,621
$75,724$40
$75,764$83,103$1,775
$84,878-$9,114
$8,064$0
$8,064$7,485
$676$8,161
-$97
$283,465$12,468
$295,933$291,455
$3,784$2959239
$34,754
$15,164$16,676$2,217
$18,893-$3,729
$48,401$1,175
$499576$54,587$12,401$66,988
-$17,412
$59,604$288
$59,892$61,592$6,096
$67,687-$7,795
$8,985$22
$9,007$8,854
$32$8,885
$122
$245,674$254
$245,927$239,408
$6,519$245,927
$114,692
$28,206'$25,912$10,205$36,117-$7,911
$75,911$122
$76,033$85,058$18,457
$103,515-$27,482
$101,175$0
$101,175$101,123
$13,615$114,739-$13,564
$34,326$0
$34,326$32,354
$259$32,613
$ 1713
$3679169$0
$367,169$350,355$16,814
$367,169
$43,106
$18,388$18,662$3,827
$22,489-$4,102
$56,134$808
$56,942$63,877$13,368$77,244
-$20,302
$71,279$180
$71,459$73,946$6,743
$80,689-$9,230
$13,927$13
$13,940$13,333
$208$13,541
$400
$277,910$2,674
$280,584$272,395
$8,049$280,444
Profit or loss
12
TABLE 4
********** PROFITABILITY AND LIQUIDITY ANALYSIS, 1984 **************Southwest Minnesota Farm Business Managment Association
(Farms Sorted According to Total Farm Profit/Loss)
Low 20% Middle 60% High 20% Average
** Profitability **
Number of farms 34 100 34 168
Labor and management earnings -$47,080 -$10,214 $36,795 -$8,161
Rate of return on investment % 0 3 9 4
Rate of return on net worth % -28 -4 9 -2
Net profit margin % -1 8 24 11
Asset turnover rate % 34 34 37 35
Interest on farm net worth $10,945 $16,152 $30,654 $18,033
Farm interest paid $48,566 $23,336 $28,554 $29,498
Value of operator labor and mgmt $14,118 $15,450 $20,294 $16,161
Return to farm investment -$1,686 $13,824 $75,708 $23,209
Average farm investment $601,166 $509,994 $835,395 $594,300
Return to farm net worth -$50,253 -$9,512 $47,155 -$6,289
Average farm net worth $182,411 $269,203 $510,897 $300,552
Value of farm production $205,469 $171,467 $310,907 $206,568
** Liquidity **
-- Cash Basis -
Net cash farm income $15,743 $40,393 $72,349 $41,872
Non farm income $8,473 $8,648 $6,454 $8,169
Total net income $24,217 $49,041 $78,803 $50,040
Family living and taxes paid $13,610 $23,908 $35,949 $24,261
Real estate principal payments $18,740 $5,593 $29,448 $13,081
Cash available for interm. debt -$8,134 $19,540 $13,406 $12,698
Average intermediate debt $165,008 $65,354 $87,091 $89,921
Years to turn over interm. debt Never* 3 6 7
Cash expense as a % of income 95 81 80 84
Interest as a % of income 16 11 8 11
-- Accrual Basis --
Inventory change -$19,660 -$5,639 $42,344 $1,234
Cash available for interm. debt -$27,794 $13,901 $55,750 $13,932
Years to turn over interm. debt Never 5 2 6
Cash expense as a % of income 101 83 72 83
Interest as a % of income 17 11 7 11
'Negative Years.
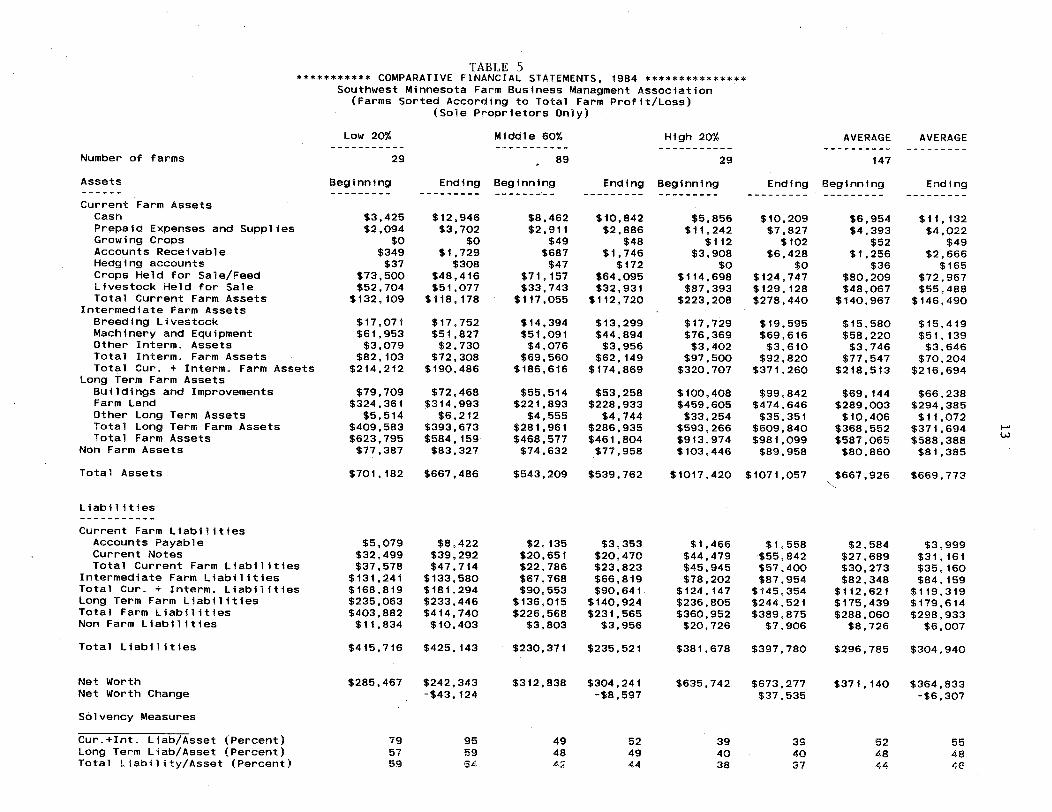
TABLE 5*********** COMPARATIVE FINANCIAL STATEMENTS, 1984 ***************
Southwest Minnesota Farm Business Managment Association(Farms Sorted According to Total Farm Profit/Loss)
(Sole Proprietors Only)
Low 20%
Number of farms 29
Assets
Current Farm AssetsCashPrepaid Expenses and SuppliesGrowing CropsAccounts ReceivableHedging accountsCrops Held for Sale/FeedLivestock Held for SaleTotal Current Farm Assets
Intermediate Farm AssetsBreeding LivestockMachinery and EquipmentOther Interm. AssetsTotal Interm. Farm AssetsTotal Cur. + Interm. Farm Assets
Long Term Farm AssetsBuildings and ImprovementsFarm LandOther Long Term AssetsTotal Long Term Farm AssetsTotal Farm Assets
Non Farm Assets
Beginning
$3,425$2,094
$0$349$37
$73,500$52,704
$132,109
$17,071$61,953$3,079
$82,103$214,212
$79,709$324,361
$5,514$409,583$623,795$77,387
Middle 60%
89
Ending Beginning_ _ _ _ _ _ _ _ _ - - - - - - - - -
$12,946$3,702
$0$1,729
$308$48,416$51,077
$118,178
$17,752$51,827$2,730
$72,308$190,486
$72,468$314,993
$6,212$393,673$584,159$83,327
$8,462$2,911
$49$687$47
$71,157$33,743
$117,055
$14,394$51,091$4,076
$69,560$186,616
$55,514$221,893
$4,555$281,961$468,577$74,632
High 20%
29
Ending Beginning_________ ____ _----
$10,842$2,886
$48$1,746
$172$64,095$32,931
$112,720
$13,299$44,894$3,956
$62,149$174,869
$53,258$228,933
$4,744$286,935$461,804$77,958
$5,856$11,242
$112$3,908
$0$114,698$87.393
$223,208
$17,729$76,369$3,402
$97,500$320,707
$100,408$459,605$33,254
$593,266$913,974$103,446
AVERAGE
147
Ending Beginning_ _ _ _ _ _ _ _ _ - - - - - - - - -
$10,209$7,827
$102$6,428
$0$124,747$129,128$278,440
$19,595$69,616
$3,610$92,820
$371,260
$99,842$474,646$35,351
$609 840$981,099$89,958
$6,954$4,393
$52$1,256
$36$80,209$48,067
$140,967
$15,580$58,220$3.746
$77,547$218,513
$69,144$289,003$10,406
$368,552$587,065$80,860
Total Assets $701,182 $667,486 $543,209 $539,762 $1017,420 $1071,057 $667,926 $669,773
Liabilities
Current Farm LiabilitiesAccounts PayableCurrent NotesTotal Current Farm Liabilities
Intermediate Farm LiabilitiesTotal Cur. + Interm. LiabilitiesLong Term Farm LiabilitiesTotal Farm LiabilitiesNon Farm Liabilities
Total Liabilities $415,716 $425,143 $230,371 $235,521 $381,678 $397,780 $296,785 $304,940
Net WorthNet Worth Change
Solvency Measures
Cur.+Int. Liab/Asset (Percent)Long Term Liab/Asset (Percent)Total Liability/Asset (Percent)
$285,467 $242,343-$43,124
795759
955964
$312,838 $304,241-$8,597
494842
524944
$635,742 $673,277$37,535
394038
394037
$371,140 $364,833-$6,307
524844
554846
AVERAGE_ _ _ _ _
Ending
$11,132$4,022
$49$2,666
$165$72,967$55,488
$146,490
$15,419$51,139$3,646
$70,204$216,694
$66,238$294,385$11,072
$371,694$588,388$81,385
$5,079$32,499$37,578
$131,241$168,819$235,063$403,882$11,834
$8,422$39,292$47,714
$133,580$181,294$233,446$414,740$10,403
$2 135$20,651$22,786$67,768$90,553
$136,015$226,568
$3,803
$3,353$20,470$23,823$66,819$90,641
$140,924$231,565
$3,956
$1,466$44,479$45,945$78,202
$124, 147$236,805$360,952$20,726
$1,558$55,842$57,400$87,954
$145,354$244,521$389,875
$7,906
$2,584$27,689$30,273$82,348
$112,621$175,439$288,060
$8,726
$3,999$31,161$35, 160$84 159
$119,319$179,614$298,933
$6,007
14
TABLE 6************ HOUSEHOLD AND PERSONAL EXPENSES, 1984 * ***** ****
Southwest Minnesota Farm Business Managment Association(Farms Sorted According to Total Farm Profit/Loss)
Low 20% Middle 60% High 20% Average
Number of farms 17* 60* 12, 89
Food and meals $3,766 $3,776 $4,452 $3,865Medical care and health insurance $2,223 $2,536 $2.,577 $2,482Church and charities $1,077 $1,290 $2,534 $1,417Operating and supplies $1,227 $1,205 $1,376 $1,232Clothing and clothing materials $1,266 $1,153 $1,668 $1,244Gifts and special events $1,287 $1,018 $1,431 $1,125Personal share of auto and truck $1,674 $1,022 $1,153 $1,164Personal care and spending $588 $703 $900 $708Education $295 $401 $490 $393Recreation $1,566 $901 $691 $1,000Upkeep on dwelling $427 $314 $1,041 $434Furnishings and equipment $1,678 $925 $981 $1,076Household real estate taxes $62 $19 $17 $27Dwelling rent $29 $33 $0 $28Telephone and electricity $967 $794 $1,117 $870Life insurance payments $1,142 $1,423 $4,810 $1,826Income taxes $1,522 $3,899 $9,622 $4,217Total cash living expenses $20,798 $21,413 $34,860 $23,109Family living from the farm $254 $310 $679 $349Total family living $21,052 $21,724 $35,538 $23,458
Household capital purchases $174 $1,721 $911 $1,316Personal vehicles,other nonfarm purchases $1,744 $2,256 $135 $1,872
Nonfarm real estate purchased $2,152 $220 $1,885 $814Savings $965 $2,628 $3,508 $2,429Total family uses of cash $25,832 $28,238 $41,299 $29,540
* Select farms.Rank unchanged fromprevious reports.
15
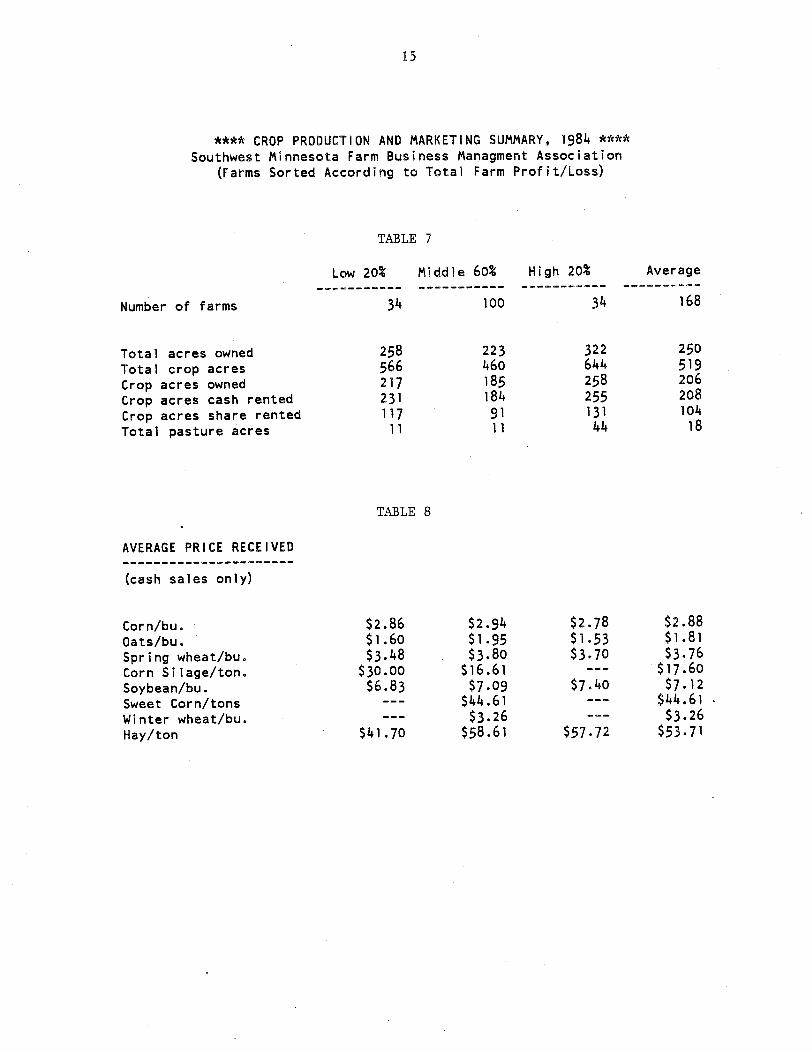
**** CROP PRODUCTION AND MARKETING SUMMARY, 1984 ****
Southwest Minnesota Farm Business Managment Association
(Farms Sorted According to Total Farm Profit/Loss)
TABLE 7
Low 20% Middle 60o High 20% Average
Number of farms 34 100 34 168
Total acres owned 258 223 322 250
Total crop acres 566 460 644 519
Crop acres owned 217 185 258 206
Crop acres cash rented 231 184 255 208
Crop acres share rented 117 91 131 104
Total pasture acres 11 11 44 18
TABLE 8
AVERAGE PRICE RECEIVED
(cash sales only)
Corn/bu. $2.86 $2.94 $2.78 $2.88
Oats/bu. $1.60 $1.95 $1.53 $1.81
Spring wheat/bu. $3.48 $3.80 $3.70 $3.76
Corn Silage/ton. $30.00 $16.61 --- $17.60
Soybean/bu. $6.83 $7.09 $7.40 $7.12
Sweet Corn/tons --- $44.61 -- $44.61
Winter wheat/bu. --- $3.26 -- $3.26
Hay/ton $41.70 $58.61 $57.72 $53.71
16
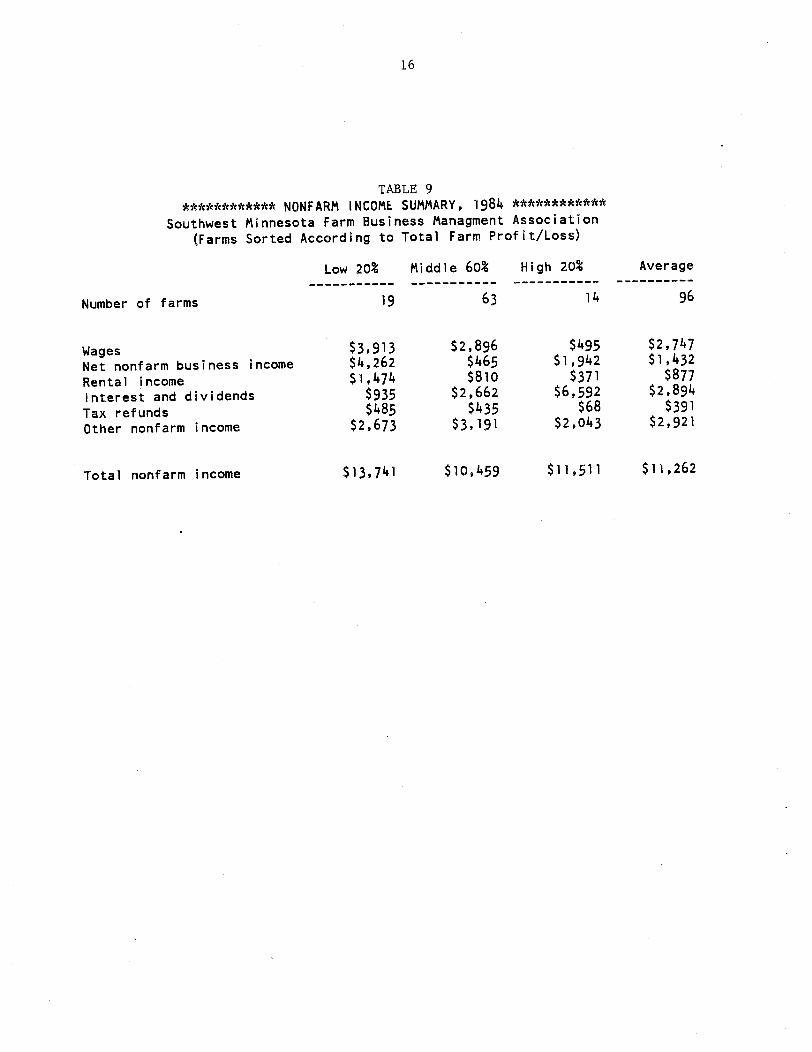
TABLE 9
************ NONFARM INCOME SUMMARY, 1984 ************
Southwest Minnesota Farm Business Managment Association
(Farms Sorted According to Total Farm Profit/Loss)
Low 20% Middle 60% High 20% Average
Number of farms 19 63 14 96
Wages $3,913 $2,896 $495 $2,747
Net nonfarm business income $4,262 $465 $1,942 $1,432
Rental income $1,474 $810 $371 $877
Interest and dividends $935 $2,662 $6,592 $2,894
Tax refunds $485 $435 $68 $391
Other nonfarm income $2,673 $3,191 $2,043 $2,921
$11,511 $11,262$13,741 $10,459Total nonfarm income
17
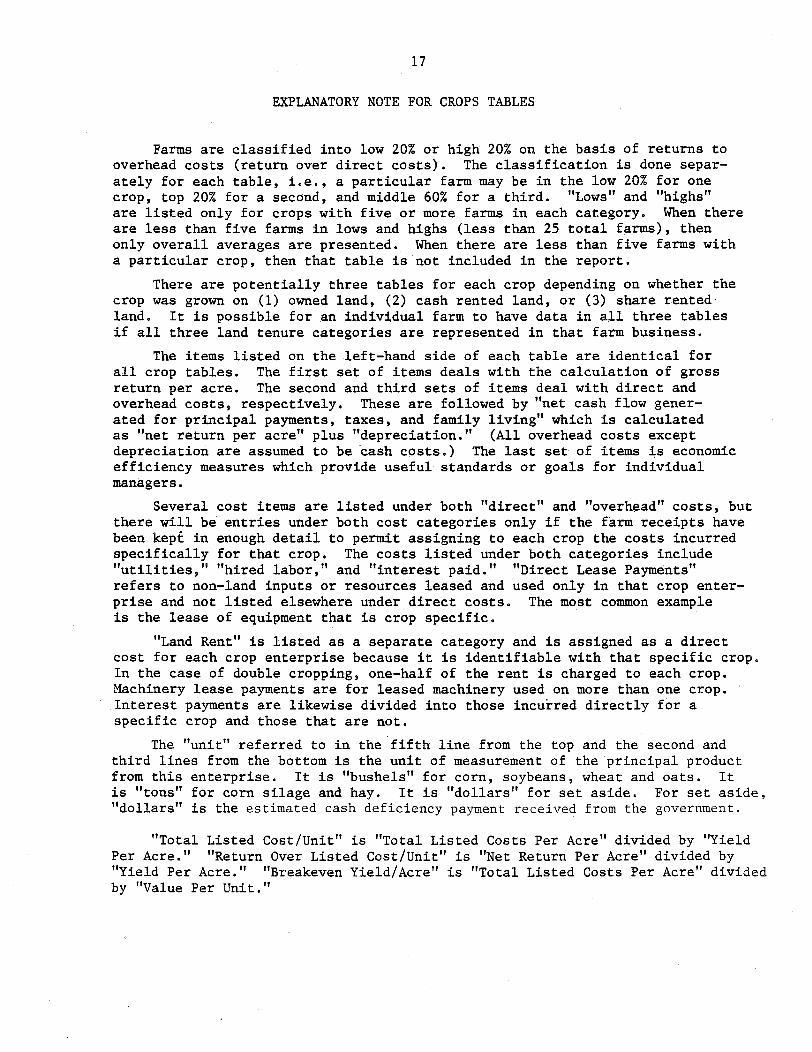
EXPLANATORY NOTE FOR CROPS TABLES
Farms are classified into low 20% or high 20% on the basis of returns tooverhead costs (return over direct costs). The classification is done separ-ately for each table, i.e., a particular farm may be in the low 20% for onecrop, top 20% for a second, and middle 60% for a third. "Lows" and "highs"are listed only for crops with five or more farms in each category. When thereare less than five farms in lows and highs (less than 25 total farms), thenonly overall averages are presented. When there are less than five farms witha particular crop, then that table is not included in the report.
There are potentially three tables for each crop depending on whether thecrop was grown on (1) owned land, (2) cash rented land, or (3) share rentedland. It is possible for an individual farm to have data in all three tablesif all three land tenure categories are represented in that farm business.
The items listed on the left-hand side of each table are identical forall crop tables. The first set of items deals with the calculation of grossreturn per acre. The second and third sets of items deal with direct andoverhead costs, respectively. These are followed by "net cash flow gener-ated for principal payments, taxes, and family living" which is calculatedas "net return per acre" plus "depreciation." (All overhead costs exceptdepreciation are assumed to be cash costs.) The last set of items is economicefficiency measures which provide useful standards or goals for individualmanagers.
Several cost items are listed under both "direct" and "overhead" costs, butthere will be entries under both cost categories only if the farm receipts havebeen kept in enough detail to permit assigning to each crop the costs incurredspecifically for that crop. The costs listed under both categories include"utilities," "hired labor," and "interest paid." "Direct Lease Payments"refers to non-land inputs or resources leased and used only in that crop enter-prise and not listed elsewhere under direct costs. The most common exampleis the lease of equipment that is crop specific.
"Land Rent" is listed as a separate category and is assigned as a directcost for each crop enterprise because it is identifiable with that specific crop.In the case of double cropping, one-half of the rent is charged to each crop.Machinery lease payments are for leased machinery used on more than one crop.Interest payments are likewise divided into those incurred directly for aspecific crop and those that are not.
The "unit" referred to in the fifth line from the top and the second andthird lines from the bottom is the unit of measurement of the principal productfrom this enterprise. It is "bushels" for corn, soybeans, wheat and oats. Itis "tons" for corn silage and hay. It is "dollars" for set aside. For set aside,"dollars" is the estimated cash deficiency payment received from the government.
"Total Listed Cost/Unit" is "Total Listed Costs Per Acre" divided by "YieldPer Acre." "Return Over Listed Cost/Unit" is "Net Return Per Acre" divided by"Yield Per Acre." "Breakeven Yield/Acre" is "Total Listed Costs Per Acre" dividedby "Value Per Unit."
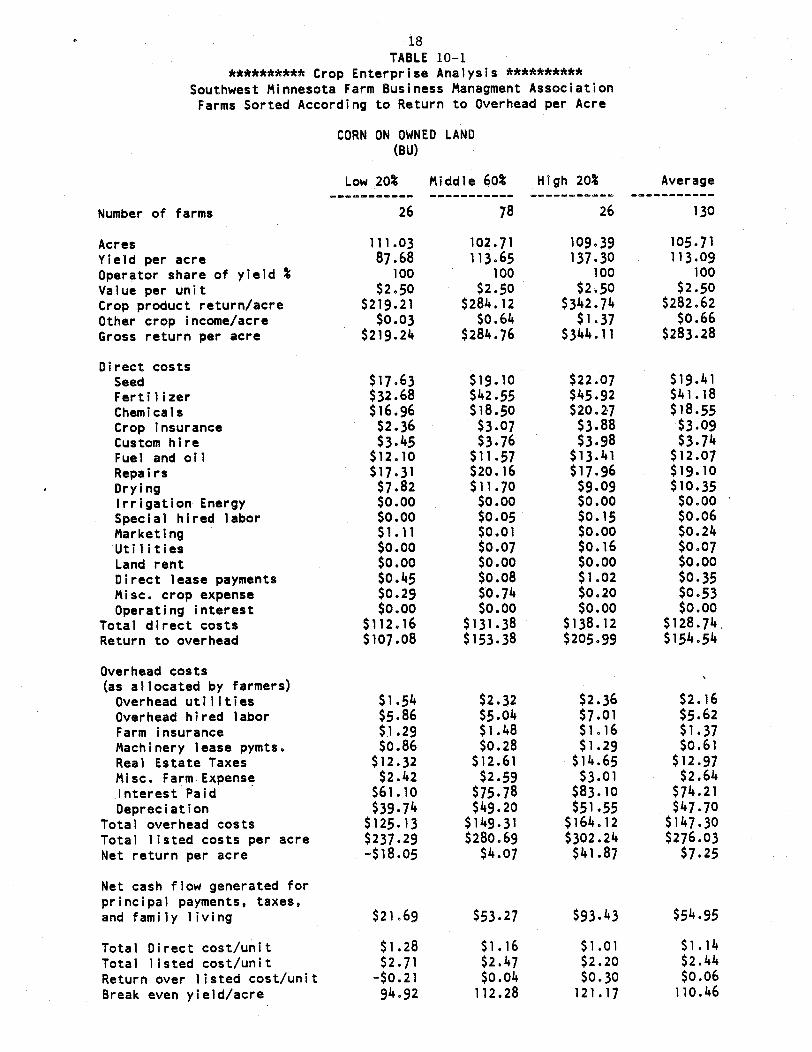
18TABLE 10-1
********** Crop Enterprise Analysis **********Southwest Minnesota Farm Business Managment AssociationFarms Sorted According to Return to Overhead per Acre
CORN ON OWNED LAND(BU)
Low 20% Middle 60% High 20% Average
Number of farms 26 78 26 130
Acres 111.03 102.71 109.39 105.71Yield per acre 87.68 113.65 137.30 113.09Operator share of yield % 100 100 100 100Value per unit $2.50 $2.50 $2.50 $2.50Crop product return/acre $219.21 $284.12 $342.74 $282.62Other crop income/acre $0.03 $0.64 $1.37 $0.66Gross return per acre $219.24 $284.76 $344.11 $283.28
Direct costsSeed $17.63 $19.10 $22.07 $19.41Fertilizer $32.68 $42.55 $45.92 $41.18Chemicals $16.96 $18.50 $20.27 $18.55Crop insurance $2.36 $3.07 $3.88 $3.09Custom hire $3.45 $3.76 $3.98 $3.74Fuel and oil $12.10 $11.57 $13.41 $12.07Repairs $17.31 $20.16 $17.96 $19.10Drying $7.82 $11.70 $9.09 $10.35Irrigation Energy $0.00 $0.00 $0.00 $0.00Special hired labor $0.00 $0.05 $0.15 $0.06Marketing $1.11 $0.01 $0.00 $0.24Utilities $0.00 $0.07 $0.16 $0007Land rent $0.00 $0.00 $0.00 $0.00Direct lease payments $0.45 $0.08 $1.02 $0.35Misc. crop expense $0.29 $0.74 $0.20 $0.53Operating interest $0.00 $0.00 $0.00 $0.00
Total direct costs $112.16 $131.38 $138.12 $128.74.Return to overhead $107.08 $153.38 $205.99 $154.54
Overhead costs(as allocated by farmers)Overhead utilities $1.54 $2.32 $2.36 $2.16Overhead hired labor $5.86 $5.04 $7.01 $5.62Farm insurance $1.29 $1.48 $1.16 $1.37Machinery lease pymts. $0.86 $0.28 $1.29 $0.61Real Estate Taxes $12.32 $12.61 $14.65 $12.97Misc. Farm Expense $2.42 $2.59 $3.01 $2.64Interest Paid $61.10 $75.78 $83.10 $74.21Depreciation $39.74 $49.20 $51.55 $47.70
Total overhead costs $125.13 $149.31 $164.12 $147.30Total listed costs per acre $237.29 $280.69 $302.24 $276.03Net return per acre -$18.05 $4.07 $41.87 $7.25
Net cash flow generated forprincipal payments, taxes,and family living $21.69 $53.27 $93.43 $54.95
Total Direct cost/unit $1.28 $1.16 $1.01 $1.14Total listed cost/unit $2.71 $2.47 $2.20 $2.44Return over listed cost/unit -$0.21 $0.04 $0.30 $0,06Break even yield/acre 94.92 112.28 121.17 110.46
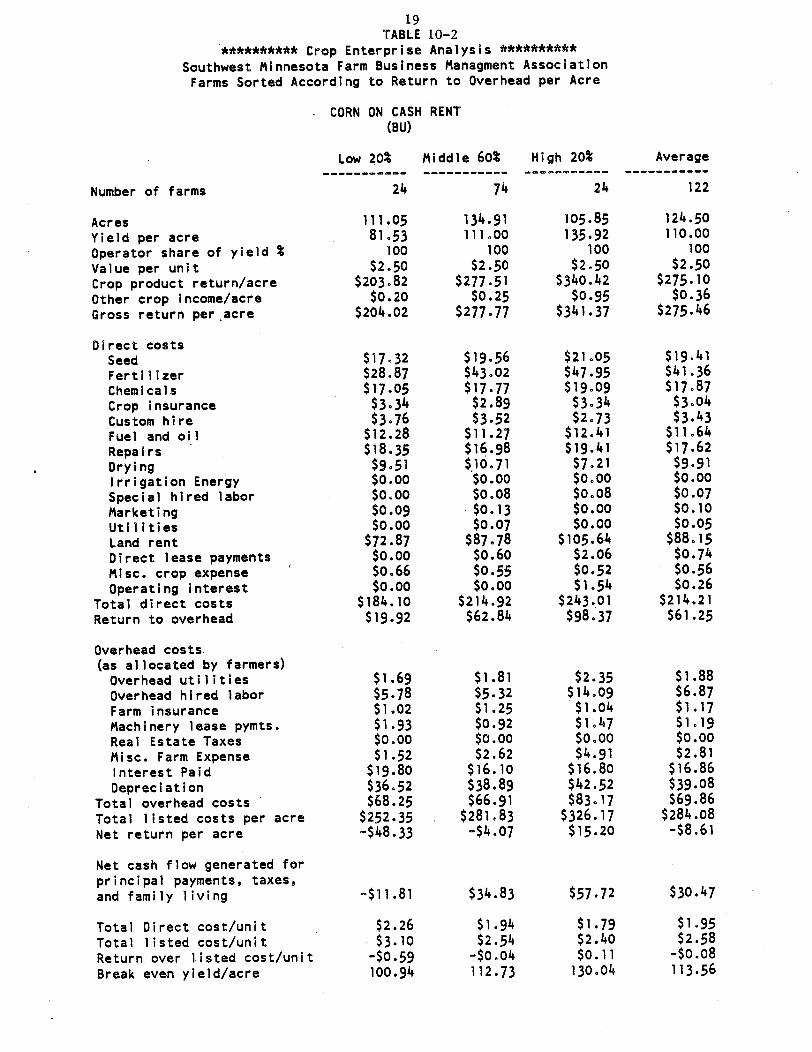
19TABLE 10-2
********** Crop Enterprise Analysis *********Southwest Minnesota Farm Business Managment Association
Farms Sorted According to Return to Overhead per Acre
CORN ON CASH RENT(BU)
Low 20% Middle 60% High 20% Average
Number of farms 24 74 24 122
Acres 111.05 134.91 105.85 124.50Yield per acre 81.53 111.00 135.92 110.00
Operator share of yield * 100 100 100 100Value per unit $2.50 $2.50 $2.50 $2.50Crop product return/acre $203.82 $277.51 $340.42 $275.10Other crop income/acre $0.20 $0.25 $0.95 $0.36Gross return per acre $204.02 $277.77 $341.37 $275.46
Direct costsSeed $17.32 $19.56 $21.05 $19.41Fertilizer $28.87 $43.02 $47.95 $41.36
Chemicals $17.05 $17.77 $19.09 $17.87Crop insurance $3.34 $2.89 $3.34 $3.04
Custom hire $3.76 $3.52 $2.73 $3.43Fuel and oil $12.28 $11.27 $12.41 $11.64Repairs $18.35 $16.98 $19.41 $17.62Drying $9.51 $10.71 $7.21 $9.91Irrigation Energy $0.00 $0.00 $0.00 $0.00Special hired labor $0.00 $0.08 $0.08 $0.07
Marketing $0.09 $0.13 $0.00 $0.10Utilities $0.00 $0.07 $0.00 $0.05
Land rent $72.87 $87.78 $105.64 $88.15Direct lease payments $0.00 $0.60 $2.06 $0.74
Misc. crop expense $0.66 $0.55 $0.52 $0.56Operating interest $0.00 $0.00 $1.54 $0.26
Total direct costs $184.10 $214.92 $243.01 $214.21Return to overhead $19.92 $62.84 $98.37 $61.25
Overhead costs(as allocated by farmers)Overhead utilities $1.69 $1.81 $2.35 $1.88Overhead hired labor $5.78 $5.32 $14.09 $6.87Farm insurance $1.02 $1.25 $1.04 $1.17
Machinery lease pymts. $1.93 $0.92 $1.47 $1.19
Real Estate Taxes $0.00 $0.00 $0.00 $0.00Misc. Farm Expense $1.52 $2.62 $4.91 $2.81Interest Paid $19.80 $16.10 $16.80 $16.86Depreciation $36.52 $38.89 $42.52 $39.08
Total overhead costs $68.25 $66.91 $83.17 $69.86Total listed costs per acre $252.35 $281.83 $326.17 $284.08Net return per acre -$48.33 -$4.07 $15.20 -$8.61
Net cash flow generated forprincipal payments, taxes,and family living -$11.81 $34.83 $57.72 $30.47
Total Direct cost/unit $2.26 $1.94 $1.79 $1.95Total listed cost/unit $3.10 $2.54 $2.40 $2.58Return over listed cost/unit -$0.59 -$0.04 $0.11 -$0.08Break even yield/acre 100.94 112.73 130.04 113.56

20TABLE 10-3
********** Crop Enterprise Analysis **********Southwest Minnesota Farm Business Managment AssociationFarms Sorted According to Return to Overhead per Acre
CORK ON SHARE RENT(BU)
Low 20% Middle 60% High 20% Average
Number of farms 17 51 17 85
Acres 118.33 87.74 80.27 92.37Yield per acre 89.85 109.15 129.09 107.67Operator share of yield % 55 57 64 58Value per unit $2.50 $2.50 $2.50 $2.50Crop product return/acre $122.41 $153.76 $205.60 $154.74Other crop income/acre $0.00 $0.04 $0.00 $0.02
Gross return per acre $122.41 $153.80 $205.60 $154.76
Direct costsSeed $15.07 $16.61 $22.02 $17.15Fertilizer $20.09 $25.02 $42.45 $26.79Chemicals $11.41 $11.62 $16.76 $12.46Crop insurance $0.74 $2.91 $3.51 $2.46Custom hire $3.20 $3.80 $2.32 $3.39Fuel and oil $10.77 $11.35 $13.50 $11.57Repairs $16.36 $17.10 $15.13 $16.57Drying $6.19 $7.57 $7.92 $7.27Irrigation Energy $0.00 $0. $000 .0 $0.00Special hired labor $0.01 $0.00 $0.00 $0.00Marketing $0.00 $0.37 $0.00 $0.21Utilities $0.00 $0.00 $0.04 $0.01Land rent $0.00 $0.00 $0.00 $0.00Direct lease payments $5.70 $0.59 $1.50 $2.06Misc. crop expense $0.61 $0.45 $0.80 $0.55Operating interest $0.00 $0.00 $0.00 $0.00
Total direct costs $90.16 $97.37 $125.93 $100.49Return to overhead $32.25 $56.42 $79.67 $54.27
Overhead costs(as allocated by farmers)Overhead utilities $2.40 $2.14 $2.43 $2.26
Overhead hired labor $3.88 $5.26 $2.77 $4.47Farm insurance $1.02 $1.11 $1.37 $1.13Machinery lease pymts. $2.93 $0.47 $3.93 $1.70Real Estate Taxes $0.00 $0.00 $0.00 $0.00Misc. Farm Expense $1.81 $2.48 $2.29 $2.27Interest Paid $16.75 $19.50 $18.62 $18.64
Depreciation $30.24 $38.69 $41.45 $37.00Total overhead costs $59.02 $69.65 $72.87 $67.49Total listed costs per acre $149.18 $167.02 $198.80 $167.97Net return per acre -$26.77 -$13.23 $6.80 -$13.22
Net cash flow generated forprincipal payments, taxes,and family living $3.47 $25.46 $48.25 $23.79
Total Direct cost/unit $1.83 $1.57 $1.52 $1.62Total listed cost/unit $3.03 $2.70 $2.41 $2.71Return over listed cost/unit -$0.54 -$0.21 $0.08 -$0.21Break even yield/acre 108.92 117.88 124.27 116.93
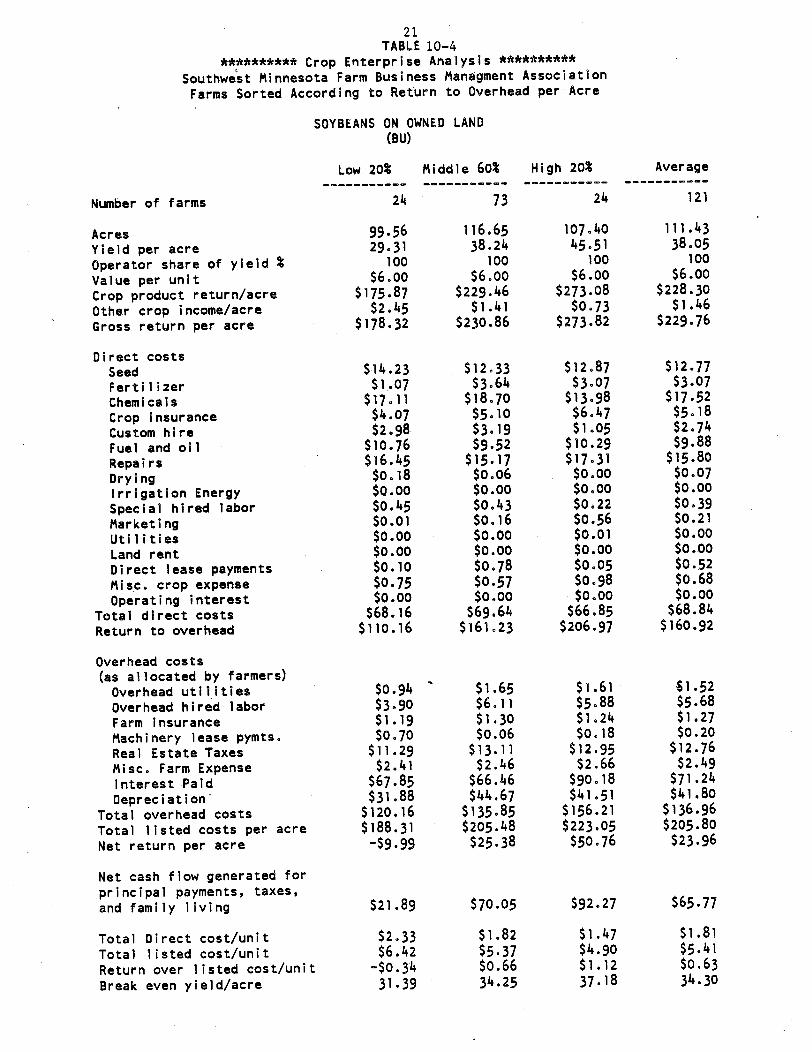
21TABLE 10-4
********** Crop Enterprise Analysis **********
Southwest Minnesota Farm Business Managment Association
Farms Sorted According to Return to Overhead per Acre
SOYBEANS ON OWNED LAND(BU)
Low 20%
24Number of farms
Middle 60%
73
High 20%
24
AcresYield per acreOperator share of yield %Value per unitCrop product return/acreOther crop income/acreGross return per acre
Direct costsSeedFertilizerChemicalsCrop insuranceCustom hireFuel and oilRepairsDryingIrrigation EnergySpecial hired laborMarketingUtilitiesLand rentDirect lease paymentsMisco crop expenseOperat i ng interest
Total direct costsReturn to overhead
Overhead costs(as allocated by farmers)Overhead utilitiesOverhead hired laborFarm insuranceMachinery lease pymts.Real Estate TaxesMisc. Farm ExpenseInterest PaidDepreciation
Total overhead costsTotal listed costs per acreNet return per acre
Net cash flow generated forprincipal payments, taxes,and family living
Total Direct cost/unitTotal listed cost/unitReturn over listed cost/unitBreak even yield/acre
Average
121
99.5629.31
100$6.00
$175.87$2.45
$178.32
$14.23$1.07
$17.11$4.07$2.98
$10.76$16.45$0.18$0.00$0.45$0.01$0.00$0.00$0.10$0.75$0.00$68.16
$110.16
$0.94$3.90$1.19$0.70
$11.29$2.41
$67.85$31.88
$120.16$188.31-$9.99
$21.89
$2.33$6.42
-$0.3431.39
116.6538.24
100$6.00
$229.46$1.41
$230.86
$12.33$3.64
$18.70$5.10$3.19$9.52
$15.17$0.06$0.00$0.43$0.16$0.00$0.00$0.78$0.57$0.00
$69.64$161.23
$1.65$6.11$1.30$0.06
$13.11$2.46
$66.46$44.67
$135.85$205.48$25.38
$70.05
$1.82$5.37$0.6634.25
107.4045.51
100$6.00
$273.08$0.73
$273.82
$12.87$3.07
$13.98$6.47$1.05
$10.29$17.31$0.00$0.00$0.22$0.56$0.01$0.00$0.05$0.98$0.00
$66.85$206.97
$1.61$5.88$1.24$0.18
$12.95$2.66$90.18$41.51
$156.21$223005$50.76
$92.27
$1.47$4.90$1.1237.18
111.4338.05
100$6.00
$228.30$1.46
$229.76
$12.77$3.07
$17.52$5.18$2.74$9.88
$15.80$0.07$0.00$0.39$0.21$0.00$0.00$0.52$0.68$0.00
$68.84$160.92
$1.52$5.68$1.27$0.20
$12.76$2.49
$71.24$41.80$136.96$205.80$23.96
$65.77
$1.81$5.41$0.6334.30

22TABLE 10-5
********** Crop Enterprise Analysis **********Southwest Minnesota Farm Business Managment Association
Farms Sorted According to Return to Overhead per Acre
SOYBEANS ON CASH RENT(BU)
Low 20% Middle 60% High 20% Average
Number of farms 23 67 23 113
Acres 123.03 145.16 70.68 125.50Yield per acre 28.23 38.37 44.63 37.07Operator share of yield % 100 100 100 100Value per unit $6.00 $6.00 $6.00 $6.00Crop product return/acre $169.37 $230.25 $267.79 $222.40Other crop income/acre $2.71 $1.16 $4.71 $1.88Gross return per acre $172.08 $231.41 $272.50 $224.28
Direct costsSeed $12.59 $12.79 $12.74 $12.74Fertilizer $0.82 $2.47 $3.33 $2.24Chemicals $17.15 $16.87 $17.11 $16.96Crop insurance $5.91 $6.32 $7.55 $6.38Custom hire $4.54 $2.38 $2.74 $2.85Fuel and oil $7.92 $9.32 $11.26 $9.26Repairs $12.52 $15.14 $15.06 $14.61Drying $0.14 $0.02 $0.00 $0.04Irrigation Energy $0.00 $0.00 $0.00 $0.00Special hired labor $0.06 $0.45 $0.93 $0.43Marketing $0.30 $0.14 $0.29 $0.19Utilities $0.00 $0.00 $0.01 $0.00Land rent $68.48 $90.06 $99.27 $86.81Direct lease payments $0.08 $0.36 $0.41 $0.31Misc. crop expense $0.52 $0.76 $0.63 $0.70Operating interest $0.00 $0.00 $1.66 $0.19
Total direct costs $131.01 $157.08 $172.98 $153.70Return to overhead $41.08 $74.32 $99.52 $70.58
Overhead costs(as allocated by farmers)
Overhead utilities $1.02 $1.19 $1.71 $1.22Overhead hired labor $3.69 $7.24 $5.90 $6.38Farm insurance $1.26 $1.10 $1.35 $1.16Machinery lease pymts. $1.91 $0.68 $0.41 $0.90Real Estate Taxes $0.00 $0.00 $0.00 $0.00Misc. Farm Expense $1.89 $2.88 $2.14 $2.60Interest Paid $23.60 $13.86 $15.84 $16.03Depreciation $26.57 $34.75 $33.22 $32.94
Total overhead costs $59.94 $61.70 $60.58 $61.22Total listed costs per acre $190.94 $218.79 $233.56 $214.93Net return per acre -$18.86 $12.62 $38.94 $9.36
Net cash flow generated forprincipal payments, taxes,and family living $7.71 $47.37 $72.16 $42.30
Total Direct cost/unit $4.64 $4.09 $3.88 $4.15Total listed cost/unit $6.76 $5.70 $5.23 $5.80Return over listed cost/unit -$0.67 $0.33 $0.87 $0.25Break even yield/acre 31.82 36.46 38.93 35.82
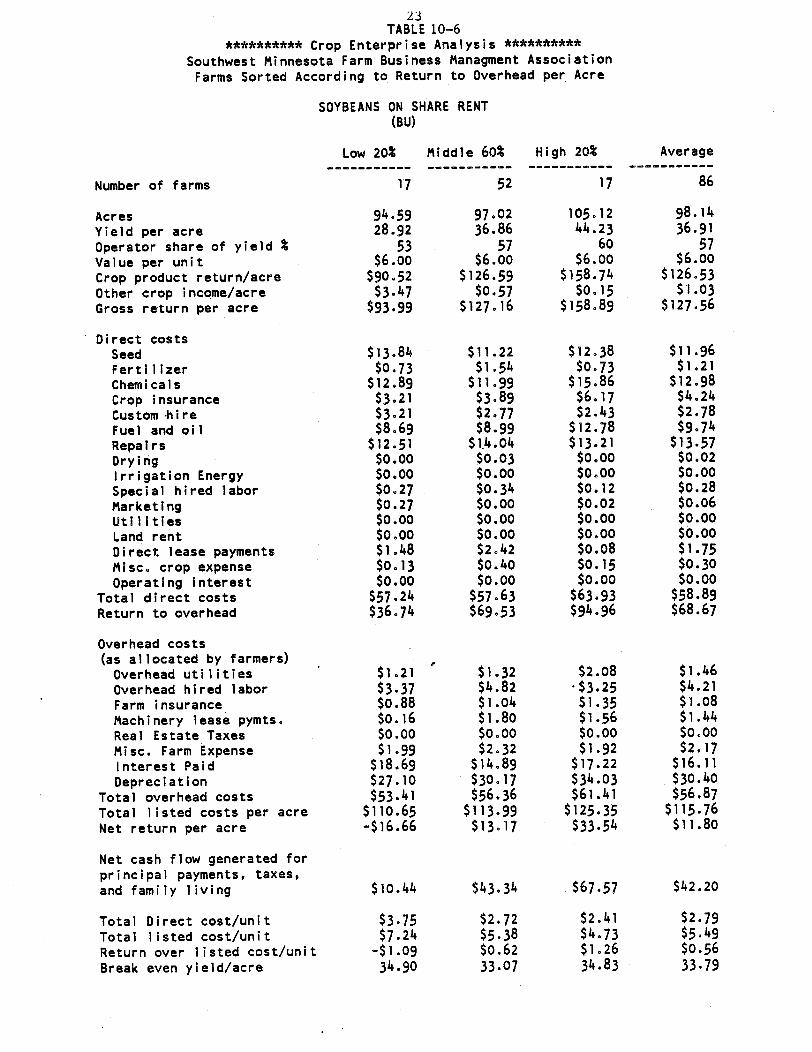
23TABLE 10-6
********* Crop Enterprise Analysis **********
Southwest Minnesota Farm Business Managment AssociationFarms Sorted According to Return to Overhead per Acre
SOYBEANS ON SHARE RENT(BU)
Low 20%
17Number of farms
Middle 60%
52
High 20%
17
AcresYield per acreOperator share of yield %Value per unitCrop product return/acreOther crop income/acreGross return per acre
Direct costsSeedFertilizerChemicalsCrop insuranceCustom hireFuel and oilRepairsDryingIrrigation EnergySpecial hired laborMarketingUtilitiesLand rentDirect lease paymentsMisc. crop expenseOperating interest
Total direct costsReturn to overhead
Overhead costs(as allocated by farmers)Overhead utilitiesOverhead hired laborFarm insuranceMachinery lease pymts.Real Estate TaxesMisc. Farm ExpenseInterest PaidDepreciation
Total overhead costsTotal listed costs per acreNet return per acre
Net cash flow generated forprincipal payments, taxes,and family living
Total Direct cost/unitTotal listed cost/unitReturn over listed cost/unitBreak even yield/acre
Average
86
94.5928.92
53$6.00
$90.52$3.47
$93.99
$13.84$0.73
$12.89$3.21$3.21$8.69
$12.51$0.00$0.00$0.27$0.27$0.00$0.00$1.48$0.13$0.00$57.24$36.74
$1.21$3.37$0.88$0.16$0.00$1.99
$18.69$27.10$53.41
$110.65-$16.66
$10.44
$3.75$7.24
-$1.0934.90
97.0236.86
57$6.00
$126.59$0.57
$127.16
$11.22$1.54
$11.99$3.89$2.77$8.99
$14.04$0.03$0.00$0.34$0.00$0.00$0.00$2.42$0.40$0.00
$57.63$69.53
$1.32$4.82$1.04$1.80$0.00$2.32
$14.89$30.17$56.36
$113.99$13.17
$43.34
$2.72$5.38$0.6233.07
105.1244.23
60$6.00
$158.74$0.15
$158.89
$12.38$0073
$15.86$6.17$2.43
$12.78$13.21$0.00$0.00$0.12$0.02$0.00$0.00$0.08$0.15$0.00
$63.93$94.96
$2.08$3.25$1.35$1.56$0.00$1.92
$17.22$34.03$61.41
$125.35$33.54
$67.57
$2.41$4.73$1.2634.83
98.1436.91
57$6.00
$126.53$1.03
$127.56
$11.96$1.21
$12.98$4.24$2.78$9.74
$13.57$0.02$0.00$0.28$0.06$0.00$0.00$1.75$0.30$0.00
$58.89$68.67
$1.46$4.21$1.08$1.44$0.00$2.17
$16.11$30.40$56.87
$115.76$11.80
$42.20
$2.79$5.49$0.5633.79
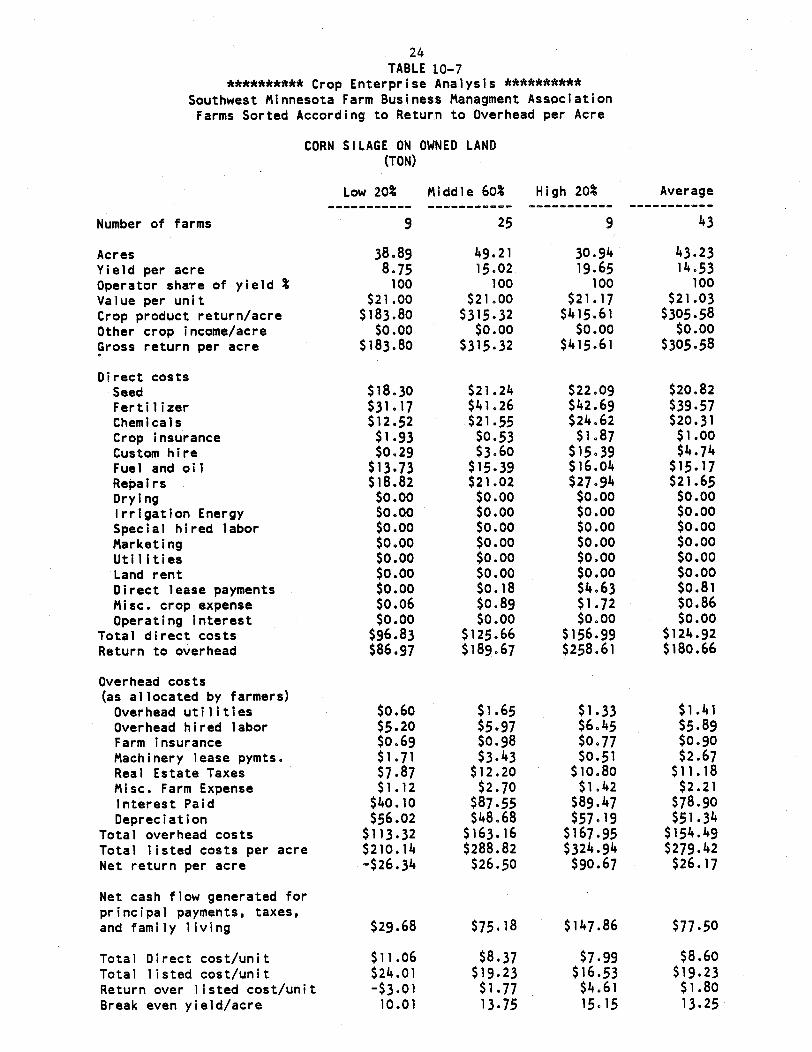
24TABLE 10-7
********** Crop Enterprise Analysis **********Southwest Minnesota Farm Business Managment AssociationFarms Sorted According to Return to Overhead per Acre
CORN SILAGE ON OWNED LAND(TON)
Low 20% Middle 60% High 20% Average
Number of farms 9 25 9 43
Acres 38.89 49.21 30.94 43.23Yield per acre 8.75 15.02 19.65 14.53Operator share of yield % 100 100 100 100Value per unit $21.00 $21.00 $21.17 $21.03Crop product return/acre $183.80 $315.32 $415.61 $305.58Other crop income/acre $0.00 $0.00 $0.00 $0.00Gross return per acre $183.80 $315.32 $415.61 $305.58
Direct costsSeed $18.30 $21.24 $22.09 $20.82Fertilizer $31.17 $41.26 $42.69 $39.57Chemicals $12.52 $21.55 $24.62 $20.31Crop insurance $1.93 $0.53 $1.87 $1.00Custom hire $0.29 $3.60 $15.39 $4.74Fuel and oil $13.73 $15.39 $16.04 $15.17Repairs $18.82 $21.02 $27.94 $21.65Drying $0.00 $0.00 $0.00 $0.00Irrigation Energy $0.00 $0.00 $0.00 $0.00Special hired labor $0.00 $0.00 $0.00 $0.00Marketing $0.00 $0.00 $0.00 $0.00Utilities $0.00 $0.00 $0.00 $0.00Land rent $0.00 $0.00 $0.00 $0.00Direct lease payments $0.00 $0.18 $4.63 $0.81Misc. crop expense $0.06 $0.89 $1.72 $0.86Operating interest $0.00 $0.00 $0.00 $0.00
Total direct costs $96.83 $125.66 $156.99 $124.92Return to overhead $86.97 $189.67 $258.61 $180.66
Overhead costs(as allocated by farmers)Overhead utilities $0.60 $1.65 $1.33 $1.41Overhead hired labor $5.20 $5.97 $6.45 $5.89Farm insurance $0.69 $0.98 $0.77 $0.90Machinery lease pymts. $1.71 $3.43 $0.51 $2.67Real Estate Taxes $7.87 $12.20 $10.80 $11.18Misc. Farm Expense $1.12 $2.70 $1.42 $2.21Interest Paid $40.10 $87.55 $89.47 $78.90Depreciation $56.02 $48.68 $57.19 $51.34
Total overhead costs $113.32 $163.16 $167.95 $154.49Total listed costs per acre $210.14 $288.82 $324.94 $279.42Net return per acre -$26.34 $26.50 $90.67 $26.17
Net cash flow generated forprincipal payments, taxes,and family living $29.68 $75.18 $147.86 $77.50
Total Direct cost/unit $11.06 $8.37 $7.99 $8.60Total listed cost/unit $24.01 $19.23 $16.53 $19.23Return over listed cost/unit -$3.01 $1.77 $4.61 $1.80Break even yield/acre 10.01 13.75 15.15 13.25
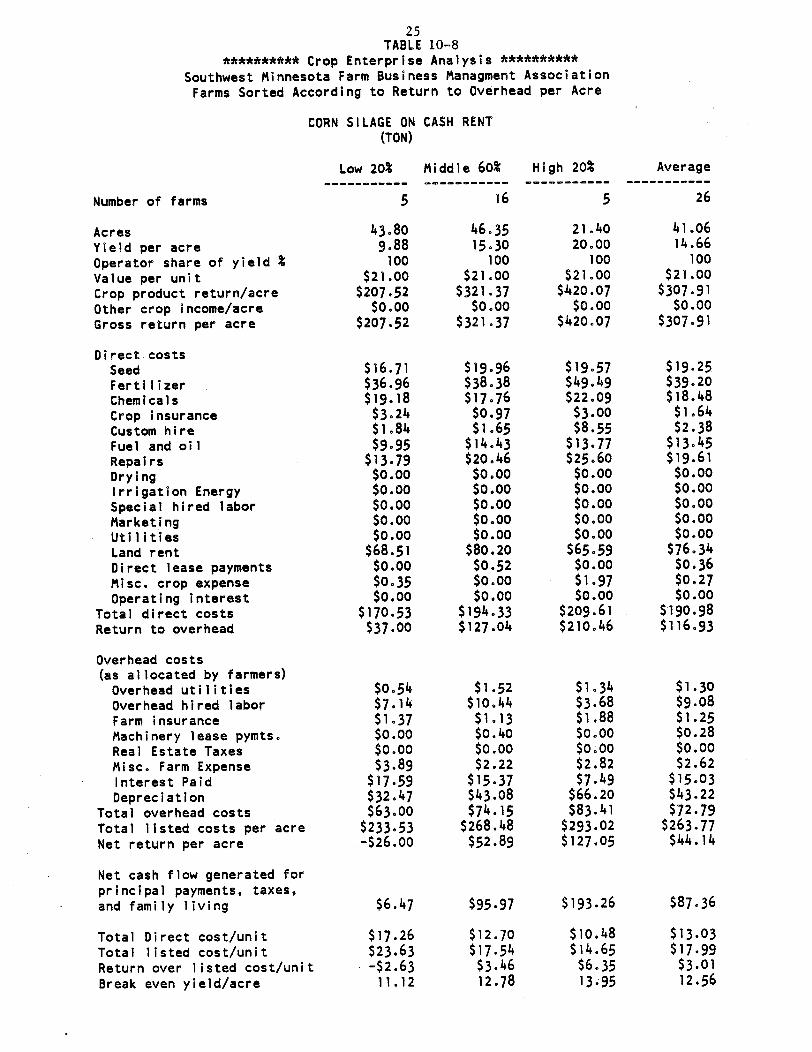
25TABLE 10-8
********** Crop Enterprise Analysis **********Southwest Minnesota Farm Business Managment AssociationFarms Sorted According to Return to Overhead per Acre
CORN SILAGE ON CASH RENT(TON)
Low 20% Middle 60% High 20% Average
Number of farms 5 16 5 26
Acres 43.80 46.35 21.40 41.06Yield per acre 9.88 15.30 20.00 14.66Operator share of yield % 100 100 100 100Value per unit $21.00 $21.00 $21.00 $21.00Crop product return/acre $207.52 $321.37 $420.07 $307.91Other crop income/acre $0.00 $0.00 $0.00 $0.00Gross return per acre $207.52 $321.37 $420.07 $307.91
Direct costsSeed $16.71 $19.96 $19.57 $19.25Fertilizer $36.96 $38.38 $49.49 $39.20Chemicals $19.18 $17.76 $22.09 $18.48Crop insurance $3.24 $0.97 $3.00 $1.64Custom hire $1.84 $1.65 $8.55 $2.38Fuel and oil $9.95 $14.43 $13.77 $13.45Repairs $13.79 $20.46 $25.60 $19.61Drying $0.00 $0.00 $0.00 $0.00Irrigation Energy $0.00 $0.00 $0.00 $0.00Special hired labor $0.00 $0.00 $0.00 $0.00Marketing $0.00 $0.00 $0.00 $0.00Utilities $0.00 $0.00 $0.00 $0.00Land rent $68.51 $80.20 $65.59 $76.34Direct lease payments $0.00 $0.52 $0.00 $0.36Misc. crop expense $0.35 $0.00 $1.97 $0.27Operating interest $0.00 $0.00 $0.00 $0.00
Total direct costs $170.53 $194.33 $209.61 $190.98Return to overhead $37.00 $127.04 $210.46 $116.93
Overhead costs(as allocated by farmers)Overhead utilities $0.54 $1.52 $1.34 $1.30Overhead hired labor $7.14 $10.44 $3.68 $9.08Farm insurance $1.37 $1.13 $1.88 $1.25Machinery lease pymts. $0.00 $0.40 $0.00 $0.28Real Estate Taxes $0.00 $0.00 $0.00 $0.00Misc. Farm Expense $3.89 $2.22 $2.82 $2.62Interest Paid $17.59 $15.37 $7.49 $15.03Depreciation $32.47 $43.08 $66.20 $43.22
Total overhead costs $63.00 $74.15 $83.41 $72.79Total listed costs per acre $233.53 $268.48 $293.02 $263.77Net return per acre -$26.00 $52.89 $127.05 $44.14
Net cash flow generated forprincipal payments, taxes,and family living $6.47 $95.97 $193.26 $87.36
Total Direct cost/unit $17.26 $12.70 $10.48 $13.03Total listed cost/unit $23.63 $17.54 $14.65 $17.99Return over listed cost/unit -$2.63 $3.46 $6.35 $3.01Break even yield/acre 11.12 12.78 13.95 12.56
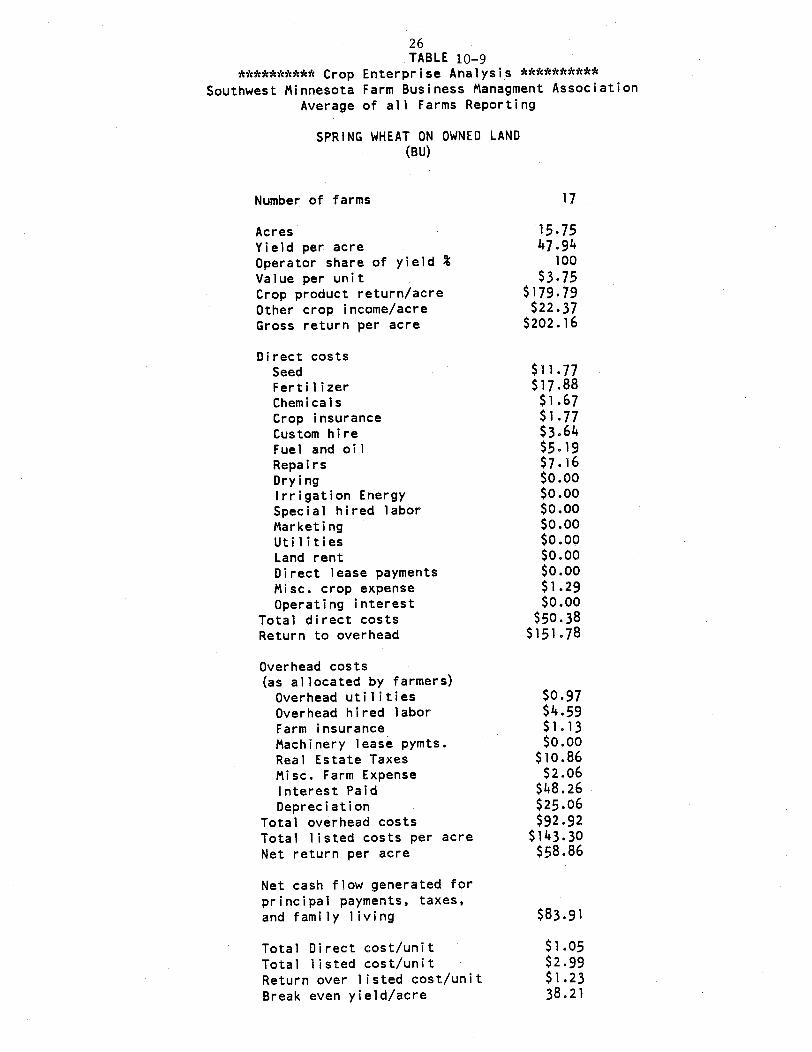
26TABLE 10-9
********** Crop Enterprise Analysis ********
Southwest Minnesota Farm Business Managment AssociationAverage of all Farms Reporting
SPRING WHEAT ON OWNED LAND(BU)
Number of farms 17
Acres 15.75Yield per acre 47.94
Operator share of yield % 100
Value per unit $3.75Crop product return/acre $179.79Other crop income/acre $22.37
Gross return per acre $202.16
Direct costsSeed $11.77Fertilizer $17.88Chemicals $1.67
Crop insurance $1.77Custom hire $3.64
Fuel and oil $5.19Repairs $7.16
Drying $0.00Irrigation Energy $0.00Special hired labor $0.00
Marketing $0.00
Utilities $0.00
Land rent $0.00Direct lease payments $0.00
Misc. crop expense $1.29
Operating interest $0.00
Total direct costs $50.38Return to overhead $151.78
Overhead costs(as allocated by farmers)Overhead utilities $0.97Overhead hired labor $4.59Farm insurance $1.13Machinery lease pymts. $0.00
Real Estate Taxes $10.86Misc. Farm Expense $2.06
Interest Paid $48.26
Depreciation $25.06
Total overhead costs $92.92Total listed costs per acre $143.30Net return per acre $58.86
Net cash flow generated forprincipal payments, taxes,and family living $83.91
Total Direct cost/unit $1.05
Total listed cost/unit $2.99
Return over listed cost/unit $1.23
Break even yield/acre 38.21
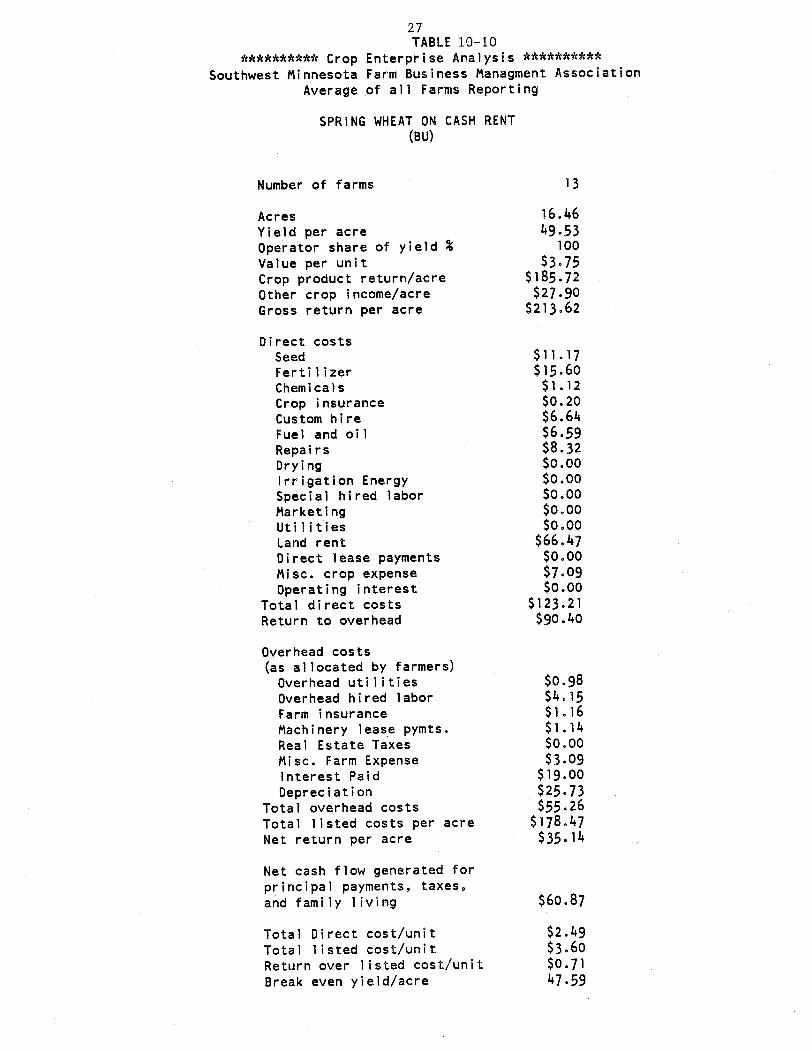
27TABLE 10-10
********** Crop Enterprise Analysis *********
Southwest Minnesota Farm Business Managment AssociationAverage of all Farms Reporting
SPRING WHEAT ON CASH RENT(BU)
Number of farms 13
Acres 16.46
Yield per acre 49.53Operator share of yield % 100
Value per unit $3.75Crop product return/acre $185.72Other crop income/acre $27.90Gross return per acre $213.62
Direct costsSeed $11.17Fertilizer $15.60Chemicals $1.12Crop insurance $0.20Custom hire $6.64
Fuel and oil $6.59Repairs $8.32Drying $0.00Irrigation Energy $0.00Special hired labor $0.00Marketing $0o00Utilities $0o00
Land rent $66.47Direct lease payments $0.00
Misc. crop expense $7.09Operating interest $0.00
Total direct costs $123.21Return to overhead $90.40
Overhead costs(as allocated by farmers)Overhead utilities $0.98
Overhead hired labor $4.15
Farm insurance $1o16
Machinery lease pymts. $1.14
Real Estate Taxes $0.00
Misc. Farm Expense $3.09Interest Paid S19.00
Depreciation $25.73Total overhead costs $55.26Total listed costs per acre $178.47
Net return per acre $35.14
Net cash flow generated forprincipal payments, taxes,and family living $60.87
Total Direct cost/unit $2.49
Total listed cost/unit $3.60
Return over listed cost/unit $0.71
Break even yield/acre 47.59
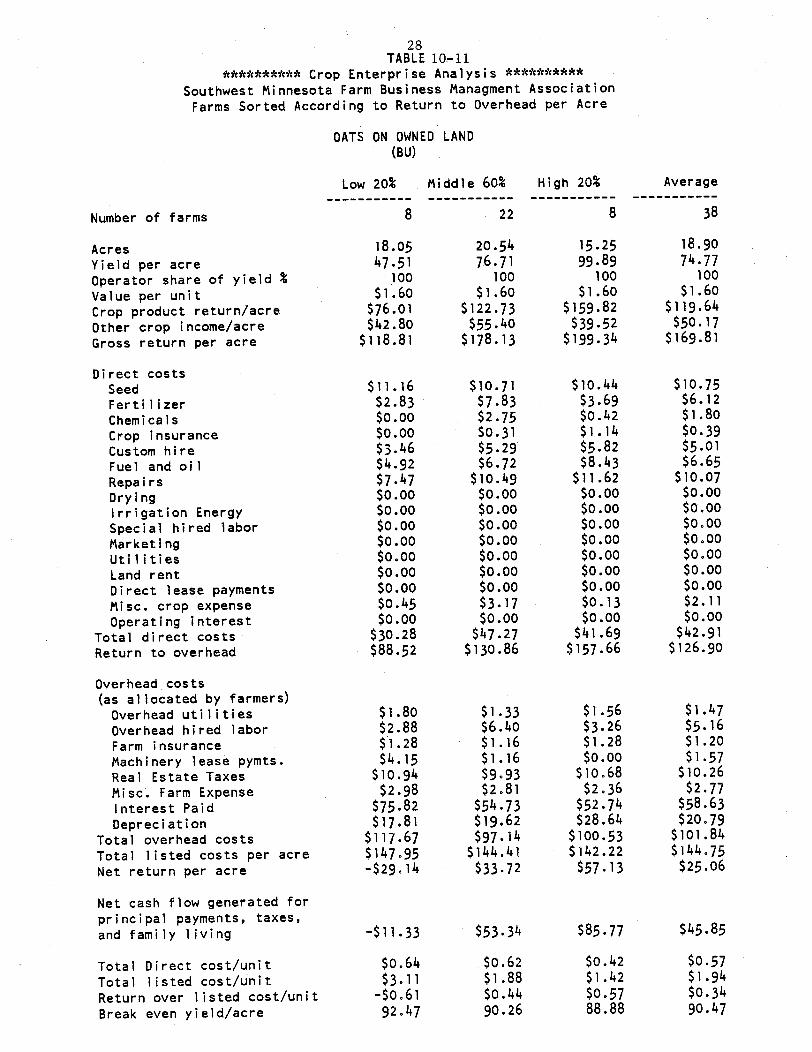
28TABLE 10-11
********** Crop Enterprise Analysis **********
Southwest Minnesota Farm Business Managment Association
Farms Sorted According to Return to Overhead per Acre
OATS ON OWNED LAND(BU)
Low 20% Middle 60% High 20% Average
Number of farms 8 22 8 38
Acres 18.05 20.54 15.25 18.90
Yield per acre 47.51 76.71 99.89 74.77
Operator share of yield % 100 100 100 100
Value per unit $1.60 $1.60 $1.60 $1.60
Crop product return/acre $76.01 $122.73 $159.82 $119.64
Other crop income/acre $42.80 $55.40 $39.52 $50.17
Gross return per acre $118.81 $178.13 $199.34 $169.81
Direct costsSeed $11.16 $10.71 $10.44 $10.75
Fertilizer $2.83 $7.83 $3.69 $6.12
Chemicals $0.00 $2.75 $0.42 $1.80
Crop insurance $0.00 $0.31 $1.14 $0.39
Custom hire $3.46 $5.29 $5.82 $5.01
Fuel and oil $4.92 $6.72 $8.43 $6.65
Repairs $7.47 $10.49 $11.62 $10.07
Drying $0.00 $0.00 $0.00 $0.00
Irrigation Energy $0.00 $0.00 $0.00 $0.00
Special hired labor $0.00 $0.00 $0.00 $0.00
Marketing $0.00 $0.00 $0.00 $0.00
Utilities $0.00 $0.0 00 $. $0.00
Land rent $0.00 $0.00 $0.00 $0.00
Direct lease payments $0.00 $0.00 $0.00 $0.00
Misc. crop expense $0.45 $3.17 $0.13 $2.11
Operating interest $0.00 $0.00 $0.00 $0.00
Total direct costs $30.28 $47.27 $41.69 $42.91
Return to overhead $88.52 $130.86 $157.66 $126.90
Overhead costs(as allocated by farmers)Overhead utilities $1.80 $1.33 $1.56 $1.47
Overhead hired labor $2.88 $6.40 $3.26 $5.16
Farm insurance $1.28 $1.16 $1.28 $1.20
Machinery lease pymts. $4.15 $1.16 $0.00 $1.57
Real Estate Taxes $10.94 $9.93 $10.68 $10.26
Misc. Farm Expense $2.98 $2.81 $2.36 $2.77
Interest Paid $75.82 $54.73 $52.74 $58.63
Depreciation $17.81 $19.62 $28.64 $20.79
Total overhead costs $117.67 $97.14 $100.53 $101.84
Total listed costs per acre $147.95 $144.41 $142.22 $144.75
Net return per acre -$29.14 $33.72 $57.13 $25.06
Net cash flow generated forprincipal payments, taxes,and family living -$11.33 $53.34 $85.77 $45.85
Total Direct cost/unit $0.64 $0.62 $0.42 $0.57
Total listed cost/unit $3.11 $1.88 $1.42 $1.94
Return over listed cost/unit -$0.61 $0.44 $0.57 $0.34
Break even yield/acre 92.47 90.26 88.88 90.47
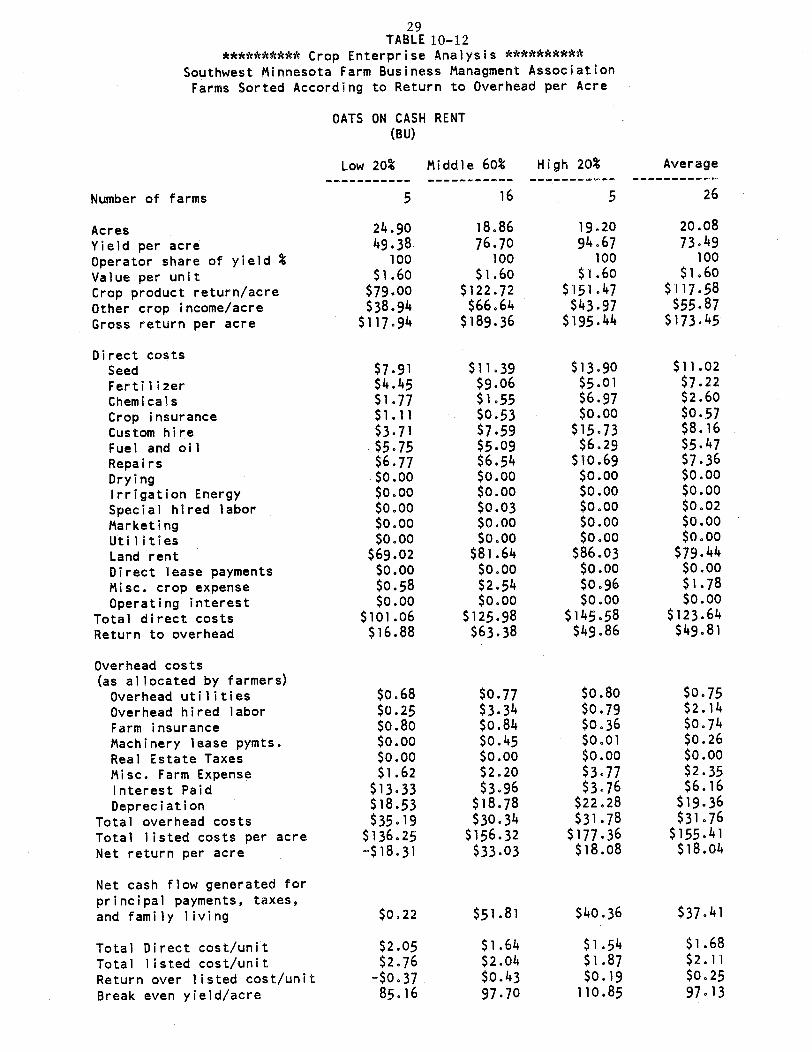
29TABLE 10-12
********** Crop Enterprise Analysis **********
Southwest Minnesota Farm Business Managment Association
Farms Sorted According to Return to Overhead per Acre
OATS ON CASH RENT(BU)
Low 20% Middle 60% High 20% Average
Number of farms 5 16 5 26
Acres 24.90 18.86 19.20 20.08
Yield per acre 49.38 76.70 94.67 73.49
Operator share of yield % 100 100 100 100
Value per unit $1.60 $1.60 $1.60 $1.60
Crop product return/acre $79.00 $122.72 $151.47 $117.58
Other crop income/acre $38.94 $66.64 $43.97 $55.87
Gross return per acre $117.94 $189.36 $195.44 $173.45
Direct costsSeed $7.91 $11.39 $13.90 $11.02
Fertilizer $4.45 $9.06 $5.01 $7.22
Chemicals $1.77 $1.55 $6.97 $2.60
Crop insurance $1.11 $0.53 $0.00 $0.57
Custom hire $3.71 $7.59 $15.73 $8.16
Fuel and oil $5.75 $5.09 $6.29 $5.47Repairs $6.77 $6.54 $10.69 $7.36
Drying $0.00 $0.00 $0.00 $0.00
Irrigation Energy $0.00 $0.00 $0.00 $0.00
Special hired labor $0.00 $0.03 $0.00 $0.02
Marketing $0.00 $0.00 $0.00 $0.00
Utilities $0.00 $0.00 $0.00 $0.00
Land rent $69.02 $81.64 $86.03 $79.44
Direct lease payments $0.00 $0.00 $0.00 $0.00
Misc. crop expense $0.58 $2.54 $0.96 $1.78
Operating interest $0.00 $0.00 $0.00 $0.00
Total direct costs $101.06 $125.98 $145.58 $123.64
Return to overhead $16.88 $63.38 $49.86 $49.81
Overhead costs(as allocated by farmers)Overhead utilities $0.68 $0.77 $0.80 $0.75Overhead hired labor $0.25 $3.34 $0.79 $2.14
Farm insurance $0.80 $0.84 $0.36 $0.74
Machinery lease pymts. $0.00 $0.45 $0.01 $0.26
Real Estate Taxes $0.00 $0.00 $0.00 $0.00
Misc. Farm Expense $1.62 $2.20 $3.77 $2.35
Interest Paid $13.33 $3.96 $3.76 $6.16
Depreciation $18.53 $18.78 $22.28 $19.36
Total overhead costs $35.19 $30.34 $31.78 $31.76
Total listed costs per acre $136.25 $156.32 $177.36 $155.41
Net return per acre -$18.31 $33.03 $18.08 $18.04
Net cash flow generated forprincipal payments, taxes,and family living $0.22 $51.81 $40.36 $37.41
Total Direct cost/unit $2.05 $1.64 $1.54 $1.68
Total listed cost/unit $2.76 $2.04 $1.87 $2.11
Return over listed cost/unit -$0.37 $0.43 $0.19 $0.25
Break even yield/acre 85.16 97.70 110.85 97.13
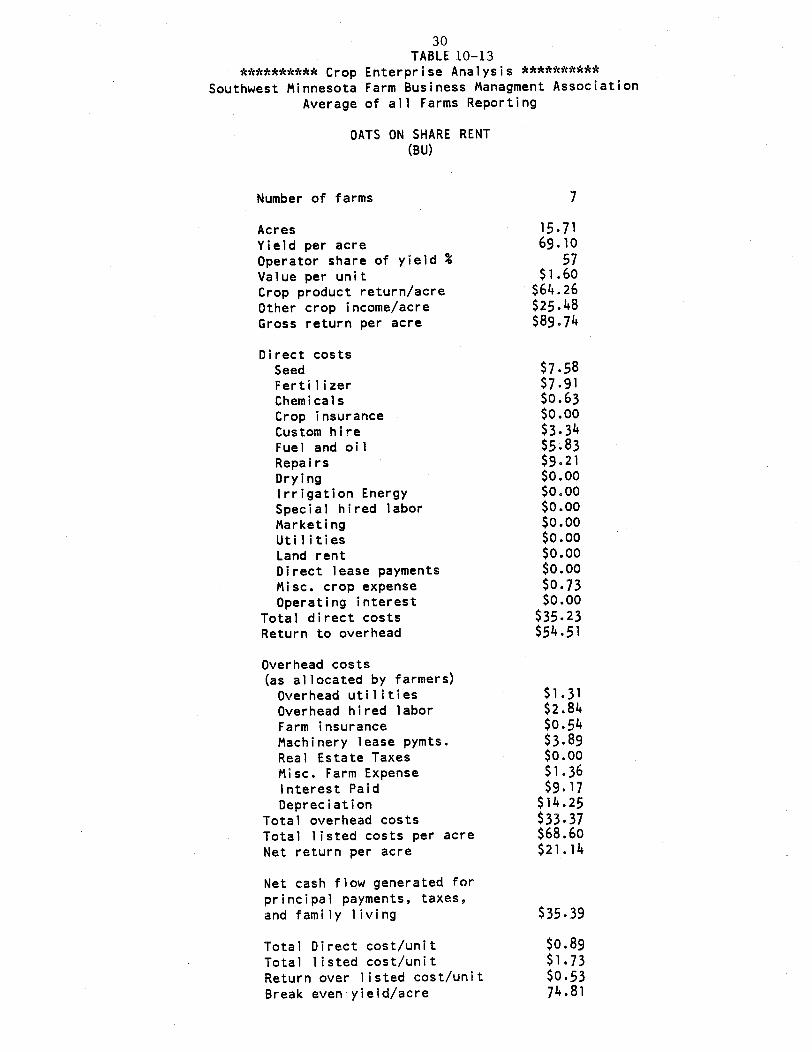
30TABLE 10-13
********** Crop Enterprise Analysis ********
Southwest Minnesota Farm Business Managment Association
Average of all Farms Reporting
OATS ON SHARE RENT(BU)
Number of farms 7
Acres 15.71
Yield per acre 69.10
Operator share of yield % 57Value per unit $1.60
Crop product return/acre $64.26
Other crop income/acre $25.48
Gross return per acre $89.74
Direct costsSeed $7.58Fertilizer $7.91Chemicals $0.63
Crop insurance $0.00
Custom hire $3.34Fuel and oil $5.83Repairs $9.21
Drying $0.00Irrigation Energy $0.00Special hired labor $0.00
Marketing $0.00Utilities $0.00
Land rent $0.00
Direct lease payments $0.00
Misc. crop expense $0.73Operating interest $0.00
Total direct costs $35.23Return to overhead $54.51
Overhead costs(as allocated by farmers)Overhead utilities $1.31
Overhead hired labor $2.84
Farm insurance $0.54Machinery lease pymts. $3.89Real Estate Taxes $0.00
Misc. Farm Expense $1.36
Interest Paid $9.17Depreciation $14.25
Total overhead costs $33.37Total listed costs per acre $68.60
Net return per acre $21.14
Net cash flow generated forprincipal payments, taxes,and family living $35.39
Total Direct cost/unit $0.89
Total listed cost/unit $1.73
Return over listed cost/unit $0.53
Break even yield/acre 74.81
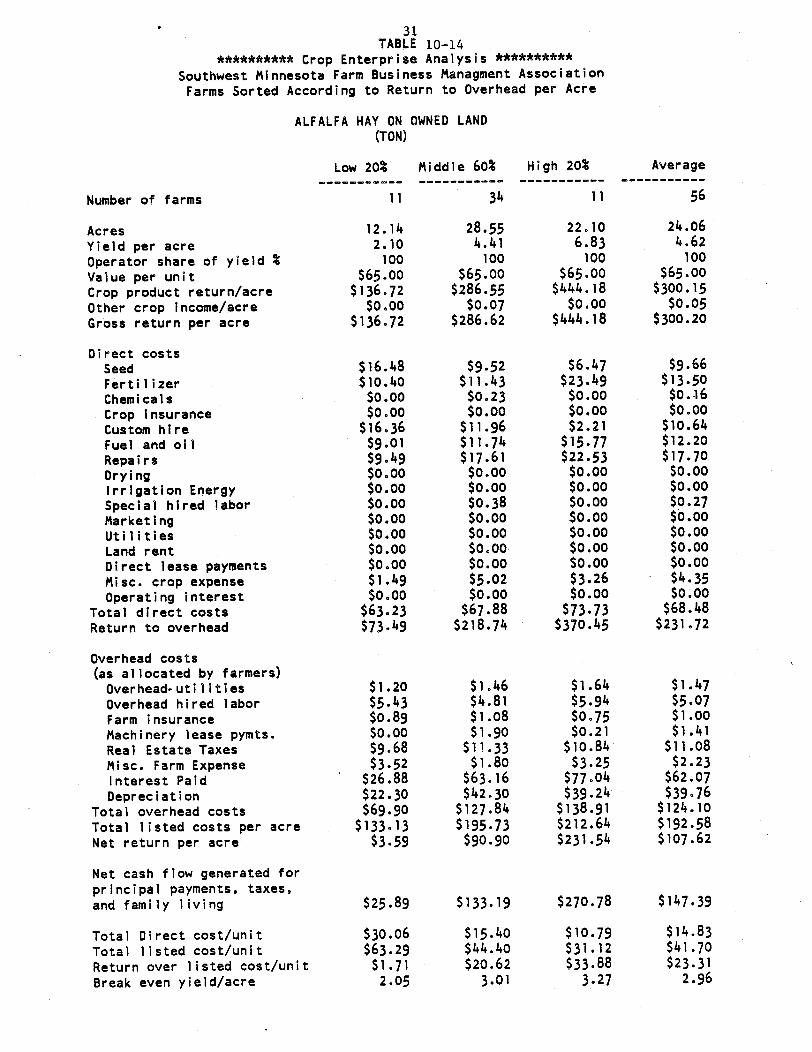
31TABLE 10-14
********** Crop Enterprise Analysis **********
Southwest Minnesota Farm Business Managment Association
Farms Sorted According to Return to Overhead per Acre
ALFALFA HAY ON OWNED LAND(TON)
Low 20% Middle 60% High 20% Average
Number of farms 11 34 11 56
Acres 12.14 28.55 22.10 24.06
Yield per acre 2.10 4.41 6.83 4.62
Operator share of yield % 100 100 100 100
Value per unit $65.00 $65.00 $65.00 $65.00
Crop product return/acre $136.72 $286.55 $444.18 $300.15
Other crop income/acre $0.00 $0.07 $0.00 $0.05
Gross return per acre $136.72 $286.62 $444.18 $300.20
Direct costsSeed $16.48 $9.52 $6.47 $9.66
Fertilizer $10.40 $11.43 $23.49 $13.50
Chemicals $0.00 $0.23 $0.00 $0.16
Crop insurance $0.00 $0.00 $0.00 $0.00
Custom hire $16.36 $11.96 $2.21 $10.64
Fuel and oil $9.01 $11.74 $15.77 $12.20Repairs $9.49 $17.61 $22.53 $17.70
Drying $0.00 $0.00 $0.00 $0.00
Irrigation Energy $0.00 $0.00 $0.00 $0.00
Special hired labor $0.00 $0.38 $0.00 $0.27
Marketing $0.00 $0.00 $0.00 $0.00
Utilities $0.00 $0.00 $0.00 $0.00
Land rent $0.00 $0.00 $0.00 $0.00
Direct lease payments $0.00 $0 .00 $0.00
Misc. crop expense $1.49 $5.02 $3.26 $4.35
Operating interest $0.00 $0.00 $0.00 $0.00
Total direct costs $63.23 $67.88 $73.73 $68.48Return to overhead $73.49 $218.74 $370.45 $231.72
Overhead costs(as allocated by farmers)Overhead-utilities $1.20 $1.46 $1.64 $1.47
Overhead hired labor $5.43 $4.81 $5.94 $5.07
Farm insurance $0.89 $1.08 $0.75 $1.00
Machinery lease pymts. $0.00 $1.90 $0.21 $1.41
Real Estate Taxes $9.68 $11.33 $10.84 $11.08
Misc. Farm Expense $3.52 $1.80 $3.25 $2.23
Interest Paid $26.88 $63.16 $77.04 $62.07Depreciation $22.30 $42.30 $39.24 $39.76
Total overhead costs $69.90 $127.84 $138.91 $124.10
Total listed costs per acre $133.13 $195.73 $212.64 $192.58
Net return per acre $3.59 $90.90 $231.54 $107.62
Net cash flow generated forprincipal payments, taxes,and family living $25.89 $133.19 $270.78 $147.39
Total Direct cost/unit $30.06 $15.40 $10.79 $14.83
Total listed cost/unit $63.29 $44.40 $31.12 $41.70Return over listed cost/unit $1.71 $20.62 $33.88 $23.31
Break even yield/acre 2.05 3.01 3.27 2.96

32TABLE 10-15
********** Crop Enterprise Analysis **********Southwest Minnesota Farm Business Managment AssociationFarms Sorted According to Return to Overhead per Acre
ALFALFA HAY ON CASH RENT(TON)
Low 20% Middle 60o High 20% Average
Number of farms 8 25 8 41
Acres 36.24 32.98 31.13 33.25Yield per acre 2.27 4.03 6.34 4.08Operator share of yield % 100 100 100 100Value per unit $65.00 $65.00 $65.00 $65.00Crop product return/acre $147.60 $262.24 $412.09 $265.23Other crop income/acre $0.00 $0.83 $0.00 $0.50Gross return per acre $147.60 $263.07 $412.09 $265.73
Direct costsSeed $5.51 $7.41 $8.48 $7.20Fertilizer $2.37 $16.10 $33.08 $16.28Chemicals $0.00 $0.42 $0.00 $0.25Crop insurance $0.00 $0.00 $0.00 $0.00Custom hire $5.81 $8.29 $2.17 $6.64Fuel and oil $7.86 $9.51 $9.95 $9.24Repairs $13.69 $15.94 $24.47 $17.02Drying $0.00 $0.00 $0.00 $0.00Irrigation Energy $0.00 $0.00 $0.00 $0.00Special hired labor $0.00 $0.08 $2.34 $0.48Marketing $0.00 $0.00 $0.00 $0.00Utilities $0.00 $0.00 $0.00 $0.00Land rent $39.93 $75.89 $83.32 $69.60Direct lease payments $0.00 $1.21 $0.00 $0.73Misc. crop expense $0.68 $2.09 $4.81 $2.29Operating interest $0.00 $. $0.00 $000 $00
Total direct costs $75.85 $136.94 $168.63 $129.74Return to overhead $71.74 $126.13 $243.46 $135.99
Overhead costs(as allocated by farmers)Overhead utilities $1.04 $0.71 $1.63 $0.95Overhead hired labor $6.55 $3.99 $4.24 $4.58Farm insurance $0.78 $1.24 $0.84 $1.07Machinery lease pymts. $0.16 $0.72 $2.26 $0.88Real Estate Taxes $0.00 $0.00 $0.00 $0.00Misc. Farm Expense $3.33 $2.61 $3.18 $2.87Interest Paid $14.13 $12.28 $15.12 $13.19Depreciation $30.49 $33.27 $37.11 $33.38
Total overhead costs $56.47 $54.83 $64.38 $56.92Total listed costs per acre $132.32 $191.77 $233.01 $186.66Net return per acre $15.28 $71.30 $179.08 $79.07
Net cash flow generated forprincipal payments, taxes,and family living $45.77 $104.57 $216.19 $112.45
Total Direct cost/unit $33.40 $33.94 $26.60 $31.79Total listed cost/unit $58.27 $47.53 $36.75 $45.74Return over listed cost/unit $6.73 $17.67 $28.25 $19.38Break even yield/acre 2.04 2.95 3.58 2.87

33TABLE 10-16
********** Crop Enterprise Analysis **********Southwest Minnesota Farm Business Managment Association
Farms Sorted According to Return to Overhead per Acre
SET ASIDE ACRES ON OWNED LAND($)
Low 20% Middle 60% High 20% Average
Number of farms 18 56 18 92
Acres 20.40 12.82 14.86 14.70
Yield per acre 210.68 339.21 401.81 316.69Operator share of yield % 100 100 100 100Value per unit $1.00 $1.00 $1.00 $1.00Crop product return/acre $210.68 $339.21 $401.81 $316.69Other crop income/acre $0.00 $0.00 $0.00 $0.00
Gross return per acre $210.68 $339.21 $401.81 $316.69
Direct costsSeed $3.24 $3.86 $4.75 $3.87Fertilizer $0.00 $0.00 $0.00 $0.00
Chemicals $2.83 $0.71 $0.53 $1.25Crop insurance $0.00 $0.00 $0.00 $0.00Custom hire $0.68 $0.09 $0.58 $0.34Fuel and oil $3.73 $4.48 $3.73 $4.13Repairs $5.41 $7.94 $6.03 $6.88Drying $0.00 $0.00 $0.00 $0.00Irrigation Energy $0.00 $0.00 $0.00 $0.00Special hired labor $0.00 $0.00 $0.00 $0.00Marketing $0.00 $0.00 $0.00 $0.00Utilities $0.00 $0.00 $0.00 $0.00Land rent $0.00 $0.00 $0.00 $0.00Direct lease payments $0.00 $0.00 $0.42 $0.08Misc. crop expense $0.76 $1.98 $0.78 $1.41Operating interest $0.00 $0.00 $0.00 $0.00
Total direct costs $16.65 $19.05 $16.82 $17.96Return to overhead $194.03 $320.15 $384.99 $298.73
Overhead costs(as allocated by farmers)
Overhead utilities $0.49 $1..09 $1.48 $1.01
Overhead hired labor $3.69 $2.69 $9.52 $4.31Farm insurance $0.88 $0.85 $1.03 $0.89Machinery lease pymts. $0.19 $0.11 $0.00 $0.11Real Estate Taxes $10.55 $11.96 $14.31 $12.04Misc. Farm Expense $1.98 $2.21 $2.91 $2.29Interest Paid $45.69 $68.94 $63.54 $61.56Depreciation $14.52 $20.87 $18.87 $18.75
Total overhead costs $77.99 $108.71 $111.66 $100.96Total listed costs per acre $94.64 $127.77 $128.48 $118.92Net return per acre $116.04 $211.44 $273.33 $197.78
Net cash flow generated forprincipal payments, taxes,and family living $130.55 $232.31 $292.20 $216.53
Total Direct cost/unit $0.08 $0.06 $0.04 $0.06
Total listed cost/unit $0.45 $0.38 $0.32 $0.38Return over listed cost/unit $0.55 $0.62 $0.68 $0.62
Break even yield/acre 94.64 127.77 128.48 118.92
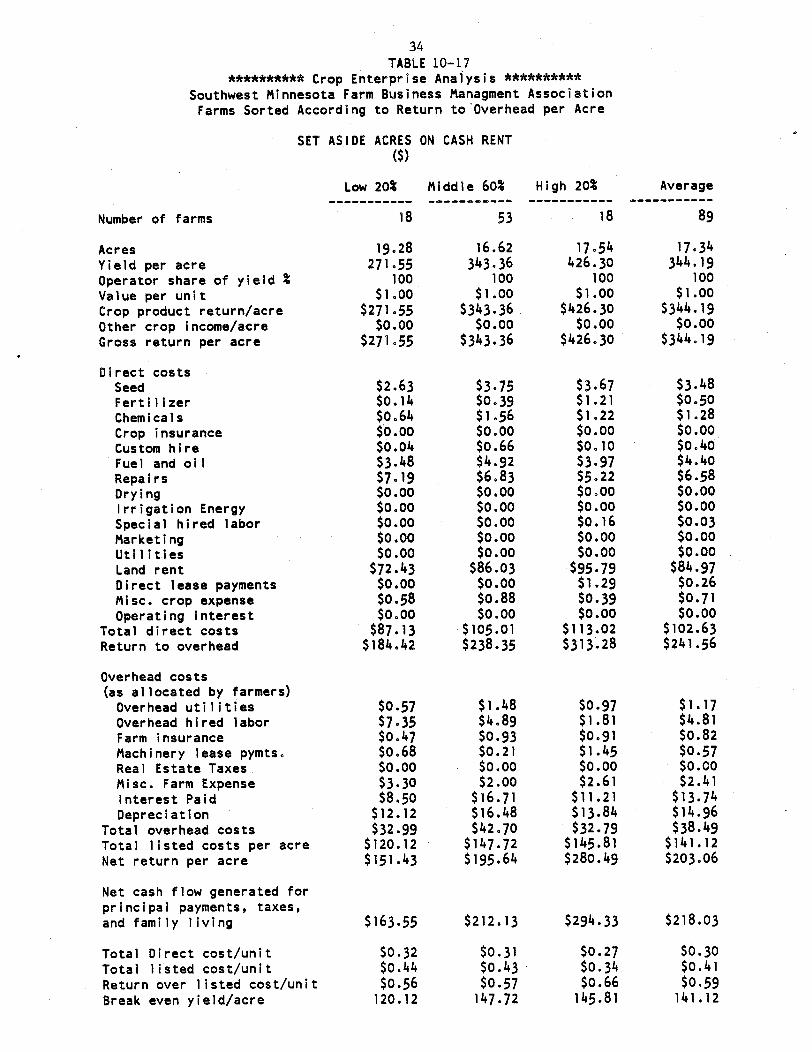
34TABLE 10-17
********** Crop Enterprise Analysis **********
Southwest Minnesota Farm Business Managment AssociationFarms Sorted According to Return to'Overhead per Acre
SET ASIDE ACRES ON CASH RENT($)
Low 20% Middle 60% High 20% Average
Number of farms 18 53 18 89
Acres 19.28 16.62 17.54 17.34Yield per acre 271.55 343.36 426.30 344.19Operator share of yield % 100 100 100 100Value per unit $1.00 $1.00 $1.00 $1.00
Crop product return/acre $271.55 $343.36 $426.30 $344.19Other crop income/acre $0.00 $0.00 $0.00 $0.00Gross return per acre $271.55 $343.36 $426.30 $344.19
Direct costsSeed $2.63 $3.75 $3.67 $3.48Fertilizer $0.14 $0.39 $1.21 $0.50Chemicals $0.64 $1.56 $1.22 $1.28Crop insurance $0.00 S O.00 $0.00 0.Custom hire $0.04 $0.66 $0.10 $0.40Fuel and oil $3.48 $4.92 $3.97 $4.40Repairs $7.19 $6.83 $5.22 $6.58Drying $0.00 $0.00 $0.00 $0.00Irrigation Energy $0.00 $0.00 $0.00 $0.00Special hired labor $0.00 $0.00 $0.16 $0.03Marketing $0.00 $0.00 $0.00 $0.00Utilities $0.00 $0.00 $0.00 $0.00Land rent $72.43 $86.03 $95.79 $84.97Direct lease payments $0.00 $0.00 $1.29 $0.26Misc. crop expense $0.58 $0.88 $0.39 $0.71Operating interest $0.00 $0.00 $0.00 $0.00
Total direct costs $87.13 $105.01 $113.02 $102.63Return to overhead $184.42 $238.35 $313.28 $241.56
Overhead costs(as allocated by farmers)Overhead utilities $0.57 $1.48 $0.97 $1.17Overhead hired labor $7.35 $4.89 $1.81 $4.81Farm insurance $0.47 $0.93 $0.91 $0.82Machinery lease pymts. $0.68 $0.21 $1.45 $0.57Real Estate Taxes $0.00 $0.00 $0.00 $0.00Misc. Farm Expense $3.30 $2.00 $2.61 $2.41Interest Paid $8.50 $16.71 $11.21 $13.74Depreciation $12.12 $16.48 $13.84 $14.96
Total overhead costs $32.99 $42.70 $32.79 $38.49Total listed costs per acre $120.12 $147.72 $145.81 $141.12Net return per acre $151.43 $195.64 $280.49 $203.06
Net cash flow generated forprincipal payments, taxes,and family living $163.55 $212.13 $294.33 $218.03
Total Direct cost/unit $0.32 $0.31 $0.27 $0.30Total listed cost/unit $0.44 $0.43 $0.34 $0.41Return over listed cost/unit $0.56 $0.57 $0.66 $0.59Break even yield/acre 120.12 147.72 145.81 141.12
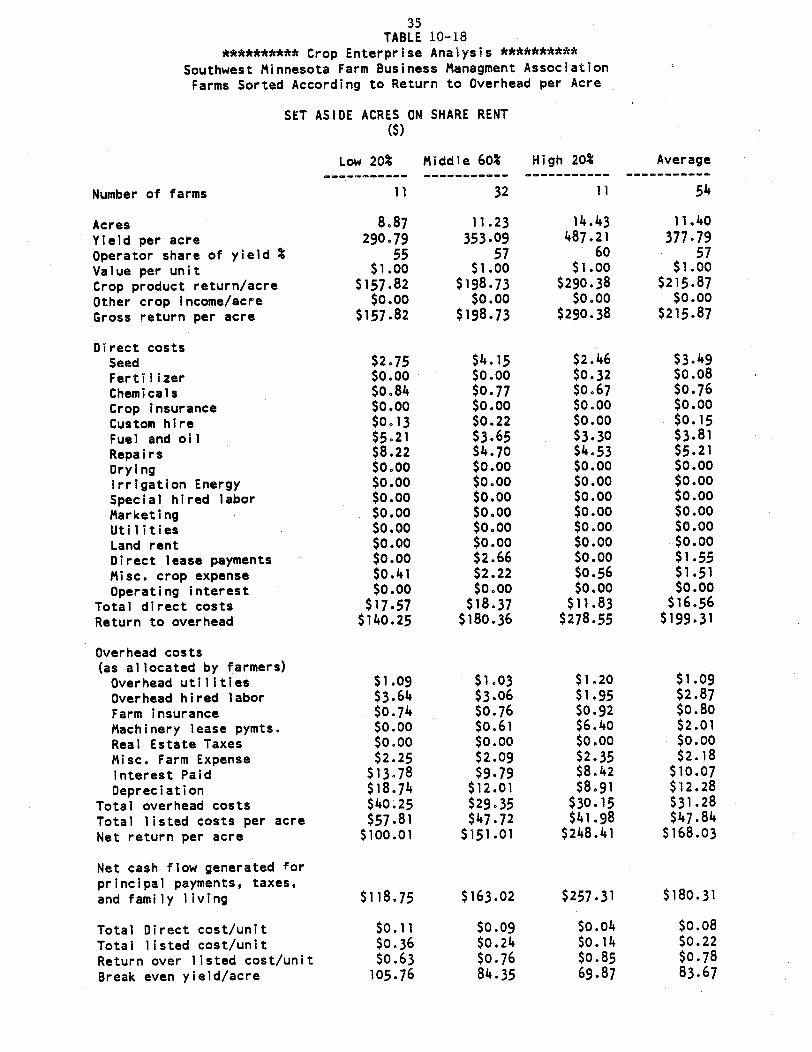
35TABLE 10-18
********** Crop Enterprise Analysis **********
Southwest Minnesota Farm Business Managment AssociationFarms Sorted According to Return to Overhead per Acre
SET ASIDE ACRES ON SHARE RENT($)
Low 20% Middle 60% High 20% Average
Number of farms 11 32 11 54
Acres 8.87 11.23 14.43 11.40Yield per acre 290.79 353.09 487.21 377.79Operator share of yield % 55 57 60 57Value per unit $1.00 $1.00 $1.00 $1.00
Crop product return/acre $157.82 $198.73 $290.38 $215.87Other crop income/acre $0.00 $0.00 $0.00 $0.00Gross return per acre $157.82 $198.73 $290.38 $215.87
Direct costsSeed $2.75 $4.15 $2.46 $3.49Fertilizer $0.00 $0.00 $0.32 $0.08Chemicals $0.84 $0.77 $0.67 $0.76Crop insurance $0.00 $0.00 $0.00 $0.00Custom hire $0.13 $0.22 $0.00 $0.15Fuel and oil $5.21 $3.65 $3.30 $3.81Repairs $8.22 $4.70 $4.53 $5.21Drying $0.00 $0.00 $0.00 $0.00Irrigation Energy $0.00 $0.00 $0.00 $0.00Special hired labor $0.00 $0.00 $0.00 $0.00Marketing $0.00 $0.00 $0.00 $0.00Utilities $0.00 $0.00 $0.00 $0.00Land rent $0.00 $0.00 $0.00 $0.00Direct lease payments $0.00 $2.66 $0.00 $1.55Misc. crop expense $0.41 $2.22 $0.56 $1.51Operating interest $0.00 $0.00 $0.00 $0.00
Total direct costs $17.57 $18.37 $11.83 $16.56Return to overhead $140.25 $180.36 $278.55 $199.31
Overhead costs(as allocated by farmers)Overhead utilities $1.09 $1.03 $1.20 $1.09Overhead hired labor $3.64 $3.06 $1.95 $2.87Farm insurance $0.74 $0.76 $0.92 $0.80Machinery lease pymts. $0.00 $0.61 $6.40 $2.01Real Estate Taxes $0.00 $0.00 $0.00 $0.00Misc. Farm Expense $2.25 $2.09 $2.35 $2.18Interest Paid $13.78 $9.79 $8.42 $10.07Depreciation $18.74 $12.01 $8.91 $12.28
Total overhead costs $40.25 $29.35 $30.15 $31.28Total listed costs per acre $57.81 $47.72 $41.98 $47.84Net return per acre $100.01 $151.01 $248.41 $168.03
Net cash flow generated forprincipal payments, taxes,and family living $118.75 $163.02 $257.31 $180.31
Total Direct cost/unit $0.11 $0.09 $0.04 $0.08Total listed cost/unit $0.36 $0.24 $0.14 $0.22Return over listed cost/unit $0.63 0.76 $0.85 $0.78
Break even yield/acre 105.76 84.35 69.87 83.67
36
EXPLANATORY NOTES FOR LIVESTOCK TABLES
Farms are divided into low 20% or high 20% on the basis of returns to over-head costs (return over direct costs), and the classification is done separatelyfor each livestock enterprise except dairy, where the "all dairy" table is thesum of the "dairy cows" and "other dairy" tables and the classification groupsare copied from the "dairy cows" table. (The "dairy cows" enterprise containsonly the milking herd.) Newborn calves are entered directly in the "other dairy"enterprise, not in the "dairy cows" enterprise.
The "Direct Cost" and "Allocated Overhead Costs" categories are identical forall livestock enterprises, but the top section (sources of returns) and thebottom section (other information) of the tables are different for each enter-prise. Definitions and allocations of individual cost items are the same forlivestock and crop enterprises. The bottom section of each livestock tablecontains both economic and technical efficiency measures, which are particularlyuseful to individual managers in assessing their performance as compared totheir peers.
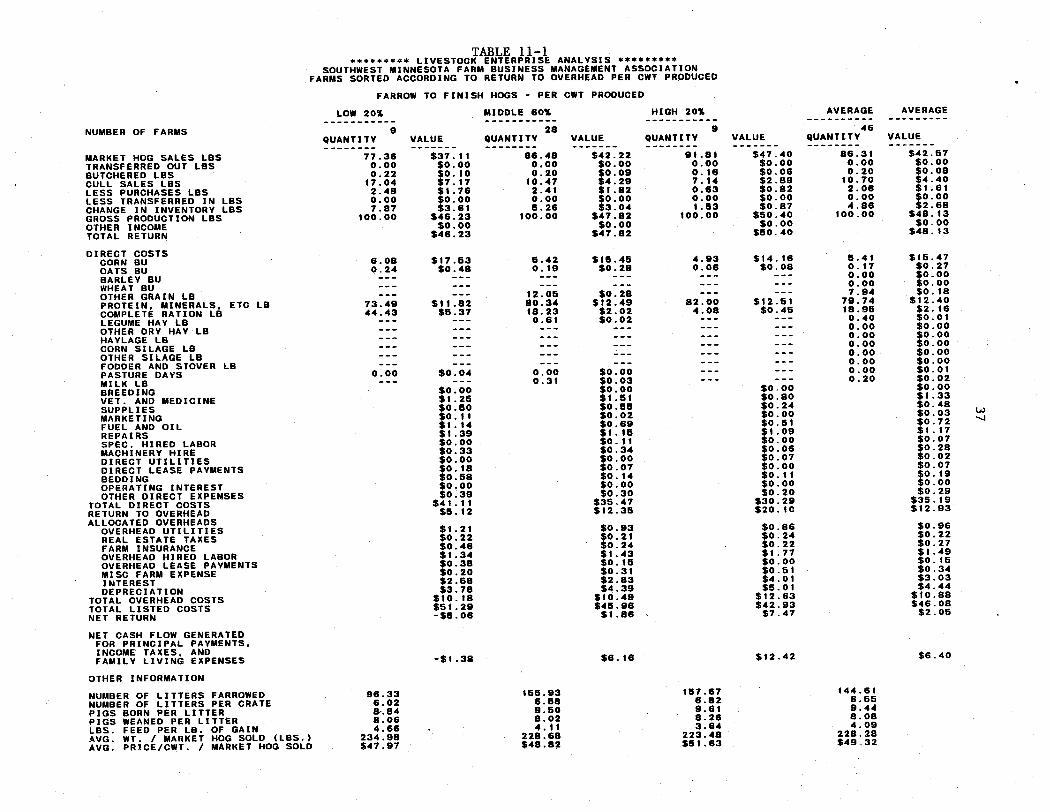
TABLE 11-1********* LIVESTOCK ENTERPRISE ANALYSIS *********
SOUTHWEST MINNESOTA FARM BUSINESS MANAGEMENT ASSOCIATIONFARMS SORTED ACCORDING TO RETURN TO OVERHEAD PER CWT PRODUCED
FARROW TO FINISH HOGS - PER CWT PRODUCED
NUMBER OF FARMS
MARKET HOG SALES LBSTRANSFERRED OUT LBSBUTCHERED LBSCULL SALES LBSLESS PURCHASES LBSLESS TRANSFERRED IN LBSCHANGE IN INVENTORY LBSGROSS PRODUCTION LBSOTHER INCOMETOTAL RETURN
DIRECT COSTSCORN BUOATS BUBARLEY BUWHEAT BUOTHER GRAIN LBPROTEIN, MINERALS, ETC LBCOMPLETE RATION LBLEGUME HAY LBOTHER DRY HAY LBHAYLAGE LBCORN SILAGE LBOTHER SILAGE LBFODDER AND STOVER LBPASTURE DAYSMILK LBBREEDINGVET. AND MEDICINESUPPLIESMARKETINGFUEL AND OILREPAIRSSPEC. HIRED LABORMACHINERY HIREDIRECT UTILITIESDIRECT LEASE PAYMENTSBEDDINGOPERATING INTERESTOTHER DIRECT EXPENSES
TOTAL DIRECT COSTSRETURN TO OVERHEADALLOCATED OVERHEADSOVERHEAD UTILITIESREAL ESTATE TAXESFARM INSURANCEOVERHEAD HIRED LABOROVERHEAD LEASE PAYMENTSMISC FARM EXPENSEINTERESTDEPRECIATION
TOTAL OVERHEAD COSTSTOTAL LISTED COSTSNET RETURN
NET CASH FLOW GENERATEDFOR PRINCIPAL PAYMENTS,INCOME TAXES, ANDFAMILY LIVING EXPENSES
OTHER INFORMATION
NUMBER OF LITTERS FARROWEDNUMBER OF LITTERS PER CRATEPIGS BORN PER LITTERPIGS WEANED PER LITTERLBS. FEED PER LB. OF GAINAVG. WT. / MARKET HOG SOLD (LBS.)AVG. PRICE/CWT. / MARKET HOG SOLD
LOW 20%
9QUANTITY
77.360.000.2217.042.490.007.87
100.00
6.080.24
73.4944.43
0.00
I---
96.336.028&.848.064.66
234.98$47.97
MIDDLE 60% HIGH 20% AVERAGE AVERAGE
28 9 46VALUE QUANTITY VALUE QUANTITY VALUE QUANTITY VALUE
$37.11 86.48 $42.22 91.81 $47.40 86.31 $42.57$0.00 0.00 $0.00 0.00 $0.00 0.00 $0.00
$0.10 0.20 $0.09 0.16 $0.06 0.20 $0.08$7.17 10.47 $4.29 7.14 $2.89 10.70 $4.40$1.76 2.41 $1.82 0.63 $0.82 2.06 $1.61$0.00 0.00 $0.00 0.00 $0.00 0.00 $0.00
$3.61 5.26 $3.04 1.53 $0.87 4.86 $2.68$46.23 100.00 $47.82 100.00 $50.40 100.00 $48.13$.00 $0.00 $0.00 $0o.00
$46.23 $47.82 $50.40 $48.13
$17.63$0.48
$11.82$5.37
$0.04
$0.00$1.25$0o.50$0. 11$1.14$1.39$0.00$0.33$0.00$0.18$0.58$0.00$0.39
$41.11$5.12
$1.21$0.22$0.46$1.34$0.38$0.20$2.68$3.78
$10.18$51.29-$5.06
-$1.38
5.420.19
12.0580.3418.230.61
0.000.31
16655.936.589.508.024.11
228.68$48.82
$15.45$0.29
$0.28$12.49$2.02$0.02
$0.00$0.03$0.00$1.51$0.55So.oo$0.02$0.691. 15
$0.o11$0.34$0.00$0.07$0.14$0.00$0.30
$36547$12.36
$0.93$0.21$0.24$1.43$0.15$0.31$2.83$4.39
$10.49$45.96$1.86
$6.16
4.930.06
82.004.08
_ _
_ ___ _
_ _
$14.16$0.08$o.o8
$0.80$0.24$0.00$0.51$1.09$0.00$0.06$0.07$0.00$0. 11
$0.00$0.20
$30.29$20.10
$0.86$0.24$0.22$1.77$0.00$0.61$4.01$5.01
$12.63$42.93$7.47
$12.42
157.676.829.618.263.64
223.48$51.63
5.410.170.000.007.94
79.7418.95
0.400.000.000.000.000.000.000.20
$15.47$0.27$o.00$0.00$0.18
S12.40$2.16$0.01$0.00$0.00$0.00$0.00$0.00$0.01$0.02$0.00$1.33$0.48$0.03$0.72$1.17$0.07$0.28$0.02$0.07$0.19$o.oo$0.29
$35.19$12.93
$0.96$0.22$0.27$1.49$0.15$0.34$3.03$4.44
$10.88$46.08$2.05
$6.40
144.616.659.448.084.09
228.28$49.32
LU.-J
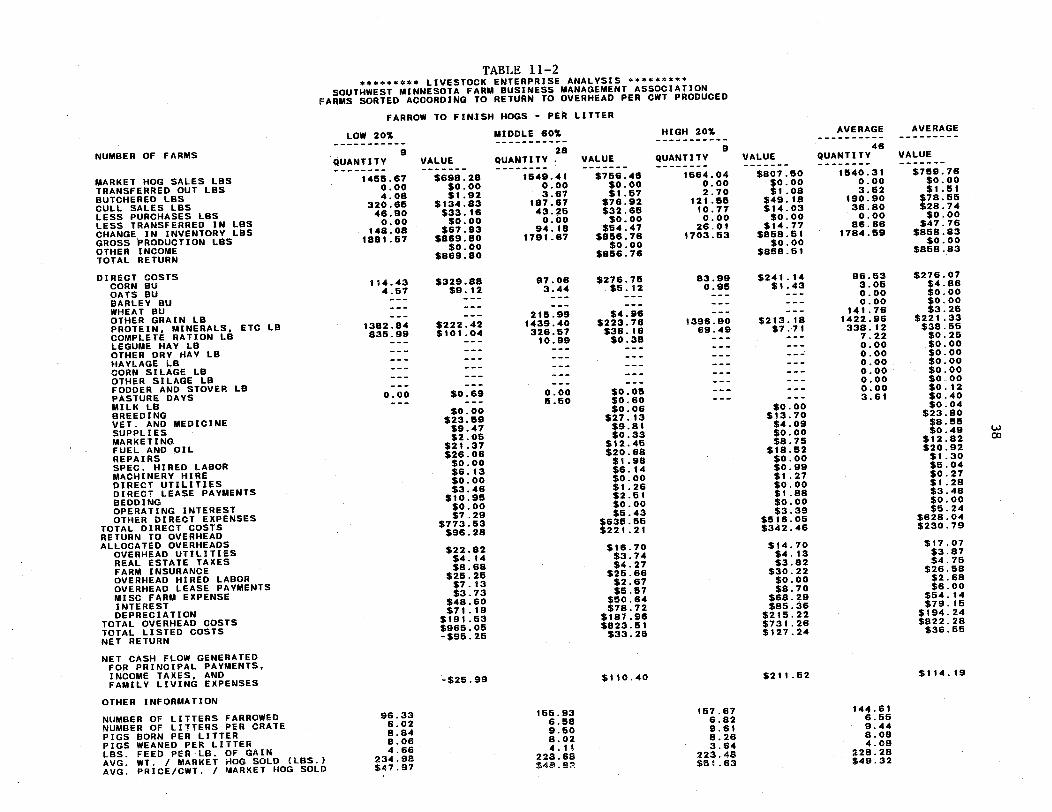
TABLE 11-2********* LIVESTOCK ENTERPRISE ANALYSIS *********
SOUTHWEST MINNESOTA FARM BUSINESS MANAGEMENT ASSOCIATIONFARMS SORTED ACCORDING TO RETURN TO OVERHEAD PER CWT PRODUCED
FARROW TO FINISH HOGS - PER LITTER
NUMBER OF FARMS
MARKET HOG SALES LBSTRANSFERRED OUT LBSBUTCHERED LBSCULL SALES LBSLESS PURCHASES LBSLESS TRANSFERRED IN LBSCHANGE IN INVENTORY LBSGROSS PRODUCTION LBSOTHER INCOMETOTAL RETURN
DIRECT COSTSCORN BUOATS BUBARLEY BUWHEAT BUOTHER GRAIN LBPROTEIN, MINERALS, ETC LBCOMPLETE RATION LBLEGUME HAY LBOTHER DRY HAY LBHAYLAGE LBCORN SILAGE LBOTHER SILAGE LBFODDER AND STOVER LBPASTURE DAYSMILK LBBREEDINGVET. AND MEDICINESUPPLIESMARKETINGFUEL AND OILREPAIRSSPEC. HIRED LABORMACHINERY HIREDIRECT UTILITIESDIRECT LEASE PAYMENTSBEDDINGOPERATING INTERESTOTHER DIRECT EXPENSES
TOTAL DIRECT COSTSRETURN TO OVERHEADALLOCATED OVERHEADSOVERHEAD UTILITIESREAL ESTATE TAXESFARM INSURANCEOVERHEAD HIRED LABOROVERHEAD LEASE PAYMENTSMISC FARM EXPENSEINTERESTDEPRECIATION
TOTAL OVERHEAD COSTSTOTAL LISTED COSTSNET RETURN
NET CASH FLOW GENERATEDFOR PRINCIPAL PAYMENTS,INCOME TAXES, ANDFAMILY LIVING EXPENSES
OTHER INFORMATION
NUMBER OF LITTERS FARROWEDNUMBER OF LITTERS PER CRATEPIGS BORN PER LITTERPIGS WEANED PER LITTERLBS. FEED PER LB. OF GAINAVG. WT. / MARKET HOG SOLD (LBS.)AVG. PRICE/CWT. / MARKET HOG SOLD
LOW 20%
9QUANTITY
1455.670.004.08
320.6646.90
0.00148.08
1881.57
114.434.57
1382.84835.99
0.00
_ _
96.336.028.848.064.66
234.98$47.97
MIDDLE 60%
28VALUE QUANTITY . VALUE
$698.28 1549.41 $756.45$0.00 0.00 $0.00
$1.92 3.67 $1.57$134.83 187.67 $76.92$33.16 43.25 $32.65$0.00 0.00 $0.00
$67.93 94.18 $54.47$869.80 1791.67 $856.76
$0.00 $0.00$869.80 $856.76
$329.88$9.12
$222.42$101.04
$0.69
$0.00$23.59$9.47$2.05
$21.37$26.06$0.oo$6.13$0.00$3.46
$10.95$0.00$7.29
$773.63$96.28
$22.82$4.14$8.68
$25.25$7.13$3.73
$48.60$71.19
$191.53$965.05-$96.25
-$25.99
97.063.44
216.991439.40326.57
10.99
0.006.50
155.936.589.508.024.11
228.68$84.®32
$276.75$5.12
$4.96$223.76$36.16$0.38
$0.05$0.60$0.06
$27.13$9.81$0.33
$12.45$20.68$1.98$6.14$0.00$1.26$2.51$0.00$5.43
$635.56$221.21
$16.70$3.74$4.27
$25.66$2.67$5.67
$50.64$78.72
$187.96$823.51$33.25
HIGH 20%
9QUANTITY
1564.040.002.70
121.5510.77
0.0026.01
1703.63
83.990.96
1396.9069.49
_ _
_ _
_ _
_ _
_ _
_ _
$110.40
167.676.829.618.263.64
223.48$51.63
AVERAGE
VALUE
$769.76$0.00$1.51
$78.55$28.74$0.00
$47.76$858.83
$0.00$858.83
AVERAGE
46QUANTITY
1540.310.003.62
190.9036.80
0.0086.66
1784.59
96.533.050.000.00
141.761422.96338.12
7.220.000.000.000.000.000.003.61
VALUE
$807.50$0.00$1.08
$49.18$14.03$0.00
$14.77$858.51
$0.00$858.51
$241.14$1 .43
$213.18$7.71
$0.00$13.70$4.09$0.00$8.75
$18.52$0.00$0.99$1.27$0.00$1.88$0.00$3.39
$516.05$342.46
$14.70$4.13$3.82
$30.22$0.00$8.70
$68.29$85.36
$215.22$731.26$127.24
$211.62
00
$276.07$4.86$0.00$0.00$3.25
$221.33$38.55$0.25$0.00$0.00$0.00$0.00$0.00$0.12$0.40$0.04
$23.80$8.55$0.49
$12.82$20.92$1.30$5.04$0.27$1.28$3.48$0.00$5.24
$628.04$230.79
$17.07$3.87$4.75
$26.58$2.68$6.00
$54.14$79.15
$194.24$822.28$36.55
$114.19
144.616.559.448.084.09
228.28$49.32
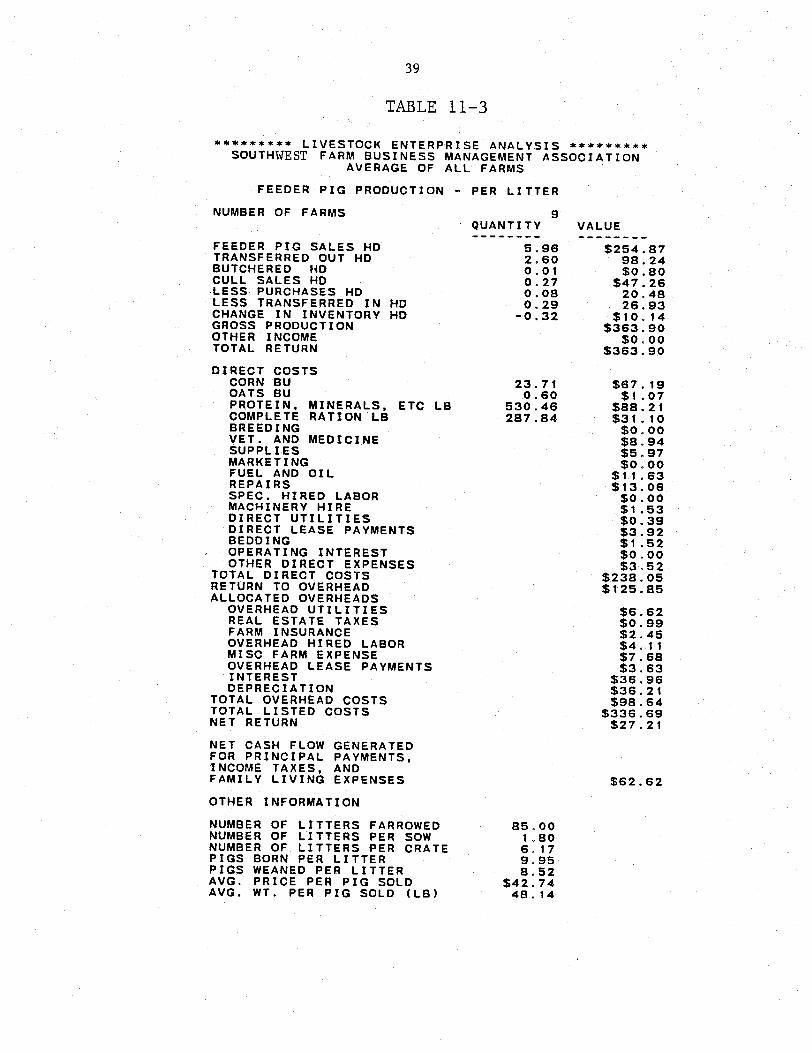
39
TABLE 11-3
********* LIVESTOCK ENTERPRISE ANALYSIS *********SOUTHWEST FARM BUSINESS MANAGEMENT ASSOCIATION
AVERAGE OF ALL FARMS
FEEDER PIG PRODUCTION - PER LITTER
NUMBER OF FARMS 9
FEEDER PIG SALES HDTRANSFERRED OUT HDBUTCHERED HDCULL SALES HDLESS PURCHASES HDLESS TRANSFERRED IN HDCHANGE IN INVENTORY HDGROSS PRODUCTIONOTHER INCOMETOTAL RETURN
DIRECT COSTSCORN BUOATS BUPROTEIN, MINERALS, ETC LBCOMPLETE RATION LBBREEDINGVET. AND MEDICINESUPPLIESMARKETINGFUEL AND OILREPAIRSSPEC. HIRED LABORMACHINERY HIREDIRECT UTILITIESDIRECT LEASE PAYMENTSBEDDINGOPERATING INTERESTOTHER DIRECT EXPENSES
TOTAL DIRECT COSTSRETURN TO OVERHEADALLOCATED OVERHEADSOVERHEAD UTILITIESREAL ESTATE TAXESFARM INSURANCEOVERHEAD HIRED LABORMISC FARM EXPENSEOVERHEAD LEASE PAYMENTSINTERESTDEPRECIATION
TOTAL OVERHEAD COSTSTOTAL LISTED COSTSNET RETURN
NET CASH FLOW GENERATEDFOR PRINCIPAL PAYMENTS,INCOME TAXES, ANDFAMILY LIVING EXPENSES
OTHER INFORMATION
NUMBER OF LITTERS FARROWEDNUMBER OF LITTERS PER SOWNUMBER OF LITTERS PER CRATEPIGS BORN PER LITTERPIGS WEANED PER LITTERAVG. PRICE PER PIG SOLDAVG. WT. PER PIG SOLD (LB)
QUANTITY
5.962.600.010,270. 080.29-0.32
23. 710.60
530.46287.84
VALUE
$254.8798. 24$0.80
$47.2620. 4826.93
$10.14$363.90
$0.00$363.90
$67. 19$1.07
$88.21$31.10$0.00$8.94$5.97$0.00
$11.63$13.06$0.00$1.53$0.39$3.92$1 .52$0.00$3.52
$238.05$125.85
$6.62$0.99$2.45$4.11$7.68$3.63
$36.96$36.21$98.64
$336.69$27.21
$62.62
85. 001 o.806. 179.958.52
$42.7448. 14
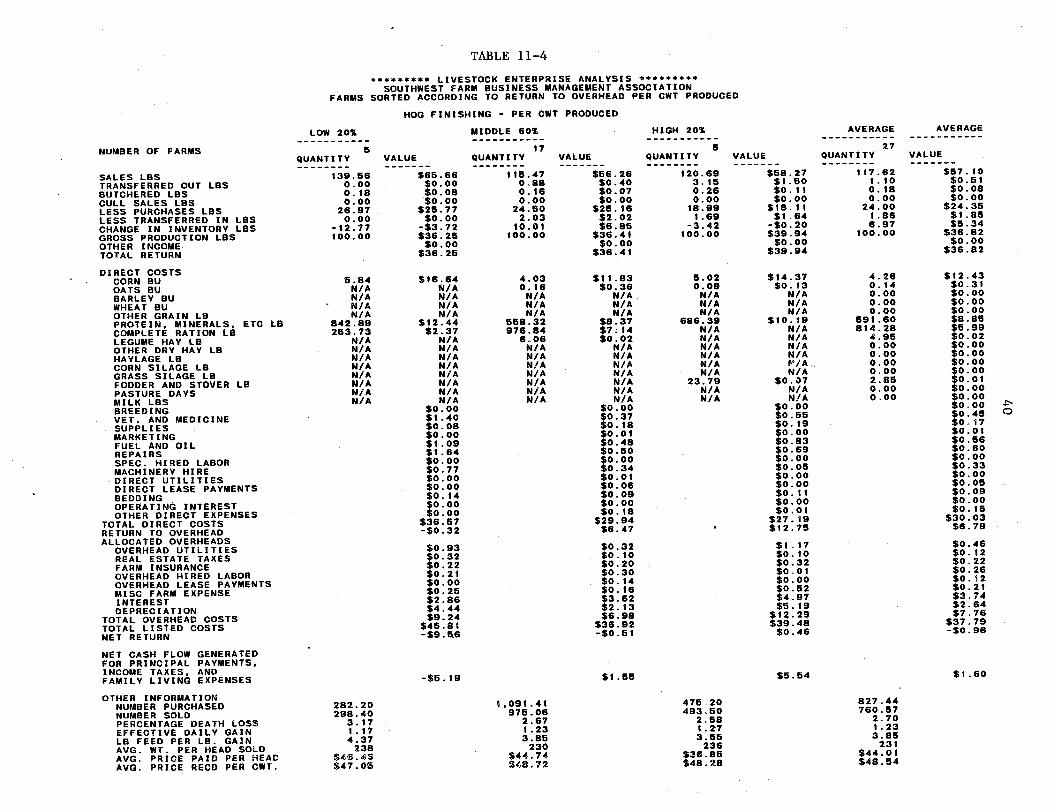
TABLE 11-4
********* LIVESTOCK ENTERPRISE ANALYSIS *********SOUTHWEST FARM BUSINESS MANAGEMENT ASSOCIATION
FARMS SORTED ACCORDING TO RETURN TO OVERHEAD PER CWT PRODUCED
HOG FINISHING - PER CWT PRODUCED
NUMBER OF FARMS
SALES LBSTRANSFERRED OUT LBSBUTCHERED LBSCULL SALES LBSLESS PURCHASES LBSLESS TRANSFERRED IN LBSCHANGE IN INVENTORY LBSGROSS PRODUCTION LBSOTHER INCOMETOTAL RETURN
DIRECT COSTSCORN BUOATS BUBARLEY BUWHEAT BUOTHER GRAIN LBPROTEIN, MINERALS, ETC LBCOMPLETE RATION LBLEGUME HAY LBOTHER DRY HAY LBHAYLAGE LBCORN SILAGE LBGRASS SILAGE LBFODDER AND STOVER LBPASTURE DAYSMILK LBSBREEDINGVET. AND MEDICINESUPPLIESMARKETINGFUEL AND OILREPAIRSSPEC. HIRED LABORMACHINERY HIREDIRECT UTILITIESDIRECT LEASE PAYMENTSBEDDINGOPERATING INTERESTOTHER DIRECT EXPENSES
TOTAL DIRECT COSTSRETURN TO OVERHEADALLOCATED OVERHEADSOVERHEAD UTILITIESREAL ESTATE TAXESFARM INSURANCEOVERHEAD HIRED LABOROVERHEAD LEASE PAYMENTSMISC FARM EXPENSEINTERESTDEPRECIATION
TOTAL OVERHEAD COSTSTOTAL LIStED COSTSNET RETURN
NET CASH FLOW GENERATEDFOR PRINCIPAL PAYMENTS,INCOME TAXES, ANDFAMILY LIVING EXPENSES
OTHER INFORMATIONNUMBER PURCHASEDNUMBER SOLDPERCENTAGE DEATH LOSSEFFECTIVE DAILY GAINLB FEED PER LB. GAINAVG. WT. PER HEAD SOLDAVG. PRICE PAID PER HEADAVG. PRICE RECD PER CWT.
LOW 20%
5QUANTITY
139.660.000.180.00
26.970.00
-12.77100.00
5.84N/AN/AN/AN/A
842.89253.73
N/AN/AN/AN/AN/AN/AN/AN/A
282.20298.40
3.171.174.37
238$46.46$47 .0
VALUE
$65.66$0.00So.oo$0.08$0.00
$26.77$0.00
-$3.72$36.25$0.00
$36.26
$16.64N/AN/AN/AN/A
$12.44$2.37
N/AN/AN/AN/AN/AN/AN/AN/A
$0.00$1.40$0.08$0.00$1.09$1.64$0.00$0.77$o.oo$0.00$0.14$0.00$0.00
$36.57-$0.32
$0.93$0.32$0.22$0.21$0.00$0.25$2.86$4.44$9.24
$45.81-$9.5.6
-$5.19
MIDDLE 60%
17QUANTITY
115.470.880.160.00
24.502.03
10.01100.00
4.030.16
N/AN/AN/A
558.32976.84
6.06N/AN/AN/AN/AN/AN/AN/A
1,091.41976.06
2.671.233.86
230$44.74$48.72
VALUE
$56.26$0.40$0.07$0.00
$25.16$2.02$6.85
$36.41$0.00
$36.41
$11.83$0.36
N/AN/AN/A
$8.37$7.14$0.02
N/AN/AN/AN/AN/AN/AN/A
$0.00$0.37$0.18$0.01$0.48$0.50$o.oo$0.34$0.01$0.06$0.09$0.oo$0.18
$29.94$6.47
$0.32So.10$0.20$0.30$0.14$0.16$3.62$2.13$6.98
$36.92-$0.51
$1.55
HIGH 20%
5QUANTITY VALUE
120.69 $68.273.15 $1.500.26 $0.110.00 $0.0018.99 $18.111.69 $1.64
-3.42 -$0.20100.00 $39.94
$0.00$39.94
5.020.09N/AN/AN/A
686.39N/AN/AN/AN/AN/AN/A
23.79N/AN/A
$14.37$0.13
N/AN/AN/A
$10.19N/AN/AN/AN/A'/AN/A
$0.07N/AN/A
$0.00$0.56$0. 19$0.00$0.83$0.69$0.oo$0.05
.00oo
.00oo$o. 11$0.00$0.01
$27. 19$12.75
$1.17$0.10$0.32$0.01
.00oo$0.52$4.97$5.19
$12.29$39.48$0.46
$5.54
475.20493.560
2.581 .273.66
236$36.85$48.28
AVERAGE
27QUANTITY
117.621.100.180.00
24.001.866.97
100.00
4.260.140.000.000.00
691.60814.28
4.950.000.000.000.002.850.000.00
AVERAGE
VALUE
$67.10$0.51$0.08$0.00
$24.35$1.85$5.34
$36.82$0.00
$36.82
$12.43
$0.00
$o.00$o.oo
$8.85$5.99$0.02$0.00$0.00$o.oo$0.00$0.00$0.01$0.00$0.00$0.00$0.45$0.17$0.01$0.56$0.60$0.00$0.33$0.00$0.05$0.09$0.00$0. 15
$30.03$6.79
$0.46$0.12$0. 22$0.26$0.12$0.21$3 74$2.64$7.76
$37.79-$0.96
$1.60
827.44760.57
2.701.233.85231
$44.01$48.54
p.0
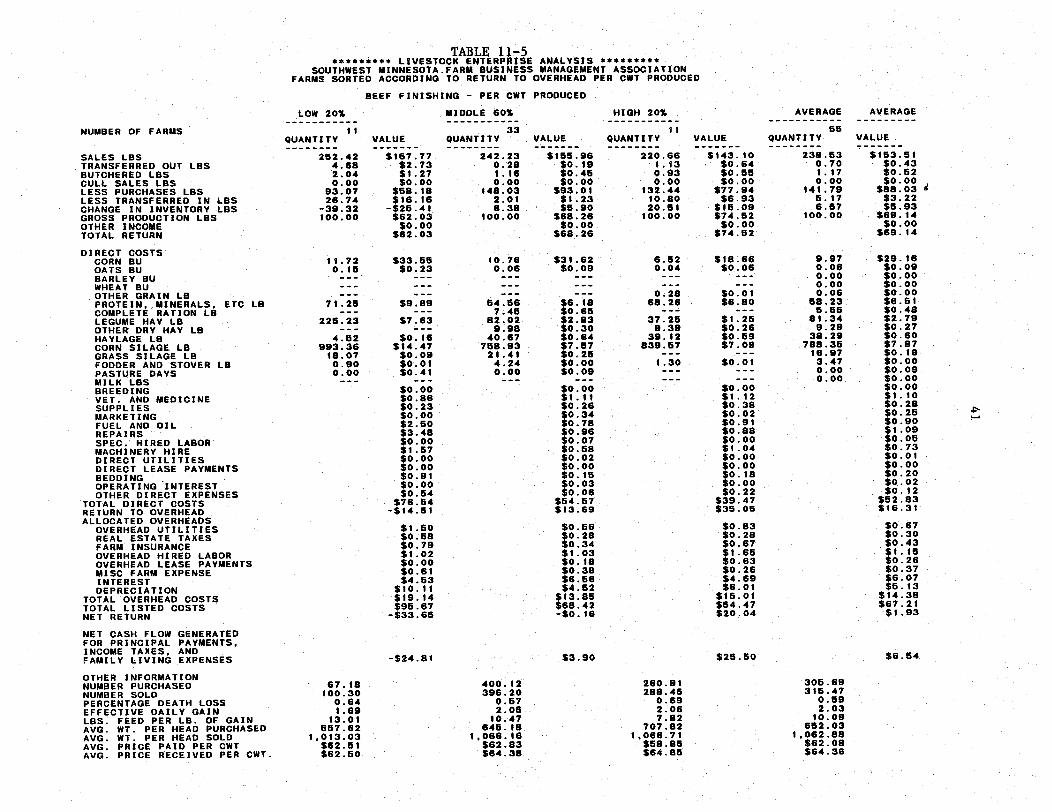
TABLE 11-5********* LIVESTOCK ENTERPRISE ANALYSIS *********
SOUTHWEST MINNESOTA.FARM BUSINESS MANAGEMENT ASSOCIATIONFARMS SORTED ACCORDING TO RETURN TO OVERHEAD PER CWT PRODUCED
BEEF FINISHING - PER CWT PRODUCED
NUMBER OF FARMS
SALES LBSTRANSFERRED OUT LBSBUTCHERED LBSCULL SALES LBSLESS PURCHASES LBSLESS TRANSFERRED IN LBSCHANGE IN INVENTORY LBSGROSS PRODUCTION LBSOTHER INCOMETOTAL RETURN
DIRECT COSTSCORN BUOATS BUBARLEY BUWHEAT BUOTHER GRAIN LBPROTEIN, MINERALS, ETC LBCOMPLETE RATION LBLEGUME HAY LBOTHER DRY HAY LBHAYLAGE LBCORN SILAGE LBGRASS SILAGE LBFODDER AND STOVER LBPASTURE DAYSMILK LBSBREEDINGVET. AND MEDICINESUPPLIESMARKETINGFUEL AND OILREPAIRSSPEC. HIRED LABORMACHINERY HIREDIRECT UTILITIESDIRECT LEASE PAYMENTSBEDDINGOPERATING INTERESTOTHER DIRECT EXPENSES
TOTAL DIRECT COSTSRETURN TO OVERHEADALLOCATED OVERHEADSOVERHEAD UTILITIESREAL ESTATE TAXESFARM INSURANCEOVERHEAD HIRED LABOROVERHEAD LEASE PAYMENTSMISC FARM EXPENSEINTERESTDEPRECIATION
TOTAL OVERHEAD COSTSTOTAL LISTED COSTSNET RETURN
NET CASH FLOW GENERATEDFOR PRINCIPAL PAYMENTS,INCOME TAXES, ANDFAMILY LIVING EXPENSES
OTHER INFORMATIONNUMBER PURCHASEDNUMBER SOLDPERCENTAGE DEATH LOSSEFFECTIVE DAILY GAINLBS. FEED PER LB. OF GAINAVG. WT. PER HEAD PURCHASEDAVG. WT. PER HEAD SOLDAVG. PRICE PAID PER CWTAVG. PRICE RECEIVED PER CWT.
LOW 20%
11QUANTITY
252.424.682.040.00
93.0726.74
-39.32100.00
11.720.15
71.26
226.23
4.52993.3618.07
0.900.00
_ _
67.18100.300.641.69
13.01557.62
1,013.03$62.51$62.60
MIDDLE 60% HIGH 20%
33 11VALUE QUANTITY VALUE QUANTITY VALUE
$167.77 242.23 $165.96 220.66 $143.10$2.73 0.28 $0.19 1.13 $0.64$1.27 1.16 $0.45 0.93 $0.55$o.00 0.00 $0.00 0.00 $ .00
$58.18 148.03 $93.01 132.44 $77.94$16.16 2.01 $1.23 10.80 $6.93-$26 .41 6.38 $.90 20.51 $15.09$62.03 100.00 $68.26 100.00 $74.52$0.00 $0.00 $0.00
$62.03 $68..26 $74.62
$33.55$0.23
$9.89
$7.63
$0. 16$14.47$0.09$0.01$0.41
$0.00$0.86$0.23$0.00$2.60$3.48$0.00$1.57$0.00$0.00$0.91$0.00$0.54
$76.54-$14.51
$1.50$0.68$0.79$1.02$0.00$0.61$4.53
$10.11$19.14$95.67
-$33.66
-$24.81
10.760.06
64.667.45
82.029.98
40.67758.9321.414.240.00
_ _
400.12396.20
0.672.0510.47
645.181,066.16$62.83$64.38
$31.62$0.09
$6.18$0.65$2.83$0.30$0.64$7.57$0.26$0.00$0.09
$0.00$1 . 11$0.26$0.34$0.78$0.96$0.07$0.58$0.02$0.00
o. 15$0.03$0.06
$54.57$13.69
$0.66$0.28$0.34$1.03$0.18$0.38$6.66$4.62
$13.85$68.42-$0.16
$3.90
6.620.04
0.2868.26
37.259.39
39.12839.57
1.30_ _
_-_-
$18.66$0.06
$0.01$6.80
$1.25$0.26$0.69$7.09
$0.01
$0.00$1.12$0.38$0.02$0.91$0.88$0.00$1.04$0.00$0.00$0.18$0.00$0.22
$39.47$35.05
$0.83$0.28$0.67$1.65$0.63$0.26$4.69$6.01
$15.01$54.47$20.04
AVERAGE
66QUANTITY
238.630.701.170.00
141.795.176.57
100.00
9.970.060.000.000.06
68.235.66
81.349.29
38.29788.3516.973.470.000.00
$25.50
260.91288.45
0.692.067.82
707.821,066.71$58.85$64085
AVERAGE
VALUE
$153.51$0.43$0.52$0.00
$88.03 d$3.22$5.93
$69.14$0.00
$69.14
$29.16$0.09$0.00$0.00$0.00$6.61$0.48$2.79$0.27$0.60$7.87$0.19$0.00$0.09$0.00$0.00$1.10$0.28$0.25$0.90$1.09$0.05$0.73$0.01$0.00$0.20$0.02$0. 12
$52.83$16.31
$0.67$0.30$0.43$1. 15$0.26$0.37$6.07$5.13
$14.38$67.21$1.93
$6.54
305.69315.47
0.592.0310.09
652.031,062.88$62.08$64.36
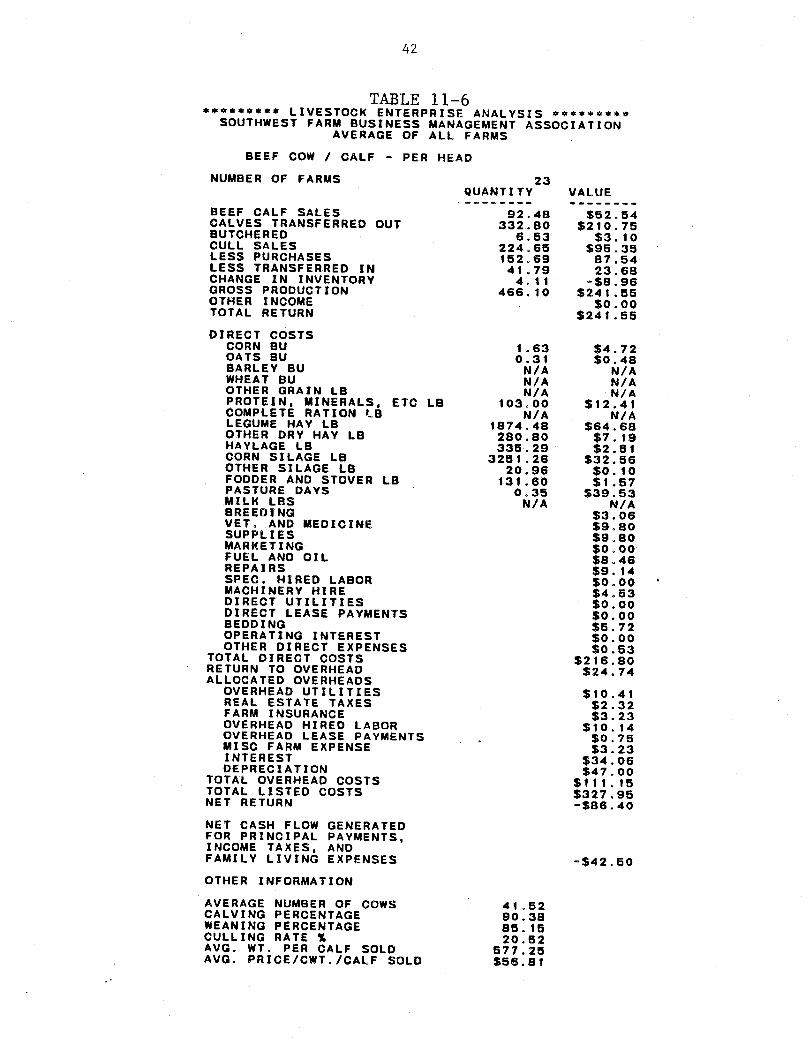
42
TABLE 11-6********* LIVESTOCK ENTERPRISE ANALYSIS *********
SOUTHWEST FARM BUSINESS MANAGEMENT ASSOCIATIONAVERAGE OF ALL FARMS
BEEF COW / CALF - PER HEAD
NUMBER OF FARMS 23
BEEF CALF SALESCALVES TRANSFERRED OUTBUTCHEREDCULL SALESLESS PURCHASESLESS TRANSFERRED INCHANGE IN INVENTORYGROSS PRODUCTIONOTHER INCOMETOTAL RETURN
DIRECT COSTSCORN BUOATS BUBARLEY BUWHEAT BUOTHER GRAIN LBPROTEIN, MINERALS, ETC LBCOMPLETE RATION LBLEGUME HAY LBOTHER DRY HAY LBHAYLAGE LBCORN SILAGE LBOTHER SILAGE LBFODDER AND STOVER LBPASTURE DAYSMILK LBSBREEDINGVET. AND MEDICINESUPPLIESMARKETINGFUEL AND OILREPAIRSSPEC. HIRED LABORMACHINERY HIREDIRECT UTILITIESDIRECT LEASE PAYMENTSBEDDINGOPERATING INTERESTOTHER DIRECT EXPENSES
TOTAL DIRECT COSTSRETURN TO OVERHEADALLOCATED OVERHEADS
OVERHEAD UTILITIESREAL ESTATE TAXESFARM INSURANCEOVERHEAD HIRED LABOROVERHEAD LEASE PAYMENTSMISC FARM EXPENSEINTERESTDEPRECIATION
TOTAL OVERHEAD COSTSTOTAL LISTED COSTSNET RETURN
NET CASH FLOW GENERATEDFOR PRINCIPAL PAYMENTS,INCOME TAXES, ANDFAMILY LIVING EXPENSES
OTHER INFORMATION
AVERAGE NUMBER OF COWSCALVING PERCENTAGEWEANING PERCENTAGECULLING RATE %AVG. WT. PER CALF SOLDAVG. PRICE/CWT./CALF SOLD
QUANTITY
92.48332.80
6.53224.65152.6941.79
4 11466. 10
1 .630.31
N/AN/AN/A
103.00N/A
1874.48280.80335.29
3251 .2620.96
131.600.35
N/A
VALUE
$52.54$210.75
$3.10$95 . 3587.5423.68
-$8.96$241.55
$0o.oo$241.55
$4.72$0.48
N/AN/AN/A
$12.41N/A
$64.68$7.19$2.51
$32.56$o.10$1.57
$39.53N/A
$3.06$9.80$9.80$0.00$8.46$9.14$0.oo$4.53$0.00$0.00$5.72$0.00$0.53
$216.80$24.74
$10.41$2.32$3.23
$10.14$0.75$3.23
$34.06$47.00
$111.15$327.95-$86.40
-$42.50
41 .5290.3885. 1520.52
577. 25$56.81
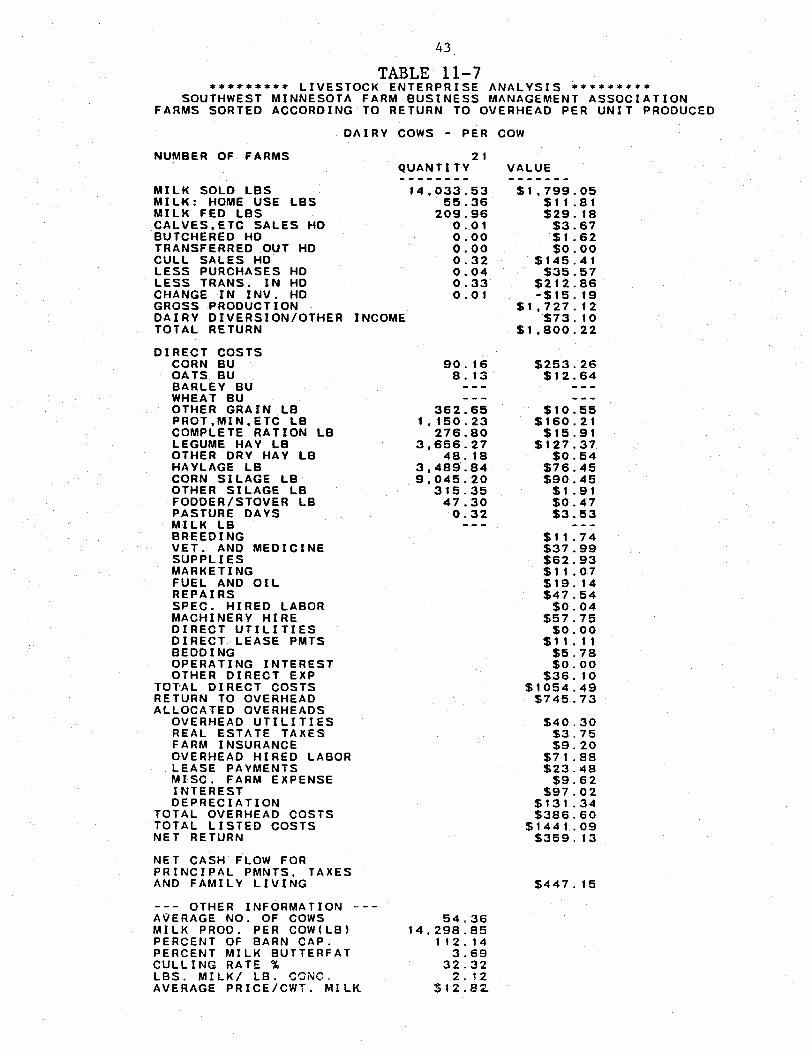
43
TABLE 11-7**** **** LIVESTOCK ENTERPRISE ANALYSIS *********
SOUTHWEST MINNESOTA FARM BUSINESS MANAGEMENT ASSOCIATIONFARMS SORTED ACCORDING TO RETURN TO OVERHEAD PER UNIT PRODUCED
DAIRY COWS - PER COW
NUMBER OF FARMSQt
MILK SOLD LBSMILK: HOME USE LBSMILK FED LBSCALVES,ETC SALES HDBUTCHERED HDTRANSFERRED OUT HDCULL SALES HDLESS PURCHASES HDLESS TRANS. IN HDCHANGE IN INV. HDGROSS PRODUCTIONDAIRY DIVERSION/OTHER INCOMETOTAL RETURN
DIRECT COSTSCORN BUOATS BUBARLEY BUWHEAT BUOTHER GRAIN LBPROT,MIN,ETC LBCOMPLETE RATION LBLEGUME HAY LBOTHER DRY HAY LBHAYLAGE LBCORN SILAGE LBOTHER SILAGE LBFODDER/STOVER LBPASTURE DAYSMILK LBBREEDINGVET. AND MEDICINESUPPLIESMARKETINGFUEL AND OILREPAIRSSPEC. HIRED LABORMACHINERY HIREDIRECT UTILITIESDIRECT LEASE PMTSBEDDINGOPERATING INTERESTOTHER DIRECT EXP
TOTAL DIRECT COSTSRETURN TO OVERHEADALLOCATED OVERHEADS
OVERHEAD UTILITIESREAL ESTATE TAXESFARM INSURANCEOVERHEAD HIRED LABORLEASE PAYMENTSMISC. FARM EXPENSEINTERESTDEPRECIATION
TOTAL OVERHEAD COSTSTOTAL LISTED COSTSNET RETURN
21UANTITY
14,033.5355 .36
209.960.010.000. 000.320.040 .330.01
90. 168.13
362.651,150.23
276.803,656.27
48. 183,489.849,045.20
315.3547.300.32
VALUE
$1,799.05$11.81$29. 18$3.67$1.62$0.00
$145 .41$35 .57
$212.86-$15.19
$1,727.12$73. 10
$1,800.22
$253.26$12.64
$10.55$160.21$15.91
$127.37$0.54
$76.45$90.45$1.91$0.47$3.53
$11.74$37.99$62.93$11.07$19.14$47.54$0. 04
$57 .75$0 . 00
$11.11$5 .78$0. 00
$36.10$1054 .49
$745.73
$40.30$3. 75$9. 20
$71 .88$23 .48$9.62
$97. 02$131.34$386.60
$1441.09$359. 13
NET CASH FLOW FORPRINCIPAL PMNTS, TAXESAND FAMILY LIVING
--- OTHER INFORMATION ---AVERAGE NO. OF COWSMILK PROD. PER COW(LB)PERCENT OF BARN CAP.PERCENT MILK BUTTERFATCULLING RATE %LBS. MILK/ LB. CCNC.AVERAGE PRICE/CWT. MILK
54 .3614, 298.85
112.143.69
32.322.12
1 2. 8 2
$447. 15
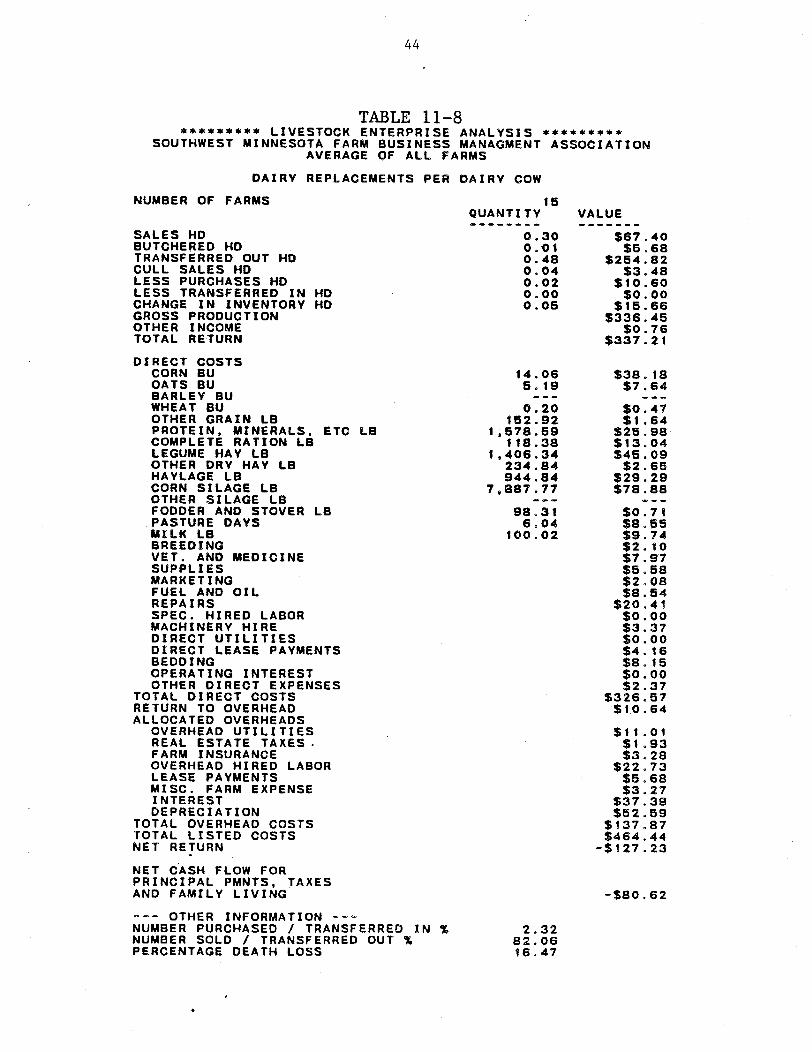
44
TABLE 11-8********* LIVESTOCK ENTERPRISE ANALYSIS *********
SOUTHWEST MINNESOTA FARM BUSINESS MANAGMENT ASSOCIATIONAVERAGE OF ALL FARMS
DAIRY REPLACEMENTS PER DAIRY COW
NUMBER OF FARMS
SALES HDBUTCHERED HDTRANSFERRED OUT HDCULL SALES HDLESS PURCHASES HDLESS TRANSFERRED IN HDCHANGE IN INVENTORY HDGROSS PRODUCTIONOTHER INCOMETOTAL RETURN
15QUANTITY
0.300.010.480.040.020.000.05
VALUE
$67.40$5.68
$254.82$3.48
$10.60$0.00
$15.66$336.45
$0.76$337.21
DIRECT COSTSCORN BUOATS BUBARLEY BUWHEAT BUOTHER GRAIN LBPROTEIN, MINERALS, ETC LBCOMPLETE RATION LBLEGUME HAY LBOTHER DRY HAY LBHAYLAGE LBCORN SILAGE LBOTHER SILAGE LBFODDER AND STOVER LBPASTURE DAYSMILK LBBREEDINGVET. AND MEDICINESUPPLIESMARKETINGFUEL AND OILREPAIRSSPEC. HIRED LABORMACHINERY HIREDIRECT UTILITIESDIRECT LEASE PAYMENTSBEDDINGOPERATING INTERESTOTHER DIRECT EXPENSES
TOTAL DIRECT COSTSRETURN TO OVERHEADALLOCATED OVERHEADS
OVERHEAD UTILITIESREAL ESTATE TAXES.FARM INSURANCEOVERHEAD HIRED LABORLEASE PAYMENTSMISC. FARM EXPENSEINTERESTDEPRECIATION
TOTAL OVERHEAD COSTSTOTAL LISTED COSTSNET RETURN
NET CASH FLOW FORPRINCIPAL PMNTS, TAXESAND FAMILY LIVING
--- OTHER INFORMATION ---NUMBER PURCHASED / TRANSFERRED IN %NUMBER SOLD / TRANSFERRED OUT %PERCENTAGE DEATH LOSS
14.065. 19
0.20152.92
1,578.59118.38
1,406.34234.84944.84
7,887.77
98.316.04
100.02
$38 18$7.64
$0.47$1.64
$25 .98$13.04$45.09$2.65
$29.29$78.88
$0.71$8 55$9.74$2. 10$7.97$5 58$2 08$8.54
$20.41$0.00$3.37$0.00$4.16$8.15$0.00$2.37
$326.57$10.64
$11 01$1.93$3 28
$22 73$5 68$3. 27
$37.39$52.59
$137.87$464. 44-$127 .23
-$80.62
2.3282.0616.47
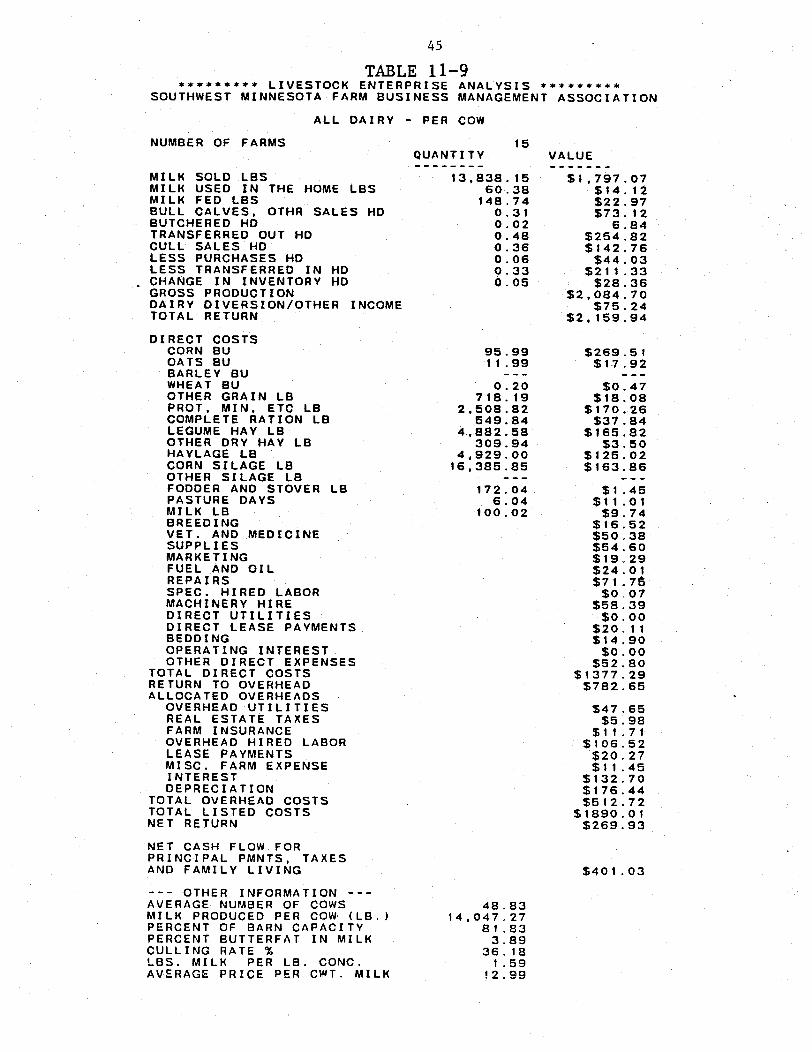
45
TABLE 11-9********* LIVESTOCK ENTERPRISE ANALYSIS *********
SOUTHWEST MINNESOTA FARM BUSINESS MANAGEMENT ASSOCIATION
ALL DAIRY - PER COW
NUMBER OF FARMS
MILK SOLD LBSMILK USED IN THE HOME LBSMILK FED LBSBULL CALVES, OTHR SALES HDBUTCHERED HDTRANSFERRED OUT HDCULL SALES HDLESS PURCHASES HDLESS TRANSFERRED IN HDCHANGE IN INVENTORY HDGROSS PRODUCTIONDAIRY DIVERSION/OTHER INCOMETOTAL RETURN
DIRECT COSTSCORN BUOATS BUBARLEY BUWHEAT BUOTHER GRAIN LBPROT, MIN, ETC LBCOMPLETE RATION LBLEGUME HAY LBOTHER DRY HAY LBHAYLAGE LBCORN SILAGE LBOTHER SILAGE LBFODDER AND STOVER LBPASTURE DAYSMILK LBBREEDINGVET. AND MEDICINESUPPLIESMARKETINGFUEL AND OILREPAIRSSPEC. HIRED LABORMACHINERY HIREDIRECT UTILITIESDIRECT LEASE PAYMENTSBEDDINGOPERATING INTERESTOTHER DIRECT EXPENSES
TOTAL DIRECT COSTSRETURN TO OVERHEADALLOCATED OVERHEADS
OVERHEAD UTILITIESREAL ESTATE TAXESFARM INSURANCEOVERHEAD HIRED LABORLEASE PAYMENTSMISC. FARM EXPENSEINTERESTDEPRECIATION
TOTAL OVERHEAD COSTSTOTAL LISTED COSTSNET RETURN
15QUANTITY
13,838. 1560.38
148.740.310.020.480.360.060.330. 05
95.9911 .99
0.20718.19
2,508.82549.84
4,882.58309.94
4,929. 0016,385.85
172.046.04
100.02
VALUE
$1,797.07$14.12$22.97$73. 12
6 .84$254.82$142.76$44.03
$211 . 33$28.36
$2,084.70$75.24
$2, 159.94
$269 .5 1$17.92
$0.47$18.08
$170.26$37.84
$165.82$3.50
$125.02$163.86
$1 .45$11.01$9. 74
$16.52$50.38$54.60$19.29$24.01$71 .76$0. 07
$58.39$0. 00
$20. 11$14.90$0.00
$52.80$1377.29$782.65
$47 .65$5. 98
$11.71$106.52$20.27$11.45
$132.70$176.44$512.72
$1890. 01$269.93
NET CASH FLOW FORPRINCIPAL PMNTS, TAXESAND FAMILY LIVING $401.03
--- OTHER INFORMATION ---AVERAGE NUMBER OF COWSMILK PRODUCED PER COW (LB.)PERCENT OF BARN CAPACITYPERCENT BUTTERFAT IN MILKCULLING RATE %LBS. MILK PER LB. CONC.AVERAGE PRICE PER CWT. MILK
48.8314,047.27
81 .833.89
36. 181 .59
12.99
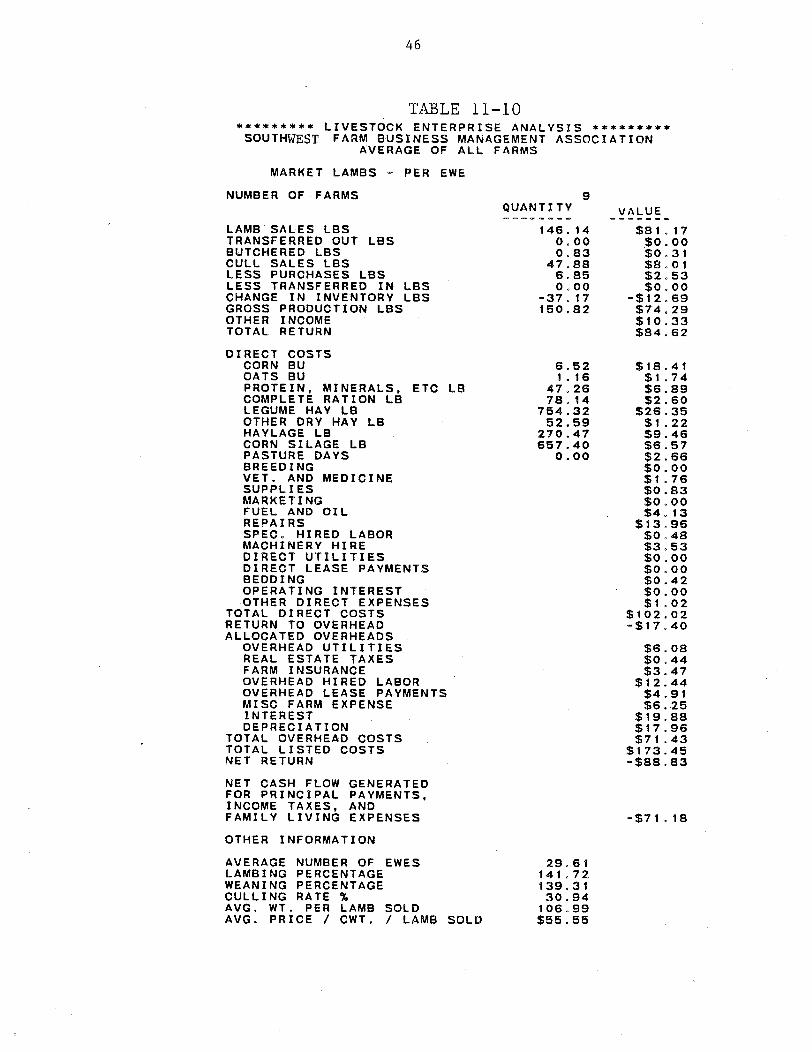
46
TABLE 11-10********* LIVESTOCK ENTERPRISE ANALYSIS ********
SOUTHWEST FARM BUSINESS MANAGEMENT ASSOCIATIONAVERAGE OF ALL FARMS
MARKET LAMBS - PER EWE
NUMBER OF FARMS 9QUANTITY VALUE
LAMB SALES LBS 146.14 $81.17TRANSFERRED OUT LBS 0.00 $0.00BUTCHERED LBS 0.83 $0.31CULL SALES LBS 47.88 $8.01LESS PURCHASES LBS 6.85 $2.53LESS TRANSFERRED IN LBS 0.00 $0.00CHANGE IN INVENTORY LBS -37.17 -$12.69GROSS PRODUCTION LBS 150.82 $74.29OTHER INCOME $10.33TOTAL RETURN $84.62
DIRECT COSTSCORN BU 6,52 $18.41OATS BU 1.16 $1.74PROTEIN, MINERALS, ETC LB 47o26 $6.89COMPLETE RATION LB 78.14 $2.60LEGUME HAY LB 754.32 $26.35OTHER DRY HAY LB 52.59 $1.22HAYLAGE LB 270.47 $9.46CORN SILAGE LB 657.40 $6.57PASTURE DAYS 0.00 $2.66BREEDING $0.00VET. AND MEDICINE $1.76SUPPLIES $0.83MARKETING $0.00FUEL AND OIL $4o13REPAIRS $13.96SPECo HIRED LABOR $0.48MACHINERY HIRE $3.53DIRECT UTILITIES $0.00DIRECT LEASE PAYMENTS $0.00BEDDING $0.42OPERATING INTEREST $0.00OTHER DIRECT EXPENSES $1.02
TOTAL DIRECT COSTS $102.02RETURN TO OVERHEAD -$17.40ALLOCATED OVERHEADS
OVERHEAD UTILITIES $6.08REAL ESTATE TAXES $0.44FARM INSURANCE $3.47OVERHEAD HIRED LABOR $12.44OVERHEAD LEASE PAYMENTS $4.91MISC FARM EXPENSE $6.25INTEREST $19.88DEPRECIATION $17.96
TOTAL OVERHEAD COSTS $71.43TOTAL LISTED COSTS $173.45NET RETURN -$88.83
NET CASH FLOW GENERATEDFOR PRINCIPAL PAYMENTS,INCOME TAXES, ANDFAMILY LIVING EXPENSES -$71.18
OTHER INFORMATION
AVERAGE NUMBER OF EWES 29.61LAMBING PERCENTAGE 141.72WEANING PERCENTAGE 139.31CULLING RATE % 30.94AVG. WT. PER LAMB SOLD 106.99AVG. PRICE / CWT. / LAMB SOLD $55.55
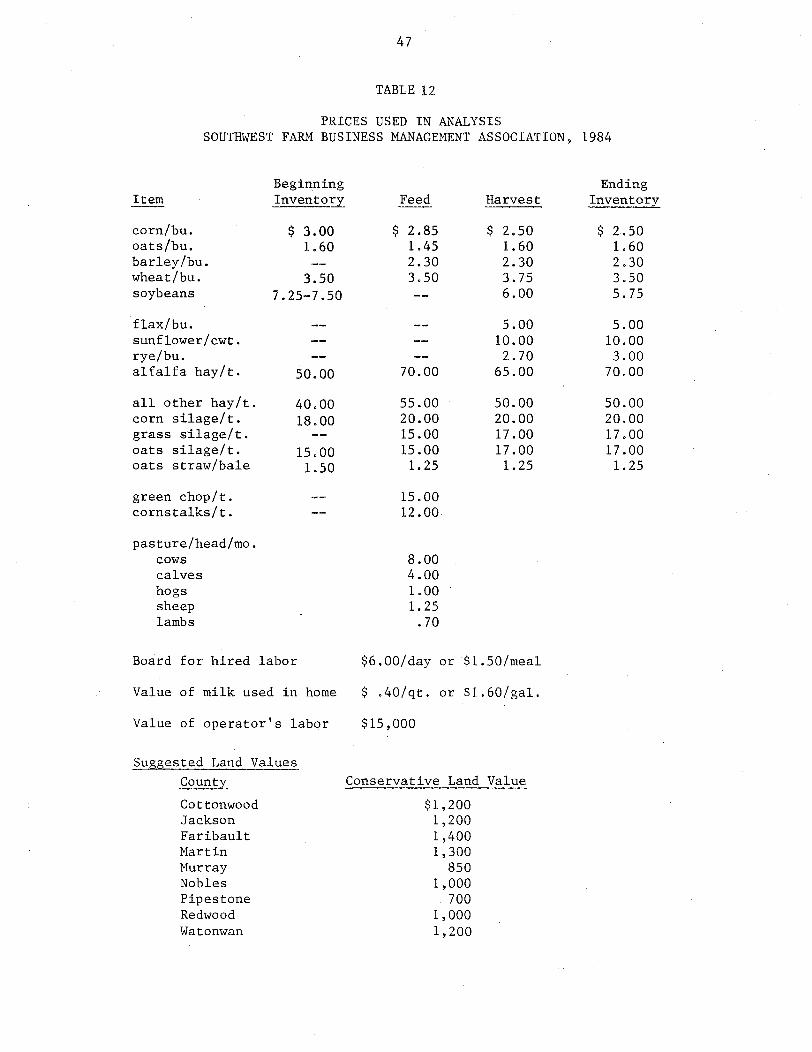
47
TABLE 12
PRICES USED IN ANALYSISSOUTHWEST FARM BUSINESS MANAGEMENT ASSOCIATION,
BeginningItem Inventory
corn/bu.oats/bu.barley/bu.wheat/bu.soybeans
flax/bu.sunflower/cwt.rye/bu.alfalfa hay/t.
all other hay/t.corn silage/t.grass silage/t.oats silage/t.oats straw/bale
$ 3.001.60
3.507.25-7.50
50.00
40.0018.00
15.001.50
green chop/t.cornstalks/t.
pasture/head/mo.cows
calveshogssheeplambs
Feed
$ 2.851.452.303.50
70.00
55.0020.0015.0015.001.25
Harvest
$ 2.501.602.303.756.00
5.0010.002.70
65.00
50.0020.0017.0017.001.25
15.0012.00
8.004.001.001.25.70
Board for hired labor
Value of milk used in home
Value of operator's labor
Suggested Land Values
County
CottonwoodJacksonFaribaultMartinMurrayNoblesPipestoneRedwoodWatonwan
$6.00/day or $1.50/meal
$ .40/qt. or $1.60/gal.
$15,000
Conservative Land Value
$1,2001,2001,4001,300
8501,000
7001,0001,200
1984
EndingInventory
$ 2.501.602.303.505.75
5.0010.003.00
70.00
50.0020.0017.0017.001.25
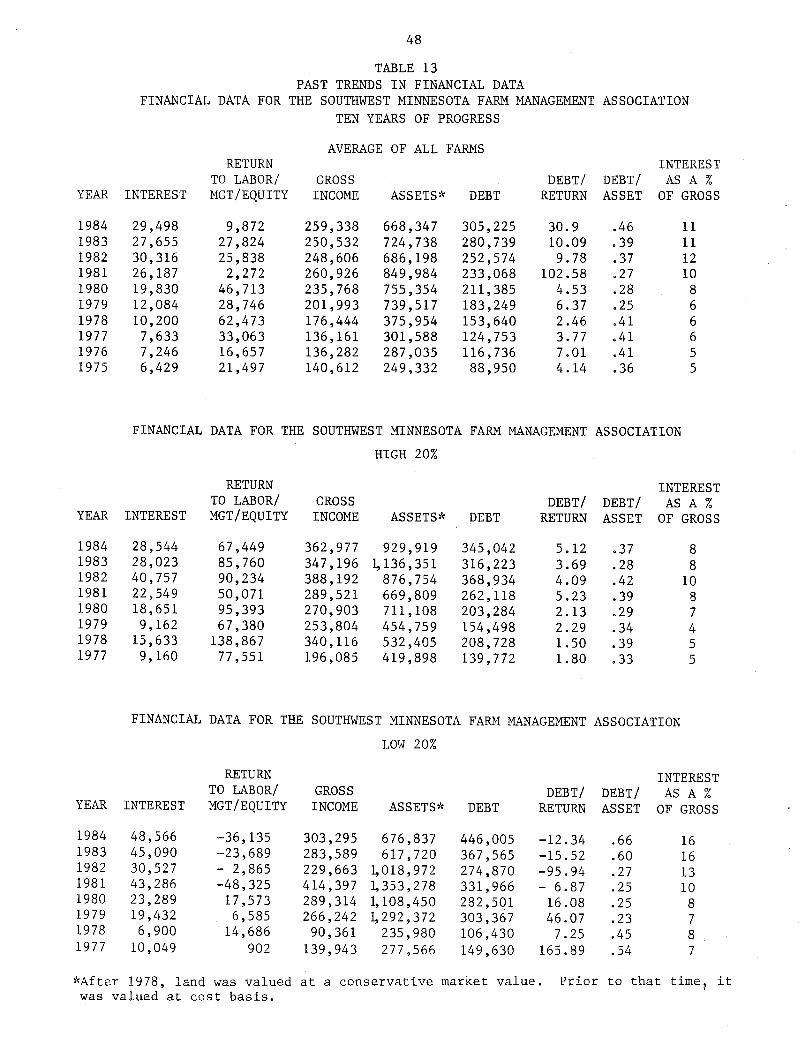
48
TABLE 13PAST TRENDS IN FINANCIAL DATA
FINANCIAL DATA FOR THE SOUTHWEST MINNESOTA FARM MANAGEMENT ASSOCIATIONTEN YEARS OF PROGRESS
RETURNTO LABOR/
YEAR INTEREST MGT/EQUITY
1984198319821981198019791978197719761975
29,49827,65530,31626,18719,83012,08410,2007,6337,2466,429
9,87227,82425,8382,272
46,71328,74662,47333,06316,65721,497
AVERAGE OF ALL FARMS
GROSSINCOME
259,338250,532248,606260,926235,768201,993176,444136,161136,282140,612
ASSETS* DEBT
668,347724,738686,198849,984755,354739,517375,954301,588287,035249,332
305,225280,739252,574233,068211,385183,249153,640124,753116,73688,950
INTERESTDEBT/ DEBT/ AS A %
RETURN ASSET OF GROSS
30.910.099.78
102.584.536.372.463.777.014.14
.46
.39
.37
.27
.28
.25
.41
.41
.41
.36
11111210
866655
FINANCIAL DATA FOR THE SOUTHWEST MINNESOTA FARM MANAGEMENT ASSOCIATION
HIGH 20%
YEAR INTEREST
19841983198219811980197919781977
28,54428,02340,75722,54918,6519,16215,6339,160
RETURNTO LABOR/MGT/EQUITY
67,44985,76090,23450,07195,39367,380138,86777,551
GROSSINCOME
362,977347,196388,192289,521270,903253,804340,116196,085
ASSETS* DEBT
929,9191136,351876,754669,809711,108454,759532,405419,898
345,042316,223368,934262,118203,284154,498208,728139,772
INTERESTDEBT/ DEBT/ AS A %
RETURN ASSET OF GROSS
5.123.694.095.232.132.291.501.80
.37
.28
.42
.39
.29
.34
.39
.33
88
1087455
FINANCIAL DATA FOR THE SOUTHWEST MINNESOTA FARM MANAGEMENT ASSOCIATION
LOW 20%
RETURNTO LABOR/
YEAR INTEREST MGT/EQUITY
19841983198219811980197919781977
48,56645,09030,52743,28623,28919,4326,90010,049
-36,135-23,689- 2,865-48,32517,5736,585
14,686902
GROSSINCOME
303,295283,589229,663414,397289,314266,24290,361
139,943
ASSETS* DEBT
676,837617,720
1,018,9721,353,2781,108,4501292,372235,980277,566
446,005367,565274,870331,966282,501303,367106,430149,630
INTERESTDEBT/ DEBT/ AS A %
RETURN ASSET OF GROSS
-12.34-15.52-95.94- 6.8716.0846.077.25
165.89
.66
.60
.27
.25
.25
.23
.45
.54
161613108787
*After 1978, land was valued at a conservative market value, Prior to that time, itwas valued at cost basis.