SOUTHWEST FLORIDA STAKEHOLDER · PDF fileSOUTHWEST FLORIDA . STAKEHOLDER WORKSHOP . ......
169
November 2, 2012 Southwest Florida Regional Planning Council SOUTHWEST FLORIDA STAKEHOLDER WORKSHOP
Transcript of SOUTHWEST FLORIDA STAKEHOLDER · PDF fileSOUTHWEST FLORIDA . STAKEHOLDER WORKSHOP . ......

November 2, 2012 Southwest Florida Regional Planning Council
SOUTHWEST FLORIDA STAKEHOLDER WORKSHOP

Regional Planning Councils • Intergovernmental Solutions • Regional Planning • Technical Assistance • Economic Development • Emergency Management

PROGRAMS AND PROJECTS
3
CHARLOTTE HARBOR NATIONAL ESTUARY PROGRAM
• Water Conservation, Important Cost Savings Strategy
• Water Quality Protection, Important to Tourism & Development Economy
• Ecosystem Services
COMPREHENSIVE ECONOMIC DEVELOPMENT STRATEGY
• Strategic Economic Development Plans for Southwest Florida Development District
• Vital Projects • Technical Assistance
• New Infrastructure of the 21st Century
• Job Creation & Regional Competitiveness
• Connecting Communities
GEOGRAPHIC INFORMATION SERVICES
•Data Clearinghouse •Demographics • Spatial Analytics •Database Management •Geo Statistics •Graphics Design
EMERGENCY MANAGEMENT
•Evacuation Study/Planning •Hazardous Materials
Compliance/Training • LEPC Coordination •Public Safety Analysis •Homeland Security •Emergency Response
Coordination
PROJECTS IN GRANTS
•Brownfields Program •Energy Resiliency Study •Transportation
Disadvantaged (Glades & Hendry)
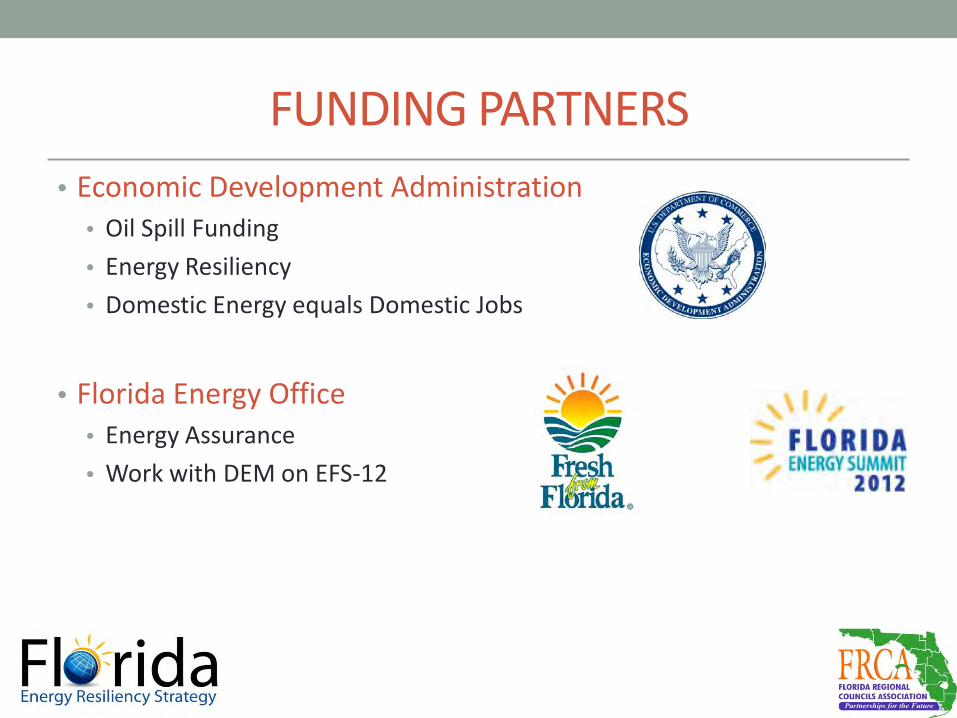
FUNDING PARTNERS • Economic Development Administration
• Oil Spill Funding • Energy Resiliency • Domestic Energy equals Domestic Jobs
• Florida Energy Office
• Energy Assurance • Work with DEM on EFS-12

WORKSHOP FORMAT • Presentation
• Project Scope and Purpose • Survey Results • Energy Experts • Scenario Modeling Results
• Stakeholder Participation • Breakout Groups • Report Outs • Audience Response System
• Some representative questions from the survey(s) to compare and discuss. • Bonus Session – Broadband Planning and Strategies

ENERGY PLANNING AREAS
1 2
3
4 5
1 2 3 4 5

WORKSHOP SCHEDULE • August 13 – Gainesville • August 29 – Jacksonville • October 23- Delray Beach (postponed) • October 29 – Pinellas Park • October 30 – Bartow • November 1 – Ocala • November 2 – Fort Myers, 10:00am to 2:00pm, SWFRPC • November 7 - Orlando • November 14 – Panama City

OBJECTIVES OF THE STUDY • Energy Resiliency Strategies
• Diversification of energy source • Reduce reliance on foreign imports • Increase use of domestic sources • Job creation from domestic energy usage
• Alternatives, renewable, local sources traditional sources
• Outcomes • Findings and recommendations
• Useful information so policymakers can make decisions • Customized by EPA when applicable
• Stakeholder input • Surveys and Workshops

EXPECTED OUTCOMES • Useful information so policymakers can make decisions
• Behavioral • Survey results
• Scientific telephone poll • Web based survey
• Customized by EPA when applicable • Economic Analyses
• What are the economic benefits of different alternative energy scenarios? • What is the pay back period for investments?
• What we are not doing • Promoting one energy source over another • Not judging the viability of one alternative source over another

Nov 2011 March 2013
Task
s Wor
ked
On
Five EPAs 11 RPCs
Findings and
Recommendations
Surveys Scenario Modeling
Stakeholders
BASIC PROCESS OVERVIEW

Phillip Downs, Ph.D. Kerr & Downs Research
Tallahassee, FL 32308 850.906.3111
ENERGY SURVEY Florida Regional Councils Association

This study examines individuals’ reactions to a broad range of energy issues including conservation, investment in energy saving devices, motivations for conserving energy, impact of energy cost increases on lifestyle, and government policies affecting energy. Methodology • Population definition
• All households in the following areas: EPA 1, EPA 2, EPA 3, EPA 4, & EPA 5 • Person most knowledgeable about energy issues
• Sampling frame • All working cellular and landline telephone numbers
• Sample size • 750 in total study • 150 in EPA 1 • 150 in EPA 2 • 150 in EPA 3 • 150 in EPA 4 – Southwest Florida + Central Florida • 150 in EPA 5
• Sampling error (given a 95% confidence interval) • 3.6% points in total study • 8.0% points for each EPA
• Data collection • Telephone interviews conducted from Kerr & Downs Research's office using CATI system • Conducted in May & June 2012
PURPOSE OF THE SURVEY

How long would the payback period from energy savings have to be for you to invest $500 in window tinting?
9%
17%
19%
1%
29%
25%
Less than 1 year
1 year to less than 2 years
2 to 5 years
6+ years
Would not purchase
Not sure
Mean: 22 months Median: 1 year

Motivations for using alternative energy or renewable sources:
80%
65%
53%
47%
45%
85%
77%
64%
61%
66%
0% 10% 20% 30% 40% 50% 60% 70% 80% 90%
Reduced energy costs
Environmental concerns
Price discounts on products
Rebates
Tax incentives
Business Resident
ENERGY POLICY

There should be more focus on domestic energy sources and less focus on foreign energy sources.
33%
55%
4%
2%
0%
5%
Strongly agree
Agree
Neither agree nor disagree
Disagree
Strongly disagree
Not sure

Presentations

Outlook for Federal & State Energy Policy
Presented at The Energy Workshop of the Southwest Florida Regional Planning Council
Fort Myers, Florida November 2, 2012
1

About Us Abraham & Roetzel is a joint venture of
The Abraham Group (energy consulting firm) &
Roetzel & Andress (law firm).
Our offices are located in Washington DC & Harrisburg, Pennsylvania.
Roetzel & Andress has offices in
Florida, Ohio, DC, Illinois & New York.
2

Outline
• Macro Trends and Game Changers in Energy Landscape
• Current Big Issues in Washington • Energy & Environment Policies of Obama vs.
Romney • Potential Policy Path Regardless of Outcome • Florida
3

Natural Gas
• Unconventional Shale Gas in Pennsylvania, Ohio & Texas
• US proven natural gas reserves surpassed 300 trillion cubic feet (Tcf) in 2010; technically recoverable nat gas is estimated at 2,203 Tcf according to EIA
• Good News – clean energy, lower prices, lower electricity rates, more manufacturing jobs in plastics, fertilizer & chemicals
• Bad News – hurts renewables, coal & nuclear; more regulation on the way
4

Unconventional Oil
Quick: What country will overtake Russia and Saudi Arabia to become the world’s leading oil producer in just a couple of years?
5

Saudi America • Now it is clear, the US has more spare capacity in
development than anyone else on the earth. It will soon be the US again, and not OPEC, that is the world’s swing producer.
• DOE forecasts the US crude production will average 11.4 million barrels per day next year.
• That will be a record for the US and just below Saudi Arabia’s output of 11.6 million barrels.
• Citibank forecasts US production could reach 13-15 million barrels per day by 2020, helping to make North America “the new Middle East.”
6

How did it happen?
• New technology – hydraulic fracturing and horizontal drilling – newfound ability to squeeze oil out of rock once thought too difficult and expensive to tap.
• Black Gold in new shale formations in North Dakota and Texas. Also, Oklahoma, Colorado & Ohio.
• Production from shale formations expected to grow from 1.6 million BPD this year to 4.2 million BPD by 2020, which means these new formations alone would yield more oil by 2020 than major oil suppliers such as Iran and Canada produce today.
7

More US Oil
• Less imported oil: With domestic oil production climbing rapidly since 2008, oil imports have been cut to just over 40 percent , the lowest level in two decades, from 60 percent.
• Transportation Issues – shipping oil by rail to refineries while new pipelines are built
• Price Spread Widens to $22.49 a barrel – WTI $89.33 vs. Brent at $111.82 for Nov contracts – big advantage for US refiners
8

Nuclear • 104 nuclear reactors in US – about 20 percent of
electricity generation • But the Fukishima pause button on new nuclear in the US
& impacted by low natural gas prices • DOE Loan Guarantees: Southern Company in Vogtle,
Georgia (received) & South Carolina Electric & Gas in Summer, South Carolina (on short list)
• Others planned in TVA, FPL Turkey Point • Compare to China 14 current plants; 40 new plants
coming. • UAE – one plant under construction; 4 plants by 2020.
9

Renewables • Electrical generation from wind, solar, geothermal and
biomass expanded to 5.8 percent in the US, from 3.1 percent about four years ago.
• State Renewable Energy Standards – 29 states, DC & Puerto Rico have renewable portfolio standards, which require utilities to obtain a certain amount of their power from renewable sources.
• Aggregated State RPS implies about 17% nationally; Compare to Proposed Federal RPS of 25% by 2025.
• Depending on growth, current RPS Goals imply 250GW or about $1 trillion in new investment (by 2025)
• Plethora of new technologies: wind, solar, PV, wave, algae, bioenergy, smart grid, storage, energy efficiency
10

Head Winds
• No more stimulus funds for renewables • Loan guarantee programs ending • Headline risk – Solyndra • Tax incentives may end • Low natural gas prices is probably the number
one problem for expanded renewables.
11

Next Big Thing • Defense Dept. Procurement is major new initiative of the
Obama Administration for renewables. • DoD playing critical role in advancement of clean energy
technologies. • Scale, purchasing power, R&D; DOD energy budget has
increased 200 percent. • DOD microgrid market expected to grow to by 375% $1.6
billion in 2020. • Army mulit-faceted $7 billion RFP for large scale renewable
and alternative energy for federal facilities • Navy biofuels program – investing $500 million to cofinance
construction of biorefineries; test flights of 50/50 biofuel blend tests for commercial flights
12

Current Federal Energy Issues
• Production Tax Credit for Renewables • Keystone Pipeline • DOE Loan Guarantee Programs • Oil & Gas Tax Incentives • Offshore Drilling • Federal Regulation of hydraulic fracturing • EPA regulations impacting coal
13

Obama vs. Romney
Obama • PTC Extension • End oil/gas tax cuts • Opposed Keystone, but will
probably approve after election
• Limited drilling on federal lands
• Federal RES • Limited fossil fuel exports • More restrictive policies for
coal and electricity generation from coal
Romney • No PTC Extension • Only end oil/gas tax cuts as
part of tax reform • Will approve Keystone • Double drilling on federal
lands; supports state regulation on federal lands
• No Federal RES • Supports fossil fuel exports • Policies to support coal &
reverse/delay restrictive regulation on coal
14

Environmental Regulation
• Bigger differences between Obama & Romney on environmental regulation
• President Obama’s EPA has imposed first carbon dioxide limits on new power plants & completed or proposed other regulations on greenhouse gas emissions
• Romney has expressed concern over several EPA regulations including mercury and greenhouse gas regulation & EPA regulations impacting coal. Some of these rules are implemented or in the courts and hard to reverse (but delay maybe).
• Expect a probably more aggressive environmental agenda in a second Obama term
• Also in second Obama term: Federal regulation of hydraulic fracturing, not due to water concerns, but focused on methane and greenhouse gas emissions from drilling. Romney will let states regulate.
15
Florida
• Offshore energy • Big opportunities in Bio Energy – cellulosic
ethanol & bioplastics from sugar cane bagasse & other resources
• Solar • Wave energy • Diversity of sources • Reliability
16


VW @ Cyano Biofuels, May 02, 2012, Berlin – Algenol, Dirk Radzinski 3
Advanced Industrial Biotechnology Company
Commercializing Proprietary Direct To Ethanol ® Technology
Fort Myers, FL Commercial Development Campus
§ Headquartered in Bonita Springs, Florida; European operations based in Zug, Switzerland
§ Research labs in Fort Myers, Florida and Berlin, Germany
§ 160 employees including 50+ Ph.D.‘s
Process Development Unit Fort Myers Research Labs
Algenol Overview
§ $160M from private investors § $25M DOE grant for
Integrated Biorefinery § $10M Lee County economic
development grant § Integrated Biorefinery (IBR):
major construction complete; initial operations begin Q1/13, expanded through Q4/13
§ R&D lab operations began in early August 2010
§ 50,000 ft2 of biology and engineering lab space
§ 4 acre outdoor Process Development Unit (PDU)
§ 36 acre outdoor commercial demonstration IBR
Integrated Biorefinery

VW @ Cyano Biofuels, May 02, 2012, Berlin – Algenol, Dirk Radzinski 4
Direct to Ethanol® Technology – Key Benefits
Commercial Production Rates and Costs are Compelling § Ethanol production cost below $1.00 per gallon § Initial commercial production rate of 6,000 gal/acre-yr (corn ethanol 400 gal/ac-yr)
Necessary Inputs Are Abundant § Sunshine! § CO2 from industrial sources (1 tonne of CO2 becomes 160 gallons of ethanol) § Salt water or brackish water as inputs § Fresh water output. 1 gallon of ethanol produced – 2 gallons of fresh water provided
Does Not Require § Killing or harvesting algae § Farm land or food crops § Fresh water
Technology Platform for Future Development and Co-products from CO2 § Biomass and Ethanol to jet and diesel § Green chemicals from CO2

VW @ Cyano Biofuels, May 02, 2012, Berlin – Algenol, Dirk Radzinski
Sustainable and Scalable Process
Advantages Over Other Biofuel Technologies
Technology Overview: Key Benefits
Direct to Ethanol® does not Require: § Daily harvesting algae to produce ethanol § Farm land or food crops § Fresh water
At Algenol: Only waste algae is processed into jet and diesel fuels
Necessary Inputs Are Abundant: § Sunshine § CO2 from industrial sources (1 tonne of CO2
becomes 160 gallons of ethanol) § Salt water or brackish water as inputs § Salt water or brackish water (1 gallon of
ethanol produced = 2 gallons of fresh water provided)
Productivity >8,000
gallons per acre per year
Cost Capex ≤ $10 per gallon
Opex $1 per gallon

VW @ Cyano Biofuels, May 02, 2012, Berlin – Algenol, Dirk Radzinski
§ Over expressed genes for fermentation pathway enzymes
§ Enhanced cells to improve
photosynthetic efficiency § 2,300 algae strains collected
globally and screened for optimal commercial Direct to Ethanol® strains
§ Ethanol secreted by hybrid algae is
recovered via condensate collection
§ Commercial strains of algae have
been selected
Technology Overview: Enhanced Algae
Algenol’s Direct to Ethanol® process uses enhanced algae to produce ethanol
Photosynthesis Intracellular Fermenta3on
Pyruvate
Blue Green Algae
Ethanol
Water
CO2
Nutrients
O2
Each Cell is a Tiny Ethanol Factory

VW @ Cyano Biofuels, May 02, 2012, Berlin – Algenol, Dirk Radzinski
Technology Overview: Photobioreactors
Low-cost, dual-purpose photobioreactors are key to Direct to Ethanol®
technology’s success § Algenol’s 1st generation patented
photobioreactors (PBRs) facilitate the initial stages of product creation, separation and collection, all of which are powered by the sun
§ PBRs are low-cost, modular and deployable at large scale
§ 1st generation PBRs are producing ethanol today
§ 2nd generation designs are being evaluated to optimize advancements in biology, namely increased ethanol production from the algae, and engineering gains in optics and temperature mitigation
§ Fresh water usage reduced to very low levels compared to large losses in open ponds
§ Closed system provides increased protection from environmental contamination
7
VW @ Cyano Biofuels, May 02, 2012, Berlin – Algenol, Dirk Radzinski
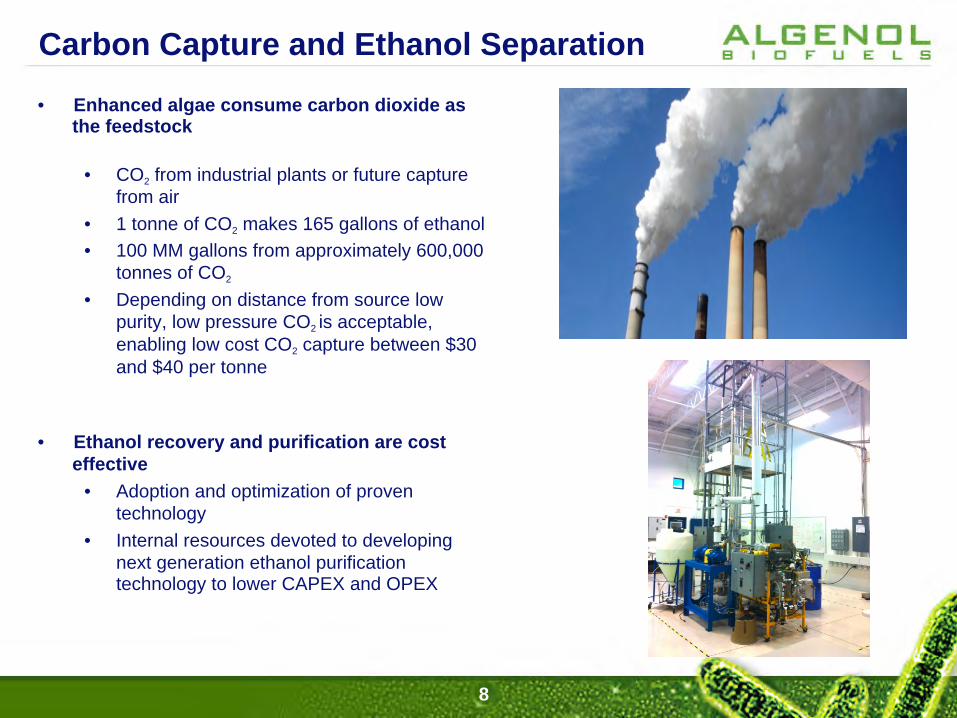
• Enhanced algae consume carbon dioxide as the feedstock
• CO2 from industrial plants or future capture from air
• 1 tonne of CO2 makes 165 gallons of ethanol • 100 MM gallons from approximately 600,000
tonnes of CO2
• Depending on distance from source low purity, low pressure CO2 is acceptable, enabling low cost CO2 capture between $30 and $40 per tonne
• Ethanol recovery and purification are cost effective
• Adoption and optimization of proven technology
• Internal resources devoted to developing next generation ethanol purification technology to lower CAPEX and OPEX
Carbon Capture and Ethanol Separation
8

VW @ Cyano Biofuels, May 02, 2012, Berlin – Algenol, Dirk Radzinski
Carbon Footprint by Life Cycle Analysis (Peer reviewed Publication)
§ Published in Environmental Science & Technology Journal
§ Renewable Fuel Standard’s requirements for reduction of GHG is met in all scenarios studied.
§ LCA, along with techno-economic analysis, is important part of the evaluation of new technology options
§ LCA study is designed to be evergreen – continuously updated as part of our DOE project.
Life Cycle Analysis Appears in: D. Luo, Z. Hu, D. Choi, V. Thomas, M. Realff, and R. Chance, Env. Sci. & Tech., 2010, 44 pp 8670–8677.
9

VW @ Cyano Biofuels, May 02, 2012, Berlin – Algenol, Dirk Radzinski
From the Laboratory to the Field
1-L PBR systems
4500-L foil-mixed integrated systems 150-L foil-mixed
integrated systems
Strain Development Physiology
Aquaculture Engineering
IBR
Petri Dishes
Algenol has the capability to move biology and engineering from lab scale to the field at one site
Shake Flasks

VW @ Cyano Biofuels, May 02, 2012, Berlin – Algenol, Dirk Radzinski 11
We’re All Students in the Lab § Algenol’s foundation is STEM
§ Over 115 employees in Florida; 63 with advanced degrees
§ Disciplines include: molecular biology; physiology; analytical chemistry; chemical and mechanical engineering; and information technology
§ Commercialization requires applying academic excellence in an entrepreneurial collaborative environment
§ Critical thinking and problem solving are imperative skills, as well as: § Teamwork: Algenol has established a collaborative
matrix of cross-functional project teams § Creativity: 21 patents issued; 44 patent applications
filed § Verbal and written communication: project teams
present to executive technical committee for guidance and gate review; our reports database catalogs years worth of reports and data; heavy reliance on IT
§ We do little on the job training because we hire elite skilled people

VW @ Cyano Biofuels, May 02, 2012, Berlin – Algenol, Dirk Radzinski 12
We’re All Residents of Florida Direct to Ethanol® technology is safe and provide significant economic development opportunities
§ Algenol intends to commercialize in Florida and in other suitable climates around the world
§ 2,000-3,000 jobs per commercial facility § Commercialization can be done while preserving
and improving the environment § Algenol cannot build if people are afraid of
Algenol and our algae • NIMBY (not in my back yard) • Algenol conducts open access tours every 4 months
• Algenol is regulated by Department of Agriculture’s division of Aquaculture
• Non Toxic • Not a Plant Pest • Non-Invasive

VW @ Cyano Biofuels, May 02, 2012, Berlin – Algenol, Dirk Radzinski
Commercial Development Campus

VW @ Cyano Biofuels, May 02, 2012, Berlin – Algenol, Dirk Radzinski

“The use of vegetable oils for engine fuels may seem
insignificant today, but such oils may become, in
the course of time, as important as petroleum and the coal-tar products of the
present time.” Rudolf Diesel - 1912 1

What is Biodiesel?
A renewable fuel commercially refined from a diverse array of fats and oils
by-products & used in normal diesel engines

Biodiesel Raw Materials Oil or Fat Soybean Corn Canola Cottonseed Sunflower Beef tallow Pork lard Used cooking oils

Oil from Coffee Grounds
The Economist Technology Quarter 1 - 2009 4

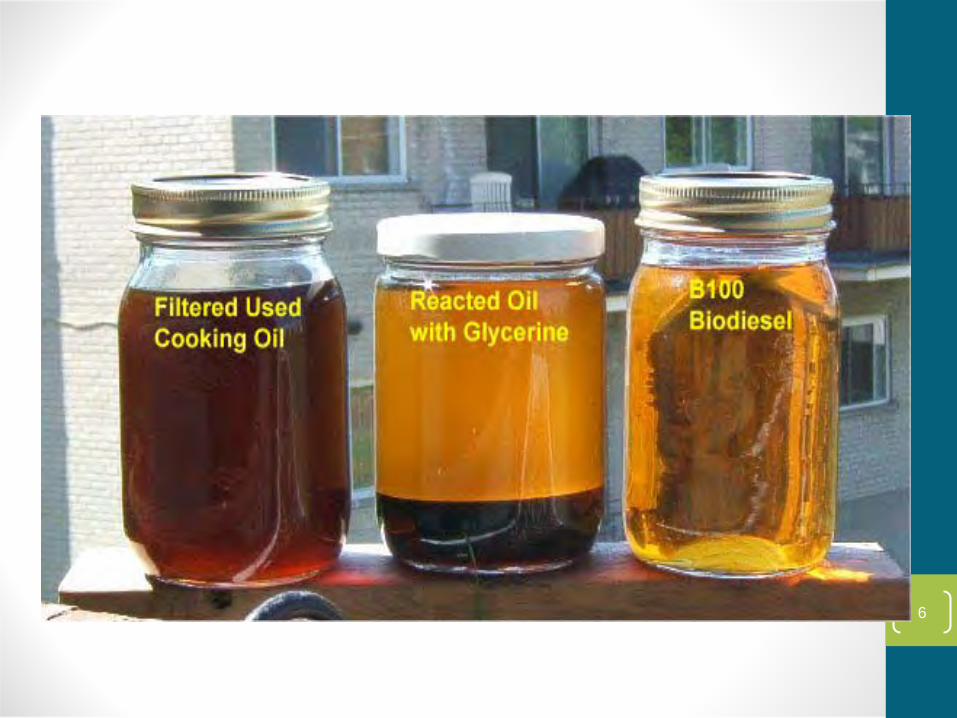
Biodiesel Reaction
100 Lbs. Vegetable Oil
+
20 Lbs. Methanol
90 Lbs. Biodiesel
+ 5 Lbs.
Glycerin +
5 Lbs Methanol
In the presence of a catalyst Reacting: Yields:
Produces mono-alkyl esters – chemically similar to diesel fuel
6

Better For Your Health • Biodiesel is:
• Biodegradable • Nontoxic:
• LD50 =17.4 g/Kg - less toxic than table salt • Skin irritation less than that of 4% soap and water solution
• Safer to handle: Flash point above 200 Degrees F, Non-Reactive, Non-Corrosive
• Compared to petrodiesel, biodiesel reduces black smoke (particulates), Carbon Monoxide, and harmful unburned hydrocarbons that cause smog.

8
Emissions Reduction: Particulate Matter (PM): 12% reduction with B20, 48% reduction with B100 Carbon Monoxide (CO): 12% reduction with B20, 48% reduction with B100 Carbon Dioxide (CO2): 16% reduction with B20, 78% reduction with B100 (life-cycle reduction) Hydrocarbons (VOCs): 20% reduction with B20, 68% reduction with B100 Nitrogen Oxides (NOx): +/- 1-2% change with B20 or B100 Sulfur Dioxide (SOx): 20% reduction with B20, 100% reduction with B100
9

• Last year the industry supported more than 39,000 jobs and
$3.8 billion in GDP* • The 4.6 billion gallons of biodiesel produced in the U.S. since
2005 have displaced 4.6 billon gallons of diesel fuel and • Reduced lifecycle greenhouse gas emissions by 56.2 billion
pounds - the equivalent of removing 4.96 million passenger vehicles from America's roadways.**
*Cardno ENTRIX, an International Economic Consulting Firm **National Biodiesel Board, 9/14/2012
10
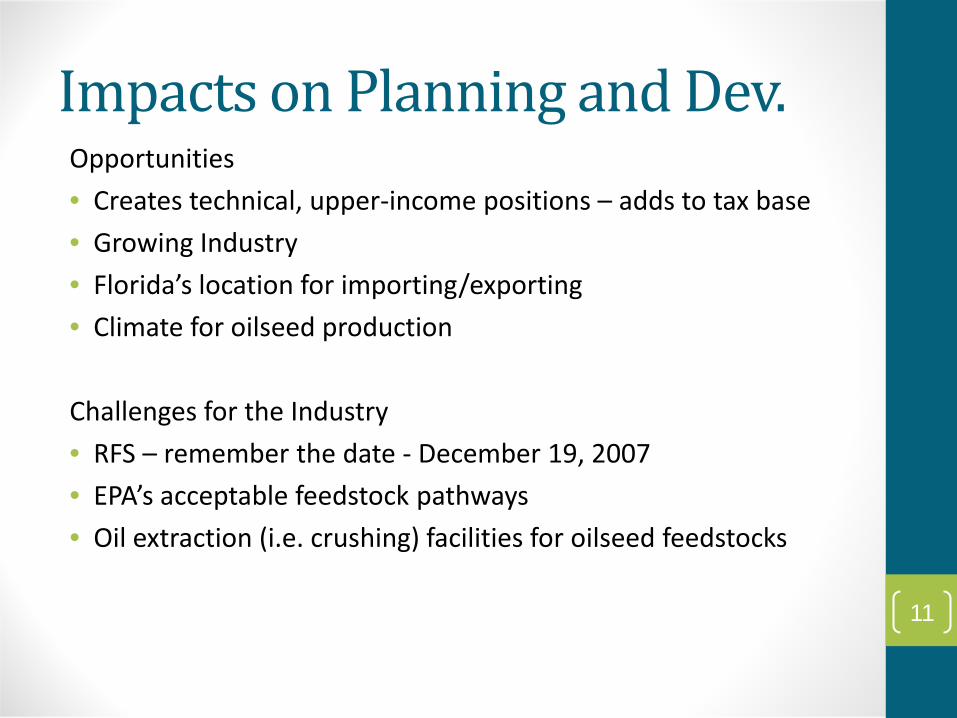
Impacts on Planning and Dev. Opportunities • Creates technical, upper-income positions – adds to tax base • Growing Industry • Florida’s location for importing/exporting • Climate for oilseed production Challenges for the Industry • RFS – remember the date - December 19, 2007 • EPA’s acceptable feedstock pathways • Oil extraction (i.e. crushing) facilities for oilseed feedstocks
11

12

Incentives State Incentives • Biofuels Investment Tax Credit • Alternative Fuel Economic Development • Provision for Renewable Fuels Investment Federal Incentives • USDA
• Biomass Crop Assistance Program (rural) • Advanced Biofuel Production Grants and Loans (rural) • Advanced Biofuel Production Payments (all)
• IRS – tax advantages for alternative fuel use • See other programs at www.afdc.energy.gov
13

Ease of Use & Performance
• Using Biodiesel is easy! • B20 and lower blends are a drop-in replacement for
diesel fuel; no vehicle modifications needed • Can be used in any diesel engine / vehicle according to
OEM’s recommendations • www.biodiesel.org/using-biodiesel/oem-information/oem-
statement-summary-chart for OEM positions • No trade-offs in terms of engine performance, fuel economy, horsepower,
torque – essentially the same as diesel
• Dispensed through existing fueling stations 14

OEM Support for Biodiesel
15

OEM Warranty Statements • All major OEMs selling diesel equipment in the U.S. support at least
B5 and lower blends, provided they are made with biodiesel meeting ASTM D 6751
• 10 new OEM statements of B20 support so far in 2012, with more
expected soon! • Now 77% of U.S. manufacturers (30 brands) support B20 or higher
blends in at least some of their equipment; • More than 95% of the medium- and heavy-duty truck markets now
support B20 • For a complete listing of OEM position statements on biodiesel, as
well as the current U.S. Diesel Vehicles List, visit: www.biodiesel.org/using-biodiesel/oem-information

OEMs Supporting B20+

Biodiesel Infrastructure • Biodiesel and biodiesel blends are now available nationwide from
more than: • 575 Distributors • 850 Retailers • 450 Truck Stops • At least 1,875 Public Locations
• Visit the new NBB website at: www.biodiesel.org/using-biodiesel/finding-biodiesel/retail-locations to view biodiesel retailers by state or along a route

Thank You! Questions…?
Mindy Collier FL Biofuels LLC State Farmers Market 2744 Edison Ave., Unit 8 Fort Myers, Florida 33916 T: 239-313-6205 [email protected]
19
Presentation to Energy In Southwest Florida Workshop
November 2, 2012

The Major Difference!

U.S. Pipeline Grid

Florida Natural Gas Service Availability
Segment
Number of Customers
Residential
674,090
Commercial
59,549
Industrial
607
Total
734,246
Distributors and
Pipelines
Number of Service
Providers
IOU 5
Municipal 27
Gas Districts 4
Intrastate Pipeline
1
Interstate Pipelines
4

Florida Natural Gas Service Availability

Interstate Pipelines Serving Florida
Florida Gas Transmission 3.1 BCF/Day
Gulfstream Natural Gas System 1.3 Bcf/Day
Southern Natural Gas .370 Bcf/Day Gulf South
Pipeline .200 Bcf/Day
Total Capacity into State is 4.97 Bcf/Day
Per EIA Average 2011 Daily
Consumption was 3.2 Bcf/Day

2011 production at highest level in 25
years
30% of production
from shale gas January 2012 production up 10% from January 2011

US Proved Reserves -2009
11,813
2,871
10,869
2,773
23,058
7
3,279
2,782
20,688
2,763
917
976
15,598
196
1,079
896
22,769
6,985
80,424
7,257
3,091 5,946
35,283
200% Increase
145% Increase
Total US Proved
Reserves 262,320 Bcf
57% Increase from 2000
Source: EIA

Access to Natural Gas Storage
Bay Gas
Southern Pines
Napoleonville
Egan
Golden Triangle
Spindletop
Tres Palacios Pine Prairie
Bobcat Petrologistics
10 Storage Facilities with Over 175 Bcf of Working Gas
Capacity
At 50% of Capacity Over 28
Days of Peak Deliveries
SONAT, Gulf South, And Gulfstream Have Access
to Additional Storage Facilities

Energy Realities
ExxonMobil’s 2012 Outlook for Energy

USA Electric Generation Mix

Cost Related to Generation
ExxonMobil’s 2012 Outlook for Energy

The Direct Use of Natural Gas
Source: AGA 2011 Playbook

Benefits of Direct Use of NG
More effective use of the energy Lower GHG per residence by 2-3 tons annually Reduces load on the electric grid Reduces the need to build more electric generation
plants Lower costs for residences and businesses

Contact Information: Scott Ranck, CEA Senior Conservation & Energy Specialist Florida Public Utilities Company [email protected]

Compressed Natural Gas in Florida
Keith Gruetzmacher Senior Manager Marketing Services

TECO Energy
TECO Energy, Inc. (NYSE: TE) is an energy-related holding company headquartered in Tampa, Florida. Its regulated Florida operations include Tampa Electric and Peoples Gas. Other business companies include TECO Clean Advantage and TECO Partners. • Tampa Electric is a regulated electric utility with nearly 4,700 megawatts of
capacity. Its service area covers 2,000 square miles in West Central Florida, including nearly all of Hillsborough County and parts of Polk, Pasco and Pinellas counties. Tampa Electric delivers reliable power to more than 677,000 residential, commercial and industrial customers.
• Peoples Gas is Florida’s leading provider of regulated natural gas distribution
services, with a presence in most of the state’s metropolitan areas. Peoples Gas delivers reliable, clean energy to almost 340,000 residential, commercial and industrial customers.
• TECO Partners is an energy-related sales and marketing company dedicated to
providing comprehensive energy solutions for residential and business clients.

PGS Service Area
PGS Territory • Local Distribution Company (LDC) • Deliver natural gas to homes and businesses
through underground pipelines

NGV Infrastructure
City of Milton
PGS Jax
Waste Pro (Port Orange)
Kennedy Space Center
FL City Gas (Rockledge)
Waste Management (Pompano Beach)
City of N. Miami PGS Miami
City of Hollywood
Quality Transportation (Wise Gas) Clean Energy (Choice Environmental)
Veolia
PGS Ft. Myers WM (Venice)
PGS St. Pete
Clearwater Gas (City of Clearwater)
PGS Channelside
Clean Energy (TIA)
Travis Career Center (Polk Co)
Republic
PGS Orlando City of Apopka PGS Ocala
Leon Co. Schools
Republic - Volusia Co.
Saddle Creek
ESP
Waste Pro Ft. Pierce
Marion County
Existing Under Construction PGS 29 stations total

Public NGV Infrastructure
City of Milton
Waste Management (Pompano Beach)
Quality Transportation (Wise Gas)
Clearwater Gas (City of Clearwater)
Clean Energy (TIA)
Leon Co. Schools
ESP
Marion County
Public (current) Under construction
Currently, only 6 stations open to the public. Lack of fueling infrastructure has been a major inhibitor to fleet conversions. But that’s changing…..

Today’s Fuel Costs Public Stations CNG vs. FL Petroleum
Rate Schedule
Cost/ GGE
Cost/ DGE
CNG FL Avg.1
$2.134 $2.433
CNG US Avg. 2
$2.050 $2.337
Unleaded3 $3.811
Mid3 $3.987
Premium3 $4.118
Diesel3 $4.084
1 – www.cngprices.com 2 – Clean Cities Alternative Fuels Price Report (July 2012) 3 – FL average fuel prices. AAA Fuel Gauge Report (September 14, 2012)

Price Projection

Vehicle Technology
• NGV America (www.ngvamerica.org) – 30 different manufacturers and 100 models of
light, medium and heavy-duty vehicles and engines from OEM or certified retrofit.
– 2012 updated list available

NGVs Under 14,000 Pounds

NGVs Over 14,000 Pounds

Florida Activity
Refuse Industry • Part of every portfolio • Over 400 trucks • Operating since 2010
• TIA opened 3/9/12 • 10yr plan to convert
majority of fleet • Opportunity for use
by support fleets

• Headquartered in Lakeland • Provides third-party logistics operations across the U.S. • CNG operation started December 30, 2011 • 1st tractors in Florida • Over 1 million CNG miles • 120 CNG tractors by 2014
Statewide Distribution

Work with you and your CNG providers to: • Establish Natural Gas availability
– Available pressure
• Identify fueling needs – Annual consumption – Peak fueling demand
• Determine gas marketing needs – Lock-in your fuel price
The PGS Role

Presented by Diana Giraldo
Sustainability Coordinator City of Fort Myers
[email protected] (239) 321-7926

Energy & Efficiency Planning
Understanding The Task Funding Following a Plan
Understanding Regional Considerations Florida’s Hot & Humid Climate Zone
Understanding Ratings/Certifications & Requirements For EE

Energy & Efficiency Planning
Researching Materials & Implementation
Would you ever use Wikipedia to make an informed decision?
Working With The Right Team Building Owner Project Manager/Planner Designer Builder Building Science Professional
4

New Buildings
Lot Orientation/Preservation of the Natural Environment
Connectivity & Transportation Shade Trees/Landscaping Site Grading
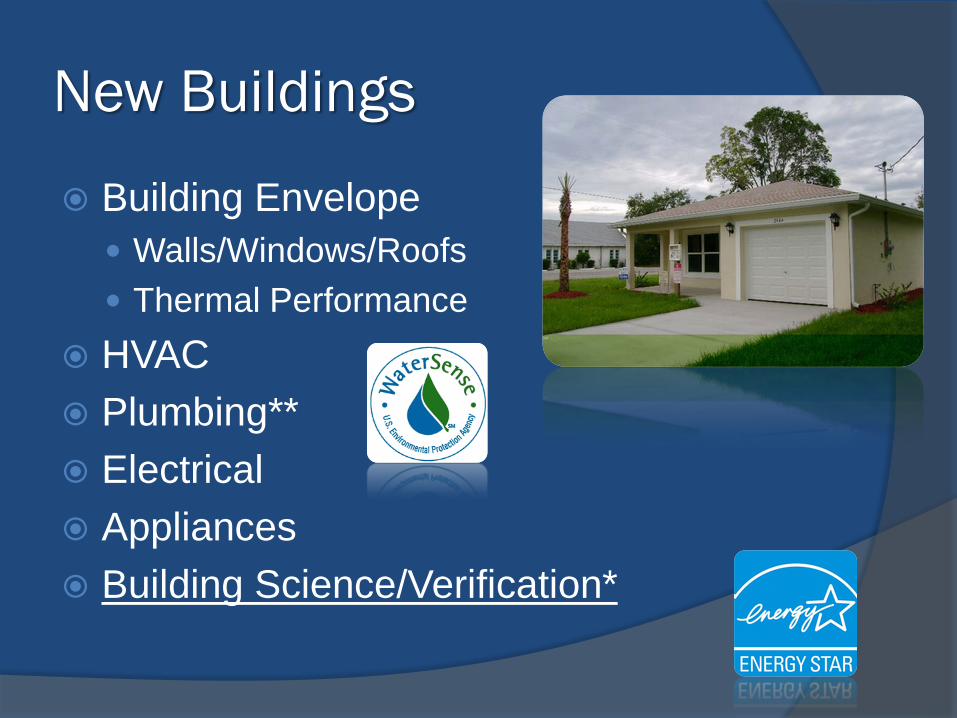
New Buildings
Building Envelope Walls/Windows/Roofs Thermal Performance
HVAC Plumbing** Electrical Appliances Building Science/Verification*

Existing Buildings
Enhanced Landscape Building Envelope
Thermal Performance Whole House Infiltration
HVAC Electrical & Plumbing As Needed Appliances Building Science/Verification*

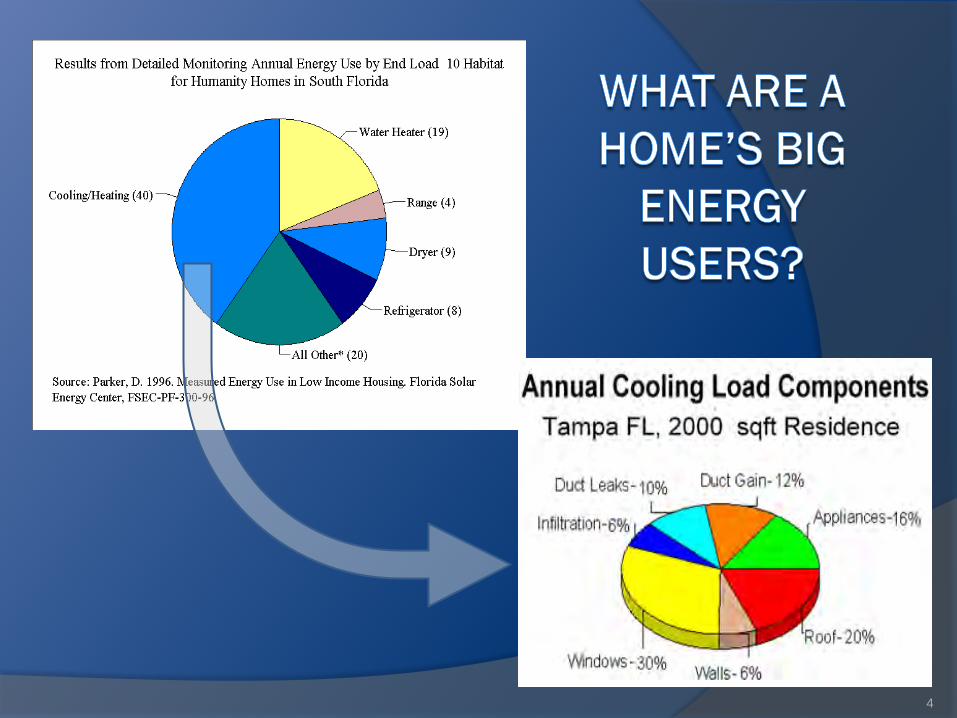
What To Consider Before You Think
Solar Is The Only Solution?
Solar Systems Must Work As A System With The Building…
There Are Other Considerations!

Best Practices-Existing Buildings
Building Science/Verification* HERS/BERS Testing

Reduce Infiltration: Avoid Drywall Penetrations
10

Seal Penetrations/Install Insulation Properly
11
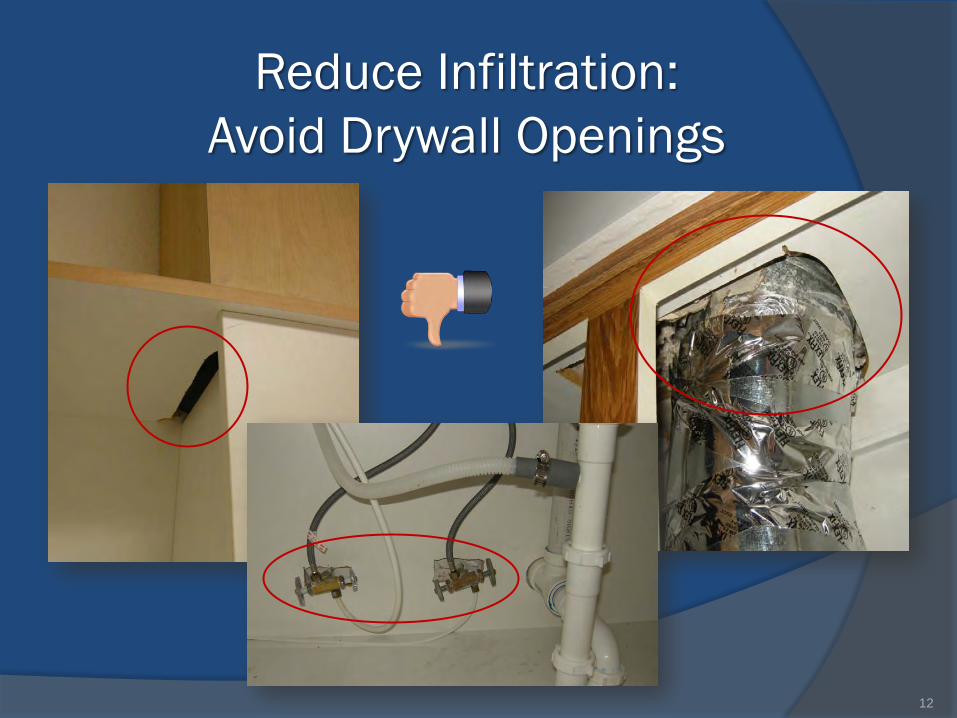
Reduce Infiltration: Avoid Drywall Openings
12

Large holes between air handler closet and attic were a large source of infiltration in this retrofit.
Reduce Infiltration: Seal Air Handler Closet
Looking up toward the ceiling, air handler is on the right
13

Avoid Buried/Compressed Ductwork
Burying ducts with blown insulation lowers the surface temperature of the duct work, creating a condensation risk. Ducts should be strapped above the insulation where ever
possible per Florida mechanical code 14

Add Insulation & Radiant Barriers
R-38 Insulation in vented attics Radiant Barrier with low emissivity
Air barrier required @ garage/truss bay
15

Appliances
Energy Star Low Energy use (ranges & HWH) HWH, washer & dryer outside conditioned space For a regular HWH, install most efficient and wrap with R-5 blanket
**Heat pump WH most efficient-Energy Star •Needs 1,000 cubic feet of space •Temperatures of 40°-90° F
16

Electric fixtures
Max 100 W bathroom fixtures Energy Star fans/lights Install CFL or LED light bulbs only
17

Plumbing
Toilets 1.28 gal/flush Shower heads max 1.6 gpm Aerators 1.5 gpm Lavatory faucets 1.6 to 1.0 gpm + aerator Gutters and downspouts installed (downspouts directing
water at least 3’ from building or into stormwater collector for reuse)
18

Windows Impact Energy Efficient windows U-Factor=0.6 SHGC<0.27 recommended) Install window screens Add window tint (if window is not being replaced) U-Factor=0.87
SHGC=<0.4- Not Every tint is adequate
19

Other Stuff
Manage Energy Consumption Assess Performance Set Goals Create A Plan & Implement Evaluate/Tune-Up
Train The User of The Space Understanding Their Building Applying Simple EE Tasks (i.e., thermostat
settings, driving habits, etc)

The Bottom Line

SOUTH DISTRICT
ENERGY and the ENVIRONMENT
N 2 2012Nov 2, 2012

ENERGY & the Environment
Jon IglehartDirector
Florida Department ofFlorida Department of Envrionmental Protection
South District
Website: www.dep.state.fl.us/southp
11/2/2012 2

Contact Information Florida Department of Environmental
ProtectionProtection 2295 Victoria Ave, Fort Myers Fl.
S it 364Suite 364 P.O. Box 259
Fort Myers, Fl, 33902 – 2549Phone: 239 – 334 – 5600Phone: 239 334 5600
OMBUDSMANt ll @d t t [email protected]
11/2/2012 3

E n e r g y i n C e n t r a l and S o u t h w e s t F l o r i d a
Pat Steed Central Florida Regional Planning Council
Energy Resiliency Strategy

E n e r g y i n C e n t r a l and S o u t h w e s t F l o r i d a
3500 BC--Fixed wheels on carts are invented - the first wheeled vehicles in history. Other early
wheeled vehicles include the chariot.
Transportation and Land Use

E n e r g y i n C e n t r a l and S o u t h w e s t F l o r i d a
181-234—The wheelbarrow is invented.
1662-- Blaise Pascal invents the first public bus - horse-drawn, regular route,
schedule, and fare system
Transportation and Land Use

E n e r g y i n C e n t r a l and S o u t h w e s t F l o r i d a
1790 Modern bicycles invented
Transportation and Land Use

E n e r g y i n C e n t r a l and S o u t h w e s t F l o r i d a
1862--Jean Lenoir makes a gasoline engine automobile
Transportation and Land Use
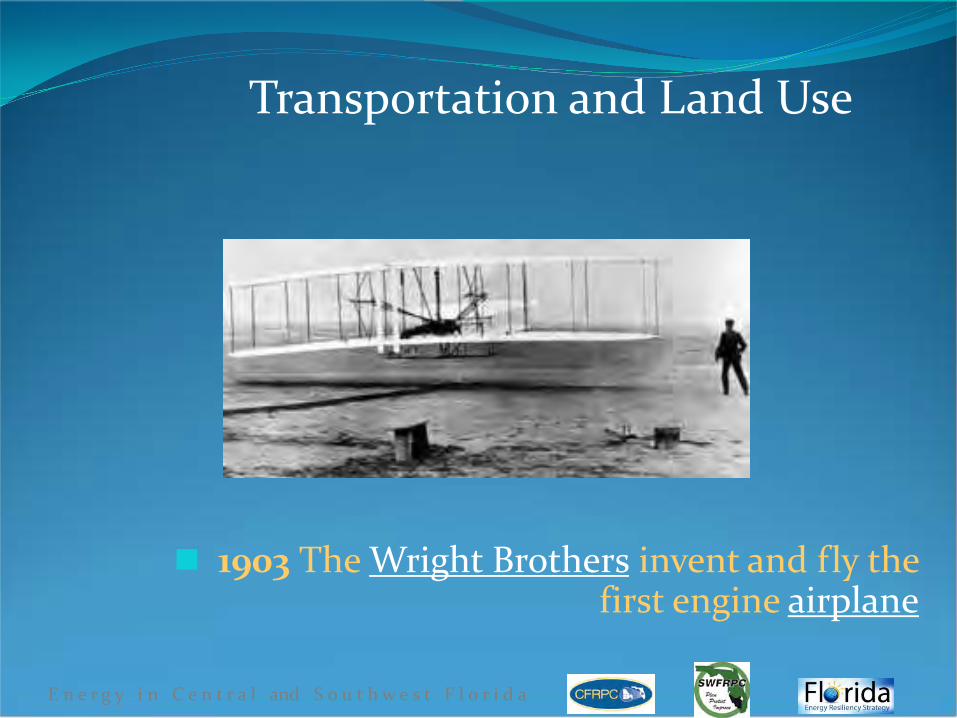
E n e r g y i n C e n t r a l and S o u t h w e s t F l o r i d a
1903 The Wright Brothers invent and fly the first engine airplane
Transportation and Land Use

E n e r g y i n C e n t r a l and S o u t h w e s t F l o r i d a
1964 Bullet train invented
Transportation and Land Use

E n e r g y i n C e n t r a l and S o u t h w e s t F l o r i d a
1981--Space Shuttle launched
Transportation and Land Use

E n e r g y i n C e n t r a l and S o u t h w e s t F l o r i d a
1925 Primary mode of transportation becomes the automobile
Transportation and Land Use

E n e r g y i n C e n t r a l and S o u t h w e s t F l o r i d a
1925 Primary mode of transportation becomes the automobile
2012 Primary mode of transportation remains the automobile
Transportation and Land Use
AND
E n e r g y i n C e n t r a l and S o u t h w e s t F l o r i d a
Transportation and Land Use

E n e r g y i n C e n t r a l and S o u t h w e s t F l o r i d a
Transportation and Land Use

E n e r g y i n C e n t r a l and S o u t h w e s t F l o r i d a
Transportation and Land Use

E n e r g y i n C e n t r a l and S o u t h w e s t F l o r i d a
Transportation and Land Use

E n e r g y i n C e n t r a l and S o u t h w e s t F l o r i d a

16
Existing System Cannot Meet Demand Congested Corridors, 2025
Source: Florida Department of Transportation
16

17
Cross-Modal Integration: Florida’s Future Supply Chain?
Ocean transit Port discharge to rail Rail line-haul
Highway delivery
Inland Rail Terminal
Distribution center

E n e r g y i n C e n t r a l and S o u t h w e s t F l o r i d a

Central and Southwest Florida: 2005
Developed Land
Conservation Lands Permanently Protected

Central and Southwest Florida: 2060 Trend
Developed Land
Conservation Lands Permanently Protected

Changing Demographics Complete Streets

E n e r g y i n C e n t r a l and S o u t h w e s t F l o r i d a
Enhancing and Creating Resilient Communities

E n e r g y i n C e n t r a l and S o u t h w e s t F l o r i d a
H2O Car?
Electric Car?

E n e r g y i n C e n t r a l and S o u t h w e s t F l o r i d a
Fueled by Natural Gas?

E n e r g y i n C e n t r a l and S o u t h w e s t F l o r i d a
Transportation of the Future Poster Contest
Jonathan Concepcion

E n e r g y i n C e n t r a l and S o u t h w e s t F l o r i d a
Transportation and Land Use

E n e r g y i n C e n t r a l and S o u t h w e s t F l o r i d a
Resiliency Analysis: Natural Gas and Gasoline
Jay McLeod Central Florida Regional Planning Council
Energy Resiliency Strategy

E n e r g y i n C e n t r a l and S o u t h w e s t F l o r i d a
Natural Gas
Economic Resiliency Modeling

E n e r g y i n C e n t r a l and S o u t h w e s t F l o r i d a
Background: Electricity Generation
• Within a decade, FL projected to rely on natural gas for ~60% of electricity generation

E n e r g y i n C e n t r a l and S o u t h w e s t F l o r i d a
Past Prices
Taken from 2012 FL Energy Summit presentation (by Buck Martinez), without permission.
Current price: ~$2.00
Previous trend: ~$6.00

E n e r g y i n C e n t r a l and S o u t h w e s t F l o r i d a
Learning From the Past – What to model?
Taken from 2012 FL Energy Summit presentation (by Buck Martinez), without permission.
Current price: ~$2.00
Supply disruption: price spike to ~$12.00 for ~6 months
Future price: ???
Previous trend: ~$6.00

E n e r g y i n C e n t r a l and S o u t h w e s t F l o r i d a
• Regional Economic Models, Inc. (REMI) PI+ Software (ver. 1.3.13)
• Scenarios modeled: – Supply disruption of natural gas: to $12 for 6
months (six times current price) – Increase in price of natural gas: to $6 (or triple
current price) over 5 year period
Method: Economic Scenario Modeling

E n e r g y i n C e n t r a l and S o u t h w e s t F l o r i d a
State of Florida
Scenario = Statewide six month natural gas shortage (with price spike to 6X current price)
Region = Entire State
Today (2012)
Loss in first year
Loss over first year
Avg. Annual Loss
over five years
Avg. Annual
Loss over 5 years
Total Employment 10,234,017 -126,128 -1.19% -44,877 -0.41% Gross Domestic Product (billions of 2005 dollars) $767.7 -$10.760 -1.35% -$4.33 -0.52% Real Disposable Personal Income (billions of 2005 dollars) $675.2 -$21.702 -3.11% -$6.01 -0.84% Source: Florida Regional Planning Councils, Energy Resiliency Strategies project, modeled using REMI PI+ v1.3.13, 2012.

E n e r g y i n C e n t r a l and S o u t h w e s t F l o r i d a
Southwest Florida RPC
Scenario = Statewide six month natural gas shortage (with price spike to 6X current price) Region =
Southwest FL RPC
Today (2012)
Loss in first year
(2013)
Difference over first
year
Avg. Annual
Loss over five years
Avg. Annual
Loss over 5 years
Total Employment 771,984 -11,224 -1.39% -3,988 -0.48% Gross Domestic Product (billions of 2005 dollars) $50.2 -$0.847 -1.61% -0.338 -0.61% Real Disposable Personal Income (billions of 2005 dollars) $64.7 -$2.086 -3.09% -0.58 -0.82% Source: Florida Regional Planning Councils, Energy Resiliency Strategies project, modeled using REMI PI+ v1.3.13, 2012.

E n e r g y i n C e n t r a l and S o u t h w e s t F l o r i d a
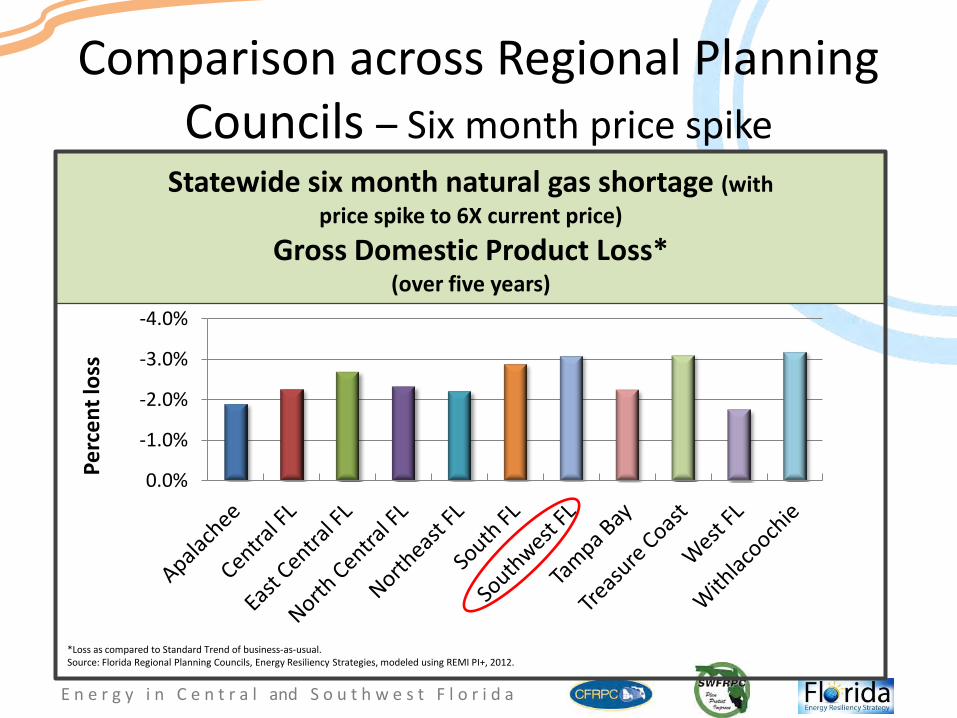
Comparison across Regional Planning Councils – Six month price spike
-3.0%
-2.0%
-1.0%
0.0%
Perc
ent l
oss
Statewide six month natural gas shortage (with price spike to 6X current price)
Total Employment Loss* (over five years)
*Loss as compared to Standard Trend of business-as-usual. Source: Florida Regional Planning Councils, Energy Resiliency Strategies, modeled using REMI PI+, 2012.
E n e r g y i n C e n t r a l and S o u t h w e s t F l o r i d a
Comparison across Regional Planning Councils – Six month price spike
-4.0%
-3.0%
-2.0%
-1.0%
0.0% Perc
ent l
oss
Statewide six month natural gas shortage (with price spike to 6X current price)
Gross Domestic Product Loss* (over five years)
*Loss as compared to Standard Trend of business-as-usual. Source: Florida Regional Planning Councils, Energy Resiliency Strategies, modeled using REMI PI+, 2012.
E n e r g y i n C e n t r a l and S o u t h w e s t F l o r i d a
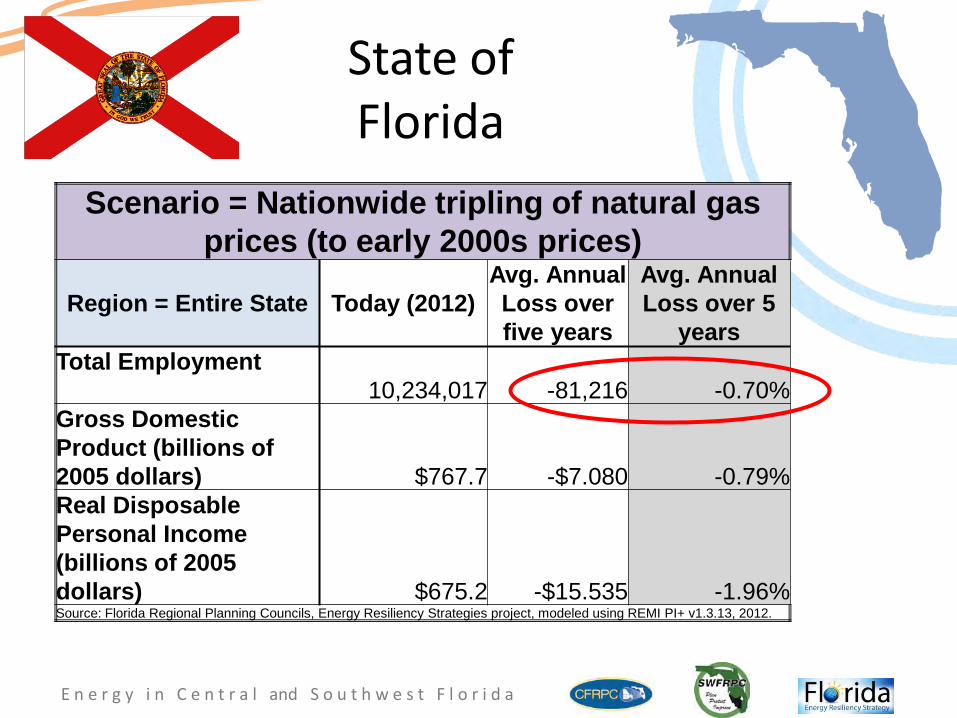
State of Florida
Scenario = Nationwide tripling of natural gas prices (to early 2000s prices)
Region = Entire State Today (2012) Avg. Annual Loss over five years
Avg. Annual Loss over 5
years Total Employment 10,234,017 -81,216 -0.70% Gross Domestic Product (billions of 2005 dollars) $767.7 -$7.080 -0.79% Real Disposable Personal Income (billions of 2005 dollars) $675.2 -$15.535 -1.96% Source: Florida Regional Planning Councils, Energy Resiliency Strategies project, modeled using REMI PI+ v1.3.13, 2012.

E n e r g y i n C e n t r a l and S o u t h w e s t F l o r i d a
Southwest Florida RPC
Scenario = Nationwide tripling of natural gas prices (to early 2000s prices)
Region = Southwest FL RPC Today (2012)
Avg. Annual Loss over five years
Avg. Annual Loss over 5
years Total Employment 771,984 -7,066 -0.79% Gross Domestic Product (billions of 2005 dollars) $50.2 -$0.56 -0.93% Real Disposable Personal Income (billions of 2005 dollars) $64.7 -$1.544 -1.97% Source: Florida Regional Planning Councils, Energy Resiliency Strategies project, modeled using REMI PI+ v1.3.13, 2012.

E n e r g y i n C e n t r a l and S o u t h w e s t F l o r i d a
Comparison across Regional Planning Councils - Back to early 2000s prices
-5.0%
-4.0%
-3.0%
-2.0%
-1.0%
0.0%
Perc
ent l
oss
Nationwide tripling of natural gas prices (to early 2000s prices)
Total Employment Loss* (over five years)
*Loss as compared to Standard Trend of business-as-usual. Source: Florida Regional Planning Councils, Energy Resiliency Strategies, modeled using REMI PI+, 2012.

E n e r g y i n C e n t r a l and S o u t h w e s t F l o r i d a
Comparison across Regional Planning Councils - Back to early 2000s prices
-6.0% -5.0% -4.0% -3.0% -2.0% -1.0% 0.0%
Perc
ent l
oss
Nationwide tripling of natural gas prices (to early 2000s prices)
Gross Domestic Product Loss* (over five years)
*Loss as compared to Standard Trend of business-as-usual. Source: Florida Regional Planning Councils, Energy Resiliency Strategies, modeled using REMI PI+, 2012.

E n e r g y i n C e n t r a l and S o u t h w e s t F l o r i d a
Gasoline
Economic Resiliency Modeling

E n e r g y i n C e n t r a l and S o u t h w e s t F l o r i d a
Gasoline Usage
• Roughly 98% of automobiles in US use diesel or unleaded gas – Less than 1% Electric – Roughly 2.5% are hybrid
• Future goals/trends: – USA Goal – Have 1,000,000 electric cars by 2020 – That’s still less than 10% of all cars
• ExxonMobil projects petroleum will be fuel for ~90% of global transportation by 2040

E n e r g y i n C e n t r a l and S o u t h w e s t F l o r i d a
8 Year Historical Price Chart

E n e r g y i n C e n t r a l and S o u t h w e s t F l o r i d a
Scenario Modeling: Gas Price Increase
$3.50 $5.00
$7.00
$10.00 $10.00
$-
$2.00
$4.00
$6.00
$8.00
$10.00
$12.00
2012 2013 2014 2015 2016
National Retail Gasoline Price

E n e r g y i n C e n t r a l and S o u t h w e s t F l o r i d a
State of Florida Nationwide increasing gasoline prices
Today (2012)
Average Annual Loss @ $5/gallon
Average Annual Loss @ $7.5/gallon
Average Annual Loss @ $10/gallon
US Employment 178,913,875 -5.8 Million -9.9 Million -16.3 Million
FL Employment 10,284,524 -322,000 -536,000 -885,000 Percent of FL Employment 100% -3.06% -5.01% -8.12%
FL GDP (2012 $ Billion) $883 - $28 - $49 - $82
FL Income (2012 $ Billion) $927 - $15 - $26 - $45
Source: Florida Regional Planning Councils, Energy Resiliency Strategies project, modeled using REMI PI+ v1.3.13, 2012.
E n e r g y i n C e n t r a l and S o u t h w e s t F l o r i d a
0
50,000
100,000
150,000
200,000
250,000
300,000
350,000
EPA 1 EPA 2 EPA 3 EPA 4 EPA 5
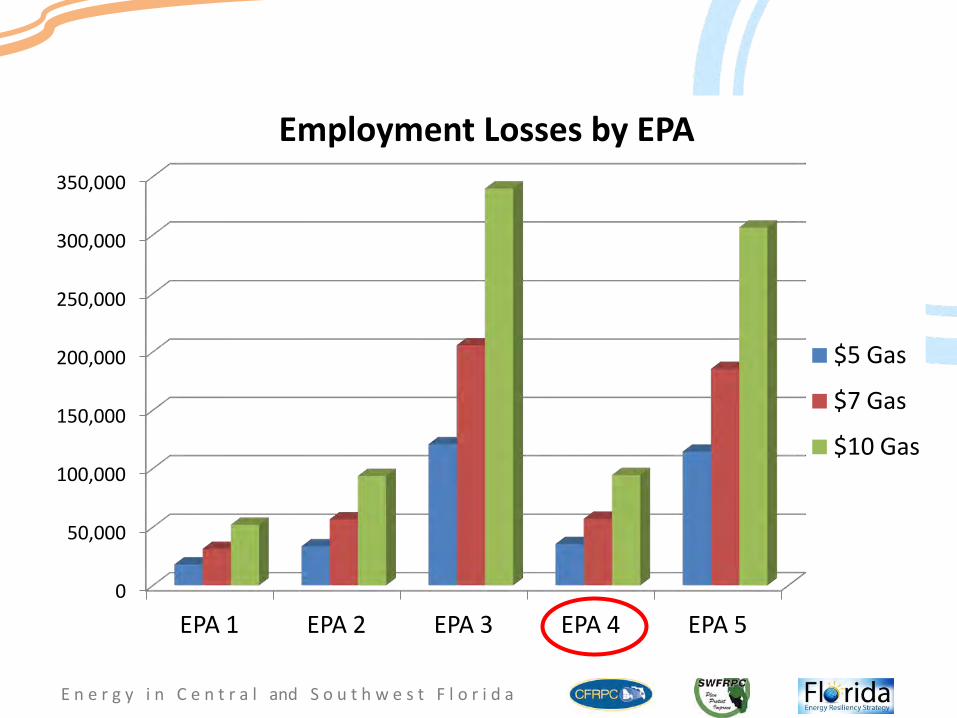
Employment Losses by EPA
$5 Gas
$7 Gas
$10 Gas

E n e r g y i n C e n t r a l and S o u t h w e s t F l o r i d a
0%
1%
2%
3%
4%
5%
6%
7%
8%
9%
EPA 1 EPA 2 EPA 3 EPA 4 EPA 5
Employment Percent Losses by EPA
$5 Gas $7 Gas $10 Gas

E n e r g y i n C e n t r a l and S o u t h w e s t F l o r i d a
Conclusion
• Energy resiliency is important to economic resiliency.
• Energy price increases and supply disruptions have varying economic impacts.
• Planning for energy resiliency can have large economic benefits.

E n e r g y i n C e n t r a l and S o u t h w e s t F l o r i d a
Thank you
Jay McLeod Central Florida Regional Planning Council
www.cfrpc.org