
Southern Institute of Water Resources Research, …€¦ · 1Southern Institute of Water Resources...
39
THE MEKONG FUTURE PROJECT FIRST DRAFT REPORT ON THE HYDROLOGICAL SIMULATION To Quang Toan 1 , Nguyen Hieu Trung 2 , Dang Kieu Nhan 3 1 Southern Institute of Water Resources Research, 2 Research Institute for Climate Change, Can Tho University, 3 Mekong Delta Research Institute, Can Tho University. Executive Summary This study aims to analyse how successful investments in water infrastructure in response to sealevel rise are. The study emphasizes the need to put such adaptation strategies into the larger context of land use change and upstream developments. In particular upstream developments such as hydropower, irrigation and water diversion can substantially offset the effect of hard adaptation measures such as dikes and sluice gates. Most importantly, the results emphasise the need to understand combined effects, such as the combination of sea-level rise, upstream dams, upstream irrigation and drought. Adding climate predictions (i.e. more dry years) into the equations suggests that negotiating how upstream dams are operated can have much larger effects than expensive investments in water infrastructure. I. Model description This report documents the hydrological analysis of relevant scenarios for Vietnam’s Mekong Delta. The underlying model is based on an existing model developed by the Southern Institute for Water Resources Research (SIWRR). The new scenarios were developed by stakeholders as part of the Exploring Mekong Region Future project. I.1. Description of hydraulic schematization The hydraulic schematization starts from Kratie, it covers the floodplain in Cambodia and the whole Mekong Delta of Vietnam, so called as the simulated area. Within the simulated area, all rivers and canal networks were numbered to the scheme as well as the hydraulic work and land use and other water use (figure 1). The outside simulated areas in the Mekong River (upstream of Kratie) and Saigon – Dongnai river basins (upstream of Tri An hydropower station) were selected as boundary conditions for the model.
-
Upload
truongkien -
Category
Documents
-
view
217 -
download
0
Transcript of Southern Institute of Water Resources Research, …€¦ · 1Southern Institute of Water Resources...

THE MEKONG FUTURE PROJECT
FIRST DRAFT REPORT ON THE HYDROLOGICAL SIMULATION
To Quang Toan1, Nguyen Hieu Trung2, Dang Kieu Nhan3
1Southern Institute of Water Resources Research, 2Research Institute for Climate Change, Can Tho University, 3Mekong Delta Research Institute, Can Tho University.
Executive Summary
This study aims to analyse how successful investments in water infrastructure in response to sealevel rise are. The study emphasizes the need to put such adaptation strategies into the larger context of land use change and upstream developments. In particular upstream developments such as hydropower, irrigation and water diversion can substantially offset the effect of hard adaptation measures such as dikes and sluice gates. Most importantly, the results emphasise the need to understand combined effects, such as the combination of sea-level rise, upstream dams, upstream irrigation and drought. Adding climate predictions (i.e. more dry years) into the equations suggests that negotiating how upstream dams are operated can have much larger effects than expensive investments in water infrastructure.
I. Model description
This report documents the hydrological analysis of relevant scenarios for Vietnam’s Mekong Delta. The underlying model is based on an existing model developed by the Southern Institute for Water Resources Research (SIWRR). The new scenarios were developed by stakeholders as part of the Exploring Mekong Region Future project.
I.1. Description of hydraulic schematization
The hydraulic schematization starts from Kratie, it covers the floodplain in Cambodia and the whole Mekong Delta of Vietnam, so called as the simulated area. Within the simulated area, all rivers and canal networks were numbered to the scheme as well as the hydraulic work and land use and other water use (figure 1). The outside simulated areas in the Mekong River (upstream of Kratie) and Saigon – Dongnai river basins (upstream of Tri An hydropower station) were selected as boundary conditions for the model.

Figure 1 The simulated schematization (Nguyen Quang Kim and To Quang Toan et al, 2010; Nguyen Sinh Huy, To Quang Toan
et al, 2010)
I.1.1 Physical condition:
The physical conditions of rivers and canal systems and the hydraulic constructions used in this model are based on the conditions of the historically driest year of the Vietnamese Mekong Delta (VMD), year 2005. The operation of these constructions can be changed for number of water management scenarios.
I.1.2 Upstream boundary conditions:
Kratie flow was taken as the discharge boundary of the model. The observed flow at Kratie is used to calibrate the present condition of the simulated year. The simulated water flow at Kratie according to the future development condition is used to predict the future condition of the hydraulic infrastructure and the water quality conditions of the Mekong Delta. Besides, the flow of the Tonle Sap and other tributaries in Cambodia, downstream of Kratie, and the flow from Sai Gon – Dong Nai river basin are also included as model boundaries.
For this study, the upstream boundary will be based on the results of the recent national study on the impact of upstream development to VMD (figure 2)
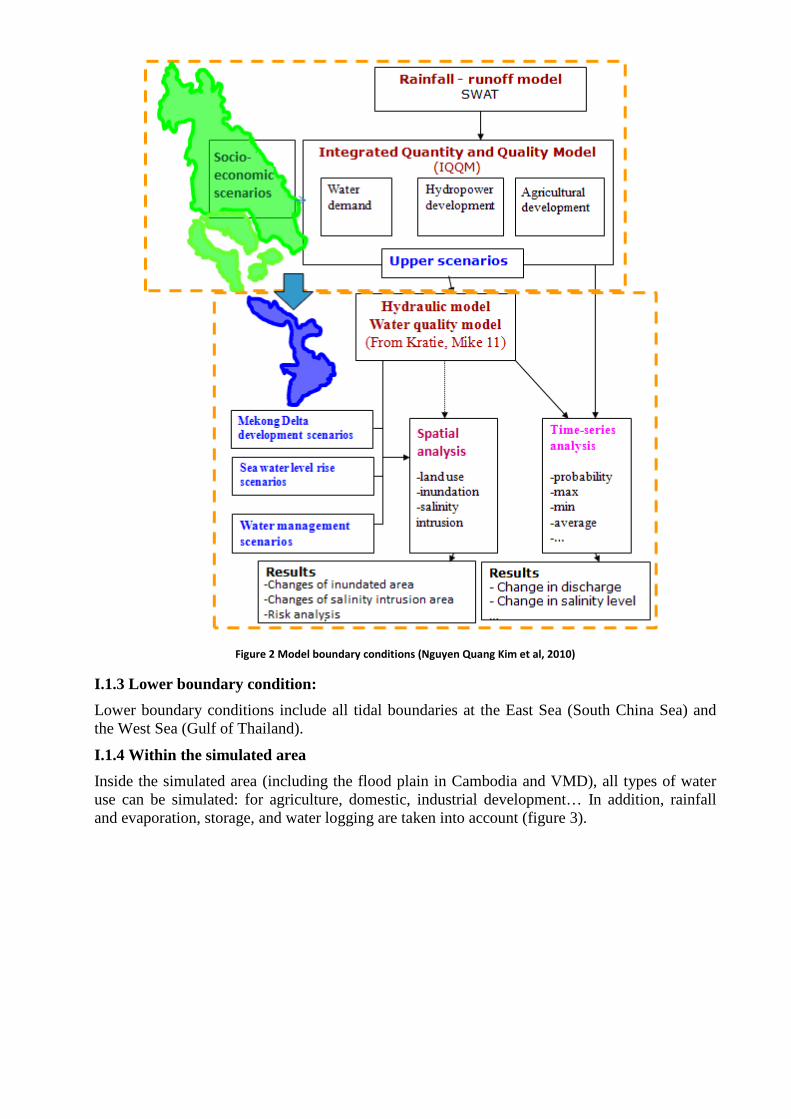
Figure 2 Model boundary conditions (Nguyen Quang Kim et al, 2010)
I.1.3 Lower boundary condition:
Lower boundary conditions include all tidal boundaries at the East Sea (South China Sea) and the West Sea (Gulf of Thailand).
I.1.4 Within the simulated area
Inside the simulated area (including the flood plain in Cambodia and VMD), all types of water use can be simulated: for agriculture, domestic, industrial development… In addition, rainfall and evaporation, storage, and water logging are taken into account (figure 3).

Figure 3 Water in and out of the delta (Nguyen Quang Kim and To Quang Toan et al, 2010; Nguyen Sinh Huy, To Quang Toan
et al, 2010)
I.2. Scenarios
The model simulations make for the Exploring Mekong Region Futures project different assumptions for sea level rise and upstream water regime changes over the next 40 years. In total 5 scenarios have been taken into account, as listed in Table 1.
Table 1 Simulated Scenarios
No Abbreviation Description
0 SCN0:
SLR30+RfC Sea level rise 30cm + Rainfall pattern change (Climate change) + Based year land use
1 SCN1: SLR30+RfC+AgrP
Sea level rise 30cm + Rainfall pattern change + Land use scenario (toward increasing of rice area)
2.1 SCN2.1: SLR30 + UPS30
SCN1 + Upstream hydropower and land use scenario.
2.2 SCN2.2:
SLR30 + UPS30-Qp85% SCN1 + Upstream hydropower and land use scenario in the drought hydrological year with probability of 85%
2.3 SCN2.3:
SLR30 + NFD-Opti
SCN1 + Upstream near future hydropower dams scenario with optimum operation (NFD-Opti) (based on Nguyen Quang Kim, et. al., 2010)
2.4 SCN2.4: SLR30 + RVCNA
SCN1 + Upstream hydropower and main stream dams in the RVCNA model (based on Hannu Lauri, 2011)
3 SCN3: SCN1 + CloseW
SCN1 + Cailon and Caibe sluice gates (close two large river at the West Sea-Gulf of Thailand) + sea dikes
4 SCN4:
SCN2 + CloseW SCN2.1 + Cailon and Caibe sluice gates (close two large river at the West Sea-Gulf of Thailand) + sea dikes
5 SCN5: SCN4 + CloseAll
SCN4 + Hamluong and Cochien sluice gates (close 2 main Mekong river mounts)

I.2.1 Sources of data and information from upstream Mekong River Basin (MRB)
The data and information at the upstream MRB is updated from various sources, including data on meteorology and hydrology; data on land use and agriculture; data on hydropower development. The main source of data achieved from MRC programs as Water Utilization Program (WUP, 2001-2005), Basin development Plan (BDP, 2001-2010) and Hydropower Program (HP, 2005-2010).
The data were checked and supplemented by a variety of applications in the Mekong River Basin, e.g. the applications within MRC program such as WUP, BDP Phase 2; IKMP. Through national research projects, such as studies carried out by VNMC and concerned agencies, Research Institutes and Universities.
The data on operational schedule of reservoirs and hydropower plants, most of the hydropower is on the feasibility study stage or on the designing stage, therefore the operation schedule information was not available or unofficial, except some information available for Ialy hydropower dam and some reservoirs in Thailand. The lack of reservoir operation schedule were estimated based on estimated inflow condition to the reservoirs, the installed capacity, the expected power production..., the operation schedule is established.
The assumptions are given as:
- 'Optimal dam operation': it was assumed that the hydropower plant will reduce the number of operated turbines in case of drought year to ensure continuous operation of the hydropower reservoirs, at least one unit. The advantage of this operation is to maintain the continuous increase of the downstream flow. However, the disadvantage of this type of operation is that it does not always operate at full generating capacity;
- 'Operation based on power demand': this mode is driven by the power demand and means that even when water levels drop dam operators try to maintain the power output. While there is the aim to maintain a number of turbine units to operate at minimal productivity there is the risk that the whole hydropower plant has to shut down because the reservoir water level reaches the dead storage level. In such cases during dry years the ability to maintain continuous regulated high flow to downstream of reservoir is low.
I.2.2 Some limitation and uncertain factors
- There is a large number of hydropower dams and inconsistency of data and information as each future hydropower plant has a number of options to design and operate. This study cannot consider the full range of possible combinations of operational scenarios of upstream hydropower reservoirs. Instead the two extremes are assumed as outlined above (optimal operation and based on power demand) and combined with the available hydrologic data series from 1985-2000;
- The limitations coming with the use of simulation tools, including the use of the DSF model and the IQQM model, as not all required input data was available in particular regarding the operation of dams;
- There are critical uncertainties regarding the inflow to existing and future reservoirs in particular due to the loss of forest area for hydropower development and due to resettlements and population growth. These factors suggest that the future inflow into reservoirs will change. Additionally, climate change is likely to introduce changes in precipitation levels and in climate variability.
I.2.3 Consideration for upstream boundary condition
- The dry season flow of the recent severely dry hydrological year was used for the simulation. The year 2005 was selected, which was considered as a drought year with substantial salinity intrusion in the Mekong delta (used in SCN0, SCN1, SCN3) ;

- Assuming similar flow conditions as in 2005, upstream development is modelled, in particularly the near future dams with 'operation based on the power demand' (SCN2.1, SCN4 and SCN5);
- The model requires assumption regarding upstream flow, which involves several uncertainties, as mentioned above. These uncertain factors include, for instance the forest area and climate change conditions. However, this report considers flow data based on the flow frequency analysis of a series of hydrologic data to Kratie from 1924 to present, corresponding to 85% flow frequency (a return period of about 7 year / time). In addition to the actual flow assumption, a scenario for reduced flow in the near future dams scenario was considered in combination with the assumption 'operation based on power demand' (SCN 2.2)
- The assumption on upstream flow in the near future dams scenario with 'optimum operation' considered increased flow similar to 1988 ( SCN 2.3)
- Upstream flow is considered to be affected by additional hydropower development in scenario SCN2.4. This scenario assumes 126 dams, which exceeds the near future dam assumption and includes mainstream hydropower in the LMB and takes into account climate change. These assumptions on flow and climate change are based on 'lowest flow' in 2038 in the RVCNA scenario done by Hannu.
I.2.4 Description of input data to for scenarios
Physical condition (water management constructions):
The physical conditions of the baseline simulated year (2005) is used for SCN0 and SCN1; upstream development will be added to SCN2; Cailon and Caibe sluice gates at the two main rivers at the West Sea (Gulf of Thailand) and sea dike (Nguyen Ngoc Anh, 2010 and annex 4 ) will be included into SCN3 and SCN4; the Hamluong and Cochien sluice gates at the two Mekong river’s mouths will be included in SCN5 (table 2).
Table 2: Description of basic physical changes in simulated scenarios
No Physical change Description of the change 1 SCN2.1-2.3: Upstream
development (see table 3)
- 8 Chinese dams - in addition, 36 Lower Mekong Basin dams (except the lower mainstream dams, as they are considered as the ‘run-of-river’ hydropower - impact mainly to the silt deposit and to the flow by type of operation)
2 SCN2.4: Upstream development including mainstream dams
Obtained the results from Hannu Lauri, EIA Ltd. 2011, including 126 reservoirs in Mekong river basin, in which 6 mainstream dams from China and 10 mainstream dams in lower Mekong basin (see Table 4)
3 SCN3 and SCN4: Cailon and Caibe sluice gates
Dimension of each sluice is assumed as 80% of the width of the river’s cross-section (similar to the other sluices in the VMD).
4 SCN5: Cailon, Caibe, Hamluong and Cochien sluices
Dimension of each sluice is assumed as 80% of the width of the river’s cross-section.

Table 3: List of simulated hydropower dams in the near future condition (Sources: Nguyen Quang Kim and To Quang Toan et
al, 2010; MRC/BDP, 2010a,b; MRC/BDP-phase2, 2009; MRC, 2008; MRC, 2009; MRC, 2010a,b,c,d)
No Hydropower dams Country Active volume (106 m3) Installed capacity (MW) 1 Gonggouqiao Dam CN 120 750
2 Xiaowan dam CN 9,850 4200
3 Manwan dam CN 258 1500
4 Dachaoshan dam CN 267 1350
5 Nuozhadu dam CN 12,400 5500
6 Jinghong dam CN 249 1500
7 Nam Ngum Dam L 4790 150 8 N Theun- Hin Boun Dam L 15 210 9 Nam Leuk Dam L 154 60 10 Houay Ho Dam L 527 150 11 Nam Song diversion weir L 12 - 12 Nam Ngum 2 dam L 2022 615
13 NamThuen2 Dam L 3370 1080
14 XeSet2 Dam L 9 76
15 Xekaman3 Dam L 467 250
16 Xekaman1 Dam L 3300 468
17 Nam Ngum 5 Dam L 252 100
18 Nam Mang3 L 45 40
19 Xekaman2 Dam L 216 100 20 NamLik2 Dam L 830 100
21 Lam Ta Kong Dam T 310 500 22 Ubol Ratana Dam T 2263.6 25.2 23 Lam Pao Dam T 1430 - 24 Sirindhorn Dam T 1966 1135 25 Pak Mun Dam T 250 136 26 Nam Un Dam T 520 20 27 Nam Pung Dam T 165 6.3 28 Chulabhorn Dam T 188 40 29 Lam Phra Pleng Dam T 156 - 30 Huai Luang Dam T 23 1.3 31 Lam Nang Rong Dam T 121 - 32 Upper Mun Reservoir T 141 - 33 Ya Li Dam V 779 720 34 Plei Krong Dam V 948 100
35 SeSan3 Dam V 3.8 260
36 SeSan3A Dam V 4 96
37 Tourash Dam V 482 86
38 BuonKop Dam V 14 280
39 Srepok3 Dam V 75 220
40 Srepok4 Dam V 25 40
41 Sesan4 Dam V 264 360 42 Sesan4A-Res V 8.3 7.5
Notes: CN: China; L: Lao PDR; T: Thailand; V: Vietnam
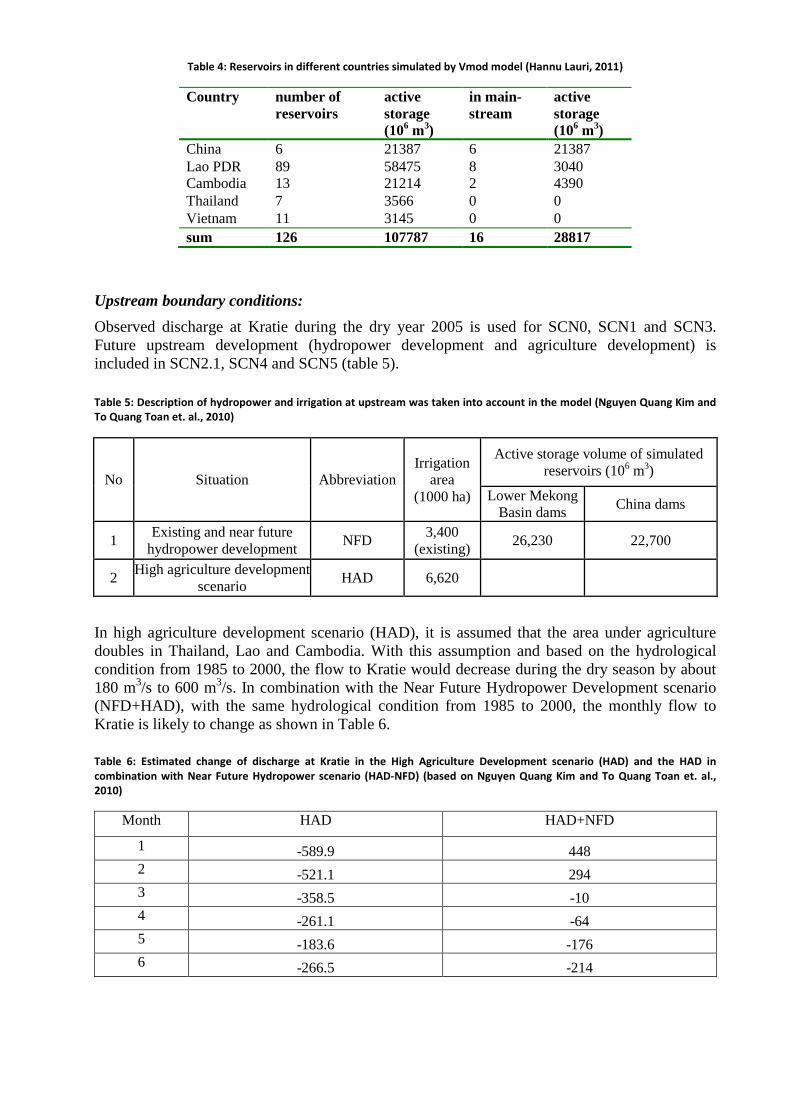
Table 4: Reservoirs in different countries simulated by Vmod model (Hannu Lauri, 2011)
Country number of reservoirs
active storage (106 m3)
in main-stream
active storage (106 m3)
China 6 21387 6 21387 Lao PDR 89 58475 8 3040 Cambodia 13 21214 2 4390 Thailand 7 3566 0 0 Vietnam 11 3145 0 0 sum 126 107787 16 28817
Upstream boundary conditions:
Observed discharge at Kratie during the dry year 2005 is used for SCN0, SCN1 and SCN3. Future upstream development (hydropower development and agriculture development) is included in SCN2.1, SCN4 and SCN5 (table 5).
Table 5: Description of hydropower and irrigation at upstream was taken into account in the model (Nguyen Quang Kim and
To Quang Toan et. al., 2010)
No Situation Abbreviation Irrigation
area (1000 ha)
Active storage volume of simulated reservoirs (106 m3)
Lower Mekong Basin dams
China dams
1 Existing and near future
hydropower development NFD
3,400 (existing)
26,230 22,700
2 High agriculture development
scenario HAD 6,620
In high agriculture development scenario (HAD), it is assumed that the area under agriculture doubles in Thailand, Lao and Cambodia. With this assumption and based on the hydrological condition from 1985 to 2000, the flow to Kratie would decrease during the dry season by about 180 m3/s to 600 m3/s. In combination with the Near Future Hydropower Development scenario (NFD+HAD), with the same hydrological condition from 1985 to 2000, the monthly flow to Kratie is likely to change as shown in Table 6.
Table 6: Estimated change of discharge at Kratie in the High Agriculture Development scenario (HAD) and the HAD in
combination with Near Future Hydropower scenario (HAD-NFD) (based on Nguyen Quang Kim and To Quang Toan et. al.,
2010)
Month HAD HAD+NFD
1 -589.9 448 2 -521.1 294 3 -358.5 -10 4 -261.1 -64 5 -183.6 -176 6 -266.5 -214
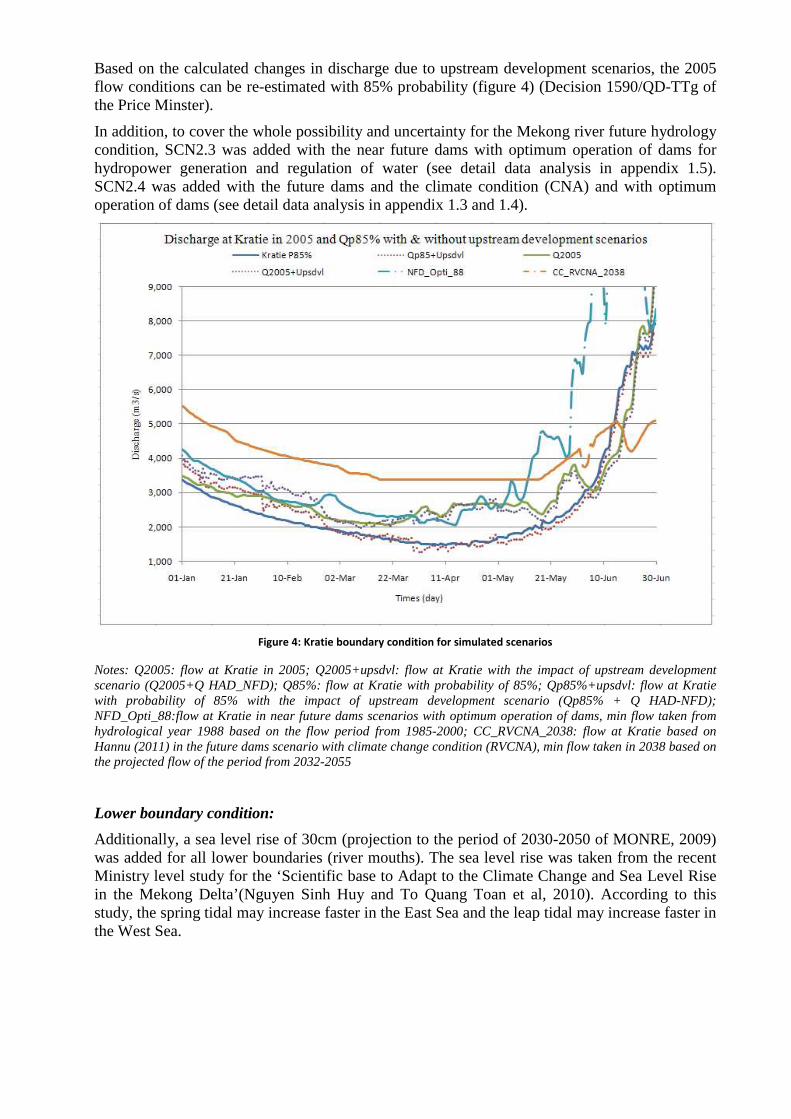
Based on the calculated changes in discharge due to upstream development scenarios, the 2005 flow conditions can be re-estimated with 85% probability (figure 4) (Decision 1590/QD-TTg of the Price Minster).
In addition, to cover the whole possibility and uncertainty for the Mekong river future hydrology condition, SCN2.3 was added with the near future dams with optimum operation of dams for hydropower generation and regulation of water (see detail data analysis in appendix 1.5). SCN2.4 was added with the future dams and the climate condition (CNA) and with optimum operation of dams (see detail data analysis in appendix 1.3 and 1.4).
Figure 4: Kratie boundary condition for simulated scenarios
Notes: Q2005: flow at Kratie in 2005; Q2005+upsdvl: flow at Kratie with the impact of upstream development scenario (Q2005+Q HAD_NFD); Q85%: flow at Kratie with probability of 85%; Qp85%+upsdvl: flow at Kratie with probability of 85% with the impact of upstream development scenario (Qp85% + Q HAD-NFD); NFD_Opti_88:flow at Kratie in near future dams scenarios with optimum operation of dams, min flow taken from hydrological year 1988 based on the flow period from 1985-2000; CC_RVCNA_2038: flow at Kratie based on Hannu (2011) in the future dams scenario with climate change condition (RVCNA), min flow taken in 2038 based on the projected flow of the period from 2032-2055
Lower boundary condition:
Additionally, a sea level rise of 30cm (projection to the period of 2030-2050 of MONRE, 2009) was added for all lower boundaries (river mouths). The sea level rise was taken from the recent Ministry level study for the ‘Scientific base to Adapt to the Climate Change and Sea Level Rise in the Mekong Delta’(Nguyen Sinh Huy and To Quang Toan et al, 2010). According to this study, the spring tidal may increase faster in the East Sea and the leap tidal may increase faster in the West Sea.

Table 7: The spring and leap tidal variation change in East and West sea (Nguyen Sinh Huy and To Quang Toan et al, 2010)
Station Season γ peak γ low
Vung Tau (East Sea) Dry 1.37 ≈1.00
Flood 1.55 1.20
Xeo Ro (West Sea) Dry 1.00 1.32
Flood 1.15 1.35
Figure 5: Tidal boundary condition at My Thanh station on 2005 and SLR 30 cm (Nguyen Sinh Huy and To Quang Toan et al,
2010)
Figure 6: Tidal boundary condition at Xeo Ro station on 2005 and SLR 30 cm (Nguyen Sinh Huy and To Quang Toan et al,
2010)

Inside of the VMD:
The delta is divided into 120 zones, which is based on the physical, topography and administrative boundaries. Each zone has a detailed crop area and crop calendar, climate condition of 2050 was projected based on the national projection for climate change scenarios. A new schematization for water demand was developed for this study as was given in table 8.
Figure 7: Irrigation water demand model for the Mekong delta

Table 8: Rice crop area by Provinces for the baseline year (2005) (Nguyen Quang Kim and To Quang Toan et al,
2010; Nguyen Sinh Huy and To Quang Toan et al, 2010)
Provinces Rice crop area (1000 ha)
Winter – Spring Summer Autumn –
Autumn Winter Main Rice
Long An 235.5 174.9 18.9
Dong Thap 203.3 264.4 0
An Giang 223.3 298.1 8.3
Tien Giang 85.7 166.2 0
Vinh Long 70.9 132.2 0
Ben Tre 21.8 24 37.7
Kien Giang 250.8 299.8 45.2
Can Tho 93.4 138.6 0
Hau giang 85.4 143.0 0
Tra Vinh 53.6 84.9 93.9
Soc Trang 136 154.4 31.2
Bac Lieu 18.6 58.6 64.1
Ca Mau 0.4 36.2 73
II. Results and discussions.
The model outputs are the monthly salinity levels and duration maps for the five simulated scenarios. The maps are in raster format (grid) with cell side of 200m. All maps are in GIS format that can be open by ArcGIS or ArcView software. For assessing agricultural and water supply impacts 4g/l isohalines are delineated. The water demand of the base year land use (2005) and the land use scenario are also estimated and presented in Annex 1. Discharge, water level, and salinity level of critical locations in the VMD are presented in the annexes 2 and 3 for the proposed scenarios.
The following analysis focuses on the implications of additional agricultural development in the VMD under the projected hydrological changes.
II. 1. The impacts of intensifying rice cultivation on the salinity intrusion in the VMD Comparing the salinity intrusion maps of SCN0 (sea level rise of 30cm and reduced rainfall) and the SCN1 (SCN0 + increased area under rice in upstream VMD provinces), salinity levels of 2g/l are projected to increase only in the Quang Lo Phung Hiep salinity control project (Soc Trang and Bac Lieu provinces) (figure 8). However, the area with salinity level higher than 4g/l are not significantly extended (figure 9a). This implies that the intensification of rice production at the upstream provinces of the VMD will not affect very much salinity in downstream provinces during the dry season.

a. Maximum saline intrusion from Jan to April in SCN0 b. Maximum saline intrusion from Jan to April in SCN1
Sea level rise 30cm + Rainfall pattern change (Climate change) + Based year land use SCN0 + rice intensification (food security)
Figure 8: Maximum saline intrusion in the based scenario and scenario 1 .
a. Change on salinity intrusion area of 4g/l Jan to April in SCN1-SCN0 b. Change on salinity intrusion area of 1-4g/l Jan to April in SCN1-SCN0
- Fresh water means the salinity concentration <1g/l
- Brackish water condition = salinity concentration varies from 1g/l to 4g/l
- Salty condition means the salinity concentration is higher than 4g/l
Figure 9: Change on salinity intrusion between SCN1 and SCN0
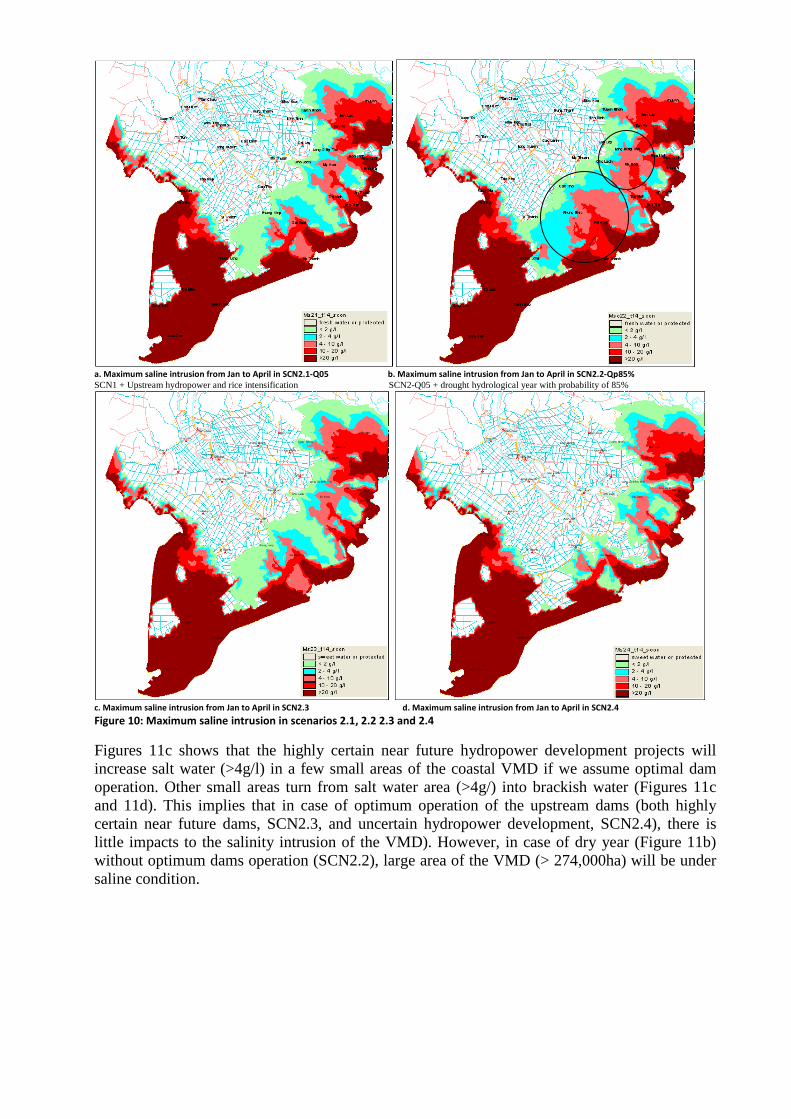
II. 2. The impacts of the upstream hydropower on the salinity intrusion in the VMD The salinity maps of SCN1 (figure 8b) and SCN2.1 (figure 10a) show that under base year conditions (2005) upstream hydropower development as specified for SCN2.1 will not impact salinity intrusion in the VMD years with normal precipitation. However, during a dry year (85% probability drought or return period of 7 years) significant increase in salinity levels and of saline duration will be observed in large areas of the Mekong Delta (figure 10b and 11b). Especially in the Bassac branch of the Mekong River, salinity is projected to intrude Can Tho city and strongly impact on the Quan Lo Phung Hiep and Nam Mang Thit salinity control projects. The other area that is projected to have higher salinity level is the Ben Tre province.
a. Maximum saline intrusion from Jan to April in SCN2.1-Q05 b. Maximum saline intrusion from Jan to April in SCN2.2-Qp85%
SCN1 + Upstream hydropower and rice intensification SCN2-Q05 + drought hydrological year with probability of 85%
c. Maximum saline intrusion from Jan to April in SCN2.3 d. Maximum saline intrusion from Jan to April in SCN2.4
Figure 10: Maximum saline intrusion in scenarios 2.1, 2.2 2.3 and 2.4
Figures 11c shows that the highly certain near future hydropower development projects will increase salt water (>4g/l) in a few small areas of the coastal VMD if we assume optimal dam operation. Other small areas turn from salt water area (>4g/) into brackish water (Figures 11c and 11d). This implies that in case of optimum operation of the upstream dams (both highly certain near future dams, SCN2.3, and uncertain hydropower development, SCN2.4), there is little impacts to the salinity intrusion of the VMD). However, in case of dry year (Figure 11b) without optimum dams operation (SCN2.2), large area of the VMD (> 274,000ha) will be under saline condition.
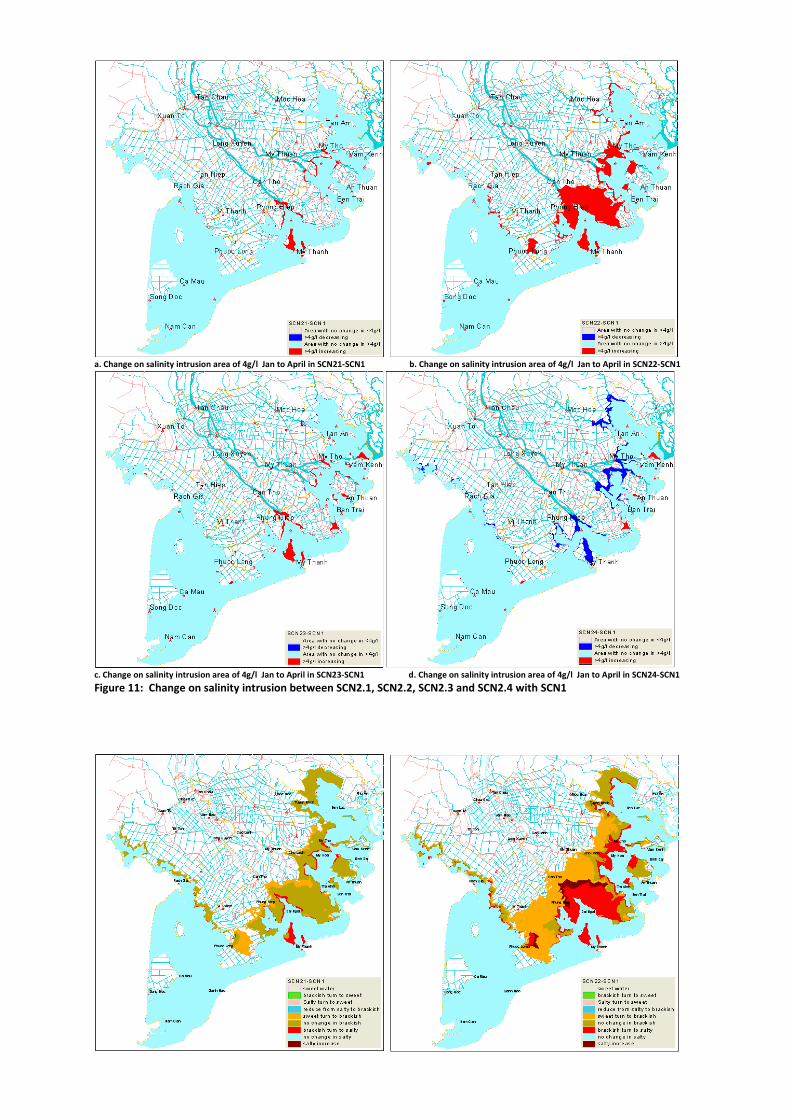
a. Change on salinity intrusion area of 4g/l Jan to April in SCN21-SCN1 b. Change on salinity intrusion area of 4g/l Jan to April in SCN22-SCN1
c. Change on salinity intrusion area of 4g/l Jan to April in SCN23-SCN1 d. Change on salinity intrusion area of 4g/l Jan to April in SCN24-SCN1
Figure 11: Change on salinity intrusion between SCN2.1, SCN2.2, SCN2.3 and SCN2.4 with SCN1

a. Change on salinity intrusion area of 1-4g/l Jan to April in SCN2.1-SCN1 b. Change on salinity intrusion area of 1-4g/l Jan to April in SCN2.2-SCN1
c. Change on salinity intrusion area of 1-4g/l Jan to April in SCN2.3-SCN1 d. Change on salinity intrusion area of 1-4g/l Jan to April in SCN2.4-SCN1 Figure 12: Change on salinity intrusion with brakish water between SCN2.1, SCN2.2, SCN2.3 and SCN2.4 with SCN1
II. 3. The effectiveness of the VMD's sluices solution Figure 13-16 show the effectiveness of the proposed structural measures to control salinity in the Mekong Delta. In SCN3 and 4 the Cai Lon and Cai Be sluices are assumed to operate, protecting effectively large areas in Provinces of Ca Mau and Bac Lieu from saline intrusion (Figure 13a and 13b). Tables 9 and 10 present the gain and loss of fresh and salt water area if the analyzed scenarios. With Cai Lon and Cai Be sluices, there would be 133,000 ha of Ca Mau and Kien Giang province change from salt to fresh water area.
a) Maximum saline intrusion from Jan to April in SCN3 b) Maximum saline intrusion from Jan to April in SCN4
SCN1 + Cailon and Caibe sluice gates + sea dikes SCN2 + Cailon and Caibe sluice gates + sea dikes
Figure 13: Maximum saline intrusion in scenarios 3 and 4

a. Change on salinity intrusion area of 4g/l Jan to April in SCN3-SCN1 b. Change on salinity intrusion area of 4g/l Jan to April in SCN4-SCN1
Figure 14: Change on salinity intrusion between SCN3 and SCN4 with SCN1
a. Change on salinity intrusion area of 1-4g/l Jan to April in SCN3-SCN1 b. Change on salinity intrusion area of 1-4g/l Jan to April in SCN4-SCN1 Figure 15 : Change on salinity intrusion with brackish water between SCN3 and SCN4 with SCN1
Figures 16 and 17 show that the proposed sluices (Cai Lon, Cai Be, Cochien and Hamluong) would significantly reduce the salinity condition of the Mekong branch and therefore reduce the level of salinity in parts of Ca Mau, Kien Giang, Hau Giang, Tra Vinh, and Ben Tre province (273,000ha, see table 9 and 10). However, since the Bassac branch will not be closed, the remaining area close to the Bassac river of Tra Vinh and parts of Soc Trang and Bac Lieu province is projected to be under high salinity level. It should be noted that this model only simulated the salinity intrusion of the VMD under the proposed major sluice gates. Enclosing of the VMD can cause serious environment problems such as acidity from acid sulphate soils, water pollution from domestic and industrial waste water. Therefore, a detailed environment impact assessment should be performed in future research.

Figure 22: Maximum saline intrusion from Jan to April in SCN5
SCN4 + Hamluong and Cochien sluice gates
Figure 16: Maximum saline intrusion in scenario 5
a. Change on salinity intrusion area of 4g/l Jan to April in SCN5-SCN0 b. Change on salinity intrusion area of 1-4g/l Jan to April in SCN5-SCN0
Figure 17: Change on salinity intrusion between SCN5 and SCN0
Table 9: Calculated the affected area by salinity intrusion in the Mekong delta of Vietnam (1000 ha)
No Salinity condition SCN0 SCN1 SCN21 SCN22 SCN23 SCN24 SCN3 SCN4 SCN5
1 Fresh water 1695 1645 1575 1339 1572 1920 1868 1800 1974
2 < 2 g/l 481 499 486 351 490 350 402 425 525
3 2 - 4 g/l 220 223 266 403 253 177 229 229 141
4 4 - 10 g/l 271 293 319 457 327 250 303 329 214
5 10 - 20 g/l 273 279 289 367 293 255 329 342 271
6 >20 g/l 987 989 993 1012 993 976 796 803 803
Impacts on rice area (>4g/l)
No Salinity condition SCN0 SCN1 SCN21 SCN22 SCN23 SCN24 SCN3 SCN4 SCN5
1 Fresh water or protected 1695 1645 1575 1339 1572 1920 1868 1800 1974
2 <4gl 702 722 752 754 743 526 631 654 666
3 >4gl 1532 1561 1601 1835 1613 1481 1429 1474 1288

Table 10: Salinity intrusion of simulated scenarios compare with baseline SCN0 and SCN1(1000 ha)
No Salinity condition SCN1- SCN0
SCN21- SCN1
SCN22- SCN1
SCN23- SCN1
SCN24- SCN1
SCN3- SCN1
SCN4- SCN1
SCN5- SCN1
1 Fresh water -50 -70 -306 -73 275 223 155 329
2 < 2 g/l 17 -12 -148 -9 -149 -96 -74 26
3 2 - 4 g/l 3 42 180 30 -47 6 6 -82
4 4 - 10 g/l 22 25 163 33 -43 10 36 -79
5 10 - 20 g/l 6 10 87 14 -24 50 63 -8
6 >20 g/l 1 5 23 5 -13 -192 -186 -186
Impacts on rice area (>4g/l)
No Salinity condition SCN1- SCN0
SCN21- SCN1
SCN22- SCN1
SCN23- SCN1
SCN24- SCN1
SCN3- SCN1
SCN4- SCN1
SCN5-SCN1
1 Fresh water or protected -50 -70 -306 -73 275 223 155 329
2 <4gl 20 30 32 21 -196 -91 -68 -56
3 >4gl 30 39 274 52 -80 -133 -87 -273
Note: (-) minus value means decreasing area, opposite means increasing area
Table 11: Comparison of salinity intrusion of simulated scenarios with SCN2.2 Unit: 1000 ha
No Salinity condition SCN2.4- SCN2.2 SCN3- SCN2.2 SCN4 - SCN2.2 SCN5-
SCN2.2
1 fresh water or protected 581 529 461 635
2 < 2 g/l -1 52 74 174
3 2 - 4 g/l -226 -174 -174 -262
4 4 - 10 g/l -206 -154 -128 -242
5 10 - 20 g/l -111 -37 -24 -95
6 >20 g/l -36 -215 -209 -209
Clarify for rice cultivation condition (4g/l)
No Salinity condition SCN1 - SCN0 SCN21- SCN1 SCN22 - SCN1 SCN23 -
SCN1
1 fresh water or protected 581 529 461 635
2 <4gl -227 -123 -100 -88
3 >4gl -354 -407 -361 -547
Note: (-) minus value means decreasing area, opposite means increasing area
Table 12: Salinity intrusion of simulated scenarios compare with baseline SCN0 and SCN1(1000 ha)
No
Salinity condition SCN1- SCN0
SCN21- SCN1
SCN22- SCN1
SCN23- SCN1
SCN24- SCN1
SCN3- SCN1
SCN4- SCN1
SCN5- SCN1
1 Brackish turn to fresh 0 0 0 7 214 84 41 267 2 Salty turn to fresh 0 0 0 0 0 89 87 167 3 Salty turn to brackish 0 0 0 4 95 61 39 127 4 Fresh turn to brackish 44 91 360 102 17 22 43 14 5 Brackish turn to salty 30 0 239 49 9 12 32 20 6 Improving 0 1 0 11 308 235 166 561 7 Worsen 74 91 599 151 26 34 75 34
Note: - Fresh water means the salinity concentration <1g/l
- Brackish water condition means the salinity concentration varies from 1g/l to 4g/l - Salty condition means the salinity concentration is higher than 4g/l
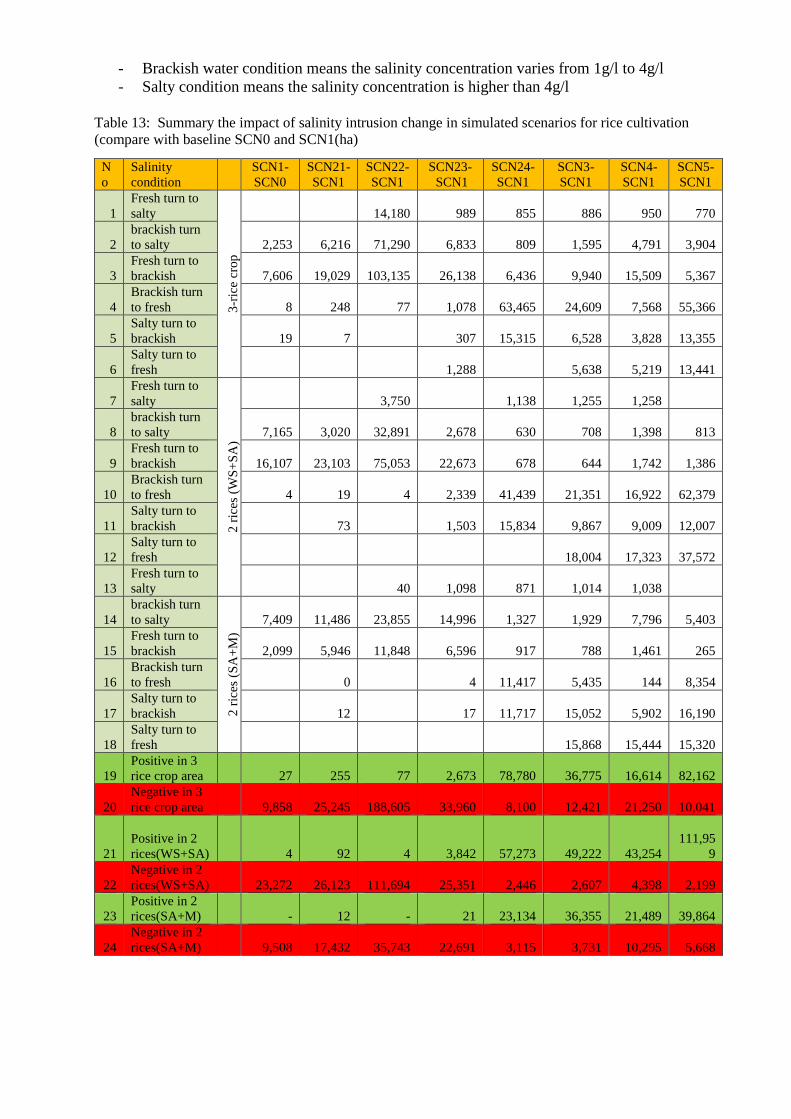
Table 13: Summary the impact of salinity intrusion change in simulated scenarios for rice cultivation (compare with baseline SCN0 and SCN1(ha)
No
Salinity condition
SCN1- SCN0
SCN21- SCN1
SCN22- SCN1
SCN23- SCN1
SCN24- SCN1
SCN3- SCN1
SCN4- SCN1
SCN5- SCN1
1 Fresh turn to salty
3-r
ice
crop
14,180
989
855
886
950
770
2 brackish turn to salty
2,253
6,216
71,290
6,833
809
1,595
4,791
3,904
3 Fresh turn to brackish
7,606
19,029
103,135
26,138
6,436
9,940
15,509
5,367
4 Brackish turn to fresh
8
248
77
1,078
63,465
24,609
7,568
55,366
5 Salty turn to brackish
19
7
307
15,315
6,528
3,828
13,355
6 Salty turn to fresh
1,288
5,638
5,219
13,441
7 Fresh turn to salty
2 r
ices
(W
S+
SA
)
3,750
1,138
1,255
1,258
8 brackish turn to salty
7,165
3,020
32,891
2,678
630
708
1,398
813
9 Fresh turn to brackish
16,107
23,103
75,053
22,673
678
644
1,742
1,386
10 Brackish turn to fresh
4
19
4
2,339
41,439
21,351
16,922
62,379
11 Salty turn to brackish
73
1,503
15,834
9,867
9,009
12,007
12 Salty turn to fresh
18,004
17,323
37,572
13 Fresh turn to salty
40
1,098
871
1,014
1,038
14 brackish turn to salty
2 r
ices
(S
A+
M)
7,409
11,486
23,855
14,996
1,327
1,929
7,796
5,403
15 Fresh turn to brackish
2,099
5,946
11,848
6,596
917
788
1,461
265
16 Brackish turn to fresh
0
4
11,417
5,435
144
8,354
17 Salty turn to brackish
12
17
11,717
15,052
5,902
16,190
18 Salty turn to fresh
15,868
15,444
15,320
19 Positive in 3 rice crop area
27
255
77
2,673
78,780
36,775
16,614
82,162
20 Negative in 3 rice crop area
9,858
25,245
188,605
33,960
8,100
12,421
21,250
10,041
21 Positive in 2 rices(WS+SA)
4
92
4
3,842
57,273
49,222
43,254
111,95
9
22 Negative in 2 rices(WS+SA)
23,272
26,123
111,694
25,351
2,446
2,607
4,398
2,199
23 Positive in 2 rices(SA+M)
-
12
-
21
23,134
36,355
21,489
39,864
24 Negative in 2 rices(SA+M)
9,508
17,432
35,743
22,691
3,115
3,731
10,295
5,668

a. Impact of salinity intrusion change to rice crop area in SCN2.1-SCN1 ba. Impact of salinity intrusion change to rice crop area in SCN2.2-SCN1
a. Impact of salinity intrusion change to rice crop area in SCN2.4-SCN1 ba. Impact of salinity intrusion change to rice crop area in SCN5-SCN1 Figure 18: Impact of salinity intrusion change on some selected scenario to rice crop area in comparison with SCN1
II.4 Implication for land use planning in the VMD under Climate Change, sea-level rise and upstream development projects Overlaying projected saline intrusion maps and proposed land use maps that aim for food security allows identifying areas under different land uses that would be affected by saline intrusion under the projected scenarios. This aims to support land use planning policy for the VMD and adaptation measures to climate change, sea level rise, and especially to the possible upstream development projects, which influence hydrological conditions of the Mekong River. Additionally, model results for water demand show that under climate change assumptions water demand increase significantly in the rice intensification scenario, during the early stage of Winter-Spring crop (December - February) and Summer - Autumn crop (May - June) (see Annex 1 Figure a2). This information is important for land use planners to specify suitable cropping calendars or suitable crops for adapting to changes in water availability.
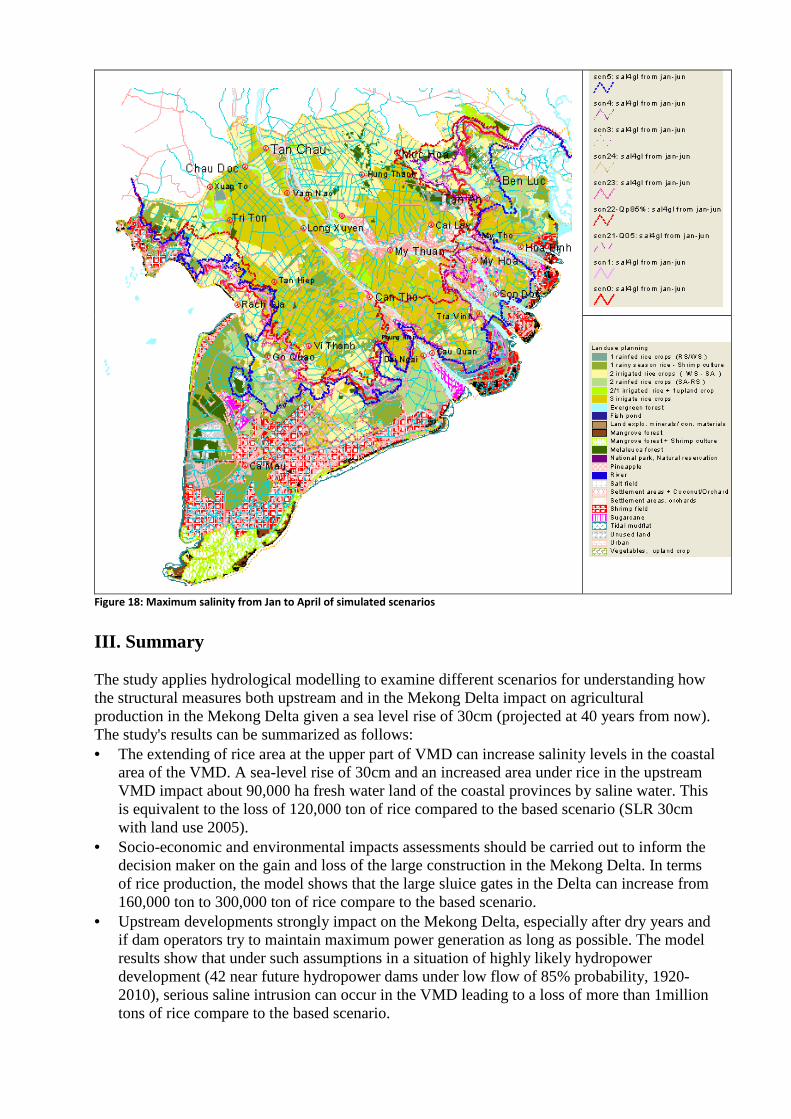
Figure 18: Maximum salinity from Jan to April of simulated scenarios
III. Summary The study applies hydrological modelling to examine different scenarios for understanding how the structural measures both upstream and in the Mekong Delta impact on agricultural production in the Mekong Delta given a sea level rise of 30cm (projected at 40 years from now). The study's results can be summarized as follows: • The extending of rice area at the upper part of VMD can increase salinity levels in the coastal
area of the VMD. A sea-level rise of 30cm and an increased area under rice in the upstream VMD impact about 90,000 ha fresh water land of the coastal provinces by saline water. This is equivalent to the loss of 120,000 ton of rice compared to the based scenario (SLR 30cm with land use 2005).
• Socio-economic and environmental impacts assessments should be carried out to inform the decision maker on the gain and loss of the large construction in the Mekong Delta. In terms of rice production, the model shows that the large sluice gates in the Delta can increase from 160,000 ton to 300,000 ton of rice compare to the based scenario.
• Upstream developments strongly impact on the Mekong Delta, especially after dry years and if dam operators try to maintain maximum power generation as long as possible. The model results show that under such assumptions in a situation of highly likely hydropower development (42 near future hydropower dams under low flow of 85% probability, 1920-2010), serious saline intrusion can occur in the VMD leading to a loss of more than 1million tons of rice compare to the based scenario.

• In case of optimal dam operation even all 126 upstream hydropower dams would improve hydrological conditions in the VMD, increasing rice production in the VMD by more than 300,000 tons if compared with the based scenario. This emphasizes the importance of collaboration among riparian countries on hydro-power operation and irrigation development projects to mitigate the negative impacts on the VMD. However, It is essential to have further study to examine the impacts of 126 upstream hydro-dams under non-optimum operation to the VMD in specific and the Mekong Basin in general.

REFERENCES 1. Decision 1590/QD-TTg dated 9 Oct 2009 of Prime Minister, Strategy for water resources
development in Vietnam. Government of Vietnam. 2. ICEM, 2009, Inception Report: MRC SEA For Hydropower on the Mekong Mainstream,
International Centre For Environmental Management. ICEM. 3. Nguyen Quang Kim, To Quang Toan, et. al., 2010. An investigation on the efficient use of
water related to the upstream development scenarios to prevent drought and salinity intrusion in the Mekong delta – National project KC08-11/06-10. Hanoi Water Resources University (HWR) & Southern Institute of Water Resources Research (SIWRR).
4. Nguyen Sinh Huy, To Quang Toan, et. al., 2010. Scientific base for adaptation measures for climate change and sea water level rise to the Mekong delta; Ministry level project. Hanoi Water Resources University.
5. Nguyen Ngoc Anh, 2010. Water resources planning in the Mekong delta to adapt with climate change condition; Southern Institute for Water Resources Planning and projection (SIWRP).
6. MRC, 2003, State of the Basin Report. MRC Phnom Penh. 7. MRC, 2008a, An assessment of water quality in the Lower Mekong Basin. 8. MRC, 2008b, Fast Track Scenarios of Basin Development Plan (MRCS): Model Simulations
Using DSF. 9. MRC, 2009a, IWRM-Based Basin Development Strategy for the Lower Mekong Basin. 10. MRC, 2009b, Economic, Environment and Socical Impact Assessment of Basin-wide
Development Scenarios, 7th Regional Technical Working Group Meeting papers. 11. MRC/BDP, 2010a. Evaluation of basin-wide development scenarios; MRC. 12. MRC/BDP, 2010b, Technical note 5, 8, 9, 10 and 11, evaluation the impact on water quality,
salinity intrusion, wetlands, biodiversity, and aquatic lives. MRC. 13. MRC/BDP-phase2, 2009, Hydropower Sector review for the Joint Basin Planning Process. 14. MRC, 2010a, Evaluation of Basin-wide Development Scenarios, 9th Regional Technical
Working Group Meeting papers. 15. MRC, 2010b, Assessment of Basin-wide Development Scenarios, Technical report. 16. MRC, 2010c, Technical guideline for Guidelines for the Procedures for Maintenance of
Flows on the Mainstream (PMFM), 8th Meeting of The Technical Review Group. 17. MRC, 2010d, State of the Basin Report, Vientiane, Lao PDR. 18. MRC, DSF, Decision Support Framework. 19. MONRE. 2009. Vietnam National projection for Climate change. 20. Hannu Lauri, EIA Ltd., 2011, Vmod hydrological model MKF 5km reservoir scenario

ANNEX 1 1.1 Water demand for land use 2005 in the present climate condition and CC in 2050
Figure a1: Summary of MD irrigation water demand in land-use 2005 with present climate condition and CC in 2050
1.2. Water demand for proposed land use planning in 2050 and climate change scenario in 2050
Table a1: Proposed land use planning in 2050 in MF’ scenario
Provinces Proposed crop area (ha)
W-S rice S-A rice A-W rice Main rice Dry crop
An Giang 274,512 271,848 171,498 - 22,941
Bạc Liêu 1,893 73,851 33,297 29,432 530
Bến Tre 37,541 50,292 36,549 13,164 -
Cà Mau 33,245 16,692 - 86,526 -
Cần Thơ 86,261 86,261 62,792 16,318 45
Đồng Tháp 257,788 257,788 64,585 - 36,266
Hậu Giang 87,396 87,396 46,478 1,230 437
Kiên Giang 282,679 260,463 103,647 81,108 -
Long An 254,440 283,644 47,057 41,161 23,396
Sóc Trăng 100,430 152,205 34,534 79,571 2,515
Tiền Giang 92,403 88,956 76,293 5,882 224
Trà Vinh 81,975 79,533 45,883 26,341 -
Vĩnh Long 82,747 82,747 70,619 151 8,285
Total 1,733,310 1,791,674 793,232 380,884 94,640

Figure a2: Summary of MD irrigation water demand in MF’ land-use planning with climate condition in 2050
1.3 The average of the the monthly average discharge to Kratie from 2032-2055 (Data obtained from Hannu Lauri, EIA Ltd., 2011 and analysed by To Quang Toan)
Table a2: average of monthly discharge from 2032 to 2055 at Kratie in climate change scenarios
Month RVBL RVCCA RVCCB RVCNA RVCNB RVGIA RVGIB RVMPA RVMPB RVNCA RVNCB RVE
Jan 5209 5555 5378 4880 5194 5181 5015 5952 5675 5732 5590 5195
Feb 4517 4828 4704 4224 4475 4498 4354 5091 4892 4929 4765 4510
Mar 4127 4406 4328 3872 4094 4123 4010 4635 4445 4481 4339 4124
Apr 3949 4172 4154 3721 3941 3956 3860 4523 4233 4256 4134 3948
May 4190 4397 4614 3934 4196 4312 4021 5086 4436 4886 4613 4210
Jun 7022 7313 7855 6119 6626 7734 6442 7851 6492 8317 7198 7098
Jul 13810 14499 15583 12677 13341 14220 12302 14504 12814 14410 12877 13970
Aug 26946 27960 30792 26886 27873 26395 24091 27341 24715 29633 26102 27121
Sep 32749 39198 35506 30646 31401 31359 30315 40233 39461 39259 37594 32625
Oct 20562 24092 22132 18267 19516 20413 19730 26924 24482 23953 23334 20421
Nov 13256 14483 13645 12227 13210 13027 12592 16890 14406 14825 13890 13168
Dec 7671 8152 7798 7229 7612 7552 7312 8691 8194 8498 7974 7612
Average 12001 13254 13041 11224 11790 11898 11170 13977 12854 13598 12701 12000
Remark: 1)RVCNA scenario was considered as the lowest discharge to Kratie among 12 climate scenarios; 2) red box means the discharge in simulated scenario is smaller then the discharge in baseline scenario (RVBL); 3) the lowest discharge in RVCNA within the period from 2032 to 2055 was fall in 2038.
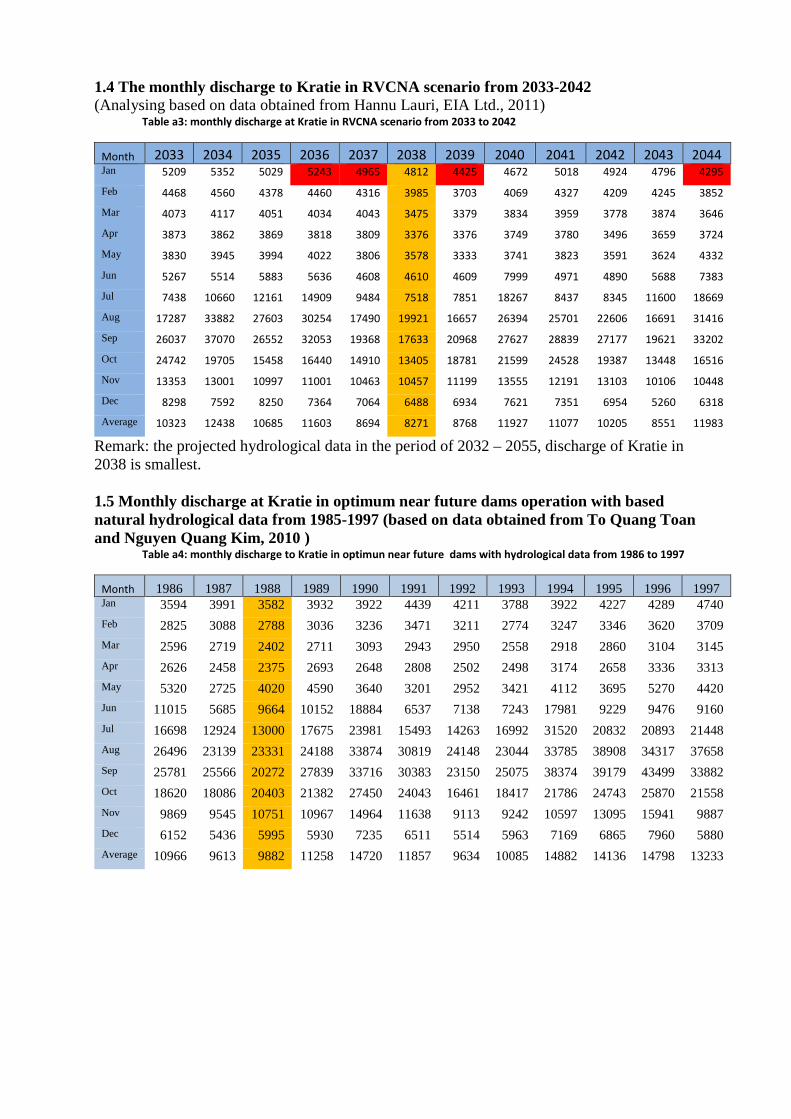
1.4 The monthly discharge to Kratie in RVCNA scenario from 2033-2042 (Analysing based on data obtained from Hannu Lauri, EIA Ltd., 2011)
Table a3: monthly discharge at Kratie in RVCNA scenario from 2033 to 2042
Month 2033 2034 2035 2036 2037 2038 2039 2040 2041 2042 2043 2044
Jan 5209 5352 5029 5243 4965 4812 4425 4672 5018 4924 4796 4295
Feb 4468 4560 4378 4460 4316 3985 3703 4069 4327 4209 4245 3852
Mar 4073 4117 4051 4034 4043 3475 3379 3834 3959 3778 3874 3646
Apr 3873 3862 3869 3818 3809 3376 3376 3749 3780 3496 3659 3724
May 3830 3945 3994 4022 3806 3578 3333 3741 3823 3591 3624 4332
Jun 5267 5514 5883 5636 4608 4610 4609 7999 4971 4890 5688 7383
Jul 7438 10660 12161 14909 9484 7518 7851 18267 8437 8345 11600 18669
Aug 17287 33882 27603 30254 17490 19921 16657 26394 25701 22606 16691 31416
Sep 26037 37070 26552 32053 19368 17633 20968 27627 28839 27177 19621 33202
Oct 24742 19705 15458 16440 14910 13405 18781 21599 24528 19387 13448 16516
Nov 13353 13001 10997 11001 10463 10457 11199 13555 12191 13103 10106 10448
Dec 8298 7592 8250 7364 7064 6488 6934 7621 7351 6954 5260 6318
Average 10323 12438 10685 11603 8694 8271 8768 11927 11077 10205 8551 11983
Remark: the projected hydrological data in the period of 2032 – 2055, discharge of Kratie in 2038 is smallest. 1.5 Monthly discharge at Kratie in optimum near future dams operation with based natural hydrological data from 1985-1997 (based on data obtained from To Quang Toan and Nguyen Quang Kim, 2010 )
Table a4: monthly discharge to Kratie in optimun near future dams with hydrological data from 1986 to 1997
Month 1986 1987 1988 1989 1990 1991 1992 1993 1994 1995 1996 1997 Jan 3594 3991 3582 3932 3922 4439 4211 3788 3922 4227 4289 4740
Feb 2825 3088 2788 3036 3236 3471 3211 2774 3247 3346 3620 3709
Mar 2596 2719 2402 2711 3093 2943 2950 2558 2918 2860 3104 3145
Apr 2626 2458 2375 2693 2648 2808 2502 2498 3174 2658 3336 3313
May 5320 2725 4020 4590 3640 3201 2952 3421 4112 3695 5270 4420
Jun 11015 5685 9664 10152 18884 6537 7138 7243 17981 9229 9476 9160
Jul 16698 12924 13000 17675 23981 15493 14263 16992 31520 20832 20893 21448
Aug 26496 23139 23331 24188 33874 30819 24148 23044 33785 38908 34317 37658
Sep 25781 25566 20272 27839 33716 30383 23150 25075 38374 39179 43499 33882
Oct 18620 18086 20403 21382 27450 24043 16461 18417 21786 24743 25870 21558
Nov 9869 9545 10751 10967 14964 11638 9113 9242 10597 13095 15941 9887
Dec 6152 5436 5995 5930 7235 6511 5514 5963 7169 6865 7960 5880
Average 10966 9613 9882 11258 14720 11857 9634 10085 14882 14136 14798 13233

ANNEX 2 2.1. Hydrological condition in SCN0 Table a5: Mean monthly inflow to Delta at Tan Chau and Chau Doc and outflow to the sea via Mekong river mouths in SCN0
Inflow to Mekong delta
(m3/s) Outflow to the sea via Mekong river mouths
(m3/s)
Month Total
in Tân châu
Châu đốc
Total out
Tiểu &Đại
Hàm luông
Cổ chiên
Cung hầu
Định an
Trần đề
Jan 5717.2 4811.0 906.2 5020.3 1256.4 413.0 555.9 718.8 1152.7 923.6 Feb 4206.5 3550.2 656.3 3218.2 832.8 246.5 430.4 522.2 644.6 541.7 Mar 3047.7 2553.1 494.6 2176.6 549.2 162.3 355.8 408.3 323.5 377.6 Apr 2936.9 2464.6 472.2 2036.0 549.8 174.7 309.2 332.6 296.9 372.8 May 3267.0 2747.1 519.8 2403.6 661.4 179.7 284.4 286.6 475.7 515.8 Jun 5009.8 4241.1 768.8 4487.1 742.4 505.4 529.8 670.2 1151.4 888.0
Average 3941.1 3318.9 622.2 3130.2 740.1 273.3 403.0 477.2 649.3 587.4 Table a6: Summary of max and mean monthly water level at some location in the Mekong delta in SCN0
Month
Tân châu
Châu đốc
Mỹ thuận
Cần Thơ
Mỹ hòa
Sơn đốc
Tân an Bến lức
Max water level
in month
(m)
Jan 1.87 1.74 1.79 1.92 1.83 1.96 1.60 1.66 Feb 1.56 1.49 1.59 1.83 1.60 1.93 1.49 1.47 Mar 1.46 1.43 1.41 1.53 1.43 1.67 1.33 1.32 Apr 1.21 1.20 1.25 1.42 1.28 1.55 1.25 1.16 May 1.21 1.17 1.21 1.37 1.20 1.39 1.11 1.08 Jun 1.47 1.38 1.27 1.46 1.29 1.37 1.17 1.16
Mean water level
in month
(m)
Jan 1.17 1.09 0.71 0.66 0.58 0.50 0.48 0.51 Feb 0.94 0.87 0.56 0.56 0.45 0.40 0.36 0.39 Mar 0.82 0.78 0.54 0.54 0.45 0.42 0.37 0.40 Apr 0.71 0.67 0.43 0.44 0.34 0.31 0.26 0.29 May 0.58 0.53 0.26 0.26 0.17 0.14 0.07 0.10 Jun 0.78 0.70 0.33 0.30 0.19 0.12 0.07 0.09
Mean Average 0.81 0.76 0.46 0.45 0.35 0.31 0.26 0.28 2.2. Hydrological condition in SCN1 Table a7: Mean monthly inflow to Delta at Tan Chau and Chau Doc and outflow to the sea via Mekong river mouths in SCN1
Inflow to Mekong delta
(m3/s) Outflow to the sea via Mekong river mouths
(m3/s)
Month Total
in Tân châu
Châu đốc
Total out
Tiểu &Đại
Hàm luông
Cổ chiên
Cung hầu
Định an
Trần đề
Jan 5714.1 4809.4 904.7 4951.8 1241.5 405.7 548.0 706.4 1136.2 913.9 Feb 4203.2 3548.8 654.4 3140.9 817.0 240.0 420.6 506.9 625.7 530.7 Mar 3042.6 2550.1 492.4 2068.2 527.2 152.6 344.5 390.7 293.4 359.8 Apr 2930.7 2456.6 474.1 1971.9 537.6 169.5 304.4 325.3 275.3 359.7 May 3262.1 2742.4 519.8 2303.5 639.5 168.5 275.2 271.9 448.6 499.8 Jun 4994.6 4229.7 764.9 4361.9 715.7 491.2 518.3 651.9 1116.8 868.0 Average 3934.6 3313.7 620.9 3038.2 720.9 264.1 393.8 462.9 624.0 572.5

Table a8: Summary of max and mean monthly water level at some location in the Mekong delta in SCN1
Month
Tân châu
Châu đốc
Mỹ thuận
Cần Thơ
Mỹ hòa
Sơn đốc
Tân an Bến lức
Max water level
in month
(m)
Jan 1.86 1.74 1.79 1.92 1.83 1.96 1.60 1.66 Feb 1.56 1.49 1.58 1.83 1.60 1.93 1.49 1.47 Mar 1.46 1.43 1.41 1.53 1.43 1.67 1.33 1.31 Apr 1.20 1.20 1.25 1.42 1.27 1.55 1.25 1.16 May 1.21 1.17 1.21 1.36 1.20 1.39 1.10 1.08 Jun 1.47 1.37 1.27 1.46 1.29 1.37 1.16 1.16
Mean water level
in month
(m)
Jan 1.17 1.08 0.71 0.65 0.57 0.50 0.48 0.50 Feb 0.93 0.87 0.56 0.55 0.45 0.40 0.35 0.39 Mar 0.82 0.77 0.53 0.54 0.45 0.42 0.37 0.40 Apr 0.71 0.66 0.43 0.44 0.34 0.31 0.26 0.29 May 0.57 0.52 0.26 0.26 0.17 0.14 0.06 0.10 Jun 0.78 0.69 0.32 0.30 0.19 0.12 0.06 0.09
Mean Average 0.81 0.75 0.46 0.45 0.35 0.31 0.25 0.28 2.3. Hydrological condition in SCN2.1 with upstream flow as 2005
Table a9: Mean monthly inflow to Delta at Tan Chau and Chau Doc and outflow to the sea via Mekong river mouths in
SCN2.1-Q05
Inflow to Mekong delta
(m3/s) Outflow to the sea via Mekong river mouths
(m3/s)
Month Total
in Tân châu
Châu đốc
Total out
Tiểu &Đại
Hàm luông
Cổ chiên
Cung hầu
Định an
Trần đề
Jan 5946.1 5006.7 939.4 5168.0 1290.2 426.2 568.2 737.9 1196.1 949.3 Feb 4321.6 3649.1 672.5 3265.3 845.1 251.4 432.1 524.9 660.5 551.3 Mar 2806.7 2347.0 459.7 1847.4 479.3 131.8 323.9 358.6 230.6 323.0 Apr 2654.1 2218.3 435.8 1706.2 480.3 144.6 279.2 286.1 200.5 315.5 May 2927.9 2454.9 473.0 1984.4 570.0 138.2 245.1 225.2 358.6 447.3 Jun 4669.8 3952.7 717.1 4060.0 649.0 462.9 490.3 608.0 1031.0 818.7 Average 3776.1 3177.1 599.0 2890.0 689.0 250.2 379.9 441.2 581.8 548.0
Table a10: Summary of max and mean monthly water level at some location in the Mekong delta in SCN2.1-Q05
Month
Tân châu
Châu đốc
Mỹ thuận
Cần Thơ
Mỹ hòa
Sơn đốc
Tân an Bến lức
Max water level
in month
(m)
Jan 1.88 1.75 1.79 1.92 1.83 1.96 1.60 1.66 Feb 1.58 1.51 1.59 1.83 1.61 1.93 1.49 1.47 Mar 1.43 1.41 1.41 1.53 1.43 1.67 1.33 1.31 Apr 1.17 1.17 1.24 1.41 1.27 1.55 1.25 1.16 May 1.18 1.14 1.20 1.36 1.19 1.39 1.10 1.08 Jun 1.44 1.36 1.26 1.45 1.29 1.37 1.16 1.16
Mean water level
in month
(m)
Jan 1.19 1.10 0.71 0.66 0.58 0.50 0.48 0.51 Feb 0.94 0.88 0.56 0.56 0.45 0.41 0.35 0.39 Mar 0.79 0.75 0.53 0.53 0.45 0.42 0.37 0.39 Apr 0.68 0.64 0.42 0.43 0.34 0.31 0.26 0.29 May 0.53 0.49 0.25 0.25 0.17 0.14 0.06 0.10 Jun 0.74 0.66 0.31 0.29 0.19 0.12 0.06 0.09
Mean Average 0.79 0.73 0.45 0.44 0.35 0.31 0.25 0.28

2.4. Hydrological condition in SCN2.2 with upstream flow with probability of 85% and upstream development condition Table a11: Mean monthly inflow to delta at Tan Chau and Chau Doc and outflow to the sea via Mekong river mouths in
SCN2.2-Qp85%
Inflow to Mekong delta
(m3/s) Outflow to the sea via Mekong river mouths
(m3/s)
Month Total
in Tân châu
Châu đốc
Total out
Tiểu &Đại
Hàm luông
Cổ chiên
Cung hầu
Định an
Trần đề
Jan 5686.5 4785.8 900.7 4930.4 1236.9 403.6 546.0 703.2 1130.3 910.5 Feb 3882.7 3274.4 608.3 2846.9 750.9 212.6 393.3 464.6 543.4 482.0 Mar 2382.2 1982.4 399.8 1453.3 393.6 94.7 287.8 302.8 117.7 256.8 Apr 1696.2 1397.1 299.1 806.1 285.7 60.2 194.8 155.1 -55.0 165.3 May 2160.6 1796.8 363.8 1243.7 407.7 68.0 175.7 117.7 149.1 325.3 Jun 4747.6 4019.8 727.8 4134.3 664.7 470.4 497.5 619.2 1051.8 830.8 Average 3303.2 2772.1 531.1 2443.1 591.0 208.2 338.3 376.6 455.3 473.8
Table a12: Summary of max and mean monthly water level at some location in the Mekong delta in SCN2.2-Qp85%
Month
Tân châu
Châu đốc
Mỹ thuận
Cần Thơ
Mỹ hòa
Sơn đốc
Tân an Bến lức
Max water level
in month
(m)
Jan 1.86 1.74 1.79 1.91 1.83 1.96 1.60 1.66 Feb 1.54 1.47 1.58 1.83 1.60 1.93 1.49 1.47 Mar 1.40 1.39 1.40 1.52 1.43 1.67 1.33 1.31 Apr 1.09 1.09 1.22 1.39 1.26 1.55 1.25 1.16 May 1.08 1.06 1.17 1.34 1.18 1.39 1.10 1.08 Jun 1.45 1.36 1.27 1.46 1.29 1.37 1.17 1.16
Mean water level
in month
(m)
Jan 1.17 1.08 0.71 0.65 0.57 0.50 0.48 0.50 Feb 0.90 0.84 0.55 0.55 0.45 0.40 0.35 0.39 Mar 0.74 0.71 0.51 0.52 0.44 0.42 0.37 0.39 Apr 0.57 0.55 0.39 0.41 0.32 0.31 0.26 0.28 May 0.44 0.41 0.23 0.23 0.15 0.13 0.06 0.10 Jun 0.75 0.67 0.32 0.29 0.19 0.12 0.06 0.09
Mean Average 0.74 0.69 0.44 0.43 0.34 0.31 0.25 0.28 2.5. Hydrological condition in SCN2.3 with near future dams and optimun dams operation Table a13: Mean monthly inflow to delta at Tan Chau and Chau Doc and outflow to the sea via Mekong river mouths in
SCN2.3-NFD-Opti
Inflow to Mekong delta
(m3/s) Outflow to the sea via Mekong river mouths
(m3/s)
Month Total
in Tân châu
Châu đốc
Total out
Tiểu &Đại
Hàm luông
Cổ chiên
Cung hầu
Định an
Trần đề
Jan 5958.7 5016.2 942.5 5193.8 1296.4 428.9 570.5 741.5 1203.1 953.4 Feb 4202.5 3548.3 654.2 3134.2 815.0 239.5 420.1 506.2 624.0 529.4 Mar 3059.2 2564.2 495.0 2094.1 533.4 155.1 346.6 393.9 300.8 364.2 Apr 2556.9 2134.0 422.9 1619.0 461.7 136.6 271.1 273.4 175.5 300.6 May 3822.8 3226.1 596.7 2812.1 748.5 216.6 323.9 347.7 592.0 583.4 Jun 8289.9 7000.0 1289.9 7534.3 1410.3 786.7 810.3 1109.9 2026.8 1390.5 Average 4579.2 3856.6 722.6 3656.0 856.3 321.9 450.9 552.3 800.7 674.0
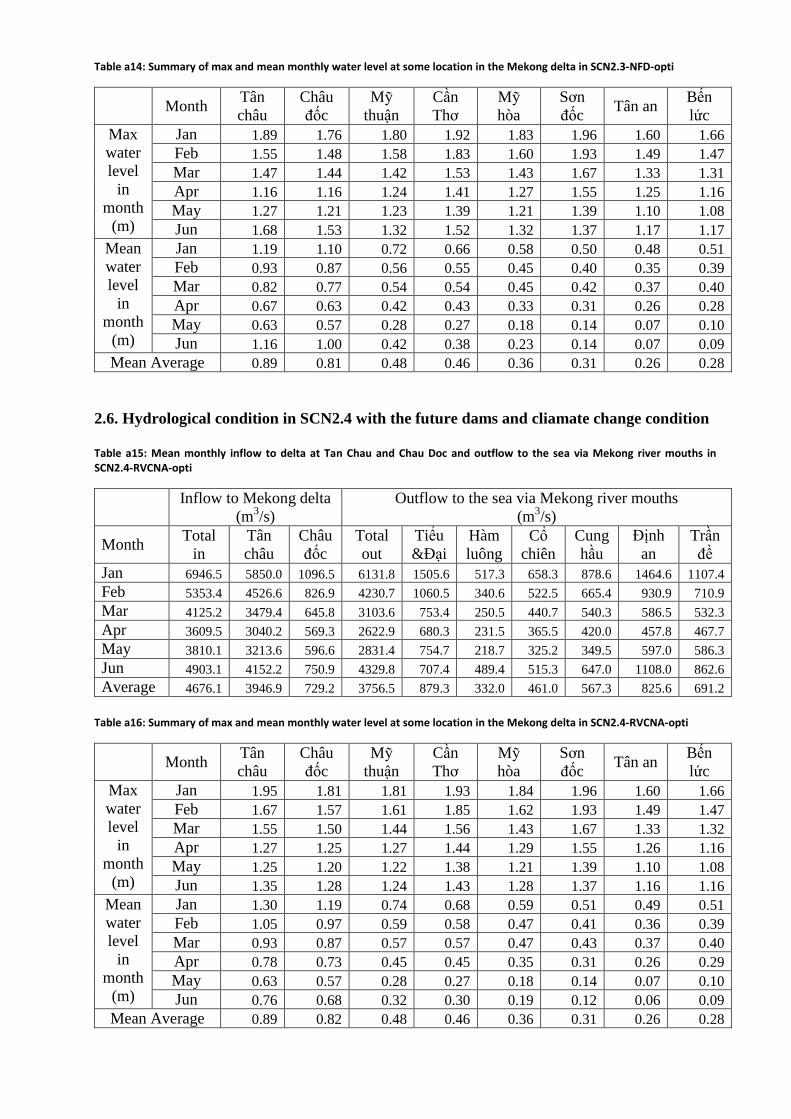
Table a14: Summary of max and mean monthly water level at some location in the Mekong delta in SCN2.3-NFD-opti
Month
Tân châu
Châu đốc
Mỹ thuận
Cần Thơ
Mỹ hòa
Sơn đốc
Tân an Bến lức
Max water level
in month
(m)
Jan 1.89 1.76 1.80 1.92 1.83 1.96 1.60 1.66 Feb 1.55 1.48 1.58 1.83 1.60 1.93 1.49 1.47 Mar 1.47 1.44 1.42 1.53 1.43 1.67 1.33 1.31 Apr 1.16 1.16 1.24 1.41 1.27 1.55 1.25 1.16 May 1.27 1.21 1.23 1.39 1.21 1.39 1.10 1.08 Jun 1.68 1.53 1.32 1.52 1.32 1.37 1.17 1.17
Mean water level
in month
(m)
Jan 1.19 1.10 0.72 0.66 0.58 0.50 0.48 0.51 Feb 0.93 0.87 0.56 0.55 0.45 0.40 0.35 0.39 Mar 0.82 0.77 0.54 0.54 0.45 0.42 0.37 0.40 Apr 0.67 0.63 0.42 0.43 0.33 0.31 0.26 0.28 May 0.63 0.57 0.28 0.27 0.18 0.14 0.07 0.10 Jun 1.16 1.00 0.42 0.38 0.23 0.14 0.07 0.09
Mean Average 0.89 0.81 0.48 0.46 0.36 0.31 0.26 0.28 2.6. Hydrological condition in SCN2.4 with the future dams and cliamate change condition Table a15: Mean monthly inflow to delta at Tan Chau and Chau Doc and outflow to the sea via Mekong river mouths in
SCN2.4-RVCNA-opti
Inflow to Mekong delta
(m3/s) Outflow to the sea via Mekong river mouths
(m3/s)
Month Total
in Tân châu
Châu đốc
Total out
Tiểu &Đại
Hàm luông
Cổ chiên
Cung hầu
Định an
Trần đề
Jan 6946.5 5850.0 1096.5 6131.8 1505.6 517.3 658.3 878.6 1464.6 1107.4 Feb 5353.4 4526.6 826.9 4230.7 1060.5 340.6 522.5 665.4 930.9 710.9 Mar 4125.2 3479.4 645.8 3103.6 753.4 250.5 440.7 540.3 586.5 532.3 Apr 3609.5 3040.2 569.3 2622.9 680.3 231.5 365.5 420.0 457.8 467.7 May 3810.1 3213.6 596.6 2831.4 754.7 218.7 325.2 349.5 597.0 586.3 Jun 4903.1 4152.2 750.9 4329.8 707.4 489.4 515.3 647.0 1108.0 862.6 Average 4676.1 3946.9 729.2 3756.5 879.3 332.0 461.0 567.3 825.6 691.2
Table a16: Summary of max and mean monthly water level at some location in the Mekong delta in SCN2.4-RVCNA-opti
Month
Tân châu
Châu đốc
Mỹ thuận
Cần Thơ
Mỹ hòa
Sơn đốc
Tân an Bến lức
Max water level
in month
(m)
Jan 1.95 1.81 1.81 1.93 1.84 1.96 1.60 1.66 Feb 1.67 1.57 1.61 1.85 1.62 1.93 1.49 1.47 Mar 1.55 1.50 1.44 1.56 1.43 1.67 1.33 1.32 Apr 1.27 1.25 1.27 1.44 1.29 1.55 1.26 1.16 May 1.25 1.20 1.22 1.38 1.21 1.39 1.10 1.08 Jun 1.35 1.28 1.24 1.43 1.28 1.37 1.16 1.16
Mean water level
in month
(m)
Jan 1.30 1.19 0.74 0.68 0.59 0.51 0.49 0.51 Feb 1.05 0.97 0.59 0.58 0.47 0.41 0.36 0.39 Mar 0.93 0.87 0.57 0.57 0.47 0.43 0.37 0.40 Apr 0.78 0.73 0.45 0.45 0.35 0.31 0.26 0.29 May 0.63 0.57 0.28 0.27 0.18 0.14 0.07 0.10 Jun 0.76 0.68 0.32 0.30 0.19 0.12 0.06 0.09
Mean Average 0.89 0.82 0.48 0.46 0.36 0.31 0.26 0.28
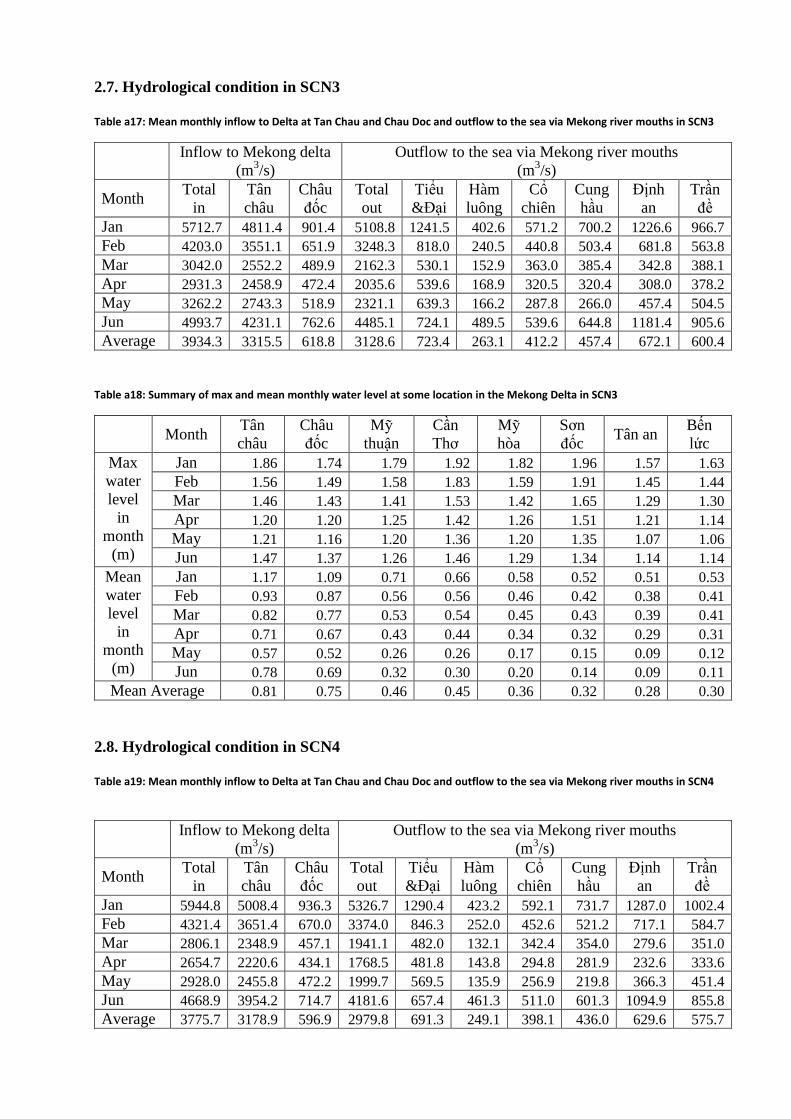
2.7. Hydrological condition in SCN3 Table a17: Mean monthly inflow to Delta at Tan Chau and Chau Doc and outflow to the sea via Mekong river mouths in SCN3
Inflow to Mekong delta
(m3/s) Outflow to the sea via Mekong river mouths
(m3/s)
Month Total
in Tân châu
Châu đốc
Total out
Tiểu &Đại
Hàm luông
Cổ chiên
Cung hầu
Định an
Trần đề
Jan 5712.7 4811.4 901.4 5108.8 1241.5 402.6 571.2 700.2 1226.6 966.7 Feb 4203.0 3551.1 651.9 3248.3 818.0 240.5 440.8 503.4 681.8 563.8 Mar 3042.0 2552.2 489.9 2162.3 530.1 152.9 363.0 385.4 342.8 388.1 Apr 2931.3 2458.9 472.4 2035.6 539.6 168.9 320.5 320.4 308.0 378.2 May 3262.2 2743.3 518.9 2321.1 639.3 166.2 287.8 266.0 457.4 504.5 Jun 4993.7 4231.1 762.6 4485.1 724.1 489.5 539.6 644.8 1181.4 905.6 Average 3934.3 3315.5 618.8 3128.6 723.4 263.1 412.2 457.4 672.1 600.4
Table a18: Summary of max and mean monthly water level at some location in the Mekong Delta in SCN3
Month
Tân châu
Châu đốc
Mỹ thuận
Cần Thơ
Mỹ hòa
Sơn đốc
Tân an Bến lức
Max water level
in month
(m)
Jan 1.86 1.74 1.79 1.92 1.82 1.96 1.57 1.63 Feb 1.56 1.49 1.58 1.83 1.59 1.91 1.45 1.44 Mar 1.46 1.43 1.41 1.53 1.42 1.65 1.29 1.30 Apr 1.20 1.20 1.25 1.42 1.26 1.51 1.21 1.14 May 1.21 1.16 1.20 1.36 1.20 1.35 1.07 1.06 Jun 1.47 1.37 1.26 1.46 1.29 1.34 1.14 1.14
Mean water level
in month
(m)
Jan 1.17 1.09 0.71 0.66 0.58 0.52 0.51 0.53 Feb 0.93 0.87 0.56 0.56 0.46 0.42 0.38 0.41 Mar 0.82 0.77 0.53 0.54 0.45 0.43 0.39 0.41 Apr 0.71 0.67 0.43 0.44 0.34 0.32 0.29 0.31 May 0.57 0.52 0.26 0.26 0.17 0.15 0.09 0.12 Jun 0.78 0.69 0.32 0.30 0.20 0.14 0.09 0.11
Mean Average 0.81 0.75 0.46 0.45 0.36 0.32 0.28 0.30 2.8. Hydrological condition in SCN4 Table a19: Mean monthly inflow to Delta at Tan Chau and Chau Doc and outflow to the sea via Mekong river mouths in SCN4
Inflow to Mekong delta
(m3/s) Outflow to the sea via Mekong river mouths
(m3/s)
Month Total
in Tân châu
Châu đốc
Total out
Tiểu &Đại
Hàm luông
Cổ chiên
Cung hầu
Định an
Trần đề
Jan 5944.8 5008.4 936.3 5326.7 1290.4 423.2 592.1 731.7 1287.0 1002.4 Feb 4321.4 3651.4 670.0 3374.0 846.3 252.0 452.6 521.2 717.1 584.7 Mar 2806.1 2348.9 457.1 1941.1 482.0 132.1 342.4 354.0 279.6 351.0 Apr 2654.7 2220.6 434.1 1768.5 481.8 143.8 294.8 281.9 232.6 333.6 May 2928.0 2455.8 472.2 1999.7 569.5 135.9 256.9 219.8 366.3 451.4 Jun 4668.9 3954.2 714.7 4181.6 657.4 461.3 511.0 601.3 1094.9 855.8 Average 3775.7 3178.9 596.9 2979.8 691.3 249.1 398.1 436.0 629.6 575.7

Table a20: Summary of max and mean monthly water level at some location in the Mekong delta in SCN4
Month
Tân châu
Châu đốc
Mỹ thuận
Cần Thơ
Mỹ hòa
Sơn đốc
Tân an Bến lức
Max water level
in month
(m)
Jan 1.87 1.75 1.79 1.92 1.82 1.96 1.57 1.63 Feb 1.58 1.51 1.58 1.84 1.59 1.91 1.45 1.44 Mar 1.43 1.41 1.40 1.53 1.42 1.65 1.29 1.30 Apr 1.17 1.17 1.24 1.41 1.26 1.51 1.21 1.14 May 1.18 1.14 1.20 1.35 1.19 1.35 1.07 1.06 Jun 1.44 1.36 1.26 1.46 1.29 1.34 1.14 1.14
Mean water level
in month
(m)
Jan 1.19 1.10 0.72 0.67 0.58 0.52 0.51 0.52 Feb 0.94 0.88 0.57 0.56 0.46 0.42 0.38 0.41 Mar 0.79 0.75 0.53 0.54 0.45 0.43 0.39 0.41 Apr 0.68 0.64 0.42 0.43 0.34 0.32 0.29 0.31 May 0.53 0.49 0.25 0.25 0.17 0.15 0.09 0.12 Jun 0.74 0.66 0.31 0.30 0.19 0.14 0.09 0.11
Mean Average 0.79 0.74 0.45 0.45 0.35 0.32 0.28 0.30 2.9. Hydrological condition in SCN5 Table a21: Mean monthly inflow to Delta at Tan Chau and Chau Doc and outflow to the sea via Mekong river mouths in SCN5
Inflow to Mekong delta
(m3/s) Outflow to the sea via Mekong river mouths
(m3/s)
Month Total
in Tân châu
Châu đốc
Total out
Tiểu &Đại
Hàm luông
Cổ chiên
Cung hầu
Định an
Trần đề
Jan 5951.7 5009.4 942.3 5310.7 2854.0 -12.8 -0.3 -5.6 1408.4 1067.0 Feb 4346.9 3707.0 640.0 3384.7 2042.0 -10.3 -0.6 -2.2 754.5 601.3 Mar 2830.7 2429.1 401.6 1961.9 1336.9 -0.5 0.0 7.2 275.5 342.9 Apr 2672.6 2296.5 376.1 1826.6 1271.2 4.4 0.1 -13.4 234.6 329.8 May 2920.6 2505.7 414.9 2061.7 1269.3 2.0 -0.1 -12.6 361.4 441.8 Jun 4643.7 3949.9 693.9 4173.9 2063.6 16.5 0.0 6.1 1185.8 901.9 Average 3782.6 3223.9 558.7 3003.2 1749.4 0.6 -0.1 -3.3 665.9 590.8
Table a22: Summary of max and mean monthly water level at some location in the Mekong Delta in SCN5
Month
Tân châu
Châu đốc
Mỹ thuận
Cần Thơ
Mỹ hòa
Sơn đốc
Tân an Bến lức
Max water level
in month
(m)
Jan 1.72 1.64 1.44 1.90 1.50 1.54 1.05 1.06 Feb 1.40 1.37 1.15 1.84 1.22 1.26 0.78 0.79 Mar 1.29 1.27 1.21 1.50 1.22 1.24 0.72 0.74 Apr 1.09 1.08 1.02 1.42 1.05 1.09 0.67 0.68 May 1.00 0.98 0.82 1.34 0.87 0.92 0.51 0.52 Jun 1.33 1.25 1.01 1.43 1.05 1.10 0.63 0.64
Mean water level
in month
(m)
Jan 1.19 1.10 0.91 0.67 0.83 0.83 0.86 0.86 Feb 0.93 0.86 0.73 0.56 0.66 0.66 0.63 0.63 Mar 0.77 0.72 0.65 0.54 0.60 0.60 0.58 0.58 Apr 0.66 0.61 0.54 0.43 0.49 0.49 0.52 0.52 May 0.51 0.46 0.38 0.25 0.33 0.33 0.26 0.26 Jun 0.74 0.65 0.51 0.30 0.43 0.43 0.39 0.39
Mean Average 0.78 0.71 0.61 0.45 0.54 0.54 0.52 0.52
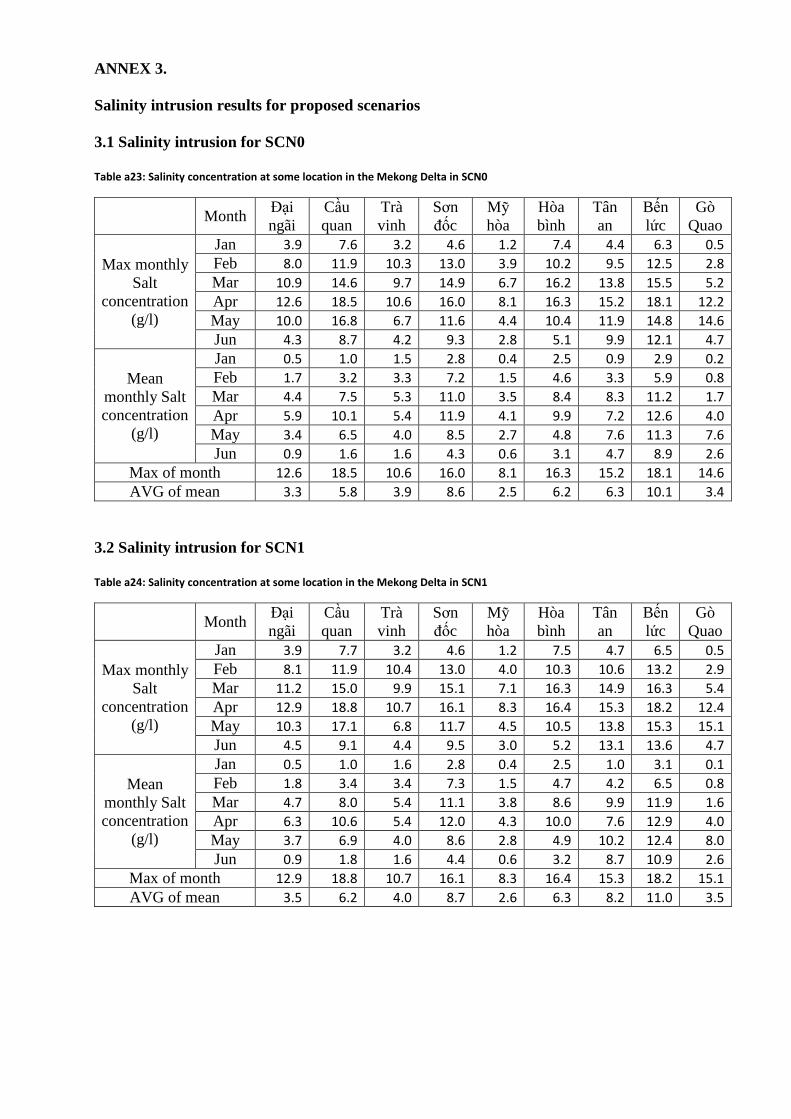
ANNEX 3. Salinity intrusion results for proposed scenarios 3.1 Salinity intrusion for SCN0 Table a23: Salinity concentration at some location in the Mekong Delta in SCN0
Month Đại ngãi
Cầu quan
Trà vinh
Sơn đốc
Mỹ hòa
Hòa bình
Tân an
Bến lức
Gò Quao
Max monthly Salt
concentration (g/l)
Jan 3.9 7.6 3.2 4.6 1.2 7.4 4.4 6.3 0.5
Feb 8.0 11.9 10.3 13.0 3.9 10.2 9.5 12.5 2.8
Mar 10.9 14.6 9.7 14.9 6.7 16.2 13.8 15.5 5.2
Apr 12.6 18.5 10.6 16.0 8.1 16.3 15.2 18.1 12.2
May 10.0 16.8 6.7 11.6 4.4 10.4 11.9 14.8 14.6
Jun 4.3 8.7 4.2 9.3 2.8 5.1 9.9 12.1 4.7
Mean monthly Salt concentration
(g/l)
Jan 0.5 1.0 1.5 2.8 0.4 2.5 0.9 2.9 0.2
Feb 1.7 3.2 3.3 7.2 1.5 4.6 3.3 5.9 0.8
Mar 4.4 7.5 5.3 11.0 3.5 8.4 8.3 11.2 1.7
Apr 5.9 10.1 5.4 11.9 4.1 9.9 7.2 12.6 4.0
May 3.4 6.5 4.0 8.5 2.7 4.8 7.6 11.3 7.6
Jun 0.9 1.6 1.6 4.3 0.6 3.1 4.7 8.9 2.6
Max of month 12.6 18.5 10.6 16.0 8.1 16.3 15.2 18.1 14.6
AVG of mean 3.3 5.8 3.9 8.6 2.5 6.2 6.3 10.1 3.4
3.2 Salinity intrusion for SCN1 Table a24: Salinity concentration at some location in the Mekong Delta in SCN1
Month Đại ngãi
Cầu quan
Trà vinh
Sơn đốc
Mỹ hòa
Hòa bình
Tân an
Bến lức
Gò Quao
Max monthly Salt
concentration (g/l)
Jan 3.9 7.7 3.2 4.6 1.2 7.5 4.7 6.5 0.5
Feb 8.1 11.9 10.4 13.0 4.0 10.3 10.6 13.2 2.9
Mar 11.2 15.0 9.9 15.1 7.1 16.3 14.9 16.3 5.4
Apr 12.9 18.8 10.7 16.1 8.3 16.4 15.3 18.2 12.4
May 10.3 17.1 6.8 11.7 4.5 10.5 13.8 15.3 15.1
Jun 4.5 9.1 4.4 9.5 3.0 5.2 13.1 13.6 4.7
Mean monthly Salt concentration
(g/l)
Jan 0.5 1.0 1.6 2.8 0.4 2.5 1.0 3.1 0.1
Feb 1.8 3.4 3.4 7.3 1.5 4.7 4.2 6.5 0.8
Mar 4.7 8.0 5.4 11.1 3.8 8.6 9.9 11.9 1.6
Apr 6.3 10.6 5.4 12.0 4.3 10.0 7.6 12.9 4.0
May 3.7 6.9 4.0 8.6 2.8 4.9 10.2 12.4 8.0
Jun 0.9 1.8 1.6 4.4 0.6 3.2 8.7 10.9 2.6
Max of month 12.9 18.8 10.7 16.1 8.3 16.4 15.3 18.2 15.1
AVG of mean 3.5 6.2 4.0 8.7 2.6 6.3 8.2 11.0 3.5

3.3 Salinity intrusion for SCN2 3.3.1 Salinity intrusion for SCN2.1 with upstream flow as 2005 Table a25: Salinity concentration at some location in the Mekong Delta in SCN2.1-Q05
Month Đại ngãi
Cầu quan
Trà vinh
Sơn đốc
Mỹ hòa
Hòa bình
Tân an
Bến lức
Gò Quao
Max monthly Salt
concentration (g/l)
Jan 3.9 7.6 3.1 4.5 1.1 7.4 4.6 6.5 0.4
Feb 7.8 11.7 10.3 12.9 3.8 10.1 10.4 13.1 2.9
Mar 11.7 16.1 10.2 15.4 7.7 16.7 14.9 16.2 5.4
Apr 14.2 20.0 11.2 16.5 9.1 16.9 15.8 18.5 12.6
May 11.5 18.2 7.0 12.1 5.2 10.8 14.1 15.8 15.4
Jun 5.1 9.9 4.7 9.9 3.7 5.5 13.6 13.8 4.8
Mean monthly Salt concentration
(g/l)
Jan 0.5 1.0 1.5 2.7 0.4 2.4 1.0 3.0 0.1
Feb 1.7 3.1 3.3 7.1 1.4 4.5 3.9 6.4 0.8
Mar 5.4 9.0 5.7 11.4 4.2 9.0 10.2 11.9 1.7
Apr 7.7 12.3 5.8 12.6 5.1 10.7 8.5 13.2 4.1
May 4.7 8.4 4.4 9.1 3.5 5.4 11.0 12.8 8.3
Jun 1.1 2.2 1.8 4.8 0.8 3.5 9.7 11.3 2.7
Max of month 14.2 20.0 11.2 16.5 9.1 16.9 15.8 18.5 15.4
AVG of mean 4.2 7.1 4.2 9.1 3.1 6.7 8.8 11.2 3.6
3.3.2 Salinity intrusion for SCN2.2 with probability of 85% for upstream flow and upstream development Table a26: Salinity concentration at some location in the Mekong Delta in SCN2.2-Qp85%
Month Đại ngãi
Cầu quan
Trà vinh
Sơn đốc
Mỹ hòa
Hòa bình
Tân an
Bến lức
Gò Quao
Max monthly Salt
concentration (g/l)
Jan 4.0 7.7 3.2 4.6 1.2 7.5 4.7 6.5 0.5
Feb 8.4 12.3 10.8 13.2 4.5 10.5 10.9 13.4 3.0
Mar 14.0 18.8 10.7 16.0 8.9 17.6 15.3 16.5 5.6
Apr 19.8 23.7 12.5 17.5 11.0 18.0 16.9 19.1 13.4
May 18.2 22.3 8.1 13.5 8.8 12.3 15.4 17.3 16.2
Jun 8.1 11.5 5.7 11.1 6.2 6.2 14.6 14.4 5.2
Mean monthly Salt concentration
(g/l)
Jan 0.5 1.0 1.6 2.8 0.4 2.5 1.0 3.1 0.1
Feb 2.1 3.9 3.6 7.6 1.8 5.0 4.4 6.6 0.8
Mar 7.0 10.9 6.3 12.1 5.2 9.8 11.3 12.4 1.8
Apr 13.3 18.1 7.2 14.3 8.1 13.1 11.5 14.3 4.7
May 10.2 14.3 5.5 10.7 6.4 7.0 13.7 14.0 9.3
Jun 1.8 3.1 2.0 5.3 1.4 3.9 11.6 12.0 3.0
Max of month 19.8 23.7 12.5 17.5 11.0 18.0 16.9 19.1 16.2
AVG of mean 7.0 10.2 4.9 10.0 4.6 7.8 10.6 11.9 4.0

3.3.3 Salinity intrusion for SCN2.3 with near future dams with optimum operation Table a27: Salinity concentration at some location in the Mekong Delta in SCN2.3-NFD-opti
Month Đại ngãi
Cầu quan
Trà vinh
Sơn đốc
Mỹ hòa
Hòa bình
Tân an
Bến lức
Gò Quao
Max monthly Salt
concentration (g/l)
Jan 3.7 7.4 3.1 4.5 1.1 7.3 4.6 6.5 0.4
Feb 8.2 12.0 10.5 13.0 4.1 10.3 10.6 13.2 2.8
Mar 11.0 15.4 9.7 15.1 6.9 16.4 14.7 16.2 5.2
Apr 14.3 20.6 11.3 16.5 8.8 16.8 15.3 18.2 12.6
May 11.9 18.5 6.9 12.2 5.4 10.9 13.6 15.7 15.1
Jun 2.3 3.8 3.4 8.2 1.6 3.8 12.5 13.4 4.0
Mean monthly Salt concentration
(g/l)
Jan 0.5 0.9 1.5 2.7 0.4 2.4 1.0 3.0 0.1
Feb 1.8 3.4 3.4 7.3 1.5 4.7 4.1 6.4 0.8
Mar 4.5 7.7 5.3 11.0 3.6 8.5 9.5 11.8 1.6
Apr 7.9 12.7 5.9 12.7 5.2 10.8 8.1 13.0 4.1
May 3.5 6.4 3.8 8.5 2.6 4.7 10.5 12.6 7.9
Jun 0.2 0.3 0.8 2.6 0.1 1.2 4.6 9.4 2.0
Max of month 14.3 20.6 11.3 16.5 8.8 16.8 15.3 18.2 15.1
AVG of mean 3.6 6.1 3.9 8.4 2.6 6.0 7.4 10.7 3.3
3.3.4 Salinity intrusion for SCN2.4 with the future dams and climate change condition Table a28: Salinity concentration at some location in the Mekong Delta in SCN2.4-RVCNA-opti
Month Đại ngãi
Cầu quan
Trà vinh
Sơn đốc
Mỹ hòa
Hòa bình
Tân an
Bến lức
Gò Quao
Max monthly Salt
concentration (g/l)
Jan 3.2 6.5 2.8 4.2 0.8 7.0 4.3 6.3 0.4
Feb 6.8 10.3 9.3 12.1 2.6 9.5 9.2 12.2 2.5
Mar 8.2 10.9 8.4 13.4 4.4 14.5 13.4 15.3 4.8
Apr 10.6 15.6 9.4 14.6 5.7 14.9 12.8 16.5 12.0
May 8.7 15.6 6.3 10.9 3.1 9.7 12.9 14.1 14.6
Jun 4.9 9.3 4.0 8.8 2.1 4.8 11.8 12.9 4.7
Mean monthly Salt concentration
(g/l)
Jan 0.3 0.6 1.2 2.3 0.2 2.0 0.8 2.8 0.1
Feb 1.1 2.0 2.6 6.2 0.8 3.7 3.0 5.8 0.7
Mar 2.5 4.1 4.1 9.3 1.9 6.7 6.6 10.6 1.4
Apr 3.8 6.8 4.5 10.4 2.5 8.3 4.8 11.2 3.6
May 2.5 4.9 3.5 7.7 1.8 4.3 8.4 11.4 7.5
Jun 0.8 1.4 1.5 4.1 0.4 2.8 6.7 10.1 2.6
Max of month 10.6 15.6 9.4 14.6 5.7 14.9 13.4 16.5 14.6
AVG of mean 2.1 3.9 3.3 7.5 1.5 5.2 5.9 9.9 3.2

3.5 Salinity intrusion for SCN3 Table a29: Salinity concentration at some location in the Mekong Delta in SCN3
Month Đại ngãi
Cầu quan
Trà vinh
Sơn đốc
Mỹ hòa
Hòa bình
Tân an
Bến lức
Gò Quao
Max monthly Salt
concentration (g/l)
Jan 3.7 7.3 3.2 4.4 1.2 7.5 5.6 7.3 0.0
Feb 7.7 11.5 10.3 12.3 3.7 10.3 10.7 13.4 0.0
Mar 11.0 14.4 9.8 14.6 6.7 16.3 15.0 16.4 0.1
Apr 12.3 18.1 10.6 15.5 7.9 16.4 15.1 18.2 0.3
May 10.3 16.8 6.7 11.1 4.3 10.5 13.8 15.4 1.0
Jun 4.2 8.6 4.3 9.0 2.9 5.2 13.0 13.6 0.7
Mean monthly Salt concentration
(g/l)
Jan 0.5 0.9 1.5 2.7 0.4 2.5 1.4 3.6 0.0
Feb 1.6 3.0 3.3 6.9 1.4 4.7 4.1 6.7 0.0
Mar 4.2 7.2 5.3 10.8 3.6 8.6 9.6 12.1 0.1
Apr 5.6 9.6 5.4 11.7 4.1 10.0 7.2 12.9 0.1
May 3.5 6.7 4.0 8.4 2.7 4.9 10.0 12.5 0.6
Jun 0.8 1.6 1.6 4.2 0.6 3.2 8.4 11.1 0.5
Max of month 12.3 18.1 10.6 15.5 7.9 16.4 15.1 18.2 1.0
AVG of mean 3.2 5.7 3.9 8.4 2.5 6.3 7.9 11.1 0.2
3.6 Salinity intrusion for SCN4 Table a30: Salinity concentration at some location in the Mekong Delta in SCN4
Month Đại ngãi
Cầu quan
Trà vinh
Sơn đốc
Mỹ hòa
Hòa bình
Tân an
Bến lức
Gò Quao
Max monthly Salt
concentration (g/l)
Jan 3.6 7.2 3.1 4.3 1.1 7.4 5.5 7.2 0.0
Feb 7.5 11.2 10.2 12.1 3.5 10.1 10.4 13.2 0.0
Mar 11.5 15.1 10.1 15.0 7.3 16.6 15.0 16.3 0.1
Apr 13.5 19.2 11.0 16.0 8.7 16.9 15.6 18.5 0.3
May 11.4 17.8 7.0 11.5 5.0 10.8 14.2 15.8 1.1
Jun 4.8 9.4 4.6 9.5 3.6 5.5 13.5 13.9 0.8
Mean monthly Salt concentration
(g/l)
Jan 0.4 0.8 1.5 2.6 0.4 2.4 1.3 3.5 0.0
Feb 1.5 2.8 3.2 6.7 1.3 4.5 3.9 6.5 0.0
Mar 4.9 8.2 5.6 11.1 4.0 9.0 10.0 12.1 0.1
Apr 6.8 11.3 5.7 12.3 5.0 10.7 8.0 13.3 0.1
May 4.5 8.2 4.3 8.9 3.5 5.4 10.8 12.8 0.6
Jun 1.0 1.9 1.7 4.6 0.8 3.5 9.5 11.5 0.5
Max of month 13.5 19.2 11.0 16.0 8.7 16.9 15.6 18.5 1.1
AVG of mean 3.8 6.5 4.2 8.8 2.9 6.6 8.5 11.3 0.3

3.7 Salinity intrusion for SCN5 Table a31: Salinity concentration at some location in the Mekong Delta in SCN5
Month Đại ngãi
Cầu quan
Trà vinh
Sơn đốc
Mỹ hòa
Hòa bình
Tân an
Bến lức
Gò Quao
Max monthly Salt
concentration (g/l)
Jan 3.3 6.7 1.0 1.7 1.1 4.4 1.2 2.7 0.0
Feb 7.2 10.8 0.5 1.1 0.9 9.4 0.4 1.2 0.0
Mar 11.8 15.6 0.3 0.8 0.6 10.9 0.8 2.9 0.2
Apr 13.5 19.1 0.2 0.7 0.5 17.0 1.0 2.9 0.3
May 11.9 17.7 0.1 0.6 0.4 8.0 1.4 3.1 1.1
Jun 4.7 8.6 0.1 0.4 0.3 2.3 1.4 2.7 0.8
Mean monthly Salt concentration
(g/l)
Jan 0.4 0.7 0.7 1.3 1.0 0.6 0.6 1.9 0.0
Feb 1.4 2.5 0.4 0.9 0.7 1.4 0.4 1.0 0.0
Mar 5.0 8.2 0.2 0.7 0.5 3.2 0.6 1.8 0.1
Apr 6.8 11.1 0.1 0.6 0.4 3.9 0.9 2.0 0.1
May 4.6 8.3 0.1 0.5 0.4 2.3 1.1 2.1 0.7
Jun 0.9 1.7 0.0 0.3 0.3 0.5 1.0 2.0 0.6
Max of month 13.5 19.1 0.5 1.1 0.9 17.0 1.4 3.1 1.1
AVG of mean 3.8 6.4 0.2 0.6 0.5 2.3 0.8 1.8 0.3

ANNEX 4.
Figure a3: Layout of sea dyke and proposed sluice for Water resource development plan in Mekong delta