Target capture of DNA from FFPE samples— recommendations for generating robust sequencing data
the plant genome march 2015 vol. 8, no. 1 1 of 15
original research
Southern-by-Sequencing: A Robust Screening Approach for Molecular Characterization of Genetically Modified Crops
Gina M. Zastrow-Hayes, Haining Lin, Amy L. Sigmund, Jenna L. Hoffman, Clara M. Alarcon, Kevin R. Hayes, Todd A. Richmond, Jeffery A. Jeddeloh, Gregory D. May, and Mary K. Beatty*
AbstractMolecular characterization of events is an integral part of the advancement process during genetically modified (GM) crop product development. Assessment of these events is traditionally accomplished by polymerase chain reaction (PCR) and Southern blot analyses. Southern blot analysis can be time-consuming and comparatively expensive and does not provide sequence-level de-tail. We have developed a sequence-based application, Southern-by-Sequencing (SbS), utilizing sequence capture coupled with next-generation sequencing (NGS) technology to replace Southern blot analysis for event selection in a high-throughput molecular charac-terization environment. SbS is accomplished by hybridizing indexed and pooled whole-genome DNA libraries from GM plants to bio-tinylated probes designed to target the sequence of transformation plasmids used to generate events within the pool. This sequence capture process enriches the sequence data obtained for targeted regions of interest (transformation plasmid DNA). Taking advantage of the DNA adjacent to the targeted bases (referred to as next-to-target sequence) that accompanies the targeted transformation plasmid sequence, the data analysis detects plasmid-to-genome and plasmid-to-plasmid junctions introduced during insertion into the plant genome. Analysis of these junction sequences provides sequence-level information as to the following: the number of inser-tion loci including detection of unlinked, independently segregating, small DNA fragments; copy number; rearrangements, truncations, or deletions of the intended insertion DNA; and the presence of trans-formation plasmid backbone sequences. This molecular evidence from SbS analysis is used to characterize and select GM plants meeting optimal molecular characterization criteria. SbS technology has proven to be a robust event screening tool for use in a high-throughput molecular characterization environment.
The majority of commercialized GM crops on the market today have been created through transforma-
tion methods, such as particle bombardment (Klein et al., 1989; Gordon-Kamm et al., 1990; Vain et al., 1993) and Agrobacterium-mediated gene transfer (Gould et al., 1991; Zhao et al., 2001; Kim et al., 2009), result-ing in random insertion of recombinant DNA into the plant genome. Detailed molecular characterization is conducted to detect insertions at multiple genetic loci, multiple-copy insertions, rearrangements of the inserted DNA, and incorporation of sequences from the transfor-mation plasmid backbone to select candidate events from a large pool of transformation events.
Molecular characterization studies of DNA insertions are necessary for the selection of events for future com-mercialization and are a required component of regula-tory data packages (Bhat and Srinivasan, 2002; Privalle et al., 2012). Molecular characterization for event selection is currently accomplished by a series of molecular assays, including PCR methods, flanking sequence analysis (Xu et al., 2008), and Southern blot hybridization analyses (Southern, 1975). This series of assays provides informa-tion on the copy number of the inserted transgenes, the number of insertion loci, the flanking plant genomic DNA sequences surrounding the insertion site, the pres-ence or absence of transformation plasmid backbone sequence, and the intactness of the inserted DNA. The combination of these assays provides a robust framework
Published in The Plant Genome 8 doi: 10.3835/plantgenome2014.08.0037 © Crop Science Society of America 5585 Guilford Rd., Madison, WI 53711 USA An open-access publication
All rights reserved. No part of this periodical may be reproduced or transmitted in any form or by any means, electronic or mechanical, including photocopying, recording, or any information storage and retrieval system, without permission in writing from the publisher. Permission for printing and for reprinting the material contained herein has been obtained by the publisher.
G.M. Zastrow-Hayes, H. Lin, A.L. Sigmund, J.L. Hoffman, K.R. Hayes, G.D. May, C.M. Alarcon, M.K. Beatty, DuPont Pioneer, 7300 NW 62nd Ave., Johnston, IA 50131; J.A. Jeddeloh and T.A. Richmond, Roche-NimbleGen, 500 S. Rosa Rd., Madison, WI 53719. G.M. Zastrow-Hayes and H. Lin contributed equally to this work. Received 1 Aug. 2014. *Corresponding author ([email protected]).
Abbreviations: CT, threshold cycle; GM, genetically modified; LB, left border; NGS, next-generation sequencing; PCR, polymerase chain reaction; RB, right border; SbS, Southern-by-Sequencing; T-DNA, transfer DNA; UNG, uracil-DNA glycosylase.
2 of 15 the plant genome march 2015 vol. 8, no. 1
for event characterization and selection; however, each of these assays presents different technical challenges.
Low cost and technical ease make PCR the assay of choice for initial event sorting in high-throughput trans-formation event screening programs. Placement of assay primers and probes in the intended genetic elements and the unintended plasmid backbone sequence can quickly identify multiple-copy insertion events and events containing plasmid backbone sequences. However, discrete assays used in PCR leave the majority of the inserted DNA uncharacterized and transformation plasmid fragments that do not include assay primer sequences are undetected. Although PCR assays can provide copy number estimates and determine the presence or absence of plasmid backbone insertions that contain the assay sequence, these assays do not provide any sequence-level information. Transformation events advancing through PCR screening require further characterization by Southern blot and flanking sequence analyses.
Determination of the genomic DNA sequence flanking the insertion is typically carried out via methods such as genome walking (Siebert et al., 1995) and inverse PCR (Xu et al., 2008). In these approaches, primers designed to the ends of the inserted DNA are used to extend the sequence into the plant genomic region. When a plant reference genome is available, flanking sequences can be aligned to the reference genome sequence to provide additional molecular characterization information. Flanking DNA sequences can be compared to the transformation plasmid sequence to identify additional plasmid sequences sur-rounding the inserted DNA, which indicate the presence of fragments and/or tandem insertions within an insertion locus. This information can assist in event selection and is used for the development of event-specific PCR assays that are instrumental for event identification and event confir-mation and are a regulatory requirement for event commer-cialization. Much like PCR, primers for flanking sequence analysis typically target only a small region at the ends of the intended DNA insertion, leaving most of the inserted DNA uncharacterized. If the primer target sequence is missing in the transformation event because of truncation or rearrangement, the flanking sequence information would not be generated from the PCR assay. Inverse PCR methods are also dependent on correct selection of the restriction enzymes that will digest genomic DNA near the insertion to an appropriate size for circularization, adding additional complexity and challenges to this method.
Southern blot analysis (Southern, 1975) can be used as a low-density screening tool with a few restriction enzyme and probe combinations or as a high-density characteriza-tion method with many enzyme digestions and compre-hensive probe coverage (i.e., probes for complete coverage of the transformation plasmid). Traditionally, Southern blot analysis has been used for determining the number of inser-tion loci, the copy number and intactness of inserted DNA, and the presence or absence of plasmid backbone sequences. The preparation, hybridization, and analysis of blots with the combination of multiple enzymes and probes is labor-intensive and technically challenging and requires expertise
for accurate data interpretation. As with PCR, Southern blot analysis does not provide sequence-level information. Additional molecular characterization such as PCR ampli-fication and sequencing of overlapping fragments is needed to generate sequence-level information for the insertions. Preparation, screening, and sequencing of cloned genomic DNA may be required for characterizing complex insertions or those located in intractable genomic locations.
Next-generation sequencing technology, specifically the Illumina platform (Illumina, San Diego, CA), has been used extensively for whole-genome sequencing of complex organisms (Li et al., 2010; Shulaev et al., 2011; Varshney et al., 2011) and offers new options for in-depth molecular characterization. It is now possible to sequence an entire genome and analyze the resulting sequence for inserted DNA in crop species (Kovalic et al., 2012). Unfor-tunately, the complexity of whole-genome sequencing analyses is not yet conducive to high-throughput screen-ing of the thousands of transformation events generated in a production environment. To reach the throughput necessary for characterizing a large number of events, it would be advantageous to specifically target sequence from the transformation plasmid within the GM plant.
In comparison to whole-genome sequencing, sequence capture technology is a method of reducing sequence com-plexity by the use of specific capture probes to enrich for the target sequences of interest, in turn decreasing the amount of sequence data generated by NGS technology and subse-quently focusing the bioinformatic analysis. Hybridization with probes smaller than the targeted fragments captures not only the bases present in the probes but also DNA adjacent to the targeted bases (referred to as next-to-target sequence). The utility of sequence capture technology to recover nonprobe sequences representing the DNA flank-ing the targeted regions of interest was first demonstrated in maize (Zea mays L.)(Fu et al., 2010) and subsequently in identification of novel retrotransposition events in the human genome (Baillie et al., 2011). Typically, the efficiency of sequence capture to enrich the targeted regions of interest decreases with the total size of the target relative to the size of the genome (Albert et al., 2007); therefore, the small size of the inserted DNA sequence relative to the large size of the reference plant genome is not ideal for traditional sequence capture methodology. Overcoming the inherent inefficiency of sequence capture, which targets a small region of interest relative to the size of the genome, would be necessary before the technology could be useful for molecular characteriza-tion of transformation events.
Here we introduce an innovative strategy, SbS, which utilizes innovations in in-solution sequence capture methodology paired with NGS to screen transforma-tion events rapidly and efficiently (Fig. 1). The targeted sequencing method is coupled with bioinformatic analysis that uses the transformation plasmid and native genomic DNA sequences to identify chimeric sequences representing novel junctions, including plasmid-to-genome or plasmid-to-plasmid junctions. This analysis provides comprehensive information about the number

zastrow-hayes et al.: southern-by-sequencing for characterizing gm crops 3 of 15
of unique insertion loci, the copy number and rear-rangements of the inserted DNA, and the presence or absence of plasmid backbone sequences. In addition, SbS provides sequence-level information about the flanking genomic DNA sequences of each insertion that can be used to characterize its genomic location and develop event-specific PCR assays to detect the insertion. Finally, sequence alignment of the targeted reads to the transfor-mation plasmid sequence can detect small insertions or deletions and single nucleotide polymorphisms within the inserted DNA. This paper describes SbS, a high-throughput method to complement or replace many of the molecular characterization approaches currently employed for transformation event screening and selec-tion to develop GM crops, using maize as an example.
Materials and MethodsDNA Probe Library Design and ConstructionSouthern-by-Sequencing capture probes used for enrich-ment of transformation plasmid sequences were designed by Roche NimbleGen (Madison, WI) to meet Pioneer (Johnston, IA) requirements and subsequently manufac-tured by Roche NimbleGen. The capture probe library
was designed by targeting approximately 117 kb of sequence from a plasmid pool of 89 unique transforma-tion plasmids. These plasmid sequences were analyzed to mask small regions (e.g., 15–17 bp in length) that have homology to the repetitive sequences in the maize genome and were reduced to a set of unique sequences (D’Ascenzo et al., 2009). These unique sequences were then used to design overlapping biotinylated oligonucle-otides as capture probes. Using proprietary algorithms, the probe distance, tiling path, and probe length were determined (D’Ascenzo et al., 2009) to ensure that the majority of all sequences (98.6–100%) within the trans-formation plasmid pool were targeted during the enrich-ment process. The resulting probe pool was aligned to the maize genome to determine the percentage of endogenous maize sequence that would be enriched and subsequently sequenced, along with the desired trans-formation plasmid sequence. When the transformation plasmid and the endogenous sequence targeted were used as a basis, the total sequence required to cover both endogenous maize and transformation plasmid-targeted sequence at a depth adequate for analysis was calculated. An adequate depth for analysis was defined as an average coverage of 100× over the inserted DNA.
Figure 1. Southern-by-Sequencing data analysis summary. Genomic DNA is isolated from individual genetically modified (GM) events, sheared, and ligated with indexed adapters. Probe libraries are designed to meet Pioneer requirements and constructed by Roche NimbleGen so that the transformation plasmid sequence will be enriched after hybridization and sequence capture. Sequences are generated with an Illumina HiSeq 2500 instrument, trimmed for quality, reduced to a set of nonredundant reads, and aligned to the maize genome. Reads with an exact match to the genomic reference sequence are excluded from the subsequent analytical steps. The remaining Non-redundantReads are aligned to the transformation plasmid backbone sequence and alignments over a defined thresh-old are flagged as backbone-positive. Following transformation plasmid backbone analysis, junction reads are detected from the Non-redundantRead group and condensed. Condensed junctions are further reduced by comparison to junctions from a non-GM control sample representing the transformation genotype (endogenous junctions). The final junctions are extended and aligned to the maize genome and transformation plasmid to determine the origin of the junction sequence, thus identifying the insertion site. For additional details, see the Materials and Methods section.

4 of 15 the plant genome march 2015 vol. 8, no. 1
Sequencing Library ConstructionIllumina DNA shotgun sequencing libraries were con-structed for individual GM maize events generated by Agrobacterium-mediated transformation. Genomic DNA was isolated from 4-mm leaf punches collected from each event with an Omega Biotek E-Z 96 Plant DNA Kit (Norcross, GA). Purified genomic DNA was assessed for quality and quantity with a Fragment Analyzer (Advanced Analytical Technolo-gies, Ames, IA) and sheared to an average fragment size of 400 bp with a Covaris E210 ultrasonicator (Covaris, Woburn, MA). All subsequent enzymatic reactions were performed with the KAPA Library Preparation Kit (Kapa Biosystems, Woburn, MA). Sheared DNA was end-repaired, A-tailed, and ligated to one of the unique indexed NEXTflex-96 adapters (Bioo Scientific Corp., Austin, TX) according to the manu-facturer’s protocol (Kapa Biosystems) such that subsequently pooled maize events could be deconvoluted after sequencing. Indexed adaptor-ligated DNA fragment libraries were PCR-amplified for eight cycles according to Roche NimbleGen double capture protocols. Amplified libraries were assessed for quality and quantity with the Fragment Analyzer. Librar-ies were pooled in equal molar ratios in groups of 24, 48, or 96 and the pooled libraries were diluted in nuclease-free water to a working stock of 5 ng L–1.
Enrichment of Sequencing Fragments with Targeted Capture ProbesSequence enrichment was accomplished according to a modified Roche NimbleGen double capture protocol for use in plant genomes. Using the double capture approach to increase on-target reads (reads targeted by the designed probes), the recommended C0t-1 DNA was replaced with 20 L of SeqCap EZ Developer Reagent (Roche Diagnostics, Indianapolis, IN) in each capture reaction (Green et al., 2012). The genomic DNA shotgun library pools described above were denatured in a cocktail of hybridization buffer, SeqCap EZ Developer Reagent, and blocking oligonucle-otides corresponding to adaptor sequences in each pool. After denaturation, the cocktail containing a DNA library pool was combined with the biotinylated probe library and incubated at 47°C for 16 h. Following incubation, streptavi-din Dynabeads M-270 (LifeTech, Grand Island, NY) were added to the hybridization mix. Using the DynaMag-2 magnet (LifeTech), bound DNA fragments were washed and eluted according to the double capture protocol. Washed and eluted library pools were PCR-amplified for five cycles and purified using QIAquick columns (Qiagen, German-town, MD) according to the manufacturer’s instructions. The enriched DNA library pools from the first capture reac-tion were then captured a second time, PCR-amplified for 16 cycles, and purified using the methods described above. Final enriched capture library pools were quantified with the Agilent TapeStation (Agilent Technologies, Santa Clara, CA) and diluted to 2 nM for sequencing.
SequencingEnriched library pools of GM maize events were sequenced on the Illumina MiSeq or HiSeq 2500 system
following the manufacturer’s protocols. Paired-end 100-bp reads of the enriched DNA sequence and a seven-base indexing read of the indexed adaptor sequence were generated to a target depth of 100× across the captured sequence. Sequence reads were trimmed for quality below Q20 (Ewing et al., 1998; Ewing and Green, 1998) and deconvoluted based on their event to indexed adap-tor association. The deconvoluted sequences for each transformation event are referred to as “AllReads” for bioinformatic analysis.
Quality Assurance of Sequencing ReadsIllumina sequence reads were adaptor-trimmed using custom scripts. K-mer analysis was further performed to eliminate sequencing errors using JELLYFISH, version 1.1.4 (Marcais and Kinsford, 2011), such that any 31-bp sequence that occurred less than twice within AllReads was excluded from further analysis. This set of sequences is referred to as “CleanReads”. To reduce sequencing noise as well as computational costs, identical sequence reads were collapsed to create nonredundant read groups. Abun-dance information for each nonredundant read group was retained. The representative sequences from the top 60% abundant nonredundant read groups (referred to as “Non-redundantReads”) were used for further analysis.
Transformation Plasmid Backbone AnalysisNon-redundantReads were aligned to the maize reference genome (Schnable et al., 2009) using Bowtie, version 1.0.0 (Langmead et al., 2009), allowing up to two mismatches. Non-redundantReads that did not align to the maize ref-erence genome were subsequently aligned to the transfor-mation plasmid transfer DNA (T-DNA) sequence using Bowtie with zero mismatches allowed. The remaining Non-redundantReads that did not align to the maize ref-erence genome or the T-DNA sequence were subsequently aligned to the transformation plasmid backbone sequence using Bowtie 2 version 2.1.0, with zero mismatches. Alignments to the transformation plasmid backbone sequence that met a coverage threshold of 35× or greater across 50 bp were flagged as events containing plasmid backbone sequence. This threshold reduced false-positive detection of plasmid backbone caused by the presence of environmental bacteria such as Serratia marcescens on plant tissue, which can be seen at low coverage in the Integrated Genome Viewer coverage graphs. This align-ment-based transformation plasmid backbone analysis serves as a first-pass identification of plasmid backbone presence; however, plasmid backbone fragments are addi-tionally characterized through the detection of plasmid backbone junction sequences as described below.
Junction Detection and FilteringNon-redundantReads with alignment wholly to the maize reference genome were excluded from the junction detec-tion step. To identify chimeric reads (referred to as junction reads or junctions), the remaining Non-redundantReads were aligned to the entire transformation plasmid sequence,
zastrow-hayes et al.: southern-by-sequencing for characterizing gm crops 5 of 15
comprising the intended transformation T-DNA sequence and the unintended plasmid backbone sequence, using BWA version 0.5.9-r16, with the soft-trimming feature enabled (Li and Durbin, 2010). A junction read identified in this analysis contains sequence that is noncontiguous with the transformation plasmid sequence, such as plasmid-to-genome or plasmid-to-plasmid. Following junction identification, individual reads that contain a chimeric sequence were condensed to a unique identifier representing a junction. The unique identifier, referred to as a 30_20-mer, was created by extracting 20 bp of sequence aligned to the transformation plasmid along with 30 bp of sequence proxi-mal to the aligned 20 bp. This 30-bp sequence was not con-tiguously aligned to the transformation plasmid and, when combined with the aligned 20 bp, represents the junction point of the chimeric read. Junction reads were condensed if they contained identical 30_20-mers or if the 30_20-mer junction occurred within 2 bp of each other. Total reads (referred to as “TotalSupportingReads”) making up each unique junction were tracked for filtering. Junctions with less than five unique supporting reads or where the number of TotalSupportingReads was 10% of the median sequenc-ing depth of aligned positions were filtered out and removed from further analysis.
Removal of Endogenous JunctionsDifferences in the maize reference genome (Schnable et al., 2009) and the transformation line genome may result in the false-positive identification of unique junctions that are in fact endogenous maize sequences (referred to as endog-enous junctions). To remove such endogenous junctions, non-GM maize lines that are commonly used as the source material for transformation were captured as described above and sequenced to an average depth of 10 million reads per genotype, which is approximately five times more than the target depth of transformation events. The increased sequence depth of non-GM samples improved the likelihood that all possible endogenous junctions captured by the transformation plasmid probes would be detected, resulting in improved removal of endogenous junctions. Endogenous junctions were detected for each non-GM line with respect to each of the transformation plasmids that were included in the SbS probe design. The 30_20-mers of the junctions detected from the non-GM samples were used to filter out endogenous junctions in the GM samples.
Junction Read Extension and Insertion Site IdentificationThe final junctions (junctions passing through all filters) were extended into longer contigs using Non-redund-antReads with the Short Sequence Assembly by progres-sive K-mer search and 3’ read Extension (SSAKE) version 3.8.2 tool (Warren et al., 2007). The longest SSAKE con-tigs were then mapped to the maize reference genome as well as the transformation plasmid using BLAT, version 35×1, (Kent, 2002) to characterize the insertion site and intactness of the inserted DNA.
Spike-In Testing of Sensitivity and ReproducibilityAs a positive control, double-stranded oligonucleotides 250 bp in length were designed to mimic plasmid backbone fragments inserted into maize chromosome 9 (referred to as spike-in oligonucleotides) for use in sensitivity testing. The spike-in oligonucleotides, containing pseudoinsertions ranging from 35 to 100 bp of plasmid backbone sequence flanked by maize chromosome 9 genomic sequence for a total length of 250 bp, were synthesized by Integrated DNA Technologies (Coralville, IA). To simulate genomic deletion that can occur as a result of transformation, 11 bp of maize chromosome 9 sequence was excluded from each spike-in oligonucleotide at the pseudoinsertion site. Spike-in oligo-nucleotides were added to previously characterized genomic DNA from a single-copy insertion event that had been shown to be free of plasmid backbone. Spike-in oligonucleotides were added to the transformation event DNA at a molar ratio equal to a single-copy insertion within the maize genome. As an internal control, a double-stranded oligonucleotide representing 250 bp of plasmid backbone immediately 5’ to the right border (RB) of the T-DNA without a genomic flank-ing sequence was added at the same molar ratio to verify the capture efficiency and accurate concentration of the spike-in oligonucleotide. Spike-in oligonucleotides and the internal control oligonucleotide were added before sequencing library construction; the resulting library pools were captured and sequenced as described above. The resulting “AllReads” (the deconvoluted sequences for each transformation event) were aligned to the transformation plasmid sequence as described above for transformation plasmid backbone analysis; how-ever, alignment thresholds of 35× or greater across 50 bp were removed for determination of the shortest pseudoinsertion sequence that could be successfully captured with the DNA probe library.
Following sensitivity determination, reproducibility of the small fragment detection was tested by spiking genomic DNA from 92 independent transformation events with the 50-bp pseudoinsertion spike-in oligonucleotide (a 250-bp oligonucleotide containing both the 11-bp genomic deletion and the 50-bp pseudoinsertion) and the 250-bp internal control oligonucleotide before sequencing library construction. As in the sensitivity testing, the spike-in oli-gonucleotide and the internal control oligonucleotide were added at a molar ratio equivalent to a single-copy insertion within the maize genome. Spiked samples were processed through library construction, enrichment, sequencing, and analysis as described above.
Polymerase Chain ReactionReal-time PCR was performed on genomic DNA isolated from leaf tissue of the primary transformation event genera-tion to screen for the presence of transformation plasmid backbone DNA sequence. Genomic DNA was isolated from maize leaf punches using a proprietary method. Five Taq-Man (Life Technologies, Carlsbad, CA) probe and primer sets were designed to detect the plasmid backbone targets. A TaqMan probe and primer set for an endogenous maize gene was designed to confirm the presence of amplifiable

6 of 15 the plant genome march 2015 vol. 8, no. 1
DNA in each reaction. QuantiTect Multiplex PCR MasterMix (Qiagen) containing uracil-DNA glycosylase (UNG) (Qia-gen) with a passive reference dye to normalize fluorescent variations between wells was used for the assay. All assays were combined in a single reaction. Plasmid backbone target probes were labeled with the same detection fluorophore and the endogenous gene target probe was labeled with a different detection fluorophore. After initial incubation at 50°C for 2 min (the UNG step) and then at 95°C for 15 min, 40 cycles were conducted as follows: 95°C for 15 s and 60°C for 20 s. Positive or negative determination was based on a compari-son of the threshold cycle (CT) of the plasmid backbone target fluorophore to that of the endogenous gene target. Amplifica-tion of one or more of the plasmid backbone target regions would give a CT similar to that of the endogenous gene target, indicating the presence of plasmid backbone DNA sequence. The absence of amplification of all the plasmid backbone tar-get regions would result in a default CT of 40 (the number of PCR cycles performed), indicating the absence of a plasmid backbone DNA sequence. Copy number analysis of inserted T-DNA was completed by multiplexed quantitative PCR assays of the feature of interest and an endogenous gene, each labeled with a different detection fluorophore. Change in the CT was determined and entered into a proprietary software program. Gene copy number calls were based on statistical cluster analysis and known gene copy controls.
Southern BlotGenetically modified maize events generated by Agrobacte-rium-mediated transformation were characterized for the intactness and copy number of inserted T-DNA and the presence of plasmid backbone sequences by Southern blot analysis (Southern, 1975) using probes within the T-DNA and plasmid backbone regions. Multiple restriction enzymes were selected to determine the number of insertion sites, the copy number, and intactness of the genetic elements within the T-DNA as well as the absence of transformation plasmid backbone DNA sequence. Genomic DNA was extracted from lyophilized leaf tissue of the primary transformation event generation using a modified cetyltrimethylammonium bro-mide-based method (Rogers and Bendich, 1985). Ten micro-grams of genomic DNA were digested in parallel with the positive control plasmid, plasmid spiked into non-GM maize DNA, and non-GM maize DNA. Probes were labeled with DIG-dUTP by PCR. Hybridization and detection were com-pleted according to the manufacturer’s instructions (Roche, Mannheim, Germany).
Results and DiscussionSouthern-by-Sequencing, described here using maize as an example, offers a high-throughput and targeted NGS-based alternative to traditional molecular characterization analyses for screening and selection of transformation events. Previ-ously, insertion site analysis via targeted sequencing has been described for Arabidopsis thaliana (L.) Heynh., ecotype Columbia-4, (Lapage et al., 2013) by targeting a small por-tion of the T-DNA ends, which leaves most of the inserted T-DNA uncharacterized. Whole-transgene characterization
by array hybridization and targeted sequencing has been described in mice (DuBose et al., 2013) but is not as applicable to a high-throughput format as an in-solution based capture method. Sequence-based methods of transformation event molecular characterization for the complete DNA inser-tion in plant species have previously been demonstrated in soybean [Glycine max (L.) Merr.] through high-coverage whole-genome sequencing (Kovalic et al., 2012) and in papaya (Carica papaya L.) by assembly of a draft genome (Ming et al., 2008). Although the cost of NGS continues to decrease (Wetterstrand, 2013), whole-genome sequencing approaches require hundreds of gigabases of sequence as well as time-consuming and costly library construction to generate the depth of data (also referred to as sequence coverage) neces-sary to detect random and sparse T-DNA insertion sites. Additionally, whole-genome sequencing methods produce massive amounts of plant genome data, require extensive bioinformatic resources and, as such, are not amenable to a high-throughput screening environment.
To address the molecular characterization needs of a transformation program capable of producing thousands of events per year, we explored targeted sequencing through an in-solution sequence capture approach in combination with NGS technology to characterize the entire transfor-mation plasmid, including plasmid backbone sequences. Taking advantage of the next-to-target sequence that accompanies targeted regions (Fu et al., 2010), this approach can be utilized to identify the unknown sequences flank-ing the inserted DNA and identify additional insertion loci independent of the primary insertion site. This targeted sequencing approach greatly reduces the amount of bioin-formatic analysis, increases assay throughput via sample pooling, and more closely mirrors the high-density probe- and primer-based molecular characterization methods cur-rently used for transformation event selection and advance-ment such as Southern blot and PCR analyses.
Evaluation of Targeted Sequencing MethodsTargeted sequencing in crop species such as maize has posed technical challenges in the past because of the abun-dance of repetitive sequences present in the genome. Repeat sequences that represent over 80% of the maize genome (Xu et al., 2013) and the lack of a suitable C0t-1 DNA to block this repetitive sequence have historically reduced the percentage of sequence reads corresponding to the probe library (referred to as on-target sequence) in capture experi-ments. The reduced efficiency of the probe hybridization to intended targets in highly repetitive genomes results in a requirement for a greater depth of sequence coverage and a higher cost per experiment. Our initial single capture pilot experiments targeting inserted DNA yielded on-target sequence rates in the range of 8 to 10% (data not shown). Although insertion junction sites could be identified in the generated sequence, the large amount of sequence required to detect these junctions reliably would limit the high-throughput potential of the assay. Due to the relatively small size of the inserted DNA, ranging from thousands to tens of thousands of base pairs, compared to the whole

zastrow-hayes et al.: southern-by-sequencing for characterizing gm crops 7 of 15
maize genome, these low on-target rates were not unex-pected (Albert et al., 2007). The use of SeqCap EZ Developer Reagent (Roche NimbleGen) (Bolon et al., 2011), coupled with the double capture optimized processing approach of Roche NimbleGen (Green et al., 2012), yielded on-target sequence rates of 90 to 95% (data not shown). This substan-tially increased capture efficiency enabled pooling of up to 92 GM maize event libraries and subsequently achieved higher throughput processing at a lower cost.
The capture and analysis of endogenous junctions in non-GM maize controls of matching transformation genotypes was equal in importance to validating on-target sequence capture efficiencies in GM maize DNA samples. Analysis of non-GM control maize lines in the SbS strategy served two purposes: first, it facilitated the identification of endogenous maize sequences targeted by the DNA probe library during capture; second, it identified sequences origi-nating from bacterial contaminants such as S. marcescens, which are common on greenhouse-procured tissue samples. This information was subsequently used as a filter for trans-formation event data analysis, resulting in a reduction in the number of endogenous junction sequences and contami-nant junction sequences identified as false-positive unique junctions in each event.
Comparison of SbS and Traditional Molecular Characterization MethodsFollowing development, optimization, and validation of the SbS method, a study to compare the results generated with traditional molecular characterization techniques
with those generated by SbS was performed. Seventy-nine maize events were generated by Agrobacterium-mediated transformation and primary transformation event genera-tion plants from each event were analyzed for the number of insertion loci, the copy number and the intactness of the inserted T-DNA, and the presence or absence of plas-mid backbone DNA by a combination of PCR and South-ern blot analyses. All 79 transformation events were also assayed by SbS analysis as described and depicted in Fig. 1. Nine events representing a variety of transformation outcomes (insertion complexity) were selected for further evaluation. These nine events are referred to as the “cross-characterization set” described below.
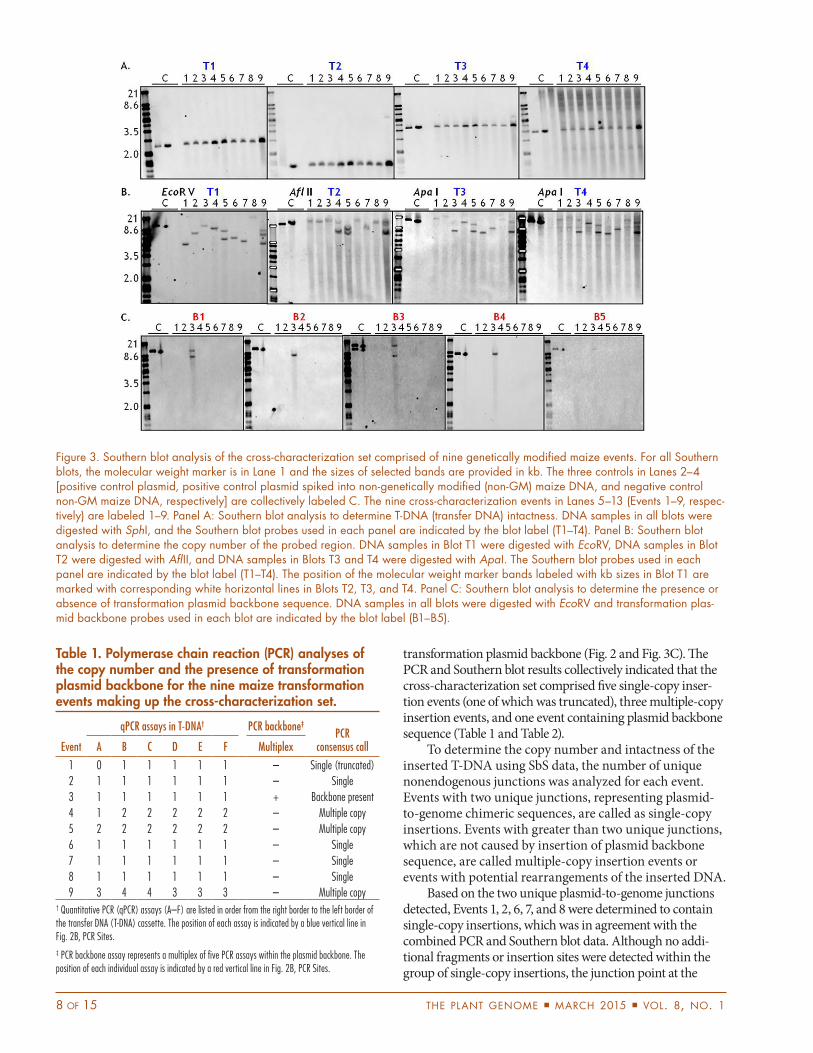
Polymerase chain reaction results were generated from six transgene cassette-specific assays distributed across the T-DNA region and a five-assay multiplex detecting five dis-tinct regions of the plasmid backbone (Fig. 2). The Southern blot analyses were performed to determine copy number and the intactness of the inserted T-DNA and to detect the pres-ence or absence of plasmid backbone sequence. The Southern blot T-DNA intactness analysis used the combination of a single restriction enzyme and multiple probes across the T-DNA to detect fragments internal to the T-DNA region (Fig. 2 and Fig. 3A). The Southern blot copy number analysis used various single restriction enzymes in combination with the same probes across the T-DNA as used in the intactness check to identify unique fragments comprising both T-DNA and flanking maize genomic DNA (Fig. 2 and Fig. 3B). The Southern blot plasmid backbone analysis used a combination of a single restriction enzyme and multiple probes across the
Figure 2. Transformation plasmid schematic and polymerase chain reaction (PCR) and Southern blot assay positions for the cross-characterization set comprised of nine genetically modified maize events. Panel A: Schematic representation of the transformation plasmid. Transfer DNA (T-DNA) features are drawn to scale and include Genes 1–4, depicted as red arrows representing the respec-tive promoter, coding sequence, and terminator for each gene. The right border and left border (RB and LB, respectively) delineate the T-DNA region. Regions outside these borders represent the plasmid backbone sequence and are not drawn to scale, as indicated by the double line breaks in the schematic. Numbers above the schematic indicate the bp location relative to the transformation plas-mid sequence. Panel B: In Track 1, restriction enzyme (RE) sites used in Southern blot analysis are denoted by vertical black lines and enzymes are abbreviated as follows: A, ApaI; E, EcoRV; F, AflII; S, SphI. In Track 2, the positions of the Southern blot probes within the T-DNA and plasmid backbone are represented by blue and red rectangles, respectively. Probe labels below each rectangle represent the probe used for the Southern blot analysis shown in Fig. 3. In Track 3, the positions of the PCR Assays A–F within the T-DNA are rep-resented by blue vertical lines and correspond to results in Columns A–F of Table 1. The positions of PCR Assays 1–5 within the plasmid backbone region are represented by red vertical lines and correspond to the results in the PCR backbone column of Table 1.
8 of 15 the plant genome march 2015 vol. 8, no. 1
transformation plasmid backbone (Fig. 2 and Fig. 3C). The PCR and Southern blot results collectively indicated that the cross-characterization set comprised five single-copy inser-tion events (one of which was truncated), three multiple-copy insertion events, and one event containing plasmid backbone sequence (Table 1 and Table 2).
To determine the copy number and intactness of the inserted T-DNA using SbS data, the number of unique nonendogenous junctions was analyzed for each event. Events with two unique junctions, representing plasmid-to-genome chimeric sequences, are called as single-copy insertions. Events with greater than two unique junctions, which are not caused by insertion of plasmid backbone sequence, are called multiple-copy insertion events or events with potential rearrangements of the inserted DNA.
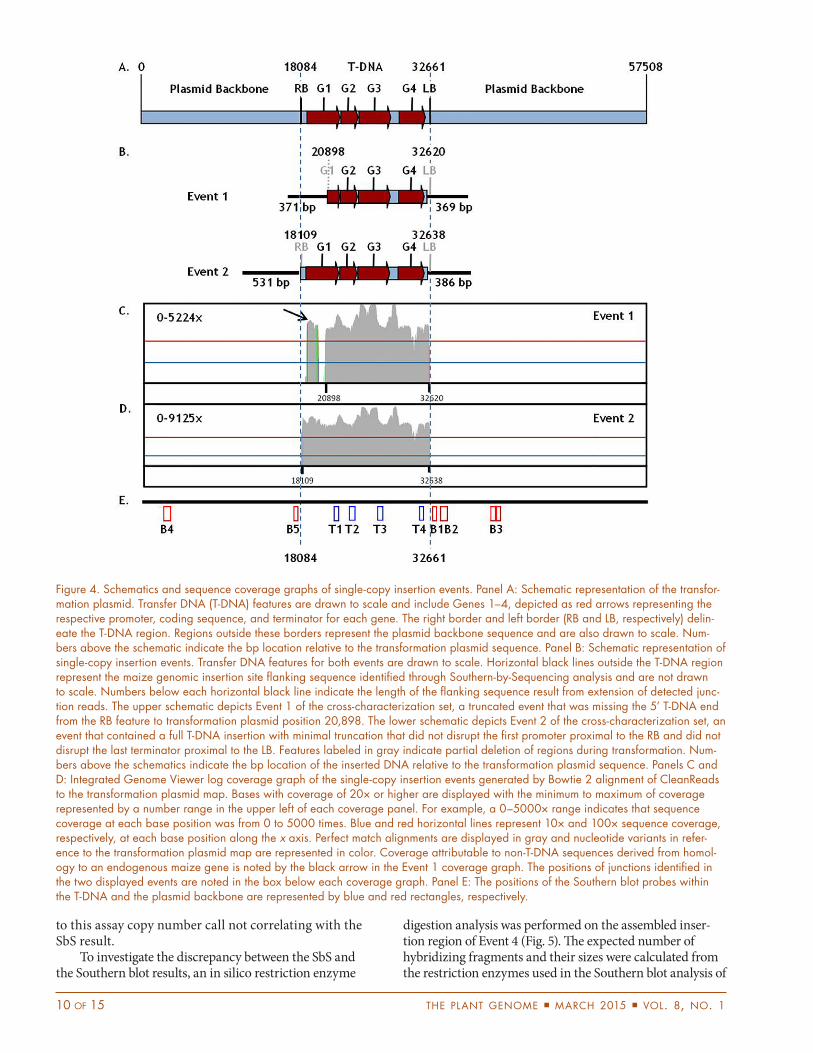
Based on the two unique plasmid-to-genome junctions detected, Events 1, 2, 6, 7, and 8 were determined to contain single-copy insertions, which was in agreement with the combined PCR and Southern blot data. Although no addi-tional fragments or insertion sites were detected within the group of single-copy insertions, the junction point at the
Figure 3. Southern blot analysis of the cross-characterization set comprised of nine genetically modified maize events. For all Southern blots, the molecular weight marker is in Lane 1 and the sizes of selected bands are provided in kb. The three controls in Lanes 2–4 [positive control plasmid, positive control plasmid spiked into non-genetically modified (non-GM) maize DNA, and negative control non-GM maize DNA, respectively] are collectively labeled C. The nine cross-characterization events in Lanes 5–13 (Events 1–9, respec-tively) are labeled 1–9. Panel A: Southern blot analysis to determine T-DNA (transfer DNA) intactness. DNA samples in all blots were digested with SphI, and the Southern blot probes used in each panel are indicated by the blot label (T1–T4). Panel B: Southern blot analysis to determine the copy number of the probed region. DNA samples in Blot T1 were digested with EcoRV, DNA samples in Blot T2 were digested with AflII, and DNA samples in Blots T3 and T4 were digested with ApaI. The Southern blot probes used in each panel are indicated by the blot label (T1–T4). The position of the molecular weight marker bands labeled with kb sizes in Blot T1 are marked with corresponding white horizontal lines in Blots T2, T3, and T4. Panel C: Southern blot analysis to determine the presence or absence of transformation plasmid backbone sequence. DNA samples in all blots were digested with EcoRV and transformation plas-mid backbone probes used in each blot are indicated by the blot label (B1–B5).
Table 1. Polymerase chain reaction (PCR) analyses of the copy number and the presence of transformation plasmid backbone for the nine maize transformation events making up the cross-characterization set.
Event
qPCR assays in T-DNA† PCR backbone‡
PCR consensus callA B C D E F Multiplex
1 0 1 1 1 1 1 – Single (truncated)2 1 1 1 1 1 1 – Single3 1 1 1 1 1 1 + Backbone present4 1 2 2 2 2 2 – Multiple copy5 2 2 2 2 2 2 – Multiple copy6 1 1 1 1 1 1 – Single7 1 1 1 1 1 1 – Single8 1 1 1 1 1 1 – Single9 3 4 4 3 3 3 – Multiple copy
† Quantitative PCR (qPCR) assays (A–F) are listed in order from the right border to the left border of the transfer DNA (T-DNA) cassette. The position of each assay is indicated by a blue vertical line in Fig. 2B, PCR Sites.‡ PCR backbone assay represents a multiplex of five PCR assays within the plasmid backbone. The position of each individual assay is indicated by a red vertical line in Fig. 2B, PCR Sites.

zastrow-hayes et al.: southern-by-sequencing for characterizing gm crops 9 of 15
5’ end of Event 1 indicated a significant truncation into the promoter region of Gene 1, as seen in Fig. 4. Alignment of the CleanReads set to the transformation plasmid map from Events 1 and 2 indicated 100× or greater sequence cover-age across the entire inserted T-DNA. Comparison of this coverage demonstrated the difference in sequence output for a truncated insertion versus an intact insertion. Noncontigu-ous coverage in the 5’ region, as seen in the Event 1 coverage graph (Fig. 4C), is attributable to the use of an endogenous maize promoter in the transformation plasmid. Targeting of the endogenous maize element by the capture probes results in sequence coverage but as a result of the endogenous junction filtering in the SbS analysis, this coverage does not impact the conclusion that this event is truncated approxi-mately 2.8 kb from the RB feature. This result is consistent with the PCR result for Assay A; however, the sequence-level data generated by SbS allowed examination of the exact trun-cation point and facilitated a judgment on the severity of the truncation and the potential usefulness of this event.
Beyond the confirmation of the copy number and intactness of the inserted T-DNA determined via PCR and Southern blot analyses, the SbS data provide addi-tional information at the nucleotide level. For example, the sequence data uncovered a single nucleotide poly-morphism in one of the single-copy insertion events, as the sequence was in disagreement with the reference transformation plasmid sequence (data not shown). Unlike either the PCR or Southern blot analyses, SbS as a single assay would have provided detailed sequence information for molecular-based event screening.
Characterization of Multiple-Copy Insertion EventsTo confirm that SbS is an effective tool for characterizing transformation events with multiple T-DNA copies, we analyzed Events 4, 5, and 9 of the cross-characterization set, in which the PCR and Southern blot analyses indi-cated that more than one copy of the T-DNA was present (Table 1 and Table 2). Southern-by-Sequencing analy-sis detected more than two unique junction sequences in each of these three transformation events (data not shown), which was consistent with the PCR and South-ern consensus calls, and provided sequence-level details. Although both the PCR and Southern blot analyses accu-rately identified Event 4 as containing multiple copies of the T-DNA, the individual primer- and probe-based results supporting the consensus call were inconsistent between the two analyses. Polymerase chain reaction analysis identified two copies of the transformation plas-mid with Assays B to F, but only one copy for the region covered by Assay A (Fig. 2 and Table 1). These data sug-gest that Event 4 contained one full copy of the T-DNA and an additional partial copy of the T-DNA with a putative 5’-end truncation. In the copy number Southern blot analysis of Event 4, single bands for Genes 1, 3, and 4 were detected with Probes T1, T3, and T4, respectively, and a double band for Gene 2 was detected with Probe T2 (Fig. 3B). These data suggest that Event 4 contained
one full copy of the T-DNA and an additional partial copy or T-DNA rearrangement encompassing Gene 2 (Fig. 2 and Table 2). Event 4 was a particularly interest-ing case for assessing the accuracy of the SbS results for multiple-copy insertion events and provided an oppor-tunity to investigate and resolve the apparent inconsis-tency between the PCR and Southern blot data. In-depth sequence analysis beyond that typically used for SbS event screening was completed on Event 4 to assemble a map of the entire insertion region including the inserted T-DNA and the flanking genomic DNA sequence. The assembly of Event 4 sequence data indicated the presence of two full copies of the T-DNA region at one insertion locus with a RB-to-RB junction (head-to-head tandem insertion), and two left border-to-genome junctions in opposing directions (Fig. 5). The two full copies of the T-DNA predicted with this assembly were consistent with the number of unique junctions detected in the SbS event screening analysis. While confirming the copy number results from PCR Assays B to F, this assembly analysis and the SbS event screening result demonstrated that the single-copy insertion call of the T-DNA region detected by PCR Assay A was inconsistent. The head-to-head orientation of the tandem insertion resulted in a sequence with multiple priming sites and possible ampli-fication products for PCR Assay A, which most likely led
Table 2. Southern blot analyses of DNA insertion intact-ness, the copy number, and the presence of transforma-tion plasmid backbone for the nine maize transforma-tion events making up the cross-characterization set.
Event Blot
Southern blot T-DNA probes†
Backbone probes‡
Southern blot consensus callT1 T2 T3 T4
1 Intactness 1 1 1 1 – SingleCopy number 1 1 1 1
2 Intactness 1 1 1 1 – SingleCopy number 1 1 1 1
3 Intactness 1 1 1 1 + Backbone presentCopy number 1 1 1 1
4 Intactness 1 1 1 1 – Multiple copyCopy number 1 2 1 1
5 Intactness 1 1 1 1 – Multiple copyCopy number 2 2 2 2
6 Intactness 1 1 1 1 – SingleCopy number 1 1 1 1
7 Intactness 1 1 1 1 – SingleCopy number 1 1 1 1
8 Intactness 1 1 1 1 – SingleCopy number 1 1 1 1
9 Intactness 1 2 2 1 – Multiple copyCopy number 3 2 2 2
† Southern blot probes (T1–T4) are listed in order from the right border to the left border of the T-DNA (transfer DNA) cassette. The position of each probe is indicated by blue rectangles in Fig. 2B, Southern Probes.‡ Backbone probes represent data from five Southern blots with probes positioned across the plasmid backbone (B1–B5), as indicated by red rectangles in Fig. 2B, Southern Probes.
10 of 15 the plant genome march 2015 vol. 8, no. 1
to this assay copy number call not correlating with the SbS result.
To investigate the discrepancy between the SbS and the Southern blot results, an in silico restriction enzyme
digestion analysis was performed on the assembled inser-tion region of Event 4 (Fig. 5). The expected number of hybridizing fragments and their sizes were calculated from the restriction enzymes used in the Southern blot analysis of
Figure 4. Schematics and sequence coverage graphs of single-copy insertion events. Panel A: Schematic representation of the transfor-mation plasmid. Transfer DNA (T-DNA) features are drawn to scale and include Genes 1–4, depicted as red arrows representing the respective promoter, coding sequence, and terminator for each gene. The right border and left border (RB and LB, respectively) delin-eate the T-DNA region. Regions outside these borders represent the plasmid backbone sequence and are also drawn to scale. Num-bers above the schematic indicate the bp location relative to the transformation plasmid sequence. Panel B: Schematic representation of single-copy insertion events. Transfer DNA features for both events are drawn to scale. Horizontal black lines outside the T-DNA region represent the maize genomic insertion site flanking sequence identified through Southern-by-Sequencing analysis and are not drawn to scale. Numbers below each horizontal black line indicate the length of the flanking sequence result from extension of detected junc-tion reads. The upper schematic depicts Event 1 of the cross-characterization set, a truncated event that was missing the 5’ T-DNA end from the RB feature to transformation plasmid position 20,898. The lower schematic depicts Event 2 of the cross-characterization set, an event that contained a full T-DNA insertion with minimal truncation that did not disrupt the first promoter proximal to the RB and did not disrupt the last terminator proximal to the LB. Features labeled in gray indicate partial deletion of regions during transformation. Num-bers above the schematics indicate the bp location of the inserted DNA relative to the transformation plasmid sequence. Panels C and D: Integrated Genome Viewer log coverage graph of the single-copy insertion events generated by Bowtie 2 alignment of CleanReads to the transformation plasmid map. Bases with coverage of 20× or higher are displayed with the minimum to maximum of coverage represented by a number range in the upper left of each coverage panel. For example, a 0–5000× range indicates that sequence coverage at each base position was from 0 to 5000 times. Blue and red horizontal lines represent 10× and 100× sequence coverage, respectively, at each base position along the x axis. Perfect match alignments are displayed in gray and nucleotide variants in refer-ence to the transformation plasmid map are represented in color. Coverage attributable to non-T-DNA sequences derived from homol-ogy to an endogenous maize gene is noted by the black arrow in the Event 1 coverage graph. The positions of junctions identified in the two displayed events are noted in the box below each coverage graph. Panel E: The positions of the Southern blot probes within the T-DNA and the plasmid backbone are represented by blue and red rectangles, respectively.

zastrow-hayes et al.: southern-by-sequencing for characterizing gm crops 11 of 15
copy number (Fig. 2B). In silico digestion analysis predicted two fragments of highly similar sizes (12.8 and 12.6 kb) as a result of ApaI digestion and hybridization with Probes T3 and T4 (Fig. 5). These fragments were indistinguishable in the corresponding Southern blot analyses and appeared as a single hybridizing band (Fig. 3B, Blots T3 and T4). When Event 4 DNA was digested with EcoRV and the resultant blot was hybridized with Probe T1, a single fragment would be expected due to the head-to-head insertion of the two copies of T-DNA, which was consistent with the single band detected in the corresponding Southern blot analysis (Fig. 3B, Blot T1). In addition, the in silico digestion analysis pre-dicted two fragments when Event 4 DNA was digested with AflII and the resultant blot was hybridized with Probe T2, as was verified by the corresponding Southern blot analysis (Fig. 3B, Blot T2). Although the consensus copy number call from the Southern blot analysis of Event 4 correctly identified this as a multiple-copy insertion, the nature of the head-to-head orientation, in combination with the restric-tion enzymes and probes used, yielded single or overlapping bands for Probes T1, T3, and T4, which prevented accurate analysis with these probes. Used as screening tools to select and advance single-copy, single-insertion locus GM maize events, all three methods would have successfully excluded Event 4. However, the data generated by SbS provided the most accurate and comprehensive characterization of this event, including information at the sequence level about the flanking genomic DNA sequence and the intactness of each inserted T-DNA copy.
Detection of Inserted Plasmid Backbone FragmentsPolymerase chain reaction and Southern blot analyses are effective tools for the detection of transformation plasmid
backbone DNA insertions when the inserted regions of the plasmid backbone include the assay sequence, as shown for Event 3 (Table 1 and Table 2). Plasmid backbone inser-tions are also reliably detected with SbS technology (Fig. 6), as they are easily identified by coverage of the transfor-mation plasmid outside the left and right T-DNA borders and by detection of junctions including plasmid backbone sequences. Traditional molecular characterization meth-ods become ineffective when DNA fragment insertions are outside the coverage of the primers or probes used. One advantage of the SbS methodology is the size of the capture probe library, which facilitates targeting of the majority of bases (98.6–100%) within the transformation plasmid pool instead of a discrete assay space.
An example of the advantage of the probe density used in SbS is shown in Fig. 6C, in which a small back-bone fragment of 213 bp was identified through SbS. As this sequence was not covered by either the PCR assays or by the Southern blot probes, the insertion fragment would not have been detected unless higher density Southern blot analysis or other high-density techniques such as whole-genome sequencing were employed. South-ern-by-Sequencing easily detected this small independent plasmid backbone fragment insertion and this transfor-mation event was eliminated early in the event selection process, resulting in a significant reduction in the expense of maintaining an event through product development that would ultimately be excluded after high-density molecular testing in advanced plant generations.
Southern-by-Sequencing Sensitivity and ReproducibilityIdentification of additional insertions outside the pri-mary insertion site is critical when considering event
Figure 5. In silico analysis of a multiple-copy insertion event: cross-characterization Event 4 on chromosome 6. Panel A: Based on the genomic insertion site sequence on maize chromosome 6 and the assembled transfer DNA (T-DNA) sequence from Southern-by-Sequencing (SbS) analysis, a reconstructed in planta insertion site map was created for multiple-copy insertion Event 4 of the cross-characterization set. Transfer DNA features are drawn to scale and include Genes 1–4, depicted as red arrows representing the respective promoter, coding sequence, and terminator for each gene. Features labeled in gray indicate the T-DNA’s left border and right border (LB and RB, respectively) features partially deleted during transformation. Horizontal black lines outside the T-DNA features represent maize genomic DNA on chromosome 6 and are not drawn to scale. Restriction enzyme digestion sites and Southern probes (Boxes T1–T4) used in Southern blot analysis (Fig. 3A and B, and Table 2) as well as polymerase chain reaction Assays A and F (Table 1) relevant to in silico digestion analysis are annotated. The resulting fragments from in silico digest of the reconstructed SbS sequence and the enzyme–probe combinations used in the Southern blot analysis are represented by black, blue, and red horizontal lines and labeled with the associated fragment size in kb.

12 of 15 the plant genome march 2015 vol. 8, no. 1
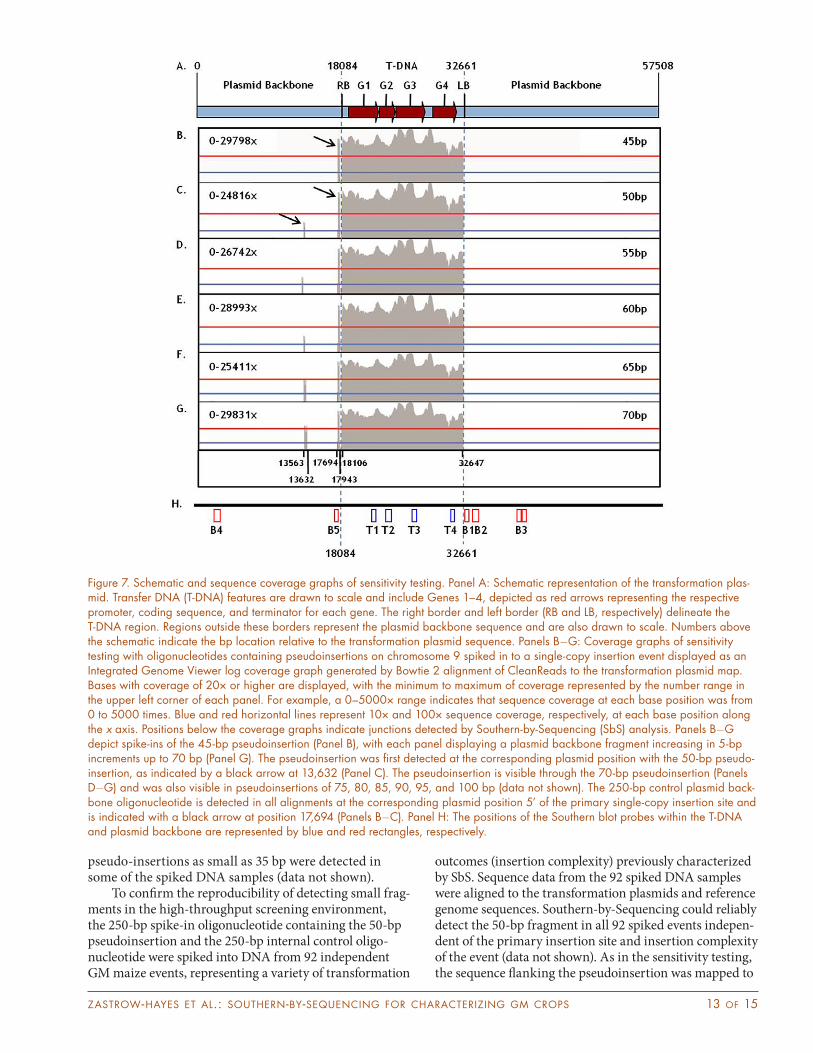
advancement, regulatory approval, trait integration, and commercialization. For this reason, understanding the SbS detection limit (also referred to as sensitivity) in terms of the smallest possible detectable insertion frag-ment is necessary. Southern-by-Sequencing sensitivity was assessed by spiking DNA samples from a previously characterized single-copy insertion event with double stranded oligonucleotides mimicking plasmid backbone insertions and an 11-bp genomic deletion on maize chro-mosome 9. The spike-in oligonucleotides were 250 bp in total length and contained segments of plasmid back-bone (referred to as the pseudoinsertion), ranging from 35 to 100 bp at 5-bp increments, flanked by sequence from maize chromosome 9. The spike-in oligonucleotides were added to DNA samples in parallel with a double-stranded oligonucleotide representing a 250-bp plasmid backbone fragment as an internal control to confirm the capture efficiency of oligonucleotide spikes. Align-ment of the resulting SbS data to the transformation
plasmid detected pseudoinsertions 50 bp and larger at the corresponding plasmid location (Fig. 7). These results indicated that the enrichment process could capture and identify insertions equal to or larger than 50 bp. Align-ment of the sequence flanking the pseudoinsertion to the maize genome confirmed that the correct genomic loca-tion was identified (Fig. 8). The 250-bp plasmid backbone control fragment was detected in all alignments at the corresponding plasmid position 5’ of the primary single-copy insertion site. The sequence of this internal control oligonucleotide was seen at equivalent coverage to the primary insertion, indicating that oligonucleotide spikes were captured at comparable efficiencies to those of DNA originating from the transformation event (Fig. 7). Equal coverage of internal control oligonucleotides in all reac-tions confirmed detection of the pseudoinsertion spike-in was representative of the fragment detection limits. In addition, although 50 bp was the pseudoinsertion size that was reliably detected in the sensitivity testing,
Figure 6. Schematic and sequence coverage graphs of events with presence of transformation plasmid backbone sequence. Panel A: Sche-matic representation of the transformation plasmid. Transfer DNA (T-DNA) features are drawn to scale and include Genes 1–4, depicted as red arrows representing the respective promoter, coding sequence, and terminator for each gene. The right border and left border (RB and LB, respectively) delineate the T-DNA region. Regions outside these borders represent the transformation plasmid backbone sequence and are also drawn to scale. Numbers above the schematic indicate the bp location relative to the transformation plasmid sequence. Panel B: Integrated Genome Viewer log coverage graph of the cross-characterization set Event 3 generated by Bowtie 2 alignment of CleanReads to the transformation plasmid map. Base coverage is displayed with the minimum to maximum of coverage represented by the number range in upper left of each coverage panel. For example, a 0–5000× range indicates that sequence coverage at each base position was from 0 to 5000 times. Blue and red horizontal lines represent 10× and 100× sequence coverage at each base position along the x axis. Perfect match alignments are displayed in gray. Coverage detected outside the RB and LB regions indicated that plasmid backbone was present in the event. Junctions detected by Southern-by-Sequencing (SbS) analysis indicated integration of the entire transformation plasmid with positions 32,656 and 32,658 as the insertion ends, as noted in the box below the coverage graph. Panel C: Coverage graph formatted as described in Panel B displaying an event containing a small transformation plasmid backbone insertion. Backbone insertion is demonstrated by cover-age levels that are equal to that of the primary insertion, noted by the black arrow in the coverage graph. Additional small peaks represent alignments of environmental bacterial sequence with homology to the transformation plasmid backbone sequence. Coordinates of the junc-tions detected by SbS analysis indicated the insertion of a 213-bp plasmid backbone sequence, independent of the primary insertion, cor-responding to positions 42,666 to 42,879 of the transformation plasmid. Panel D: The positions of the Southern blot probes within the T-DNA and plasmid backbone are represented by blue and red rectangles, respectively.
zastrow-hayes et al.: southern-by-sequencing for characterizing gm crops 13 of 15
pseudo-insertions as small as 35 bp were detected in some of the spiked DNA samples (data not shown).
To confirm the reproducibility of detecting small frag-ments in the high-throughput screening environment, the 250-bp spike-in oligonucleotide containing the 50-bp pseudoinsertion and the 250-bp internal control oligo-nucleotide were spiked into DNA from 92 independent GM maize events, representing a variety of transformation
outcomes (insertion complexity) previously characterized by SbS. Sequence data from the 92 spiked DNA samples were aligned to the transformation plasmids and reference genome sequences. Southern-by-Sequencing could reliably detect the 50-bp fragment in all 92 spiked events indepen-dent of the primary insertion site and insertion complexity of the event (data not shown). As in the sensitivity testing, the sequence flanking the pseudoinsertion was mapped to
Figure 7. Schematic and sequence coverage graphs of sensitivity testing. Panel A: Schematic representation of the transformation plas-mid. Transfer DNA (T-DNA) features are drawn to scale and include Genes 1–4, depicted as red arrows representing the respective promoter, coding sequence, and terminator for each gene. The right border and left border (RB and LB, respectively) delineate the T-DNA region. Regions outside these borders represent the plasmid backbone sequence and are also drawn to scale. Numbers above the schematic indicate the bp location relative to the transformation plasmid sequence. Panels BG: Coverage graphs of sensitivity testing with oligonucleotides containing pseudoinsertions on chromosome 9 spiked in to a single-copy insertion event displayed as an Integrated Genome Viewer log coverage graph generated by Bowtie 2 alignment of CleanReads to the transformation plasmid map. Bases with coverage of 20× or higher are displayed, with the minimum to maximum of coverage represented by the number range in the upper left corner of each panel. For example, a 0–5000× range indicates that sequence coverage at each base position was from 0 to 5000 times. Blue and red horizontal lines represent 10× and 100× sequence coverage, respectively, at each base position along the x axis. Positions below the coverage graphs indicate junctions detected by Southern-by-Sequencing (SbS) analysis. Panels BG depict spike-ins of the 45-bp pseudoinsertion (Panel B), with each panel displaying a plasmid backbone fragment increasing in 5-bp increments up to 70 bp (Panel G). The pseudoinsertion was first detected at the corresponding plasmid position with the 50-bp pseudo-insertion, as indicated by a black arrow at 13,632 (Panel C). The pseudoinsertion is visible through the 70-bp pseudoinsertion (Panels DG) and was also visible in pseudoinsertions of 75, 80, 85, 90, 95, and 100 bp (data not shown). The 250-bp control plasmid back-bone oligonucleotide is detected in all alignments at the corresponding plasmid position 5’ of the primary single-copy insertion site and is indicated with a black arrow at position 17,694 (Panels BC). Panel H: The positions of the Southern blot probes within the T-DNA and plasmid backbone are represented by blue and red rectangles, respectively.

14 of 15 the plant genome march 2015 vol. 8, no. 1
the correct genomic location on maize chromosome 9 and the 11-bp genomic deletion was detected in all 92 spiked events (Fig. 8; data not shown). It is important to note that the results of screening over 2000 individual maize transformation events were consistent with the detection limit determined by sensitivity and reproducibility test-ing (data not shown). Three maize transformation events were detected that each contained a single fragment inde-pendent of the primary insertion site and near the 50-bp detection limit. Detection of these 55-, 57-, and 58-bp fragments validated that the sensitivity and reproducibility results were not attributable to oligonucleotide-specific capture but were representative of a detectable fragment size inserted into the maize genome (data not shown).
Southern-by-Sequencing is a cost-effective high-throughput molecular screening method that can reli-ably detect small fragments independent of the primary insertion site to identify transformation events that should be eliminated from further product development or that require additional plant breeding and selection steps to segregate the independent insertions.
ConclusionsUsing targeted sequence capture coupled with NGS tech-nology, the SbS approach to molecular characterization of transformation events is robust and provides in-depth
sequence-level information compared to traditional PCR and Southern blot screening techniques. Southern-by-Sequencing can determine the copy number and intact-ness of the inserted DNA and the presence or absence of plasmid backbone sequences and can identify small frag-ments independent of the primary insertion site, which allows for rapid molecular characterization and selection of single-copy, single-locus insertion events. Southern-by-Sequencing can be reliably used to replace Southern blots as a molecular characterization tool for screening trans-formation events in a high-throughput environment.
It is important to note that although full assembly of the entire T-DNA insertion is not possible with the current SbS sample processing and analysis procedures, additional advances in sequencing technologies and sample preparation methods should further optimize and develop SbS to enable a single contiguous sequence result. Although the experiments described here focus on random T-DNA insertions into the maize genome by Agrobacterium-mediated transformation, SbS can also be used to characterize random DNA insertions generated by particle bombardment technology. Southern-by-Sequencing will be useful for screening and selecting events produced by site-specific integration techniques and for verifying the absence of additional fragments and inser-tion loci that could be introduced during a multiple step plant transformation process. SbS technology has proven to be a
Figure 8. Genome sequence coverage graphs of reproducibility testing. Tier 1: Bowtie 2 alignment of the 250-bp spike-in oligonucle-otide containing the 50-bp pseudoinsertion to the maize genome is visible at the expected position on maize chromosome 9. Tier 2: Magnified view of the covered area of maize chromosome 9, the 11-bp genomic deletion in the spike-in oligonucleotide design is vis-ible as the gap in sequence coverage. Tier 3: Soft-trim enabled BWA alignment of the 50-bp pseudoinsertion is visible as the colored read ends in the coverage display. Tier 4: Sequence of the 50 bp pseudo-insertion in red text and the two 30_20-mer unique junction identifiers are defined in bracketed text. Within each 50 bp of the 30_20-mer bracketed text, the red text represents 20 bp of sequence aligned to the pseudoinsertion and the black text represents the 30 bp of proximal sequence aligned to maize chromosome 9.
zastrow-hayes et al.: southern-by-sequencing for characterizing gm crops 15 of 15
Klein, T.M., L. Kornstein, J.C. Sanford, and M.E. Fromm. 1989. Genetic transformation of maize cells by particle bombardment. Plant Physiol. 91:440–444. doi:10.1104/pp.91.1.440
Kovalic, D., C. Garnaat, L. Guo, Y. Yan, J. Groat, A. Silvanovich, et al. 2012. The use of next generation sequencing and junction sequence analysis bioinformatics to achieve molecular characterization of crops improved through modern biotechnology. Plant Gen. 5(3):149–163 doi:10.3835/plantgenome2012.10.0026
Langmead, B., C. Trapnell, M. Pop, and S.L. Salzberg. 2009. Ultrafast and memory-efficient alignment of short DNA sequences to the human genome. Genome Biol. 10:R25. doi:10.1186/gb-2009-10-3-r25
Lapage, É., É. Zampini, B. Boyle, and N. Brisson. 2013. Time- and cost-effi-cient identification of T-DNA insertions sites through targeted genomic sequencing. PLoS ONE 8(8):e70912. doi:10.1371/journal.pone.0070912
Li, H., and R. Durbin. 2010. Fast and accurate long-read alignment with Burrows–Wheeler transform. Bioinformatics 26(5):589–595. doi:10.1093/bioinformatics/btp698
Li, R., W. Fan, G. Tian, H. Zhu, L. He, J. Cai, et al. 2010. The sequence and de novo assembly of the giant panda genome. Nature 463:311–317. doi:10.1038/nature08696
Marcais, G., and C. Kinsford. 2011. A fast, lock-free approach for efficient parallel counting of occurrences of k-mers. Bioinformatics 27:764–770. doi:10.1093/bioinformatics/btr011
Ming, R., S. Hou, Y. Feng, Q. Yu, A. Dionne-Laporte, J.H. Saw, et al. 2008. The draft genome of the transgenic tropical fruit tree papaya (Carica papaya Linnaeus). Nature 452:991–996. doi:10.1038/nature06856
Privalle, L.S., J. Chen, G. Clapper, P. Hunst, F. Spiegelhalter, and C.X. Zhong. 2012. Development of an agricultural biotechnology crop prod-uct: Testing from discovery to commercialization. J. Agric. Food Chem. 60(41):10179–10187. doi:10.1021/jf302706e
Rogers, S.O., and A.J. Bendich. 1985. Extraction of DNA from milligram amounts of fresh, herbarium and mummified plant tissues. Plant Mol. Biol. 5(2):69–76. doi:10.1007/BF00020088
Schnable, P.S., D. Ware, R.S. Fulton, J.C. Stein, F. Wei, S. Pasternak, et al. 2009. The B73 maize genome: Complexity, diversity, and dynamics. Sci-ence 325:1112–1115. doi:10.1126/science.1178534
Siebert, P.D., A. Chenchik, D.E. Kellogg, K.A. Lukyanov, and S.A. Lukya-nov. 1995. An improved PCR method for walking in uncloned genomic DNA. Nucleic Acids Res. 23:1087–1088. doi:10.1093/nar/23.6.1087
Shulaev, V., D.J. Sargent, R.N. Crowhurst, T.C. Mockler, O. Folkerts, A.L. Delcher, et al. 2011. The genome of woodland strawberry (Fragaria vesca). Nat. Genet. 43:109–116. doi:10.1038/ng.740
Southern, E.M. 1975. Detection of specific sequences among DNA frag-ments separated by gel electrophoresis. J. Mol. Biol. 98:503–517. doi:10.1016/S0022-2836(75)80083-0
Vain, P., M.D. McMullen, and J.J. Finer. 1993. Osmotic treatment enhances particle bombardment-mediated transient and stable transformation of maize. Plant Cell Rep. 12:84–88. doi:10.1007/BF00241940
Varshney, R.K., W. Chen, Y. Li, A.K. Bharti, R.K. Saxena, J.A. Schueter, et al. 2011. Draft genome sequence of pigeonpea (Cajanus cajan), an orphan legume crop of resource-poor farmers. Nat. Biotechnol. 30:83–89. doi:10.1038/nbt.2022
Warren, R.L., G.G. Sutton, S.J. Jones, and R.A. Holt. 2007. Assembling mil-lions of short DNA sequences using SSAKE. Bioinformatics 23:500–501. doi:10.1093/bioinformatics/btl629
Wetterstrand, K.A. 2013. DNA sequencing costs: Data from the NHGRI Genome Sequencing Program (GSP). National Human Genome Research Institute. http://www.genome.gov/sequencingcosts (accessed 4 Dec. 2013).
Xu, J., L. Liu, Y. Xu, C. Chen, T. Rong, F. Ali, et al. 2013. Development and characterization of simple sequence repeat markers providing genome-wide coverage and high resolution in maize. DNA Res. 20:497–509. doi:10.1093/dnares/dst026
Xu, W., Z. Liang, Y. Rong, Y. Luo, F. Zhang, Y. Yuan, and K. Huang. 2008. Characterization and event-specific quantitative detection of DAS-59122-7 maize insert with the application of plasmidic reference mate-rial. J. Sci. Food Agric. 89:494–503. doi:10.1002/jsfa.3479
Zhao, Z., W. Gu, T. Cai, L. Tagliani, D. Hondred, D. Bond, et al. 2001. High throughput genetic transformation mediated by Agrobacterium tumefa-ciens in maize. Mol. Breed. 8:323–333 10.1023/A:1015243600325
robust and reliable high-throughput molecular characteriza-tion tool for GM maize event screening and selection and this approach is applicable to all organisms for characterizing DNA insertions.
Conflicting Interests StatementTAR and JAJ hold a competing interest in this publica-tion as employees of Roche NimbleGen.
AcknowledgmentsWe thank the members of the Southern group (Boovaraghan Balaji, Bhojaraja Rudrappa, Sudarshan G., Vijay Raghavan V., Vani Kokila, Shamseer, P.M., Sambit Sahoo, and Mymuna Begum) at the DuPont Knowledge Center in Hyderabad, India for performing the Southern blot analyses. We also thank members of the DuPont Pioneer Genomics group (John Nau, Charlotte Martin, Anthony Pappas, and Megan Lyon) for support throughout SbS development and production. Wet bench laboratory support was provided by Tracy Millard at Roche NimbleGen.
ReferencesAlbert, T.J., M.N. Molla, D.M. Muzny, L. Nazareth, D. Wheeler, X. Song, et
al. 2007. Direct selection of human genomic loci by microarray hybrid-ization. Nat. Methods 11:903–905. doi:10.1038/nmeth1111
Baillie, J.K., M.W. Barnett, K.R. Upton, D.J. Gerhardt, T.A. Richmond, F. De Sapio, et al. 2011. Somatic retrotransposition alters the genetic land-scape of the human brain. Nature 479:534–537. doi:10.1038/nature10531
Bhat, S.R., and S. Srinivasan. 2002. Molecular and genetic analyses of trans-genic plants: Considerations and approaches. Plant Sci. 163(4):673–681. doi:10.1016/S0168-9452(02)00152-8
Bolon, Y.T., W.J. Haun, W.W. Xu, D. Grant, M.G. Stacey, R.T. Nelson, et al. 2011. Phenotypic and genomic analyses of a fast neutron mutant population resource in soybean. Plant Physiol. 156:240–253. doi:10.1104/pp.110.170811
D’Ascenzo, M., C. Meacham, J. Kitzman, C. Middle, J. Knight, R. Winer, et al. 2009. Mutation discovery in the mouse using genetically guided array capture and resequencing. Mamm. Genome 20:424–436. doi:10.1007/s00335-009-9200-y
DuBose, A.J., S.T. Lichtenstein, N. Narisu, L.L. Bonneycastle, A.J. Swift, P.S. Chines, and F.S. Collins. 2013. Use of microarray hybrid capture and next-generation sequencing to identify the anatomy of a transgene. Nucleic Acids Res. 41(6):e70. doi:10.1093/nar/gks1463
Ewing, B., L. Hillier, M.C. Wendl, and P. Green. 1998. Base-calling of auto-mated sequencer traces using phred. I. Accuracy assessment. Genome Res. 8:175–185. doi:10.1101/gr.8.3.175
Ewing, B., and P. Green. 1998. Base-calling of automated sequencer traces using phred. II. Error probabilities. Genome Res. 8:186–194. doi:10.1101/gr.8.3.175
Fu, Y., N.M. Springer, D.J. Gerhardt, K. Ying, C.T. Yeh, W. Wu, et al. 2010. Repeat subtraction-mediated sequence capture from a complex genome. Plant J. 62:898–909. doi:10.1111/j.1365-313X.2010.04196.x
Gordon-Kamm, W.J., T.M. Spencer, M.L. Mangano, T.R. Adams, R.J. Daines, W.G. Start, J.V. O’Brien, S.A. Chambers, W.R. Adams Jr, N.G. Willetts, T.B. Rice, C.J. Mackey, R.W. Krueger, A.P. Kausch, and P.G. Lemaux. 1990. Transformation of maize cells and regeneration of fertile transgenic plants. Plant Cell 2:603–618. doi:10.1105/tpc.2.7.603
Gould, J., M. Devey, O. Hasegawa, E.C. Ulian, G. Peterson, and R.H. Smith. 1991. Transformation of Zea mays L. using Agrobacterium tumefaciens and the shoot apex. Plant Physiol. 95:426–434. doi.org/10.1104/pp.95.2.426
Green, D., J. Wendt, C. Kashuk, M. Brockman, and D. Burgess. 2012. Double capture: An alternative protocol for sequence capture of dif-ficult targets. SeqCap EZ Library: Technical note. Roche NimbleGen, Inc. http://www.nimblegen.com/products/lit/06870406001_NG_Seq-CapEZ_DoubleCaptureSR_20Aug2012.pdf (accessed 5 Dec. 2014).
Kent, W.J. 2002. BLAT—the BLAST-like alignment tool. Genome Res. 12:656–664. doi:10.1101/gr.229202
Kim, H.A., S.D. Utomo, S.Y. Kwon, S.R. Min, J.S. Kim, H.S. Yoo, and P.S. Choi. 2009. The development of herbicide-resistant maize: Stable Agrobacterium-mediated transformation of maize using explants of type II embryogenic calli. Plant Biotechnol. Rep. 3:277–283. doi:10.1007/s11816-009-0099-2