
Southern Agriculture Slavery and Civil War. Southern Agriculture Similarities with other regions –...
53
Southern Agriculture Slavery and Civil War
-
date post
20-Dec-2015 -
Category
Documents
-
view
213 -
download
0
Transcript of Southern Agriculture Slavery and Civil War. Southern Agriculture Similarities with other regions –...

Southern Agriculture
Slavery and Civil War

Southern Agriculture
• Similarities with other regions– Both South and West have a large percentage of
population in Agriculture before the Civil War.– Emphasis is on production for market even when
farms are “self-sufficient”

Southern Agriculture
• Differences– Crops- Cotton, Tobacco, Sugar and Rice– Use of slave labor– Larger Size
• Both in terms of acres and labor
– Small farms did exist but did not specialize in cash crops (exception is tobacco)

Why was Southern Agriculture different?
• Factor Endowment made it possible to grow crops with a production function with economics of scale and where slave labor was more efficient than hired labor
• Sugar is grown with slave labor regardless of where it is grown

Efficiency-What does it mean?• Least cost way of production
– Slave labor less costly when cost of maintaining and monitoring labor for the same output is less than the wage payment to free labor
• Pareto –optimality or allocative efficiency– Cannot make someone better off without making
another worse off– Slavery is not efficient in the this way– Payment necessary to get free labor to work as hard
as a slave is greater than the benefit to owner of using slave rather than free labor

• Explosion of research by Economic Historians into slavery in the post WWII period.
• Large amounts of resources devoted to collecting and analyzing the slave trade and the system of slavery.
• Understanding of slavery has been radically altered

• Slave trade explained by the movement of productive inputs from low to high marginal valued uses. – In the US, there was plenty of land and few
people. In Europe, there were more people and less land.
– The marginal product of labor was higher in the New World.
– Slave labor was used in some crops but not others

Slave Trade
1451-1600 275,0001601-1700 1,362,0001701-1810 6,200,0001811-1870 1,898,000
total 9,735,000
Slave Imports
1701-1810-Height of the slave trade.Slave Trade was a multi-cultural enterprise.
Blacks captured slaves and transported them to Barricos on the coast to be sold to white traders. Malaria prevented whites from penetrating the African interior.

• Example of Specialization According to Comparative Advantage. The common perception is that slavery was associated with cotton (Gone with the Wind). This is wrong. – Cotton and tobacco were not the most important
crops in the slave trade (as opposed to slave system).
– Sugar was the crop which drove the slave trade.– 80% of slaves were imported before 1810-before
cotton production really got going.
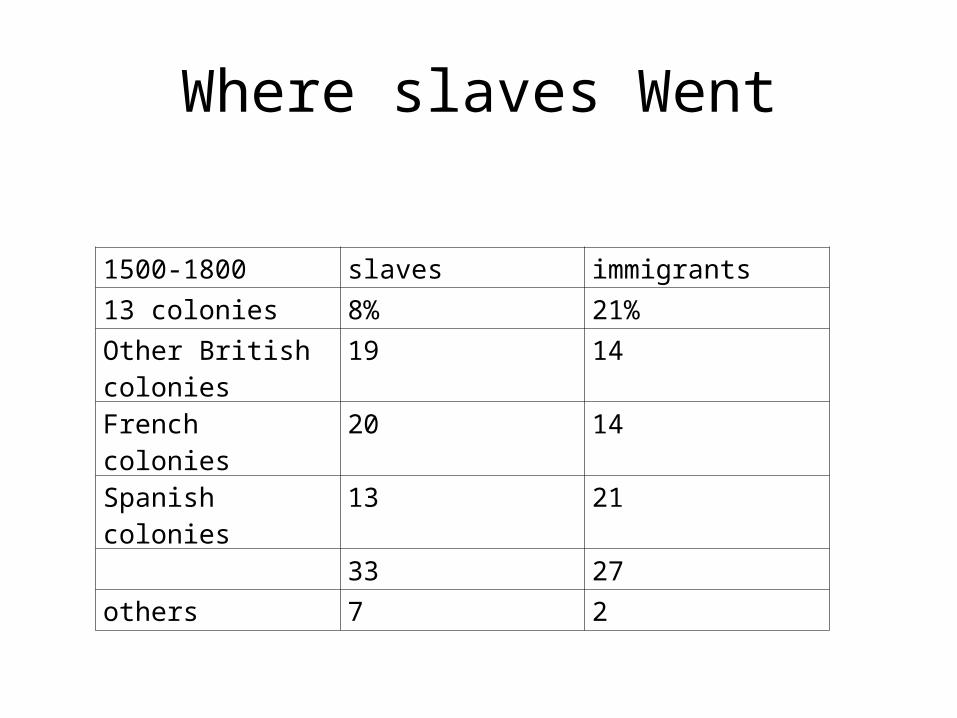
Where slaves Went
1500-1800 slaves immigrants
13 colonies 8% 21%
Other British colonies
19 14
French colonies 20 14
Spanish colonies 13 21
33 27
others 7 2

Differences• Percentage of slaves in general population much lower in U.S. compared
to Caribbean. – Economies of scale plus climate meant that sugar colonies were heavily black.
• Sugar plantations were some of the largest economic organizations of their times. – Many plantations had 100’s of slaves-little contact with whites and European
culture.
• Nature of sugar production required heavy labor-cutting the cane and squeezing the sugar out in large presses. – Little productive work for women-led to a sex imbalance among the slave
population.
• In many sugar colonies, whites comprised less than 20% of the population sometimes less than 10% of the population.
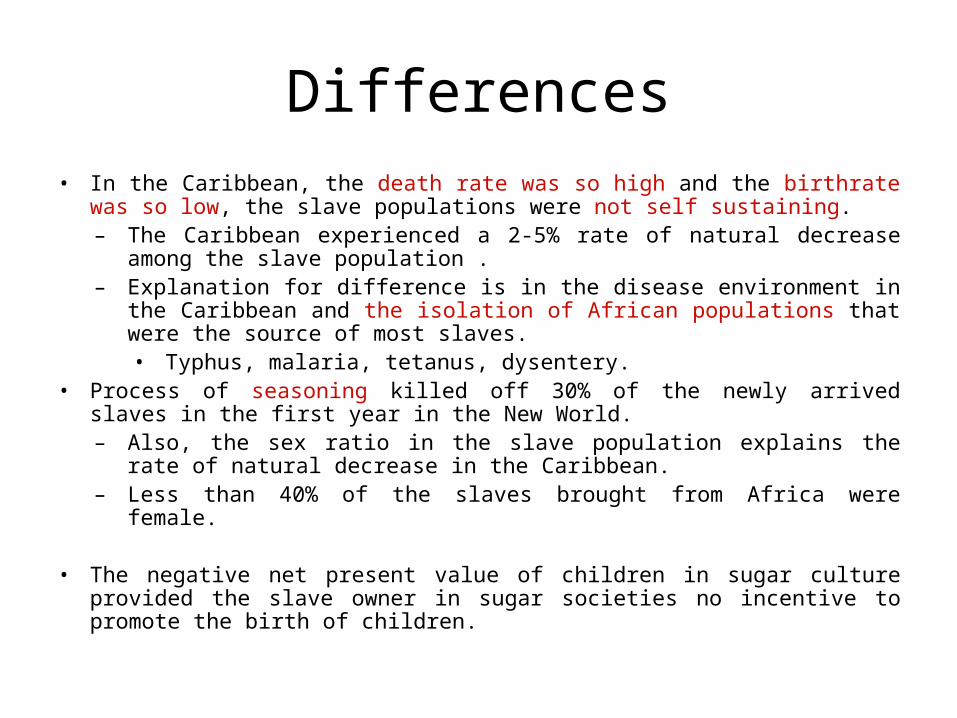
Differences• In the Caribbean, the death rate was so high and the birthrate was so low, the
slave populations were not self sustaining. – The Caribbean experienced a 2-5% rate of natural decrease among the slave
population .– Explanation for difference is in the disease environment in the Caribbean and
the isolation of African populations that were the source of most slaves. • Typhus, malaria, tetanus, dysentery.
• Process of seasoning killed off 30% of the newly arrived slaves in the first year in the New World. – Also, the sex ratio in the slave population explains the rate of natural decrease
in the Caribbean. – Less than 40% of the slaves brought from Africa were female.
• The negative net present value of children in sugar culture provided the slave owner in sugar societies no incentive to promote the birth of children.

Differences
• Through the 19th century, the majority of slaves in the Caribbean were born in Africa. – Native born blacks comprised the majority of US slaves as early as
1680.– By 1860, all but 1% of American slaves were American born.
• Natural Increase was the main cause of the increase in the US slave population. – Difference between US and Caribbean slave experiences. – US population was self sustaining from the beginning.
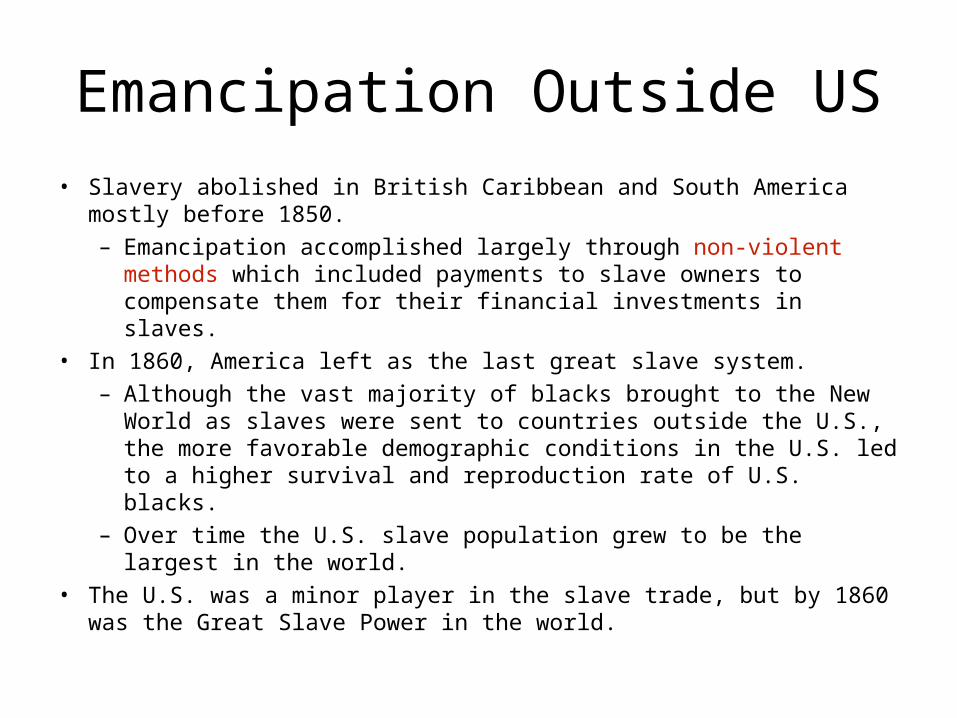
Emancipation Outside US• Slavery abolished in British Caribbean and South America mostly before
1850.– Emancipation accomplished largely through non-violent methods
which included payments to slave owners to compensate them for their financial investments in slaves.
• In 1860, America left as the last great slave system.– Although the vast majority of blacks brought to the New World as
slaves were sent to countries outside the U.S., the more favorable demographic conditions in the U.S. led to a higher survival and reproduction rate of U.S. blacks.
– Over time the U.S. slave population grew to be the largest in the world.
• The U.S. was a minor player in the slave trade, but by 1860 was the Great Slave Power in the world.

US Slavery and Cotton• Whitney’s Cotton Gin (1793) enabled short staple cotton to
be separated on a competitive commercial basis by mechanical means
• From 1820 to 1860, cotton output rose by a factor of 11.5, the slave population by 2.5, and output per slave by a factor of 4.6.
• From 1790 to 1860 the slave population in the South grew slightly more rapidly than the white population---in the absence of significant slave imports.
• Ownership of slaves became more concentrated by the 1850’s. Southern families owning slaves fell from 36% in 1830 to 25% in 1860.
Questions about Southern Agriculture
• What was the effect of Slavery on Southern Economic Growth?
• Were Slave Owners Rational? Was the purchase of a slave a rational decision on the part of the planter?
• Were slave plantations efficient? The least cost way of producing cotton. Would slavery have ended without the Civil War?

Traditional Historical View• Ulrich B. Philips-began publishing around 1905.
– Argued that slave culture continued because of speculation, economies of scale, and conspicuous consumption. (%Ps>%Pc)
– Therefore, because slavery was not economically viable, slavery would have ended on its own.
• Charles Ramsdell- Slave owners were forced to overproduce cotton-irrationality argument-economies of scale. – Natural Limits argument-Cotton production led to soil exhaustion so
that slavery required a constant expansion to new lands. • As new lands ran out, slavery would have ended. • Incompatibility of slavery and urban society.
– Slave system could not be adapted to urban conditions.– No systematic investigation of profitability of slavery.

Political Motivated
• Abolitionists argued that freeing slaves would increase economic growth because free labor would work harder than slave labor
• Slave owners were pre-capitalist class.

What effect did Slavery have on Southern Economic Growth?
1840 1860 Growth rate
National Average $96 $128 1.4
North 109 141 1.3
North East 129 181 1.7
North Central 65 89 1.6
South 74 103 1.7
South Atlantic 66 84 1.2
East South Central 69 89 1.3
West South Central 151 184 2.0
Per Capita Income 1840-1860 by region
Includes slaves
Although per capita income is lower than North, growth rate of income is higher especially in west

Was Slavery Profitable?• In the post World War II period, economists began applying economic
theory and statistics to the central questions of U.S. history.– Used different sources of data and different methodology than existing
scholars.– Quantitative vs. qualitative data.
• First study by Conrad and Meyer (1958)– Found that slave owners treated slaves like factory owners treated expensive
machinery.– C&M found that slave owners earned about 5-8% return on slave ownership.– C & M set off debate that refined their estimates. At the end of the debate, it
was found that the return on slaves was equivalent to the return on railroad bonds
• Evidence that slave owners were calculating businessmen interested only in profit-revolutionary idea at the time.
• Profitability of slavery undermines the argument for conspicuous consumption.

Conrad and Meyer Data
• Age price profiles.
• Collected data from slave markets.
• Detailed information about prices and characteristics of slaves recorded and published.
• Hire rates
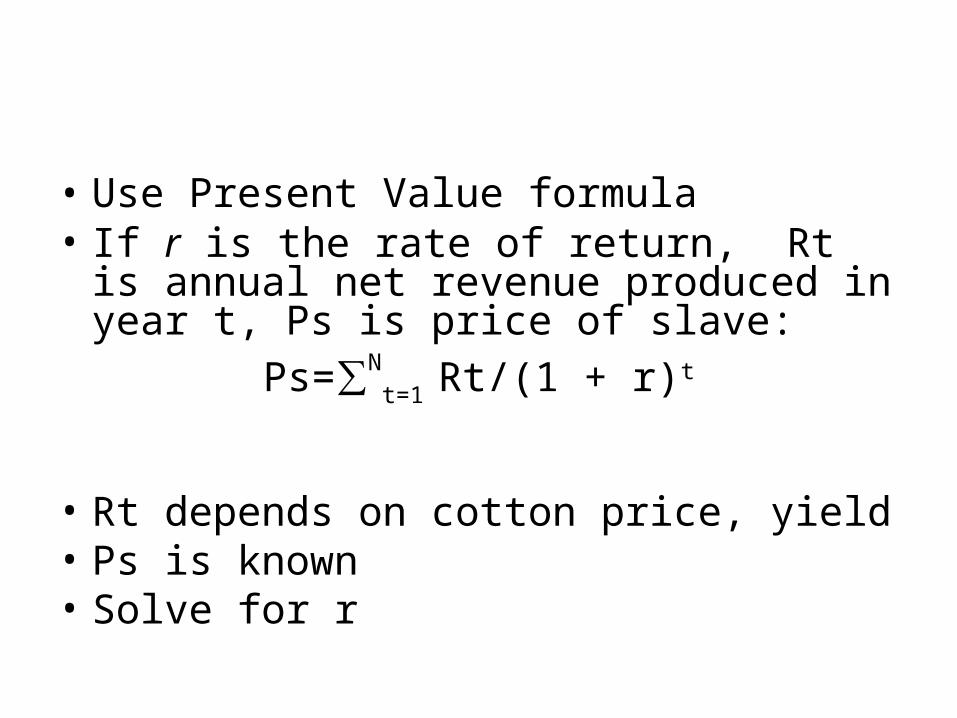
• Use Present Value formula• If r is the rate of return, Rt is annual net
revenue produced in year t, Ps is price of slave:Ps=∑N
t=1 Rt/(1 + r)t
• Rt depends on cotton price, yield• Ps is known• Solve for r

Net Income by Sex and AgeShows the net income a slave owner could expect from a typical slave at different ages.
Slaves began to cover their cost of maintenance at an early age—late adolescence.
Prior to age 15, women earned more than men—For most of life females earned 20-40% less than men
Typical in a non-industrial society

Accumulated Net Income/Age Profile
Shows the total lifetime income a slave owner realized from a typical slave at various ages.
Until around age 12, the slave is consuming more than the cost of maintenance—the line is downward sloping.
At age 12, the slave begins to produce more than he consumes-the line begins to slope upwards but remains below zero.
By age 28, the slave has “worked off” the investment the slaveowner made when the slave was young-the line is above zero.
Incentive for slave owner to maintain the slave as a productive asset throughout the slave’s life—the lines stays positively sloped.
Slave’s net income remained positive even in old age
Incentive for slave owners to keep old slaves—decent treatment of old slaves.

Age Price ProfileThe price of a slave at a given age is consistent with the present value of the expected net income of the slave over his remaining lifetime. Suggests slave owners were rational
At age 0, the slave had a positive price. This means that the slave owner had an incentive to encourage live births.
Peak price occurred in the late 20’s and early 30’s.
Only in the mid 70’s does ownership of a slave become unprofitable.
\
Rate of Return
• Conrad and Meyers found rates of return that varied from 2.2 to 5.4 % on poor quality land in South Atlantic area to 10-13 % in South West
• Slaves were not highly speculative investments

Slave Price increasing
Years Average Price Gross Rearing Cost1821-25 $736 $6571826-30 $792 $6141831-35 $974 $6711836-40 $1,206 $8481841-45 $744 $5911846-50 $936 $7371851-55 $1,252 $8071856-60 $1,596 $938
Capitalized Rent in an 18 yr. Old Slave
If slavery were becoming unprofitable, what would happen to slave prices in the year’s leading up to the Civil War?
Evidence shows that slavery was profitable, was getting more profitable, and was expected to continue to be profitable after the Civil War years.

Were Slave Plantations efficient?
• Fogel and Engerman, Time on the Cross– Robert Fogel (and Douglas North) won the Nobel
Prize in 1993
• Time on the Cross changed they way people thought about slavery and also was one of the first high profile uses of New Economic History
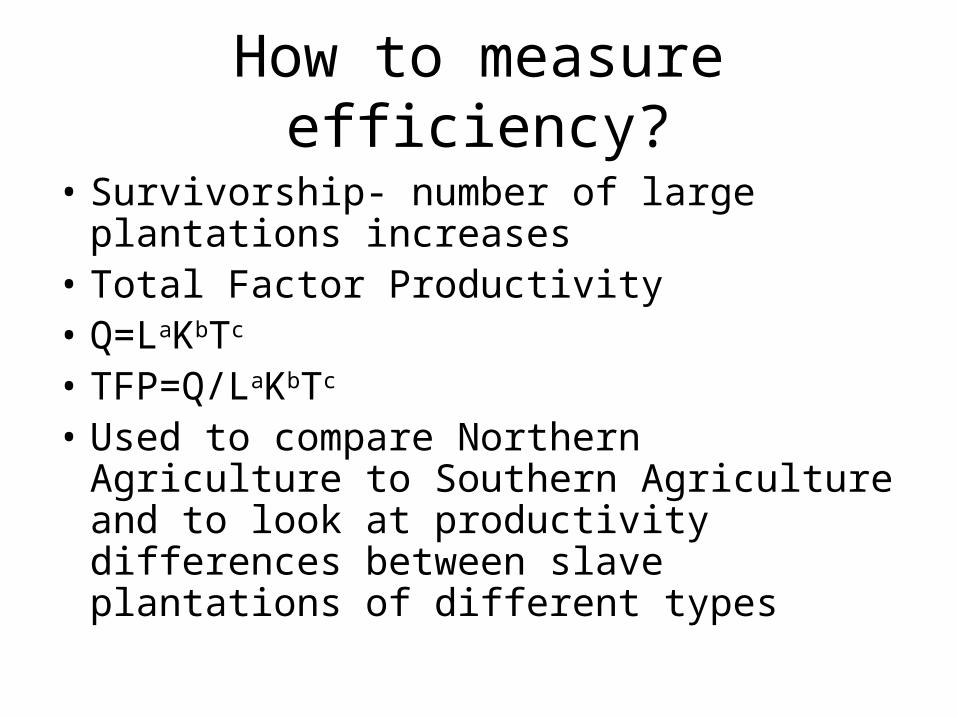
How to measure efficiency?
• Survivorship- number of large plantations increases
• Total Factor Productivity• Q=LaKbTc
• TFP=Q/LaKbTc
• Used to compare Northern Agriculture to Southern Agriculture and to look at productivity differences between slave plantations of different types

• a,b, c are factor shares for labor, capital and land – a=.58, b=.17, c=.25
• Data on L, K, T from census– L adjusted for age and sex differences– T adjusted for land quality

North vs South
• (Ls/Ln) .58 (Ks/Kn) .17 (Ts/Tn) .25 =72.8
• South has 72.8% of North’s inputs• Qs/Qn = 102.5
• South’s output is 102.5% of North’s inputs• TFP =102.5/72.8 = 140.8

Economies of Scale
• Data is from the Parker-Gallman Sample of the 1860 Census
• North= 100Farm size(#slaves) Old South New South
0 98.4 112.7
1-15 103.3 127.2
16-50 124.9 176.1
51 or more 135.1 154.7
All slave farms 118.9 153.1
All Farms 116.2 144.7

Criticism
• Labor variable-more frost free days in South and slave worked longer hours– FE response longer growing season does not mean
more hours
• Weights use to adjust labor

Criticism
• Land-FE used land value• David and Temin argue should not adjust on
the basis of value because it includes location advantage
• Most large plantation located on rivers when FE adjust for location advantage makes them more efficient.

Criticism
• Crop mix-North cannot grow cotton• Turns out farms in South with <15 slaves grow
about the same crop mix as in North and are still more efficient
Sources of Economics of Scale
• Specialization- Team production• Gang Labor System• How much is more intense labor due to
economics of scale in coercion as opposed to economies of scale in the production process?– Revisit this question after the Civil War

Treatment of slaves• Both positive incentives and punishments were used
to motivate slaves– Gang vs task system
• Slave diets were higher in calories than northern labor– Average height of slaves was inch less than northern born
whites– More than laborers in Europe– Slaves in sugar colonies– Slave children< 7 were smaller
Treatment of Slaves
• Slave families were kept together when it was in the interest of planters to do so– Slave families that were sold together brought a
higher price than would have been received if individual were sold separately
– Families were not always kept together

Domestic Slave Trade
• Domestic Slave trade remains in place until the Civil War
• States in South Atlantic exported slaves to South west
• Were plantation owners deliberately breeding slaves to be sold west?– Not clear
Evaluation of Fogel and Engerman’s work
• In the early 1990s, 178 Economic Historians were surveyed about a number of debates in economic history– All disagreed with these statements that planters were
irrational in using slave labor and that the plantation system was dying on the eve of the Civil War
– 75% agreed that slave agriculture was more efficient than free agriculture in either North or South
– More than half agreed with the statement that materially (not psychologically) slaves were better off than free workers

The Great Tragedy of the Civil War.
• Why fight?– Voluntary Emancipation and the failure of the U.S.
Constitution.– The usual method of conflict resolution in the U.S. is
through non-violent means , e.g. the ballot box. • Why was the Civil War so costly to fight—both in lives and
material?– Motivation.– Balance of Forces.– Technology and Tactics.
• Could Slavery have been ended more cheaply?

Explaining the Lethality of Civil War.
• 2 Factors led the Civil War to be very lethal.– Evenly matched opponents-same culture, tactics, weapons, etc.
• Balance of forces-equally divide country, same culture, tactics, technology and will to fight-leads to long and bloody conflict.
• Tactics.– Generals trained at the same military academies. – Many of them knew each other personally. – Wars where new tactics and technology are employed for the
first time are usually short and not bloody.

More Technology
– Improvements in Logistics• Railroads and canal system allowed the
concentration of large groups of armed men in the field for extended periods of time.
• The transportation system also allowed large groups of men to sustain a high level or armed conflict.
– Changes in the technology of warfare. • Musket vs. percussion cap vs. machine gun and
artillery--increased rate of fire of percussion muskets • Minnie Ball and Percussion Cap increased rate of fire.

Technology and Tactics
• The Civil War was a case where the technology of warfare had advanced while the tactics employed by generals had not adjusted.
• The result was a very high level of lethality.
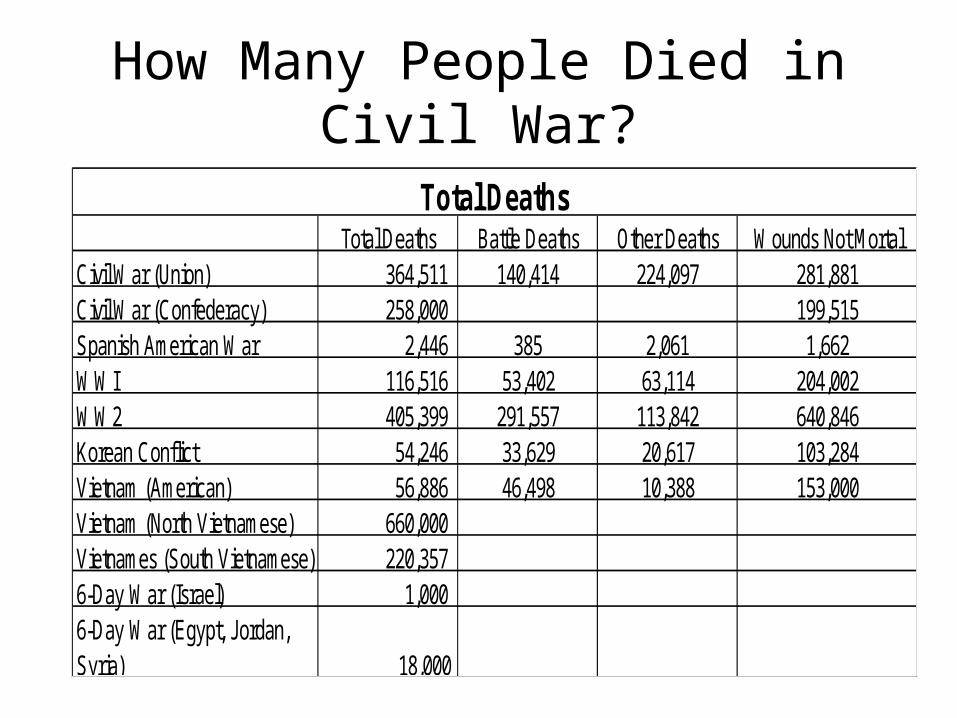
How Many People Died in Civil War?
Total Deaths Battle Deaths Other Deaths Wounds Not MortalCivil War (Union) 364,511 140,414 224,097 281,881Civil War (Confederacy) 258,000 199,515Spanish American War 2,446 385 2,061 1,662WWI 116,516 53,402 63,114 204,002WW2 405,399 291,557 113,842 640,846Korean Conflict 54,246 33,629 20,617 103,284Vietnam (American) 56,886 46,498 10,388 153,000Vietnam (North Vietnamese) 660,000 Vietnames (South Vietnamese) 220,357 6-Day War (Israel) 1,000 6-Day War (Egypt, Jordan, Syria) 18,000
Total Deaths

If you were a draft age male what were your chances of being killed or wounded?
Population
Percent of Male Population Killed
or Wounded
Percent of Male 15-24 Population
Killed or Wounded (17%
of population male, 15-24)
Civil War 31,443,321 7.02% 41.30%Spanish American War 50,000,000 0.02% 0.10%WWI 92,228,496 0.70% 4.09%WW2 132,164,569 1.58% 9.31%Korean Conflict 151,325,798 0.21% 1.22%Vietnam (U. S.) 203,302,031 0.21% 1.21%Vietnam (Vietnamese) 39,463,910 4.46% 26.24%6-Day War (Israel) 2,746,898 0.07% 0.43%6-Day War (Egypt, Jordan, Syria) 38,662,000 0.09% 0.55%
Deaths and Wounds as a Percent of Male Population

Monetary Cost of Civil War• Estimated cost of the Civil War was $6.6 billion dollars.
– About half of this government expenditure.– The rest includes loss of physical capital, loss of life
• Total cost of $206 for each American in 1861 or almost twice the amount consumed by the average American in 1860, i.e. 2 years wages.– Had the same amount been invested at 6% it could have provided an
annuity equal to 10 % of average income.– $6.6 billion was enough to buy the freedom of all the slaves at market
prices, provide them with 40 acres and a mule, and still leave $3.5 billion to pay for reparations to blacks for the lost pay under slavery.

Why Fight--Cost of Emancipation to White Southerners in 1860.
• The U.S. constitutional system is good at compromise--division of powers, senate vs. house of republicans, electoral college. Etc.
• Constitution constructed to force differences of opinion into the political arena and it has largely been a success. – The U.S. is largely free of outbreaks of violence.
• The constitution and politicians wrestled with the slavery question for decades prior to the Civil War. – End of slave trade in 1810-expected to end system of slavery.– 3/5ths Compromise-count each slave as 3/5ths of a person for determining
representation.– 1820-Missouri compromise (Maine Missouri) – Compromise of 1850 (Land acquired in Mexican/American war)– Kansas Nebraska Act (1854).
• Ultimately, the constitution failed. Slavery was “too big” a question.

The end of slavery the one big issue where the U.S. constitution failed.
• Capital Value of Slaves in 1860 was $2.7 Billion.– Invested at 2.5% this was enough to reduce the value of income to the
average southerner by 23%.– Clearly, the end of slavery would have a profound and significant effect
on the average white southerner’s welfare.• Southerners were not going to agree to any system of voluntary
emancipation that did not fully compensate them for the value of their slaves.
• Northerners would have to impose very large tax increases to pay for voluntary emancipation.

The Conundrum of the Civil War.—Why did Northerners fight CW?
• Main Beneficiary of Slavery White Northern consumers.– Why the second half of Fogel’s Without Consent or Contract (The
Ideological and Political Battle Against Slavery) is about the battle to end slavery.
• Slavery the low cost method of producing cotton. – Gang system of labor.– Hand rating system.– Monitoring costs.
• Market in slaves competitive so that slave owners earned only a normal rate of return on slave ownership.
• Market in cotton textiles competitive so that price of cotton bid down to the minimum ATC of production.
• Consumers who bought cotton textiles enjoyed the benefits of slavery in terms of lower cotton prices.

“The Great Moral Crusade.”
• Northerners subjected themselves to huge cost to end slavery which did not directly benefit them.
• Moral explanations of the end of slavery.Fogel concludes that whites were not pursuing their
narrowly defined self interest (money income) in ending slavery but instead were motivated mainly by moral factors.
– Why half of his book, Without Consent or Contract, is entitled “The Ideological and Political Campaign Against Slavery.”
Historiography of Civil War • In the period prior to the Civil War, abolitionists mounted
a public relations campaign against slavery.– Similar to the anti-smoking campaign going on today.– They argued that “the end justifies the means.”

Turning Point of US Economic History?
• Was the Civil War the turning point of US Economic History? If so why?– Not much evidence to support in GDP or GDP per
capita growth statistics– The Southern economy does grow more slowly
than the Northern economy after the war.