Southeastern Asset Management & Longleaf Partners Funds€¦ · 1 Year 5 Year 10 Year Since...
30
Intelligent Investing in an Uncertain Environment Southeastern Asset Management & Longleaf Partners Funds November 2016
-
Upload
vuongtuyen -
Category
Documents
-
view
212 -
download
0
Transcript of Southeastern Asset Management & Longleaf Partners Funds€¦ · 1 Year 5 Year 10 Year Since...
Intelligent Investing in an Uncertain Environment
Southeastern Asset Management &Longleaf Partners Funds
November 2016
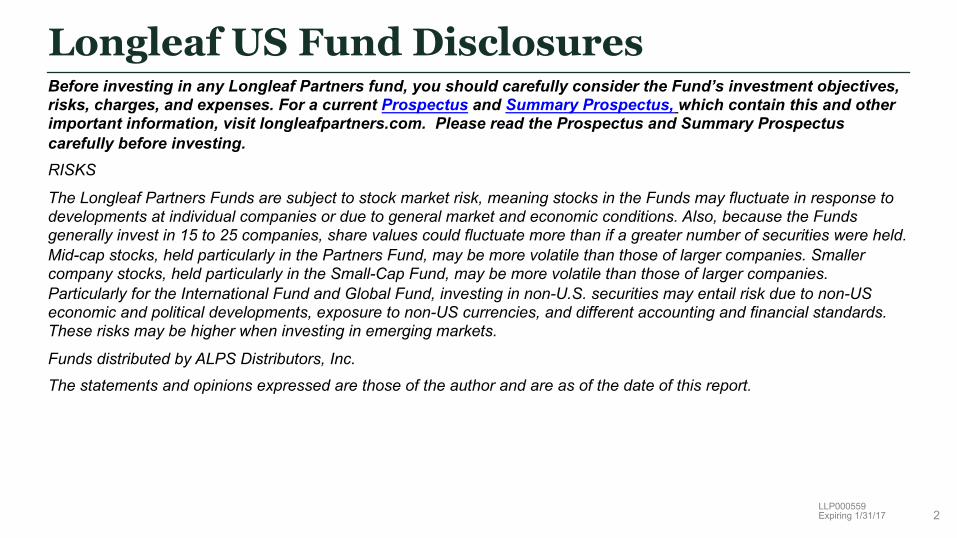
Before investing in any Longleaf Partners fund, you should carefully consider the Fund’s investment objectives, risks, charges, and expenses. For a current Prospectus and Summary Prospectus, which contain this and other important information, visit longleafpartners.com. Please read the Prospectus and Summary Prospectus carefully before investing. RISKS
The Longleaf Partners Funds are subject to stock market risk, meaning stocks in the Funds may fluctuate in response to developments at individual companies or due to general market and economic conditions. Also, because the Funds generally invest in 15 to 25 companies, share values could fluctuate more than if a greater number of securities were held. Mid-cap stocks, held particularly in the Partners Fund, may be more volatile than those of larger companies. Smaller company stocks, held particularly in the Small-Cap Fund, may be more volatile than those of larger companies. Particularly for the International Fund and Global Fund, investing in non-U.S. securities may entail risk due to non-US economic and political developments, exposure to non-US currencies, and different accounting and financial standards. These risks may be higher when investing in emerging markets.
Funds distributed by ALPS Distributors, Inc.
The statements and opinions expressed are those of the author and are as of the date of this report.
Longleaf US Fund Disclosures
2LLP000559Expiring 1/31/17
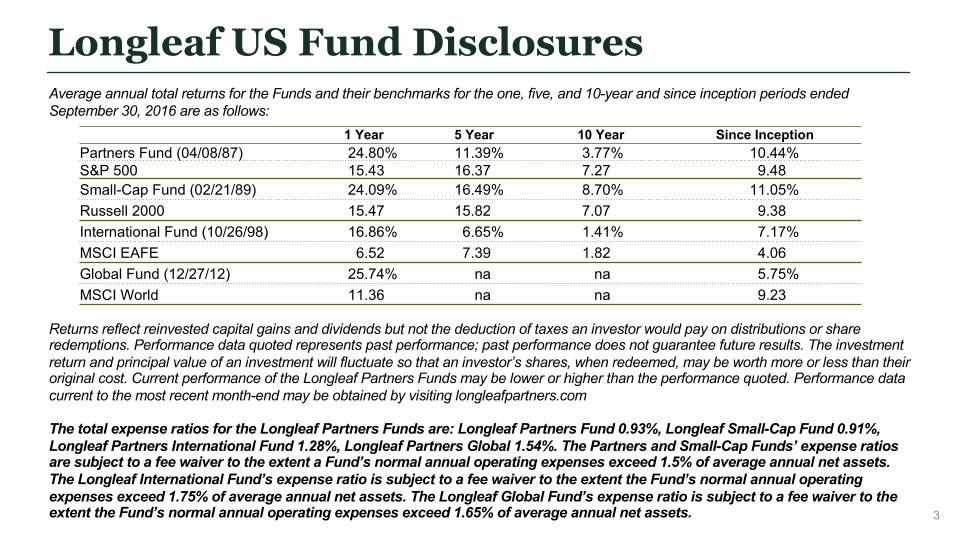
Longleaf US Fund DisclosuresAverage annual total returns for the Funds and their benchmarks for the one, five, and 10-year and since inception periods endedSeptember 30, 2016 are as follows:
Returns reflect reinvested capital gains and dividends but not the deduction of taxes an investor would pay on distributions or share redemptions. Performance data quoted represents past performance; past performance does not guarantee future results. The investment return and principal value of an investment will fluctuate so that an investor’s shares, when redeemed, may be worth more or less than their original cost. Current performance of the Longleaf Partners Funds may be lower or higher than the performance quoted. Performance data current to the most recent month-end may be obtained by visiting longleafpartners.com
The total expense ratios for the Longleaf Partners Funds are: Longleaf Partners Fund 0.93%, Longleaf Small-Cap Fund 0.91%, Longleaf Partners International Fund 1.28%, Longleaf Partners Global 1.54%. The Partners and Small-Cap Funds’ expense ratios are subject to a fee waiver to the extent a Fund’s normal annual operating expenses exceed 1.5% of average annual net assets.The Longleaf International Fund’s expense ratio is subject to a fee waiver to the extent the Fund’s normal annual operating expenses exceed 1.75% of average annual net assets. The Longleaf Global Fund’s expense ratio is subject to a fee waiver to the extent the Fund’s normal annual operating expenses exceed 1.65% of average annual net assets.
1 Year 5 Year 10 Year Since InceptionPartners Fund (04/08/87) 24.80% 11.39% 3.77% 10.44%S&P 500 15.43 16.37 7.27 9.48Small-Cap Fund (02/21/89) 24.09% 16.49% 8.70% 11.05%Russell 2000 15.47 15.82 7.07 9.38International Fund (10/26/98) 16.86% 6.65% 1.41% 7.17%MSCI EAFE 6.52 7.39 1.82 4.06Global Fund (12/27/12) 25.74% na na 5.75%MSCI World 11.36 na na 9.23
3
Longleaf US Fund Disclosures
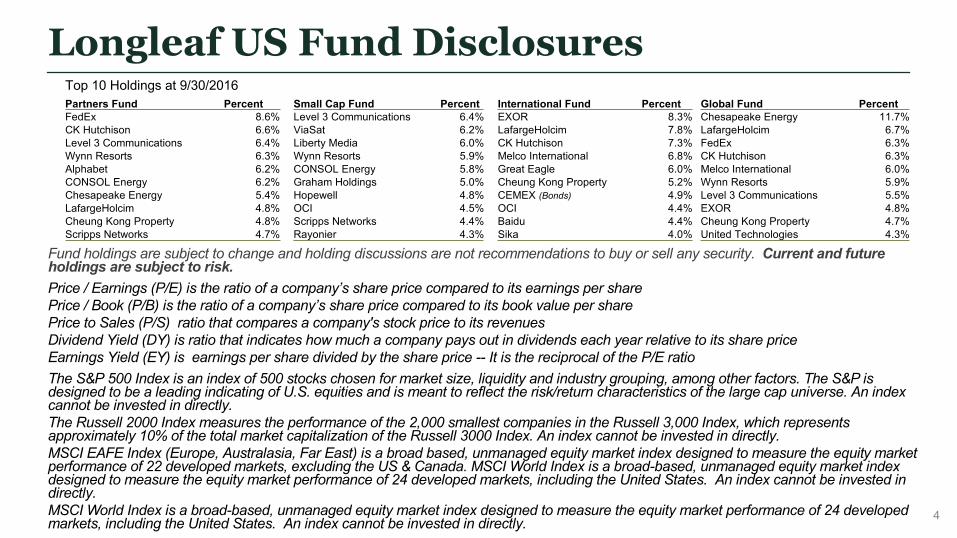
Fund holdings are subject to change and holding discussions are not recommendations to buy or sell any security. Current and future holdings are subject to risk. Price / Earnings (P/E) is the ratio of a company’s share price compared to its earnings per sharePrice / Book (P/B) is the ratio of a company’s share price compared to its book value per sharePrice to Sales (P/S) ratio that compares a company's stock price to its revenuesDividend Yield (DY) is ratio that indicates how much a company pays out in dividends each year relative to its share priceEarnings Yield (EY) is earnings per share divided by the share price -- It is the reciprocal of the P/E ratioThe S&P 500 Index is an index of 500 stocks chosen for market size, liquidity and industry grouping, among other factors. The S&P isdesigned to be a leading indicating of U.S. equities and is meant to reflect the risk/return characteristics of the large cap universe. An index cannot be invested in directly. The Russell 2000 Index measures the performance of the 2,000 smallest companies in the Russell 3,000 Index, which represents approximately 10% of the total market capitalization of the Russell 3000 Index. An index cannot be invested in directly.MSCI EAFE Index (Europe, Australasia, Far East) is a broad based, unmanaged equity market index designed to measure the equity market performance of 22 developed markets, excluding the US & Canada. MSCI World Index is a broad-based, unmanaged equity market indexdesigned to measure the equity market performance of 24 developed markets, including the United States. An index cannot be invested in directly.MSCI World Index is a broad-based, unmanaged equity market index designed to measure the equity market performance of 24 developed markets, including the United States. An index cannot be invested in directly.
Top 10 Holdings at 9/30/2016Partners Fund Percent Small Cap Fund Percent International Fund Percent Global Fund PercentFedEx 8.6% Level 3 Communications 6.4% EXOR 8.3% Chesapeake Energy 11.7%CK Hutchison 6.6% ViaSat 6.2% LafargeHolcim 7.8% LafargeHolcim 6.7%Level 3 Communications 6.4% Liberty Media 6.0% CK Hutchison 7.3% FedEx 6.3%Wynn Resorts 6.3% Wynn Resorts 5.9% Melco International 6.8% CK Hutchison 6.3%Alphabet 6.2% CONSOL Energy 5.8% Great Eagle 6.0% Melco International 6.0%CONSOL Energy 6.2% Graham Holdings 5.0% Cheung Kong Property 5.2% Wynn Resorts 5.9%Chesapeake Energy 5.4% Hopewell 4.8% CEMEX (Bonds) 4.9% Level 3 Communications 5.5%LafargeHolcim 4.8% OCI 4.5% OCI 4.4% EXOR 4.8%Cheung Kong Property 4.8% Scripps Networks 4.4% Baidu 4.4% Cheung Kong Property 4.7%Scripps Networks 4.7% Rayonier 4.3% Sika 4.0% United Technologies 4.3%
4
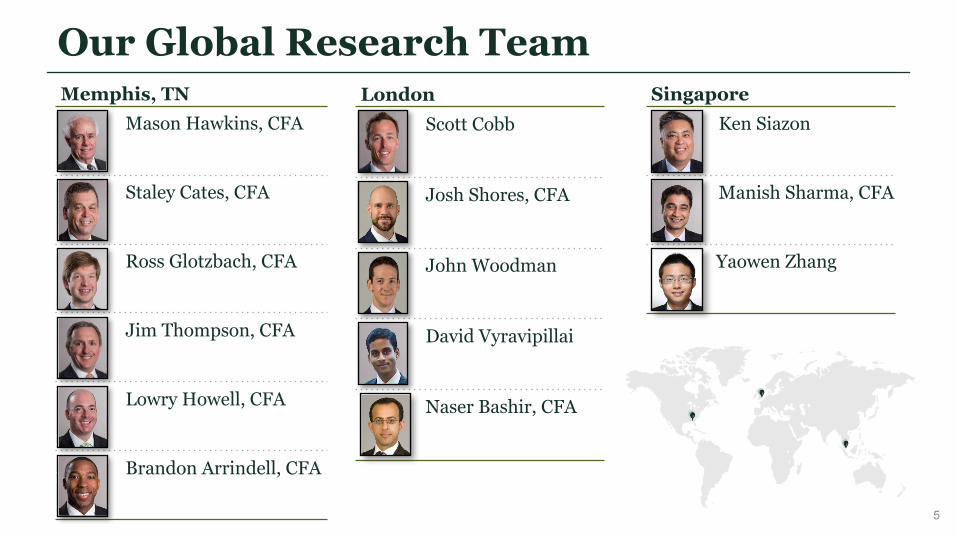
Our Global Research Team
5
Memphis, TNMason Hawkins, CFA
Staley Cates, CFA
Ross Glotzbach, CFA
Jim Thompson, CFA
Lowry Howell, CFA
Brandon Arrindell, CFA
SingaporeKen Siazon
Manish Sharma, CFA
Yaowen Zhang
LondonScott Cobb
Josh Shores, CFA
John Woodman
David Vyravipillai
Naser Bashir, CFA
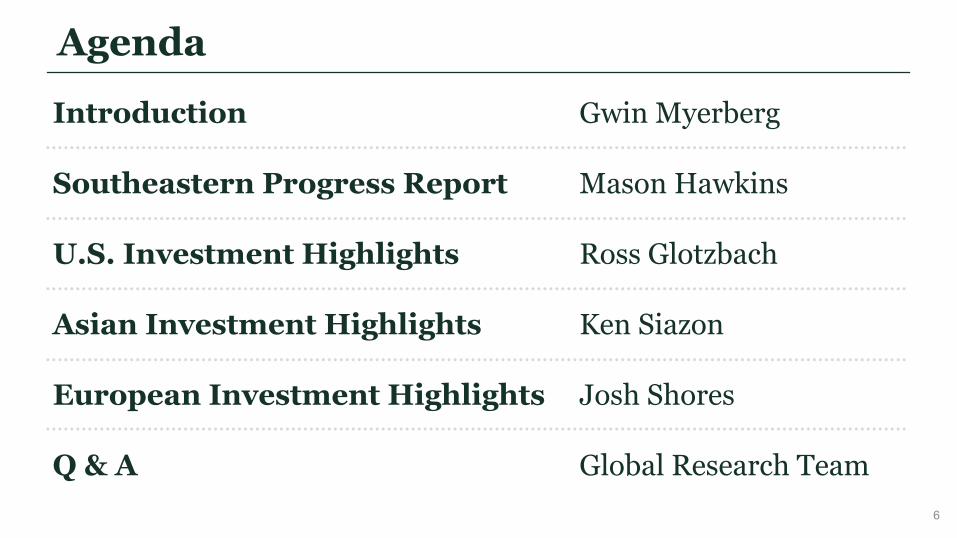
Introduction Gwin Myerberg
Southeastern Progress Report Mason Hawkins
U.S. Investment Highlights Ross Glotzbach
Asian Investment Highlights Ken Siazon
European Investment Highlights Josh Shores
Q & A Global Research Team
Agenda
6
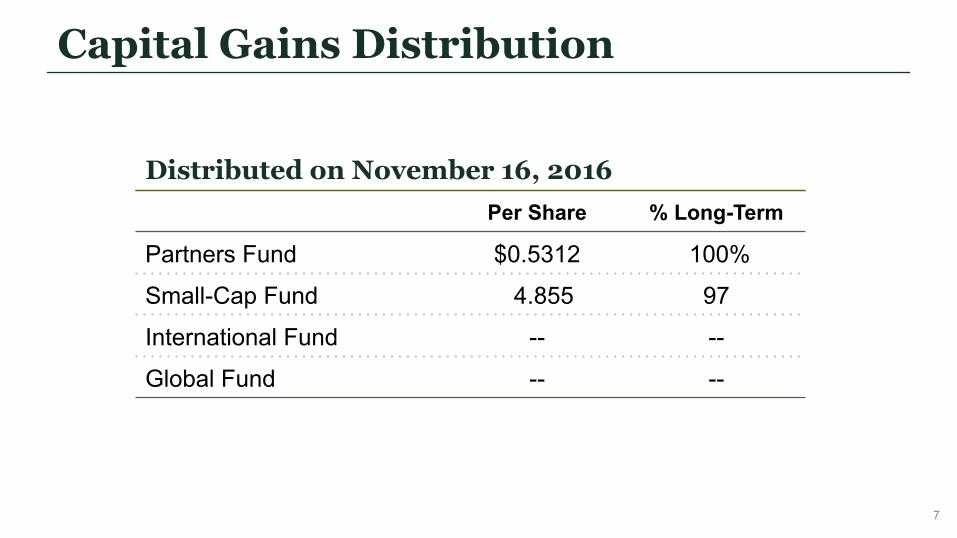
Capital Gains Distribution
Per Share % Long-Term
Partners Fund $0.5312 100%
Small-Cap Fund 4.855 97
International Fund -- --
Global Fund -- --
Distributed on November 16, 2016
7
Southeastern Progress ReportMason Hawkins
9
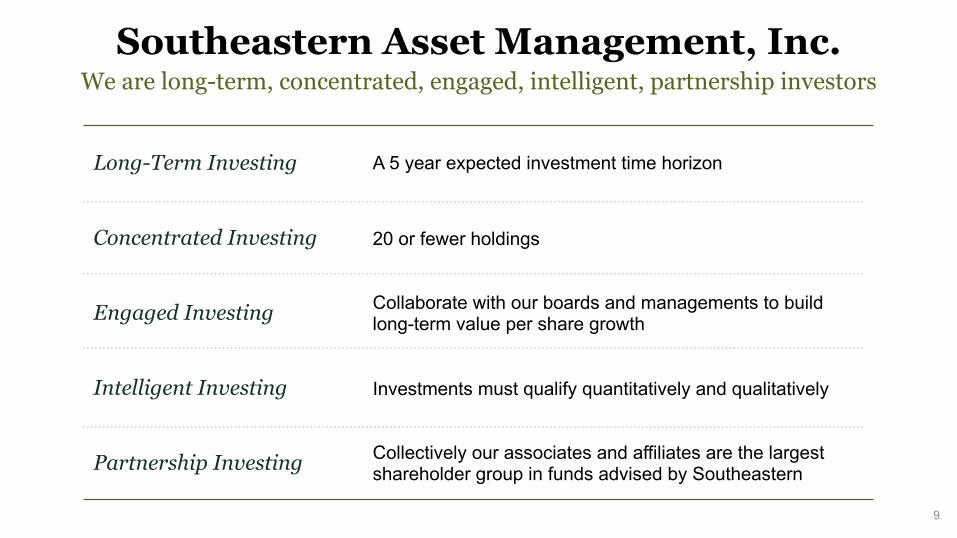
Southeastern Asset Management, Inc.We are long-term, concentrated, engaged, intelligent, partnership investors
Long-Term Investing A 5 year expected investment time horizon
Concentrated Investing 20 or fewer holdings
Engaged Investing Collaborate with our boards and managements to build long-term value per share growth
Intelligent Investing Investments must qualify quantitatively and qualitatively
Partnership Investing Collectively our associates and affiliates are the largest shareholder group in funds advised by Southeastern

Our Global Research Team
10
Memphis, TNMason Hawkins, CFA
Staley Cates, CFA
Ross Glotzbach, CFA
Jim Thompson, CFA
Lowry Howell, CFA
Brandon Arrindell, CFA
SingaporeKen Siazon
Manish Sharma, CFA
Yaowen Zhang
LondonScott Cobb
Josh Shores, CFA
John Woodman
David Vyravipillai
Naser Bashir, CFA
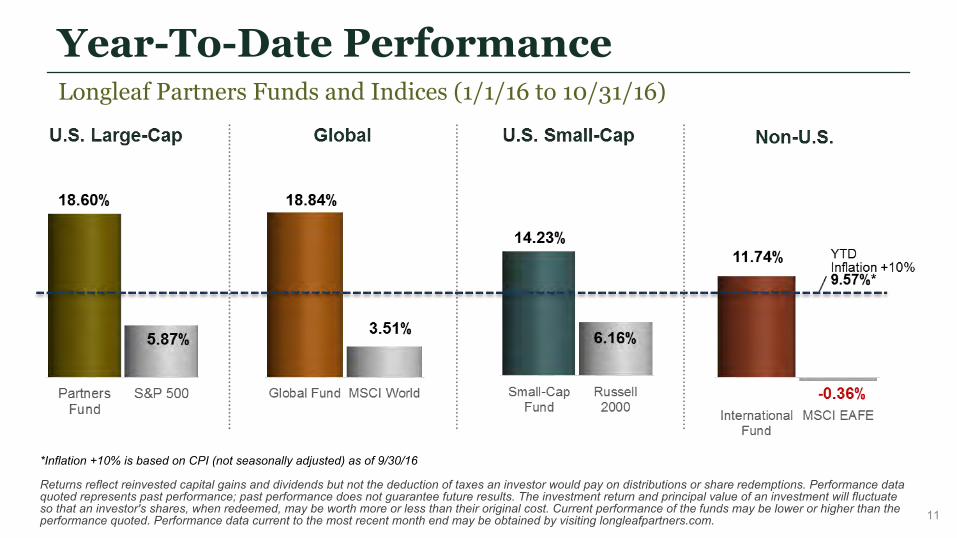
Year-To-Date PerformanceLongleaf Partners Funds and Indices (1/1/16 to 10/31/16)
*Inflation +10% is based on CPI (not seasonally adjusted) as of 9/30/16
Returns reflect reinvested capital gains and dividends but not the deduction of taxes an investor would pay on distributions or share redemptions. Performance data quoted represents past performance; past performance does not guarantee future results. The investment return and principal value of an investment will fluctuate so that an investor's shares, when redeemed, may be worth more or less than their original cost. Current performance of the funds may be lower or higher than the performance quoted. Performance data current to the most recent month end may be obtained by visiting longleafpartners.com. 11
U.S. Investment HighlightsRoss Glotzbach
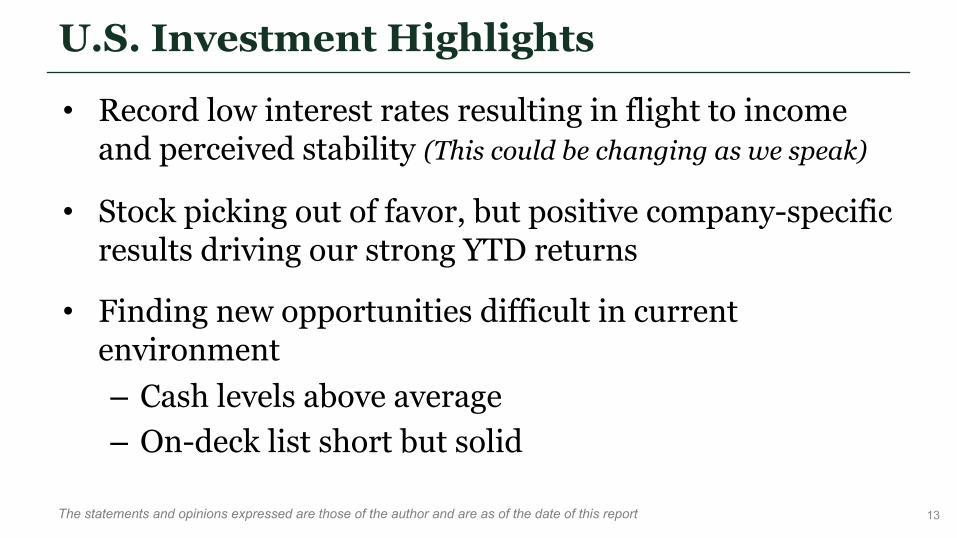
U.S. Investment Highlights
• Record low interest rates resulting in flight to income and perceived stability (This could be changing as we speak)
• Stock picking out of favor, but positive company-specific results driving our strong YTD returns
• Finding new opportunities difficult in current environment– Cash levels above average– On-deck list short but solid
The statements and opinions expressed are those of the author and are as of the date of this report 13
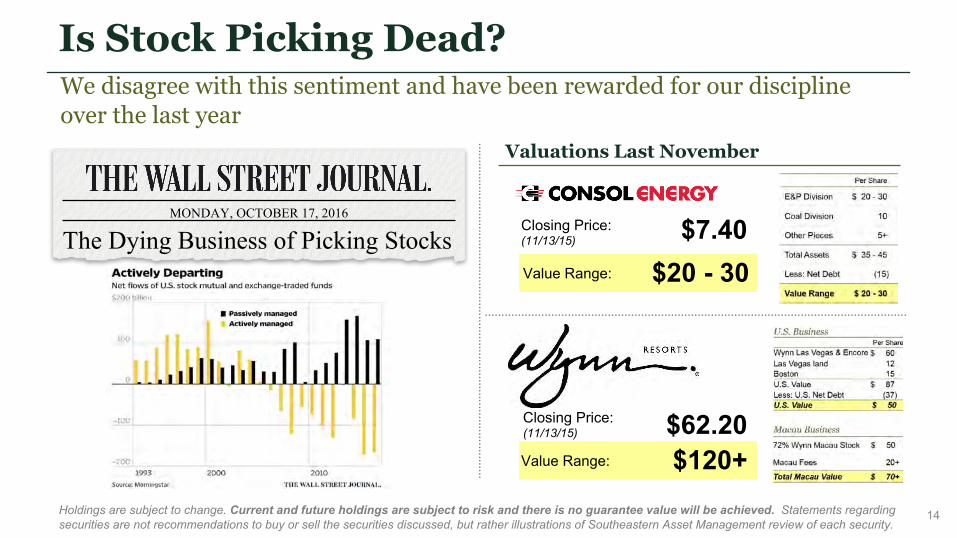
$20 - 30Value Range:
$7.40Closing Price: (11/13/15)
$62.20Closing Price: (11/13/15)
Valuations Last November
$120+Value Range:
Is Stock Picking Dead?We disagree with this sentiment and have been rewarded for our discipline over the last year
The Dying Business of Picking StocksMONDAY, OCTOBER 17, 2016
Holdings are subject to change. Current and future holdings are subject to risk and there is no guarantee value will be achieved. Statements regarding securities are not recommendations to buy or sell the securities discussed, but rather illustrations of Southeastern Asset Management review of each security.
14
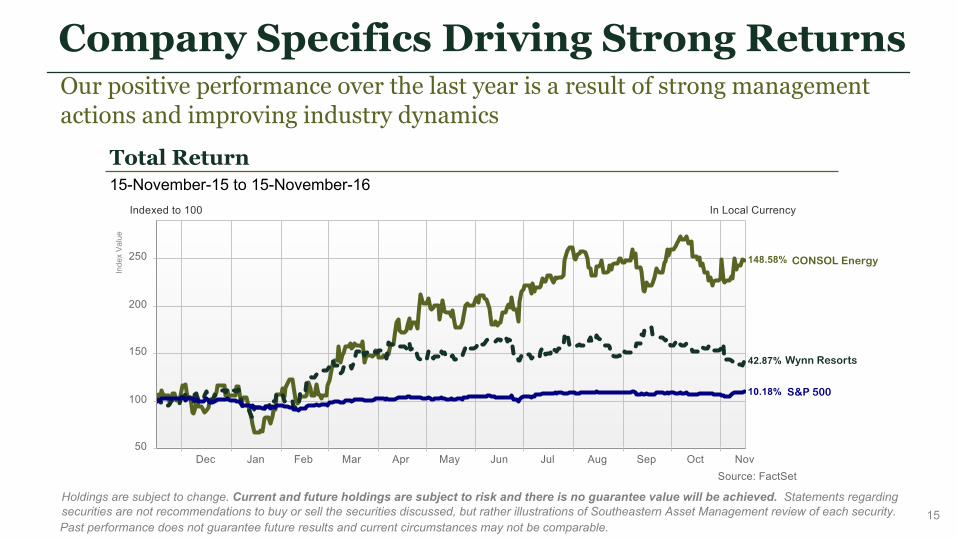
Company Specifics Driving Strong ReturnsOur positive performance over the last year is a result of strong management actions and improving industry dynamics
Total Return 15-November-15 to 15-November-16
15
CONSOL Energy
Wynn Resorts
S&P 500
Holdings are subject to change. Current and future holdings are subject to risk and there is no guarantee value will be achieved. Statements regarding securities are not recommendations to buy or sell the securities discussed, but rather illustrations of Southeastern Asset Management review of each security.Past performance does not guarantee future results and current circumstances may not be comparable.
Inde
x Va
lue
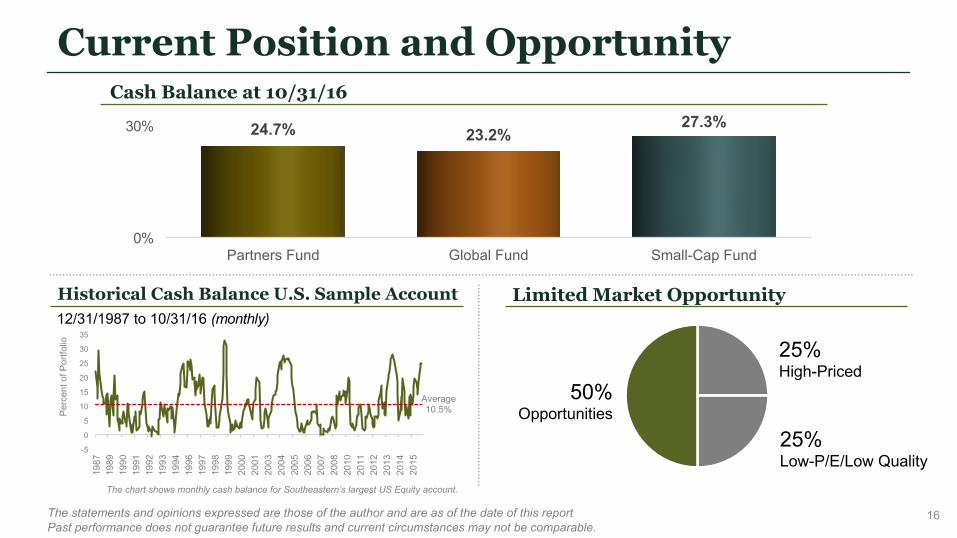
24.7% 23.2%27.3%
0%
30%
Partners Fund Global Fund Small-Cap Fund
Current Position and OpportunityCash Balance at 10/31/16
Historical Cash Balance U.S. Sample Account12/31/1987 to 10/31/16 (monthly)
Limited Market Opportunity
25%High-Priced
25%Low-P/E/Low Quality
50%Opportunities
Average 10.5%
-5
0
5
10
15
20
25
30
35
1987
1989
1990
1991
1992
1993
1994
1996
1997
1998
1999
2000
2001
2003
2004
2005
2006
2007
2008
2010
2011
2012
2013
2014
2015
Perc
ent o
f Por
tfolio
The statements and opinions expressed are those of the author and are as of the date of this reportPast performance does not guarantee future results and current circumstances may not be comparable.
The chart shows monthly cash balance for Southeastern’s largest US Equity account.
16
Asian Investment HighlightsKen Siazon
Asian Investment Highlights• Asia remains most attractively valued region, in our
view, despite strong recent performance
• Positive company-specific results driving our strong YTD performance
• Investment opportunities in Japan and potential volatility resulting from – Fear of higher interest rates – Post-U.S. election uncertainty – Emerging Market weakness
18
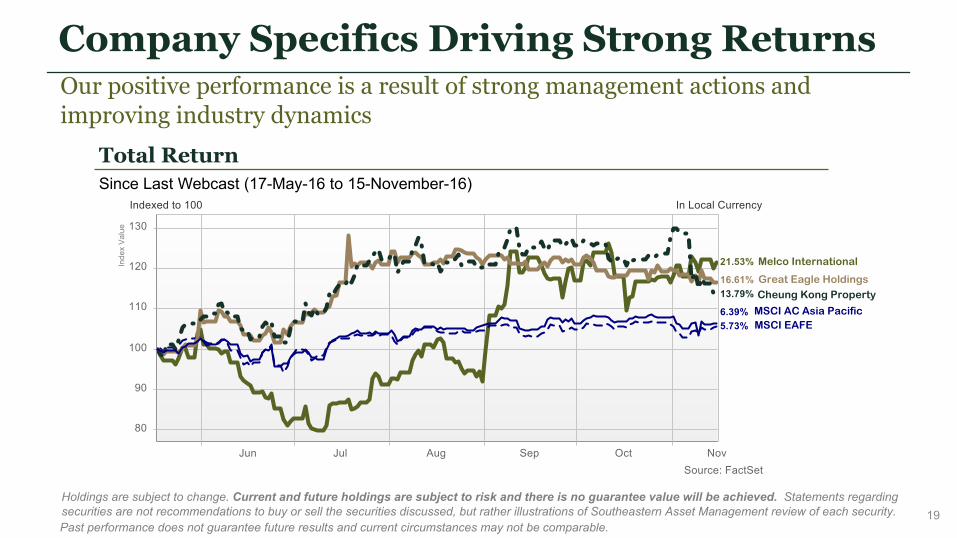
Our positive performance is a result of strong management actions and improving industry dynamics
Total Return Since Last Webcast (17-May-16 to 15-November-16)
Company Specifics Driving Strong Returns
Holdings are subject to change. Current and future holdings are subject to risk and there is no guarantee value will be achieved. Statements regarding securities are not recommendations to buy or sell the securities discussed, but rather illustrations of Southeastern Asset Management review of each security. 19
Melco International
Great Eagle HoldingsCheung Kong Property
MSCI AC Asia PacificMSCI EAFE
Past performance does not guarantee future results and current circumstances may not be comparable.
Inde
x Va
lue
0
50
100
150
200
250
300
350
Private Domestic Transaction PricesHang Seng Property Index
Historic Disconnect
Global Financial CrisisSARS
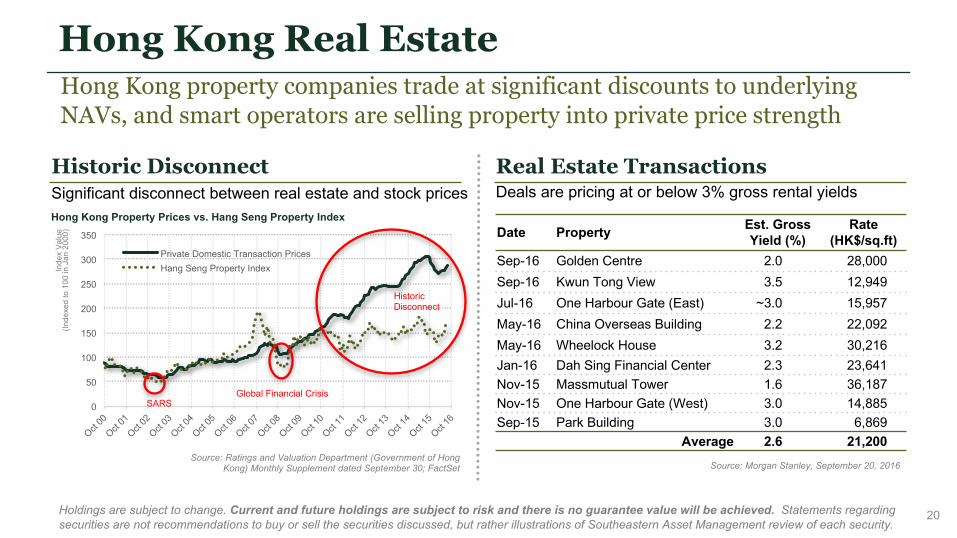
Hong Kong property companies trade at significant discounts to underlying NAVs, and smart operators are selling property into private price strength
Hong Kong Real Estate
Source: Ratings and Valuation Department (Government of Hong Kong) Monthly Supplement dated September 30; FactSet
Historic Disconnect Significant disconnect between real estate and stock prices
Date Property Est. Gross Yield (%)
Rate (HK$/sq.ft)
Sep-16 Golden Centre 2.0 28,000Sep-16 Kwun Tong View 3.5 12,949Jul-16 One Harbour Gate (East) ~3.0 15,957May-16 China Overseas Building 2.2 22,092May-16 Wheelock House 3.2 30,216Jan-16 Dah Sing Financial Center 2.3 23,641Nov-15 Massmutual Tower 1.6 36,187Nov-15 One Harbour Gate (West) 3.0 14,885Sep-15 Park Building 3.0 6,869
Average 2.6 21,200
Real Estate Transactions Deals are pricing at or below 3% gross rental yields
Source: Morgan Stanley, September 20, 2016
Holdings are subject to change. Current and future holdings are subject to risk and there is no guarantee value will be achieved. Statements regarding securities are not recommendations to buy or sell the securities discussed, but rather illustrations of Southeastern Asset Management review of each security.
20
Inde
x Va
lue
(Inde
xed
to 1
00 in
Jan
200
0)
Hong Kong Property Prices vs. Hang Seng Property Index
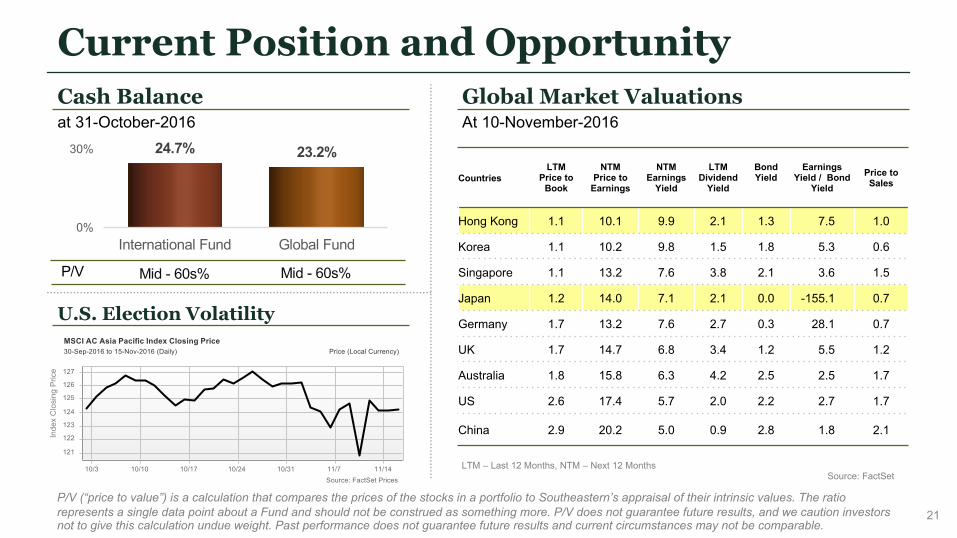
Current Position and OpportunityCash Balance at 31-October-2016
P/V (“price to value”) is a calculation that compares the prices of the stocks in a portfolio to Southeastern’s appraisal of their intrinsic values. The ratio represents a single data point about a Fund and should not be construed as something more. P/V does not guarantee future results, and we caution investors not to give this calculation undue weight. Past performance does not guarantee future results and current circumstances may not be comparable.
CountriesLTM
Price to Book
NTM Price to
Earnings
NTM Earnings
Yield
LTM Dividend
Yield
Bond Yield
Earnings Yield / Bond
YieldPrice to Sales
Hong Kong 1.1 10.1 9.9 2.1 1.3 7.5 1.0
Korea 1.1 10.2 9.8 1.5 1.8 5.3 0.6
Singapore 1.1 13.2 7.6 3.8 2.1 3.6 1.5
Japan 1.2 14.0 7.1 2.1 0.0 -155.1 0.7
Germany 1.7 13.2 7.6 2.7 0.3 28.1 0.7
UK 1.7 14.7 6.8 3.4 1.2 5.5 1.2
Australia 1.8 15.8 6.3 4.2 2.5 2.5 1.7
US 2.6 17.4 5.7 2.0 2.2 2.7 1.7
China 2.9 20.2 5.0 0.9 2.8 1.8 2.1
Global Market ValuationsAt 10-November-2016
LTM – Last 12 Months, NTM – Next 12 MonthsSource: FactSet
U.S. Election Volatility
21
Inde
x C
losi
ng P
rice
24.7% 23.2%
0%
30%
International Fund Global Fund
Mid - 60s%P/V Mid - 60s%
European Investment HighlightsJosh Shores
European Investment Highlights
• Investing within our circle of competence with ownership mentality being rewarded
• Positive company-specific results driving our strong YTD performance
• In our view, Europe remains more inefficient with wider stock dispersion and broad macro uncertainty
• Cash represents opportunity for next qualifiers
23
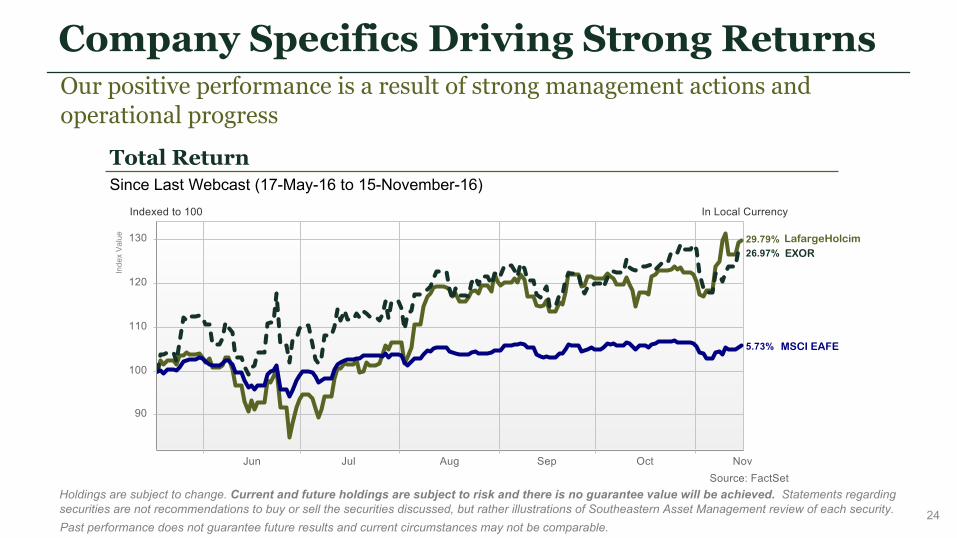
Company Specifics Driving Strong ReturnsOur positive performance is a result of strong management actions and operational progress
Total Return Since Last Webcast (17-May-16 to 15-November-16)
Holdings are subject to change. Current and future holdings are subject to risk and there is no guarantee value will be achieved. Statements regarding securities are not recommendations to buy or sell the securities discussed, but rather illustrations of Southeastern Asset Management review of each security. 24
LafargeHolcimEXOR
MSCI EAFE
Past performance does not guarantee future results and current circumstances may not be comparable.
Inde
x Va
lue
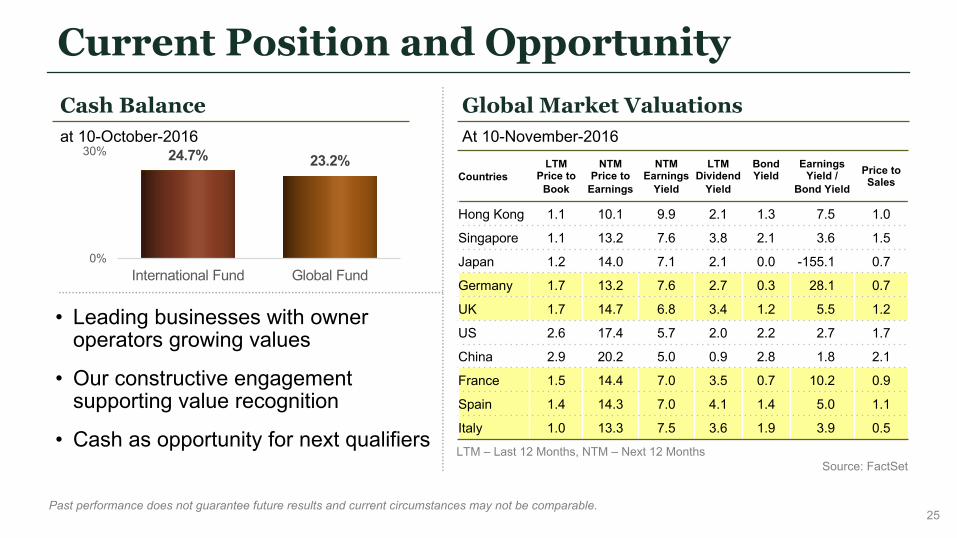
Current Position and Opportunity
Past performance does not guarantee future results and current circumstances may not be comparable.
Global Market ValuationsAt 10-November-2016
LTM – Last 12 Months, NTM – Next 12 MonthsSource: FactSet
CountriesLTM
Price to Book
NTM Price to
Earnings
NTM Earnings
Yield
LTM Dividend
Yield
Bond Yield
Earnings Yield /
Bond YieldPrice to Sales
Hong Kong 1.1 10.1 9.9 2.1 1.3 7.5 1.0
Singapore 1.1 13.2 7.6 3.8 2.1 3.6 1.5
Japan 1.2 14.0 7.1 2.1 0.0 -155.1 0.7
Germany 1.7 13.2 7.6 2.7 0.3 28.1 0.7
UK 1.7 14.7 6.8 3.4 1.2 5.5 1.2
US 2.6 17.4 5.7 2.0 2.2 2.7 1.7
China 2.9 20.2 5.0 0.9 2.8 1.8 2.1
France 1.5 14.4 7.0 3.5 0.7 10.2 0.9
Spain 1.4 14.3 7.0 4.1 1.4 5.0 1.1
Italy 1.0 13.3 7.5 3.6 1.9 3.9 0.5
25
• Leading businesses with owner operators growing values
• Our constructive engagement supporting value recognition
• Cash as opportunity for next qualifiers
Cash Balance at 10-October-2016
24.7% 23.2%
0%
30%
International Fund Global Fund

Q & ABrandon Arrindell
Q&A with Our Global Research Team
27
Memphis, TNMason Hawkins, CFA
Staley Cates, CFA
Ross Glotzbach, CFA
Jim Thompson, CFA
Lowry Howell, CFA
Brandon Arrindell, CFA
SingaporeKen Siazon
Manish Sharma, CFA
Yaowen Zhang
LondonScott Cobb
Josh Shores, CFA
John Woodman
David Vyravipillai
Naser Bashir, CFA
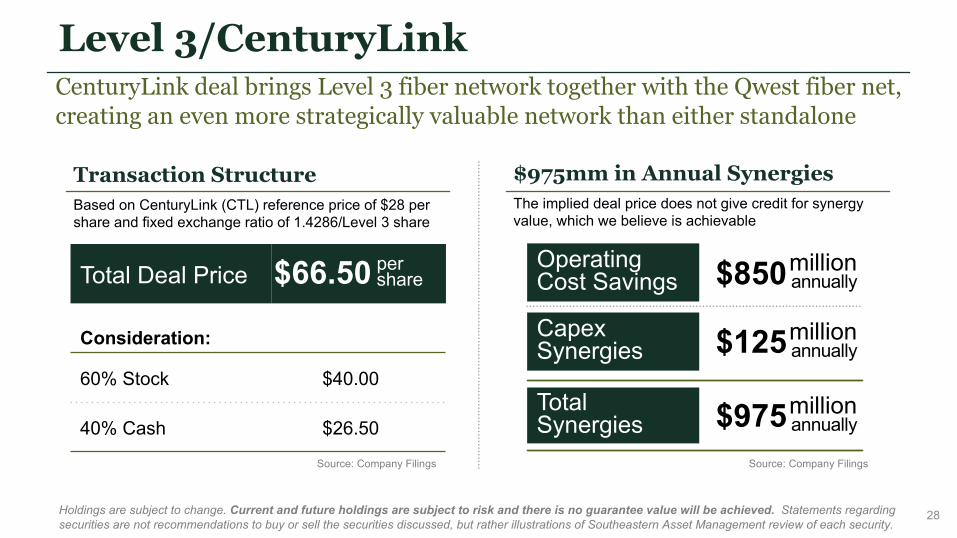
Level 3/CenturyLinkCenturyLink deal brings Level 3 fiber network together with the Qwest fiber net, creating an even more strategically valuable network than either standalone
Transaction StructureBased on CenturyLink (CTL) reference price of $28 per share and fixed exchange ratio of 1.4286/Level 3 share
$975mm in Annual SynergiesThe implied deal price does not give credit for synergy value, which we believe is achievable
Holdings are subject to change. Current and future holdings are subject to risk and there is no guarantee value will be achieved. Statements regarding securities are not recommendations to buy or sell the securities discussed, but rather illustrations of Southeastern Asset Management review of each security.
Total Deal Price pershare
Consideration:
60% Stock $40.00
40% Cash $26.50
Capex Synergies
million annually
Total Synergies
million annually
Operating Cost Savings
million annually$850
$125
$975 Source: Company Filings Source: Company Filings
$66.50
28
0
2
4
6
8
10
0
20
40
60
80
100
Chesapeake Bond Trading RangeChesapeake Stock Price
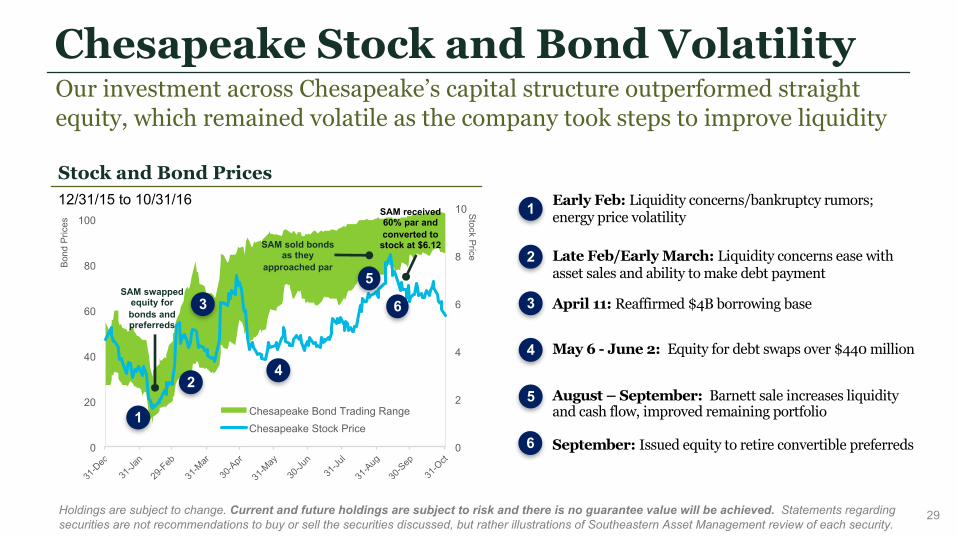
Chesapeake Stock and Bond VolatilityOur investment across Chesapeake’s capital structure outperformed straight equity, which remained volatile as the company took steps to improve liquidity
Stock Price
Bond
Pric
es
Stock and Bond Prices 12/31/15 to 10/31/16
1
2
3
4
5
Early Feb: Liquidity concerns/bankruptcy rumors; energy price volatility
Late Feb/Early March: Liquidity concerns ease with asset sales and ability to make debt payment
April 11: Reaffirmed $4B borrowing base
May 6 - June 2: Equity for debt swaps over $440 million
August – September: Barnett sale increases liquidity and cash flow, improved remaining portfolio
September: Issued equity to retire convertible preferreds
1
2
3
4
5
6
6SAM swapped
equity for bonds and preferreds
SAM sold bonds as they
approached par
SAM received 60% par and converted to
stock at $6.12
Holdings are subject to change. Current and future holdings are subject to risk and there is no guarantee value will be achieved. Statements regarding securities are not recommendations to buy or sell the securities discussed, but rather illustrations of Southeastern Asset Management review of each security.
29
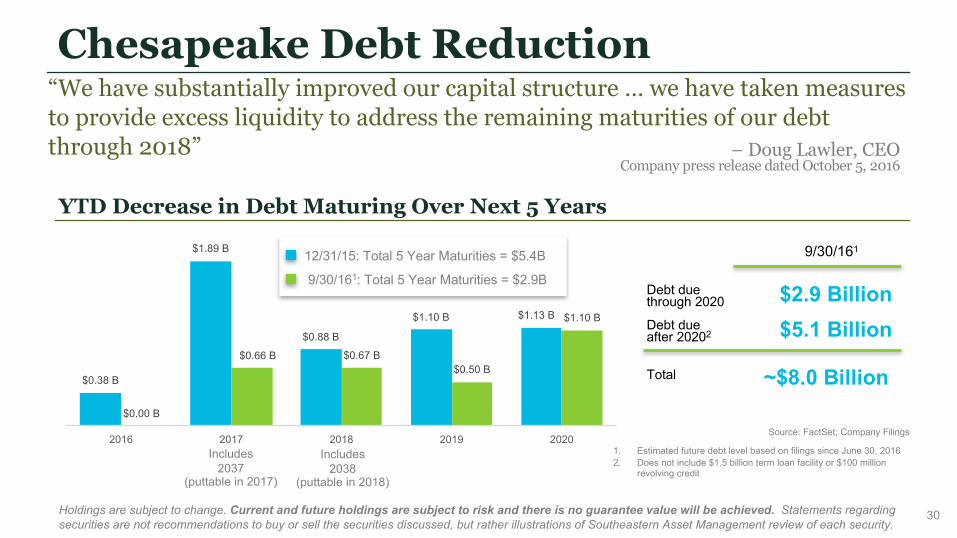
Chesapeake Debt Reduction“We have substantially improved our capital structure … we have taken measures to provide excess liquidity to address the remaining maturities of our debt through 2018” – Doug Lawler, CEO
Company press release dated October 5, 2016
YTD Decrease in Debt Maturing Over Next 5 Years
$5.1 BillionDebt dueafter 20202
$2.9 BillionDebt duethrough 2020
~$8.0 BillionTotal
Source: FactSet; Company Filings
1. Estimated future debt level based on filings since June 30, 20162. Does not include $1.5 billion term loan facility or $100 million
revolving credit
9/30/161
$0.38 B
$1.89 B
$0.88 B
$1.10 B $1.13 B
$0.00 B
$0.66 B $0.67 B$0.50 B
$1.10 B
2016 2017 2018 2019 2020Includes
2037(puttable in 2017)
Includes2038
(puttable in 2018)
12/31/15: Total 5 Year Maturities = $5.4B
9/30/161: Total 5 Year Maturities = $2.9B
Holdings are subject to change. Current and future holdings are subject to risk and there is no guarantee value will be achieved. Statements regarding securities are not recommendations to buy or sell the securities discussed, but rather illustrations of Southeastern Asset Management review of each security.
30