South32 Roadshow Presentation
84
MAKING A DIFFERENCE FROM THE GROUND UP ROADSHOW PRESENTATION MARCH 2015
Transcript of South32 Roadshow Presentation
TAO2013\Comms\2015.03.16 - South32 Global Roadshow Pres\150305 South32 Global Roadshow Pres POST BAC Submission_v14.pptx
MAKING A DIFFERENCE FROM THE GROUND UP
ROADSHOW PRESENTATION MARCH 2015

TAO2013\Comms\2015.03.16 - South32 Global Roadshow Pres\150305 South32 Global Roadshow Pres POST BAC Submission_v14.pptx
IMPORTANT INFORMATION AND DISCLAIMER
SLIDE 2 MARCH 2015
Nature of this presentation The information contained in this presentation does not constitute a prospectus or other listing document in relation to BHP Billiton or the new company proposed to be demerged from BHP Billiton (‘South32’) in any jurisdiction and is summary information provided for information purposes only. Any investment decision in relation to South32 should be made only on the basis of the information contained in the Listing Document for the relevant jurisdiction. The “Listing Documents”, which are available, subject to applicable securities laws, on the BHP Billiton website at www.bhpbilliton.com/demerger, comprise a prospectus which has been approved by the UK Listing Authority in connection with the proposed admission of South32’s ordinary shares to the standard listing segment of the Official List of the UK Financial Conduct Authority and to trading on the Main Market for listed securities of London Stock Exchange plc, an information memorandum in connection with South32’s application for the admission of its ordinary shares to listing on the Australian Securities Exchange and a pre-listing statement in connection with South32’s application for the admission of its ordinary shares to listing on the Johannesburg Stock Exchange. This presentation should not be relied upon in connection with voting on the proposed demerger. Information relating to the proposed demerger is set out in the Shareholder Circular. The Shareholder Circular is available on BHP Billiton’s website at www.bhpbilliton.com/demerger. Subject to applicable securities laws, shareholders may obtain printed copies of the Shareholder Circular and the Listing Document applicable to their jurisdiction (the “Disclosure Documents”) free of charge by calling the Shareholder Information Line (details set out in section 3.9 of the Listing Documents and under “Important notices” at the start of the Shareholder Circular). Nothing in this presentation should be construed as either an offer to sell or a solicitation of an offer to buy or sell BHP Billiton securities or securities in South32 in any jurisdiction. UK Financial Services and Markets Act 2000 approval The contents of this presentation, which have been prepared by and are the sole responsibility of BHP Billiton, have been approved by Goldman Sachs International solely for the purposes of section 21 of the United Kingdom’s Financial Services and Markets Act 2000 (as amended). Goldman Sachs International, which is authorised by the Prudential Regulation Authority and regulated by the Financial Conduct Authority and the Prudential Regulation Authority in the United Kingdom, is acting for BHP Billiton and no one else in connection with the proposed demerger of South32 and will not be responsible to anyone other than BHP Billiton for providing the protections afforded to clients of Goldman Sachs International, or for giving advice in connection with the proposed demerger of South32 or any matter referred to herein. Forward-looking statements This presentation contains forward-looking statements, which may include statements regarding, among other things: trends in commodity prices and currency exchange rates; demand for commodities; plans, strategies and objectives of management; closure or divestment of certain operations or facilities (including associated costs); anticipated production or construction commencement dates; capital costs and scheduling; operating costs and shortages of materials and skilled employees; anticipated productive lives of projects, mines and facilities; provisions and contingent liabilities; tax and regulatory developments. Forward-looking statements can be identified by the use of terminology such as ‘intend’, ‘aim’, ‘project’, ‘anticipate’, ‘estimate’, ‘plan’, ‘believe’, ‘expect’, ‘may’, ‘should’, ‘will’, ‘continue’, ‘annualised’ or similar words. These statements discuss future expectations concerning the results of operations or financial condition, or provide other forward-looking statements. These forward-looking statements are not guarantees or predictions of future performance, and involve known and unknown risks, uncertainties and other factors, many of which are beyond our control, and which may cause actual results to differ materially from those expressed in the statements contained in this presentation. Readers are cautioned not to put undue reliance on forward-looking statements. For example, future revenues from South32 operations, projects or mines described in this presentation will be based, in part, upon the market price of the minerals or metals produced, which may vary significantly from current levels. These variations, if materially adverse, may affect the timing or the feasibility of the development of a particular project, the expansion of certain facilities or mines, or the continuation of existing operations. Other factors that may affect the actual construction or production commencement dates, costs or production output and anticipated lives of operations, mines or facilities include South32’s ability to profitably produce and transport the minerals and/or metals extracted to applicable markets; the impact of foreign currency exchange rates on the market prices of the minerals or metals South32 produces; activities of government authorities in some of the countries where South32 is exploring or developing these projects, facilities or mines, including increases in taxes, changes in environmental and other regulations and political uncertainty; labour unrest; and other factors identified in the Disclosure Documents. Except as required by applicable regulations or by law, neither BHP Billiton nor South32 undertakes any obligation publicly to update or review any forward-looking statements, whether as a result of new information or future events.

TAO2013\Comms\2015.03.16 - South32 Global Roadshow Pres\150305 South32 Global Roadshow Pres POST BAC Submission_v14.pptx IMPORTANT INFORMATION AND DISCLAIMER
(CONTINUED)
SLIDE 3 MARCH 2015
BHP Billiton non-IFRS financial information BHP Billiton results which have been published in the Disclosure Documents are reported under International Financial Reporting Standards (IFRS) including Underlying EBIT and Underlying EBITDA which are used to measure segment performance. The Disclosure Documents and/or this presentation also include certain non-IFRS measures including Underlying EBIT margin, Underlying EBITDA margin, Net debt and Net operating assets. These measures are used internally by management to assess the performance of BHP Billiton business, make decisions on the allocation of BHP Billiton’s resources and assess operational management. Non-IFRS measures have not been subject to audit or review and should not be considered as an indication of or alternative to an IFRS measure of profitability, financial performance or liquidity. South32 financial information This presentation and the Disclosure Documents include historical combined financial information and pro forma financial information relating to South32. The historical combined financial information has been prepared by aggregating the historical financial information relating to the businesses that will be held by South32 as at the date of the demerger. The pro forma financial information has been prepared for the purpose of showing the impact of the demerger on South32’s financial performance and position. Details of the basis of preparation and presentation of the South32 financial information are set out in the Disclosure Documents. The South32 financial information in this presentation and/or the Disclosure Documents include references to Underlying Earnings, Underlying EBIT and Underlying EBITDA, which are used to assess the performance of South32 and its businesses. Underlying EBITDA and Underlying EBIT are calculated based on the accounting policy that South32 proposes to use when discussing its operating results in future periods. The accounting policy proposed by South32 for calculating these measures differs from that currently used by BHP Billiton. Further information on the calculation of these measures is set out in the Disclosure Documents. Presentation of data Unless specified otherwise, all references to Underlying EBIT, Underlying EBITDA, Underlying EBIT margin and Underlying EBITDA margin include third party trading activities. Unless specified otherwise, production volumes, sales volumes and capital and exploration expenditure from subsidiaries are reported on a 100 per cent basis; production volumes, sales volumes and capital and exploration expenditure from equity accounted investments and other operations are reported on a proportionate consolidation basis Reliance on third-party information The views expressed in this presentation contain information that has been derived from publicly available sources that have not been independently verified. No representation or warranty is made as to the accuracy, completeness or reliability of the information. This presentation should not be relied upon as a recommendation or forecast by BHP Billiton or South32. No financial or investment advice – South Africa BHP Billiton and South32 do not provide any financial or investment ‘advice’, as that term is defined in the South African Financial Advisory and Intermediary Services Act 37 of 2002, and we strongly recommend that you seek professional advice. No SEC or Exchange Act registration – United States The demerger of South32 from BHP Billiton will not be registered with the US Securities and Exchange Commission (SEC) under the US Securities Act of 1933, as amended. BHP Billiton expects South32 to qualify for the exemption from registration under Rule 12g3-2(b) of the US Securities Exchange Act of 1934, as amended (‘Exchange Act’), and accordingly the South32 shares will not be registered under the Exchange Act and South32 will not be subject to the reporting requirements of the Exchange Act.

TAO2013\Comms\2015.03.16 - South32 Global Roadshow Pres\150305 South32 Global Roadshow Pres POST BAC Submission_v14.pptx
TABLE OF CONTENTS
SECTION 1: OVERVIEW OF SOUTH32
SECTION 2: DETAILED MANAGEMENT AND BOARD BIOGRAPHIES
SECTION 3: AUSTRALIAN BUSINESSES
SECTION 4: SOUTHERN AFRICAN BUSINESSES
SECTION 5: SOUTH AMERICAN BUSINESSES
SECTION 6: RESERVES AND RESOURCES
SECTION 7: SUPPLEMENTARY PRO FORMA FINANCIAL INFORMATION
SECTION 8: COMMODITY PRICE AND CURRENCY SENSITIVITIES
SECTION 9: REVOLVING CREDIT FACILITY SUMMARY
SECTION 10: LISTING MECHANICS
SECTION 11: KEY RISKS
MARCH 2015 SLIDE 4

TAO2013\Comms\2015.03.16 - South32 Global Roadshow Pres\150305 South32 Global Roadshow Pres POST BAC Submission_v14.pptx
SECTION 1: OVERVIEW OF SOUTH32

TAO2013\Comms\2015.03.16 - South32 Global Roadshow Pres\150305 South32 Global Roadshow Pres POST BAC Submission_v14.pptx
A NEW COMPANY FROM THE GROUND UP
OVERVIEW OF SOUTH32 SLIDE 6
• An experienced board and management team with clearly defined strategic priorities
• A cash generator with high quality metals and mining assets competitively positioned in their respective cost curves
• A lean operating model designed to further reduce costs and increase productivity
• A simple approach to capital management underpinned by a commitment to maximise total shareholder returns
• Well positioned to pursue investments that meet strict financial criteria
MARCH 2015

TAO2013\Comms\2015.03.16 - South32 Global Roadshow Pres\150305 South32 Global Roadshow Pres POST BAC Submission_v14.pptx
AN EXPERIENCED BOARD AND MANAGEMENT TEAM
OVERVIEW OF SOUTH32 SLIDE 7
Chief Executive Officer and Executive Director
Graham Kerr
Chief Legal Officer & Company Secretary
Nicole Duncan
Chief People Officer
Jo McConnell (Acting)
Chief Financial Officer
Brendan Harris
Chief Commercial Officer
Chief Operating Officer - Australia
Ricus Grimbeek
Chief Operating Officer - Africa
Mike Fraser
1 Further Board members to be appointed in time.
Keith Rumble Independent Non-executive
Director
David Crawford Chairman and Independent
Non-executive Director
Xolani Mkhwanazi Non-executive Director
Board1
MARCH 2015

TAO2013\Comms\2015.03.16 - South32 Global Roadshow Pres\150305 South32 Global Roadshow Pres POST BAC Submission_v14.pptx
CLEARLY DEFINED STRATEGIC PRIORITIES
OVERVIEW OF SOUTH32 SLIDE 8
• Establish a distinctive, powerful culture and identity
• Enhance environmental, health, safety and social programs
• Embed a lean operating model that is aggregated at the regional level
• Reduce costs and improve productivity
• Create strong alignment with investors
• Develop and pursue investment opportunities
• Continually seek to optimise the portfolio
Metalloys, Manganese South Africa
MARCH 2015
Cannington, Australia

TAO2013\Comms\2015.03.16 - South32 Global Roadshow Pres\150305 South32 Global Roadshow Pres POST BAC Submission_v14.pptx A FOCUS ON SUSTAINABILITY WILL BE A SOURCE
OF FUTURE COMPETITIVE ADVANTAGE
OVERVIEW OF SOUTH32 SLIDE 9
• Aim to continuously improve safety performance
﹣Aspire to have no person hurt at work
• Be socially and environmentally responsible, providing a better future for host communities
• Seek to minimise the environmental impact of operations
﹣Energy efficiency
﹣Biodiversity and land management
﹣Water resource management
• Promote a diverse and inclusive workplace
South Africa Aluminium, South Africa
MARCH 2015

TAO2013\Comms\2015.03.16 - South32 Global Roadshow Pres\150305 South32 Global Roadshow Pres POST BAC Submission_v14.pptx
A GLOBALLY DIVERSIFIED METALS AND MINING COMPANY
OVERVIEW OF SOUTH32 SLIDE 10
Worsley Alumina
Cerro Matoso Nickel
Alumar Aluminium / Alumina
Cannington Silver, Lead, Zinc Mozal
Aluminium Head office
Perth
Global marketing centre Singapore
Regional head office Global shared services
Johannesburg
Metalloys Manganese alloys
Illawarra Coal Metallurgical coal
Hillside Aluminium
Hotazel Manganese ore
GEMCO Manganese ore
TEMCO Manganese alloys
South Africa Energy Coal Energy coal
¹ Based on FY2014. Manganese revenue and Underlying EBITDA presented on a proportional consolidation (60 per cent) basis. Revenue by market represents location of customer. 2 An OTC ADS program will also be established for South32.
MRN Bauxite
Offices Assets
MARCH 2015
• Operations in Australia, Southern Africa and Colombia
• Non-operated JV interests in Brazil
• Strongly diversified by commodity and customer
﹣ US$8.3b of revenue in FY20141
• Proposed listings on the ASX, JSE and LSE2 Revenue by market1 Underlying EBITDA
by geography1 Underlying EBITDA
by commodity1
Singapore 5%
India 7%
Other Asia 9%
Belgium 4% Switzerland 7%
Other Europe 6%
Southern Africa 12%
Australia 9%
Americas 7%
Italy 4%
Australia 59%
Southern Africa 29%
South America 12%
Alumina Aluminium 29%
Energy coal 11%
Silver, Lead, Zinc 26%
Nickel 5%
Manganese ore and alloy 21%
Metallurgical coal 8%
China 11%
Japan 8%
South Korea 6%
Germany 2%
UK 3%

TAO2013\Comms\2015.03.16 - South32 Global Roadshow Pres\150305 South32 Global Roadshow Pres POST BAC Submission_v14.pptx HIGH QUALITY ASSETS COMPETITIVELY POSITIONED
IN THEIR RESPECTIVE COST CURVES
OVERVIEW OF SOUTH32 SLIDE 11
Source: Wood Mackenzie, CRU and AME Group data based on CY2013 production 1 Represents operating cash cost quartile position, with the exception of Illawarra Metallurgical Coal which is represented as the position on the industry margin curve to account for coal quality differentials. 2 Production figures are South32 share, unless otherwise stated. 3 On a 100% basis. 4 Cost quartile position on a co-product basis
5 Cash cost position based on Wood Mackenzie Aluminium smelter costs release 2014 Q4. As per South32’s financial statements and as outlined in section 7.1 (b) and (c) of the South32 Listing Documents the unit operating costs of Mozal Aluminium have been higher than those of Hillside.
Industry cost/margin1 curve position and FY2014 production for key South32 assets2
4,776 Kt Mn ore
25.2 Moz Ag
3,916 Kt Alumina
266 Kt Al
715 Kt Al
7,512 Kt Met/Energy
coal
44 Kt Ni
1,262 Kt Alumina
30,384 Kt Energy coal
3,526 Kt Mn ore
1st quartile 2nd quartile 3rd quartile 4th quartile
Worsley Alumina
GEMCO3
Hillside5
Illawarra Met. Coal1
Cerro Matoso
Alumar Refinery
SA Energy Coal3
Hotazel Mines3
Mozal Aluminium5
Cannington4
• Leading assets in the first quartile of industry cost curves
﹣GEMCO: largest Mn ore producer
﹣Cannington: largest silver producing mine
﹣Worsley Alumina: one of the largest alumina refineries
• Hillside, Mozal Aluminium, Illawarra Metallurgical Coal, Cerro Matoso, Alumar Refinery and South Africa Energy Coal are also large and well positioned in their respective industry cost/margin curves1
MARCH 2015

TAO2013\Comms\2015.03.16 - South32 Global Roadshow Pres\150305 South32 Global Roadshow Pres POST BAC Submission_v14.pptx HIGH QUALITY ASSETS COMPETITIVELY POSITIONED
IN THEIR RESPECTIVE COST CURVES
OVERVIEW OF SOUTH32 SLIDE 12
Contribution of key South32 assets3 to H1 FY2015 combined Underlying EBITDA2
Source: Wood Mackenzie, CRU and AME Group data based on CY2013 production 1 Represents operating cash cost quartile position, with the exception of Illawarra Metallurgical Coal which is represented as the position on the industry margin curve to account for coal quality differentials. 2 100% Underlying EBITDA (excluding Third party products and Group and unallocated) includes TEMCO: US$21m (1.6%), Metalloys: US$(6)m and Alumar Smelter: US$54m (4.0%).
3 Production figures are South32 share, unless otherwise stated. 4 On a 100% basis.
14.4%
13.6%
10.6%
6.5%
14.9%
8.9%
8.4%
6.4%
6.2%
5.1%
0% 25% 50% 75% 100%
1st quartile
2nd quartile
4,776 Kt Mn ore
25.2 Moz Ag
3,916 Kt Alumina
266 Kt Al
715 Kt Al
7,512 Kt Met/Energy
coal
44 Kt Ni
1,262 Kt Alumina
30,384 Kt Energy coal
3,526 Kt Mn ore
Worsley Alumina
Cannington
GEMCO4
Hillside
Illawarra1 Met. Coal
Cerro Matoso
Alumar Refinery
SA Energy Coal4
Hotazel Mines4
Mozal Aluminium
• Leading assets in the first quartile of industry cost curves
﹣GEMCO: largest Mn ore producer
﹣Cannington: largest silver producing mine
﹣Worsley Alumina: one of the largest alumina refineries
• Hillside, Mozal Aluminium, Illawarra Metallurgical Coal, Cerro Matoso, Alumar Refinery and South Africa Energy Coal are also large and well positioned in their respective industry cost/margin curves1
• 90% of H1 FY2015 Underlying EBITDA2 generated by first and second quartile assets
MARCH 2015

TAO2013\Comms\2015.03.16 - South32 Global Roadshow Pres\150305 South32 Global Roadshow Pres POST BAC Submission_v14.pptx
0
1
2
3
FY05 FY06 FY07 FY08 FY09 FY10 FY11 FY12 FY13 FY14
HIGH QUALITY ASSETS COMPETITIVELY POSITIONED IN THEIR RESPECTIVE COST CURVES
OVERVIEW OF SOUTH32 SLIDE 13
1 Represents operating cash cost quartile position, with the exception of Illawarra Metallurgical Coal which is represented as the position on the industry margin curve to account for coal quality differentials. 2 Underlying EBITDA (excluding Third party products and Group and unallocated). 3 Capital expenditure for FY2012 to FY2014 is based on historical combined financial information for South32 included in Annexure 1 of the South32 Listing Documents. For the period FY2005 to FY2011 capital expenditure is based on information previously published by BHP Billiton as unaudited supplementary financial information released as part of BHP Billiton’s results announcements.
• Leading assets in the first quartile of industry cost curves
﹣GEMCO: largest Mn ore producer
﹣Cannington: largest silver producing mine
﹣Worsley Alumina: one of the largest alumina refineries
• Hillside, Mozal Aluminium, Illawarra Metallurgical Coal, Cerro Matoso, Alumar Refinery and South Africa Energy Coal are also large and well positioned in their respective industry cost/margin curves1
• 90% of H1 FY2015 Underlying EBITDA2 generated by first and second quartile assets
• These assets have been well maintained and have significant resource lives
Historical combined total capital expenditure3 (US$b)
Execution of major capital projects including:
• GEMCO expansion
• Worsley Alumina Efficiency and Growth Project
• South Africa Energy Coal projects
MARCH 2015
TAO2013\Comms\2015.03.16 - South32 Global Roadshow Pres\150305 South32 Global Roadshow Pres POST BAC Submission_v14.pptx
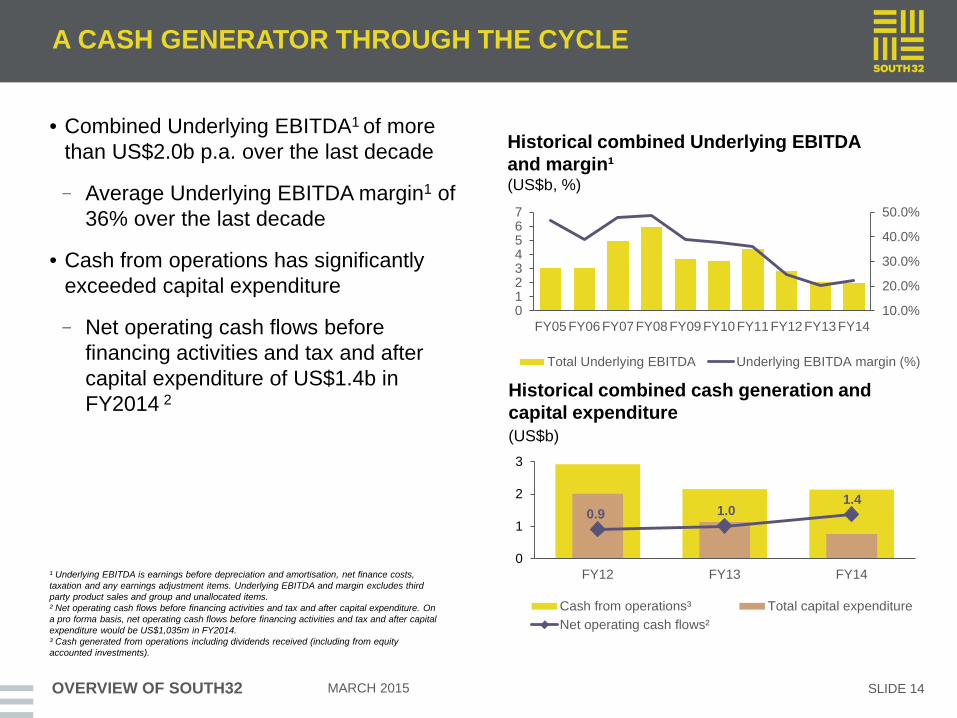
A CASH GENERATOR THROUGH THE CYCLE
• Combined Underlying EBITDA1 of more than US$2.0b p.a. over the last decade
﹣Average Underlying EBITDA margin1 of 36% over the last decade
• Cash from operations has significantly exceeded capital expenditure
﹣Net operating cash flows before financing activities and tax and after capital expenditure of US$1.4b in FY2014 2
OVERVIEW OF SOUTH32 SLIDE 14
Historical combined Underlying EBITDA and margin¹ (US$b, %)
Historical combined cash generation and capital expenditure (US$b)
MARCH 2015
¹ Underlying EBITDA is earnings before depreciation and amortisation, net finance costs, taxation and any earnings adjustment items. Underlying EBITDA and margin excludes third party product sales and group and unallocated items. ² Net operating cash flows before financing activities and tax and after capital expenditure. On a pro forma basis, net operating cash flows before financing activities and tax and after capital expenditure would be US$1,035m in FY2014. ³ Cash generated from operations including dividends received (including from equity accounted investments).
0.9 1.0 1.4
0
1
2
3
FY12 FY13 FY14
Cash from operations³ Total capital expenditureNet operating cash flows²
10.0%
20.0%
30.0%
40.0%
50.0%
01234567
FY05 FY06 FY07 FY08 FY09 FY10 FY11 FY12 FY13 FY14
Total Underlying EBITDA Underlying EBITDA margin (%)

TAO2013\Comms\2015.03.16 - South32 Global Roadshow Pres\150305 South32 Global Roadshow Pres POST BAC Submission_v14.pptx A LEAN OPERATING MODEL DESIGNED TO FURTHER
REDUCE COSTS AND INCREASE PRODUCTIVITY
• A focused and lean corporate structure
• Functional support will be aggregated at the regional level
﹣Reduces a layer of management
﹣Facilitates greater alignment with regional stakeholders
• Overhead cost savings from implementation of the regional model are expected to outweigh the costs of establishing South32’s corporate centre1
OVERVIEW OF SOUTH32 SLIDE 15
Corporate Region Operated Businesses
President and Chief Operating Officer
Africa (Johannesburg)
President and Chief Operating Officer
Australia (Perth)
Chief People Officer (Perth)
Chief Legal Officer & Company Secretary
(Perth)
Chief Financial Officer2 (Perth)
South Africa Energy Coal
South Africa Manganese
Illawarra Metallurgical Coal
Cerro Matoso
Cannington
Australia Manganese
South Africa Aluminium
Mozal Aluminium Worsley Alumina
Support Functions (Johannesburg)
Support Functions (Perth) 1 The financial accounts included in the South32 Listing Documents do not include the costs
that will be incurred when South32 establishes its corporate centre. This is expected to result in a US$60m per annum increase in costs, although the implementation of South32’s regional model is expected to deliver cost savings of a greater amount. 2 Shared services center (Johannesburg) reports to the CFO. 3 Marketing (Singapore) reports to the CCO.
Chief Executive Officer and
Executive Director (Perth)
Brazil Aluminium
Chief Commercial Officer3 (Perth)
Non-operated Businesses
MARCH 2015

TAO2013\Comms\2015.03.16 - South32 Global Roadshow Pres\150305 South32 Global Roadshow Pres POST BAC Submission_v14.pptx WELL POSITIONED TO PURSUE INVESTMENTS THAT
MEET STRICT FINANCIAL CRITERIA
OVERVIEW OF SOUTH32 SLIDE 16
• A strong Balance Sheet and investment grade credit rating are core to the strategy
﹣Opening net debt of ~US$0.7b1
﹣Closure and rehabilitation provisions of ~ US$1.5b1 also transfer to South32
• Significant liquidity from day one
﹣US$1.5b revolving syndicated bank facility
• Expected to have the financial strength and flexibility required to pursue investments that meet strict financial criteria
1
Cannington Silver, Lead, Zinc Mine life extension
1
South Africa Energy Coal Energy Coal Leandra project Naudesbank project
2
MRN Bauxite Mine life extension
3
2
3
South Africa Energy Coal Energy coal Klipspruit Extension Khutala Life Extension
4
4
Hotazel Manganese Ore Wessels central block
5
5
GEMCO Manganese Ore Premium Concentrate Projects
6
6
7 Illawarra Met. Coal Metallurgical coal Appin Area 9
7
Project Execution Options Under Analysis2
Definition (Feasibility)
1 Based on pro forma financial information. Net debt includes finance leases but does not include the fair value of South32’s non-current derivatives. 2 List does not comprise all options under analysis.
MARCH 2015

TAO2013\Comms\2015.03.16 - South32 Global Roadshow Pres\150305 South32 Global Roadshow Pres POST BAC Submission_v14.pptx
A SIMPLE APPROACH TO CAPITAL MANAGEMENT
OVERVIEW OF SOUTH32 SLIDE 17
Energy Coal South Africa • Well defined priorities for cash flow
﹣Maintain safe and reliable operations and an investment grade credit rating through the cycle
Note: South32 will distribute dividends with the maximum practicable franking credits for the purposes of the Australian dividend imputation system. The extent to which any dividend can be franked will depend on South32's franking account balance and its level of distributable profits. South32's franking account balance will depend on the amount of Australian income tax paid by South32 following the demerger. No assurance can be given in relation to the level of future dividends or the franking of such dividends (if any) as these will depend on future events and circumstances.
Maintain safe and reliable operations and
an investment grade credit rating through
the cycle
Competition for excess capital
Distribute a minimum 40% of Underlying
Earnings as ordinary dividends
Cas
h flo
w p
riorit
ies
Max
imis
e ca
sh fl
ow
MARCH 2015

TAO2013\Comms\2015.03.16 - South32 Global Roadshow Pres\150305 South32 Global Roadshow Pres POST BAC Submission_v14.pptx
A SIMPLE APPROACH TO CAPITAL MANAGEMENT
OVERVIEW OF SOUTH32 SLIDE 18
Energy Coal South Africa
Note: South32 will distribute dividends with the maximum practicable franking credits for the purposes of the Australian dividend imputation system. The extent to which any dividend can be franked will depend on South32's franking account balance and its level of distributable profits. South32's franking account balance will depend on the amount of Australian income tax paid by South32 following the demerger. No assurance can be given in relation to the level of future dividends or the franking of such dividends (if any) as these will depend on future events and circumstances. 1 Dividends will be declared in US dollars consistent with South32’s reporting currency.
› Intention to distribute a minimum of 40% of Underlying Earnings as dividends following each six month reporting period1
• Well defined priorities for cash flow ﹣Maintain safe and reliable operations
and an investment grade credit rating through the cycle
﹣Shareholder dividends
Maintain safe and reliable operations and
an investment grade credit rating through
the cycle
Competition for excess capital
Distribute a minimum 40% of Underlying
Earnings as ordinary dividends
Cas
h flo
w p
riorit
ies
Max
imis
e ca
sh fl
ow
MARCH 2015

TAO2013\Comms\2015.03.16 - South32 Global Roadshow Pres\150305 South32 Global Roadshow Pres POST BAC Submission_v14.pptx
A SIMPLE APPROACH TO CAPITAL MANAGEMENT
OVERVIEW OF SOUTH32 SLIDE 19
Energy Coal South Africa • Well defined priorities for cash flow
﹣Maintain safe and reliable operations and an investment grade credit rating through the cycle
Note: South32 will distribute dividends with the maximum practicable franking credits for the purposes of the Australian dividend imputation system. The extent to which any dividend can be franked will depend on South32's franking account balance and its level of distributable profits. South32's franking account balance will depend on the amount of Australian income tax paid by South32 following the demerger. No assurance can be given in relation to the level of future dividends or the franking of such dividends (if any) as these will depend on future events and circumstances.
› Special dividends
› Share buy backs
› High return investments that meet strict financial criteria
﹣Excess capital to be allocated to the option that maximises total shareholder returns
﹣Shareholder dividends
Maintain safe and reliable operations and
an investment grade credit rating through
the cycle
Competition for excess capital
Distribute a minimum 40% of Underlying
Earnings as ordinary dividends
Cas
h flo
w p
riorit
ies
Max
imis
e ca
sh fl
ow
MARCH 2015
TAO2013\Comms\2015.03.16 - South32 Global Roadshow Pres\150305 South32 Global Roadshow Pres POST BAC Submission_v14.pptx
A NEW COMPANY FROM THE GROUND UP
OVERVIEW OF SOUTH32 SLIDE 20
• An experienced board and management team with clearly defined strategic priorities
• A cash generator with high quality metals and mining assets competitively positioned in their respective cost curves
• A lean operating model designed to further reduce costs and increase productivity
• A simple approach to capital management underpinned by a commitment to maximise total shareholder returns
• Well positioned to pursue investments that meet strict financial criteria
MARCH 2015

TAO2013\Comms\2015.03.16 - South32 Global Roadshow Pres\150305 South32 Global Roadshow Pres POST BAC Submission_v14.pptx
SECTION 2: DETAILED MANAGEMENT AND BOARD BIOGRAPHIES

TAO2013\Comms\2015.03.16 - South32 Global Roadshow Pres\150305 South32 Global Roadshow Pres POST BAC Submission_v14.pptx
DETAILED BOARD BIOGRAPHIES
DETAILED MANAGEMENT AND BOARD BIOGRAPHIES MARCH 2015
Board member Biography
David Crawford AO Chairman and independent non-executive director
Mr Crawford will be the Chairman of South32. Mr Crawford has extensive experience in risk management and business reorganisation. He has acted as a consultant, scheme manager, receiver and manager and liquidator to very large and complex groups of companies. Mr Crawford was previously Australian National Chairman of KPMG, Chartered Accountants. Other directorships and offices (current and recent): • Chairman of Australia Pacific Airports Corporation Limited (since May 2012) • Chairman of Lend Lease Corporation Limited (since May 2003) and director (since July 2001) • Former director of BHP Billiton Limited (from May 1994 to November 2014) and BHP Billiton Plc (from
June 2001 to November 2014) • Former Chairman (from November 2007 to December 2011) and former director (from August 2001 to
December 2011) of Foster’s Group Limited
Keith Rumble Independent non-executive director
Mr Rumble was previously Chief Executive Officer of SUN Mining, a wholly-owned entity of the SUN Group, a principal investor and private equity fund manager in Russia, India and other emerging and transforming markets. Mr Rumble has more than 30 years’ experience in the resources industry, specifically in titanium and platinum mining, and is a former Chief Executive Officer of Impala Platinum (Pty) Ltd and former Chief Executive Officer of Rio Tinto Iron and Titanium Inc in Canada. Mr Rumble began his career at Richards Bay Minerals in 1980 and held various management positions before becoming Chief Executive Officer in 1996. Mr Rumble will retire from the BHP Billiton Board at or around the time of the BHP Billiton Shareholder vote on the Demerger Resolution. Other directorships and offices (current and recent): • Director (non-executive) of BHP Billiton Limited and BHP Billiton Plc (since September 2008) • Director of Enzyme Technologies (Pty) Limited (since September 2011) • Director of Elite Wealth (Pty) Limited (since August 2010) • Board of Governors of Rhodes University (since April 2005) • Trustee of the World Wildlife Fund, South Africa (since October 2006) • Former director of Aveng Group Limited (from September 2009 to December 2011)
SLIDE 22
TAO2013\Comms\2015.03.16 - South32 Global Roadshow Pres\150305 South32 Global Roadshow Pres POST BAC Submission_v14.pptx
DETAILED BOARD BIOGRAPHIES
DETAILED MANAGEMENT AND BOARD BIOGRAPHIES MARCH 2015
Board member Biography
Xolani Mkhwanazi Non-executive director
Dr Mkhwanazi joined BHP Billiton in February 2005 as President and Chief Operating Officer South Africa Aluminium. Dr Mkhwanazi was appointed Chairman of BHP Billiton in South Africa in 2009. Dr Mkhwanazi previously served as Chief Executive Officer of Bateman Africa Ltd and the National Electricity Regulator. Prior to that, he held senior positions at the Council for Scientific and Industrial Research. During this period, he played a key role in the formulation of South African National Science and Technology Policy. In his early career, Dr Mkhwanazi was a Senior Scientist at the Atomic Energy Corporation and Head of the Physics Department at the University of Swaziland.
SLIDE 23

TAO2013\Comms\2015.03.16 - South32 Global Roadshow Pres\150305 South32 Global Roadshow Pres POST BAC Submission_v14.pptx
DETAILED MANAGEMENT TEAM BIOGRAPHIES
DETAILED MANAGEMENT AND BOARD BIOGRAPHIES MARCH 2015 SLIDE 24
Senior executive Biography
Graham Kerr CEO and executive director
Mr Kerr joined BHP Billiton in 1994 and was appointed Chief Financial Officer in November 2011. Mr Kerr retired from the BHP Billiton Group Management Committee and as Chief Financial Officer of BHP Billiton on 1 October 2014. Prior to his appointment as Chief Financial Officer of BHP Billiton, Mr Kerr was President of Diamonds and Specialty Products. Mr Kerr has worked in a wide range of operational and commercial roles across the BHP Billiton Group. As President of Diamonds and Specialty Products, Mr Kerr was accountable for the EKATI Diamond Mine in Canada, the Richards Bay Minerals Joint Venture in South Africa, diamonds exploration in Angola, the Corridor Sands Project in Mozambique and the development of BHP Billiton’s potash portfolio in Canada. Prior to that Mr Kerr held the positions of Chief Financial Officer of Stainless Steel Materials, Vice President Finance BHP Billiton Diamonds and Finance Director for the BHP Canadian Diamonds Company. In 2004 Mr Kerr left BHP Billiton for a two-year period when he was General Manager Commercial for Iluka Resources Ltd.
Brendan Harris CFO
Mr Harris joined BHP Billiton as Vice President Investor Relations Australasia in July 2010 and was appointed Head of Investor Relations in July 2011. Prior to joining BHP Billiton he held various roles in investment banking over almost a decade including Executive Director Metals and Mining Research, Macquarie Equities, where he had primary responsibility for Australian listed metals and mining research. During Mr Harris’ early career as an exploration geologist he was involved in iron ore exploration in the Pilbara region of Western Australia with Robe River Iron Associates and gold and base metals exploration in the Gawler Craton in South Australia. Mr Harris also gained experience with Western Geophysical in Perth, Western Australia where he participated in the reprocessing of seismic data. Mr Harris holds a BSc in geology and geophysics.
Ricus Grimbeek President and COO, Australia
Mr Grimbeek joined BHP Billiton in February 1992 as a Mining Engineer in training. Mr Grimbeek’s career has spanned numerous technical and operating roles within and outside BHP Billiton including time as the Executive Vice President Mining for Lonmin Platinum. Mr Grimbeek was the Head of Group HSEC from April 2009 to October 2011 and President and Chief Operating Officer of the EKATI Diamond Mine in Canada from May 2007 to March 2009. In November 2011, he was appointed Asset President, Worsley. Mr Grimbeek holds a Mining Engineering degree from the University of Pretoria, an Advanced Certificate in Mine Ventilation from the Chamber of Mines.

TAO2013\Comms\2015.03.16 - South32 Global Roadshow Pres\150305 South32 Global Roadshow Pres POST BAC Submission_v14.pptx
DETAILED MANAGEMENT TEAM BIOGRAPHIES
DETAILED MANAGEMENT AND BOARD BIOGRAPHIES MARCH 2015 SLIDE 25
Senior executive Biography
Mike Fraser President and COO, Africa
Mr Fraser joined BHP Billiton in January 2000 as Head of Compensation and Benefits. Mr Fraser was appointed President, Human Resources and a member of the Group Management Committee in August 2013. Previously Mr Fraser led BHP Billiton’s Mozal operation in Mozambique as Asset President from September 2009 to October 2012. Prior to taking up this role Mr Fraser worked across a number of roles in BHP Billiton’s Coal, Manganese and Aluminium businesses in a number of geographies. Prior to joining BHP Billiton Mr Fraser held a variety of leadership roles in a large internationally diversified industrial business. Mr Fraser holds a Master of Business Leadership and a Bachelor of Commerce from the University of South Africa.
Nicole Duncan Chief Legal Officer and Company Secretary
Ms Duncan joined BHP Billiton in July 2000 as a Counsel in Group Legal and was appointed Vice President, Company Secretariat in September 2013. Prior to this role, Ms Duncan held various legal and commercial roles within BHP Billiton. Ms Duncan was Vice President, Supply, Group Information Management from October 2011 to August 2013. Previously, Ms Duncan held the role of Senior Manager, Group Legal, supporting the marketing function and prior to that played a key role in operations, major expansions and merger and acquisition projects. Prior to joining BHP Billiton, she was a lawyer at Ashurst (formerly Blake Dawson Waldron) in Melbourne. Ms Duncan graduated from the Australian National University with a degree in Law and an Honours degree in History.

TAO2013\Comms\2015.03.16 - South32 Global Roadshow Pres\150305 South32 Global Roadshow Pres POST BAC Submission_v14.pptx
SLIDE 26 MARCH 2015
This page has been left intentionally blank

TAO2013\Comms\2015.03.16 - South32 Global Roadshow Pres\150305 South32 Global Roadshow Pres POST BAC Submission_v14.pptx
SECTION 3: AUSTRALIAN BUSINESSES

TAO2013\Comms\2015.03.16 - South32 Global Roadshow Pres\150305 South32 Global Roadshow Pres POST BAC Submission_v14.pptx
WORSLEY ALUMINA (86% SHARE)
AUSTRALIAN BUSINESSES SLIDE 28 MARCH 2015
• Integrated bauxite mine and alumina refinery with capacity of 4.6 Mtpa on a 100% basis
• Low impurity bauxite1
– Reserve life of 17 years
– Resource life of 63 years
• First quartile on refining industry cost curve2
• Low energy input costs
– Gas supply contracts to 2018 and 2023
• FY2014 operating cost of US$272/t alumina; down 25% from FY2012 of US$363/t
• Further efficiencies anticipated as operation continues to bed down recently completed Efficiency & Growth Project
• Potential for further increases to nameplate capacity at a low capital cost
Key financials3
1 Further details on reserve and resource life calculations are referenced in Section 6. 2 Sourced from Wood Mackenzie based on CY2013 production. 3 South32 share of key financials shown.
Worsley Alumina
margin (%) (US$m)
(100)
(50)
0
50
100
150
200
FY2012 FY2013 FY2014 H1 FY15
Underlying EBITDA Capital expenditure
EBITDA margin
(10%)(5%)05%10%15%20%25%
900
TAO2013\Comms\2015.03.16 - South32 Global Roadshow Pres\150305 South32 Global Roadshow Pres POST BAC Submission_v14.pptx
0
50
100
150
200
250
300
350
400
0
500
1,000
1,500
2,000
2,500
3,000
3,500
4,000
FY2012 FY2013 FY2014 H1 FY15
51%
6%
40%
3%
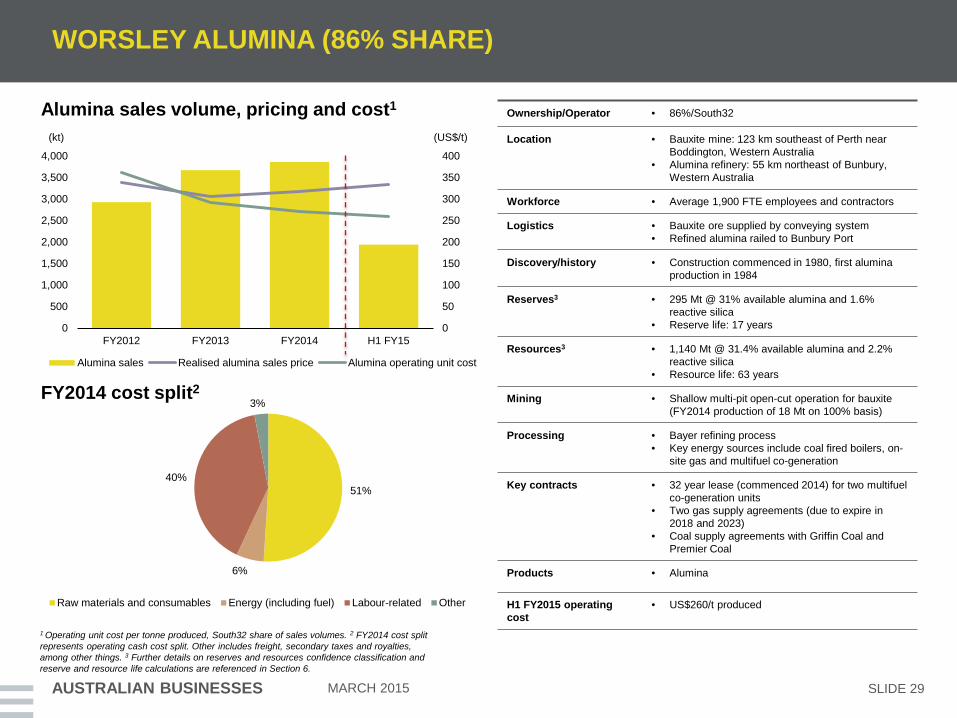
WORSLEY ALUMINA (86% SHARE)
AUSTRALIAN BUSINESSES SLIDE 29 MARCH 2015
FY2014 cost split2
Alumina sales volume, pricing and cost1
1 Operating unit cost per tonne produced, South32 share of sales volumes. 2 FY2014 cost split represents operating cash cost split. Other includes freight, secondary taxes and royalties, among other things. 3 Further details on reserves and resources confidence classification and reserve and resource life calculations are referenced in Section 6.
Raw materials and consumables Energy (including fuel) Labour-related Other
(US$/t) (kt)
Ownership/Operator • 86%/South32
Location • Bauxite mine: 123 km southeast of Perth near Boddington, Western Australia
• Alumina refinery: 55 km northeast of Bunbury, Western Australia
Workforce • Average 1,900 FTE employees and contractors
Logistics • Bauxite ore supplied by conveying system • Refined alumina railed to Bunbury Port
Discovery/history • Construction commenced in 1980, first alumina production in 1984
Reserves3 • 295 Mt @ 31% available alumina and 1.6% reactive silica
• Reserve life: 17 years
Resources3 • 1,140 Mt @ 31.4% available alumina and 2.2% reactive silica
• Resource life: 63 years
Mining • Shallow multi-pit open-cut operation for bauxite (FY2014 production of 18 Mt on 100% basis)
Processing • Bayer refining process • Key energy sources include coal fired boilers, on-
site gas and multifuel co-generation
Key contracts • 32 year lease (commenced 2014) for two multifuel co-generation units
• Two gas supply agreements (due to expire in 2018 and 2023)
• Coal supply agreements with Griffin Coal and Premier Coal
Products • Alumina
H1 FY2015 operating cost
• US$260/t produced
Alumina sales Realised alumina sales price Alumina operating unit cost
TAO2013\Comms\2015.03.16 - South32 Global Roadshow Pres\150305 South32 Global Roadshow Pres POST BAC Submission_v14.pptx
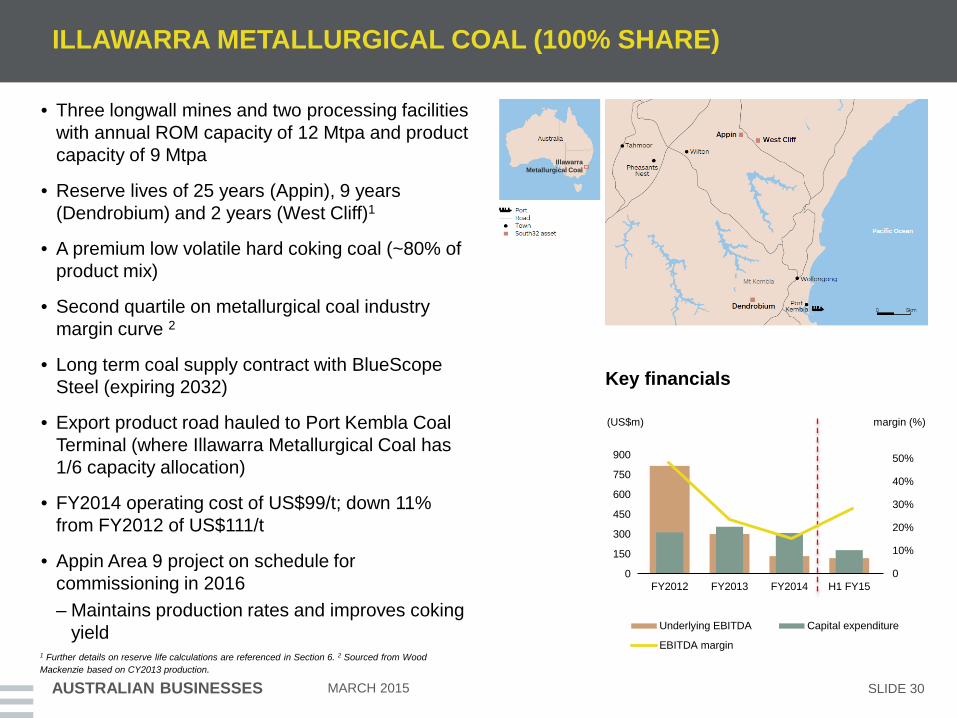
ILLAWARRA METALLURGICAL COAL (100% SHARE)
AUSTRALIAN BUSINESSES SLIDE 30 MARCH 2015
• Three longwall mines and two processing facilities with annual ROM capacity of 12 Mtpa and product capacity of 9 Mtpa
• Reserve lives of 25 years (Appin), 9 years (Dendrobium) and 2 years (West Cliff)1
• A premium low volatile hard coking coal (~80% of product mix)
• Second quartile on metallurgical coal industry margin curve 2
• Long term coal supply contract with BlueScope Steel (expiring 2032)
• Export product road hauled to Port Kembla Coal Terminal (where Illawarra Metallurgical Coal has 1/6 capacity allocation)
• FY2014 operating cost of US$99/t; down 11% from FY2012 of US$111/t
• Appin Area 9 project on schedule for commissioning in 2016 – Maintains production rates and improves coking
yield
Key financials
Illawarra Metallurgical Coal
margin (%) (US$m)
1 Further details on reserve life calculations are referenced in Section 6. 2 Sourced from Wood Mackenzie based on CY2013 production.
0
150
300
450
600
750
900
FY2012 FY2013 FY2014 H1 FY150
10%
20%
30%
40%
50%
Underlying EBITDA Capital expenditure
EBITDA margin

TAO2013\Comms\2015.03.16 - South32 Global Roadshow Pres\150305 South32 Global Roadshow Pres POST BAC Submission_v14.pptx
22%
6%
49%
23%
ILLAWARRA METALLURGICAL COAL (100% SHARE)
AUSTRALIAN BUSINESSES SLIDE 31 MARCH 2015
FY2014 cost split2
Energy and metallurgical coal sales volume, price and cost1
1 Operating unit cost per tonne produced. 2 FY2014 cost split represents operating cash cost split. Other includes freight, secondary taxes and royalties, among other things. 3 Further details on reserves and resources confidence classification and reserve and resource life calculations are referenced in Section 6.
(US$/t) (kt)
Ownership/operator • 100%/South32
Location • Three mines (Appin, West Cliff and Dendrobium) located 75 km to 90 km southwest of Sydney in the Illawarra region of NSW
Workforce • Average 2,500 FTE employees and contractors
Logistics • Road haulage to Port Kembla Coal Terminal (8km to 38 km in distance from mining operations) for export coal
• Conveyor / truck to BlueScope Steel's blending yard
Discovery/history • Operated in the region for 80 years. Appin has been producing since 1962
Reserves3 • 208 Mt (Proved and Probable), 166 Mt (Marketable) • Reserve lives: 25, 2, 9 years (Appin, West Cliff,
Dendrobium)
Resources3 • 1,306 Mt • Resource lives: 41, 15, 43 years (Appin, West Cliff,
Dendrobium)
Mining • Underground longwall operations with ROM capacity of:
− Appin: 4 Mtpa − West Cliff: 3 Mtpa − Dendrobium: 5 Mtpa
Processing • Two coal processing plants, West Cliff (7.5 Mtpa nominal capacity) and Dendrobium (5 Mtpa nominal capacity)
• Electricity from NSW electricity grid • Water sourced from Sydney Water
Key contracts • Long term coal supply agreement with Bluescope Steel at Port Kembla (expires 2032)
Products • Metallurgical coal (80%), thermal coal (20%)
H1 FY2015 operating cost
• US$64/t produced Raw materials and consumables Energy (including fuel) Labour-related Other
Energy coal sales Metallurgical coal salesRealised metallurgical coal sales price Operating unit cost
0
50
100
150
200
250
300
0
1,500
3,000
4,500
6,000
7,500
9,000
FY2012 FY2013 FY2014 H1 FY15
TAO2013\Comms\2015.03.16 - South32 Global Roadshow Pres\150305 South32 Global Roadshow Pres POST BAC Submission_v14.pptx
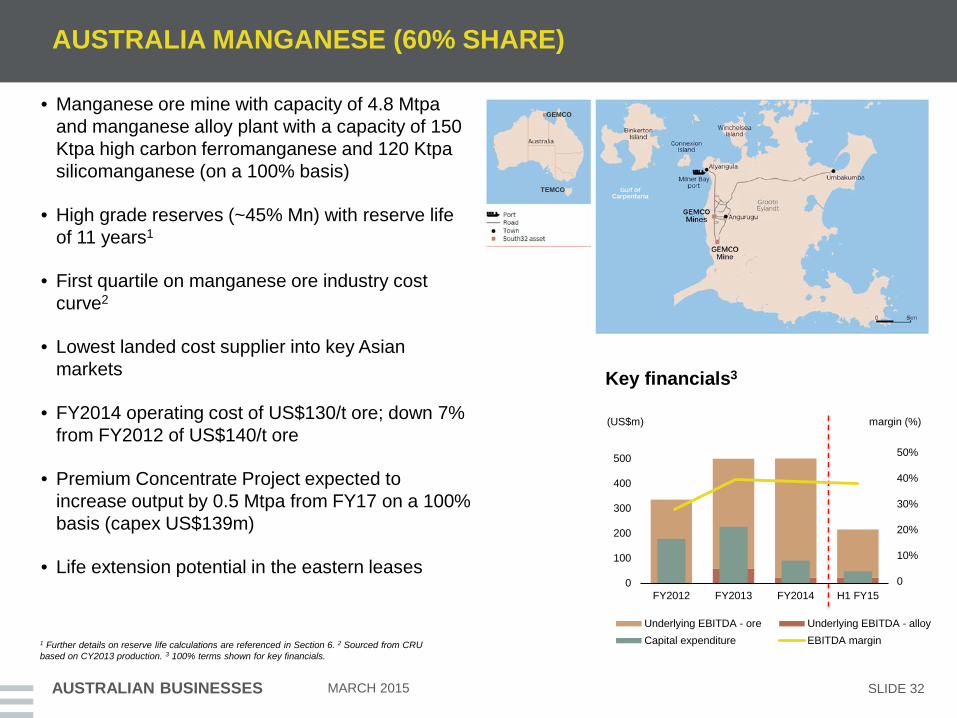
AUSTRALIA MANGANESE (60% SHARE)
AUSTRALIAN BUSINESSES SLIDE 32 MARCH 2015
• Manganese ore mine with capacity of 4.8 Mtpa and manganese alloy plant with a capacity of 150 Ktpa high carbon ferromanganese and 120 Ktpa silicomanganese (on a 100% basis)
• High grade reserves (~45% Mn) with reserve life of 11 years1
• First quartile on manganese ore industry cost curve2
• Lowest landed cost supplier into key Asian markets
• FY2014 operating cost of US$130/t ore; down 7% from FY2012 of US$140/t ore
• Premium Concentrate Project expected to increase output by 0.5 Mtpa from FY17 on a 100% basis (capex US$139m)
• Life extension potential in the eastern leases
Key financials3
GEMCO
margin (%)
TEMCO
(US$m)
Underlying EBITDA - ore Underlying EBITDA - alloyCapital expenditure EBITDA margin1 Further details on reserve life calculations are referenced in Section 6. 2 Sourced from CRU
based on CY2013 production. 3 100% terms shown for key financials.
0
100
200
300
400
500
FY2012 FY2013 FY2014 H1 FY150
10%
20%
30%
40%
50%

TAO2013\Comms\2015.03.16 - South32 Global Roadshow Pres\150305 South32 Global Roadshow Pres POST BAC Submission_v14.pptx
0
50
100
150
200
250
0
1,000
2,000
3,000
4,000
5,000
6,000
FY2012 FY2013 FY2014 H1 FY15
Manganese ore sales Realised manganese ore sales priceManganese ore operating unit cost
20%
13%
37%
30%
AUSTRALIA MANGANESE (60% SHARE)
AUSTRALIAN BUSINESSES SLIDE 33 MARCH 2015
FY2014 cost split2
Manganese ore sales volume, price and cost1
1 Operating unit cost per tonne produced, 100% terms shown for sales volumes, FY2012-FY2014 average manganese alloy sales volume of 244 Ktpa. 2 FY2014 cost split represents operating cash cost split. Other includes freight, secondary taxes and royalties, among other things..3 On a 100% basis. Further details on reserves and resources confidence classification and reserve and resource life calculations are referenced in Section 6.
(US$/t) (kt)
GEMCO Ownership/operator • 60%/South32 Location • Groote Eylandt, 16 km from Alyangula, Northern Territory,
Australia Workforce • Average 900 FTE employees and contractors Logistics • 16 km road train to port facilities at Milner Bay for export Discovery/history • Mining commenced in 1964. Beneficiation plant
commissioned in 1972 Reserves3 • 94 Mt @ 44.6% (58% yield)
• Reserve life: 11 years Resources3 • 175 Mt @ 44.8% (48% yield)
• Resource life: 15 years Mining • Open-cut strip mining operation Processing • Crushing, screening, washing and dense media separation
• Produces lump and fines products (4.8 Mtpa ROM capacity)
Products • Mn ore produced (90% exported with 10% shipped to TEMCO)
H1 FY2015 operating cost
• US$103/t
TEMCO Ownership/operator • 60%/South32
Location • 4 km from George Town, Tasmania, Australia
Workforce • Average 300 FTE employees and contractors
Logistics • Priority use of berth at Bell Bay wharf under long term lease
Discovery/history • Operations established in 1962
Processing • HCFeMn (150 Ktpa capacity), SiMn (120 Ktpa capacity)
Key contracts • Power sourced under long term agreement (expiring 2024)
Products • Manganese alloy (c. 90% exported, remainder supplied to steel customers in Australia and New Zealand)
H1 FY2015 operating cost
• US$906/t Raw materials and consumables Energy (including fuel) Labour-related Other

TAO2013\Comms\2015.03.16 - South32 Global Roadshow Pres\150305 South32 Global Roadshow Pres POST BAC Submission_v14.pptx
CANNINGTON (100% SHARE)
AUSTRALIAN BUSINESSES SLIDE 34 MARCH 2015
• Integrated underground mining and metallurgical processing facility with a nominal processing capacity of over 3.2 Mtpa
• Reserve life of 9 years1
• First quartile on silver industry cost curve2
• Sliver and lead head grades projected to decline over remaining life of mine – Ag grade of 289ppm in FY2014
• FY2014 operating cost of US$193/t ore processed; down 8% from FY2012 of US$209/t
• Targeting increased mine and mill throughput; expected to partially mitigate declining feed grade
• Active studies assessing potential to significantly extend mine life
Key financials
Cannington
(US$m) margin (%)
Underlying EBITDA Capital expenditureEBITDA margin
1 Further details on reserve life calculations are referenced in Section 6. 2 Sourced from AME Group based on CY2013 production on a co-product basis.
0
200
400
600
800
1,000
FY2012 FY2013 FY2014 H1 FY150
10%
20%
30%
40%
50%
60%
TAO2013\Comms\2015.03.16 - South32 Global Roadshow Pres\150305 South32 Global Roadshow Pres POST BAC Submission_v14.pptx
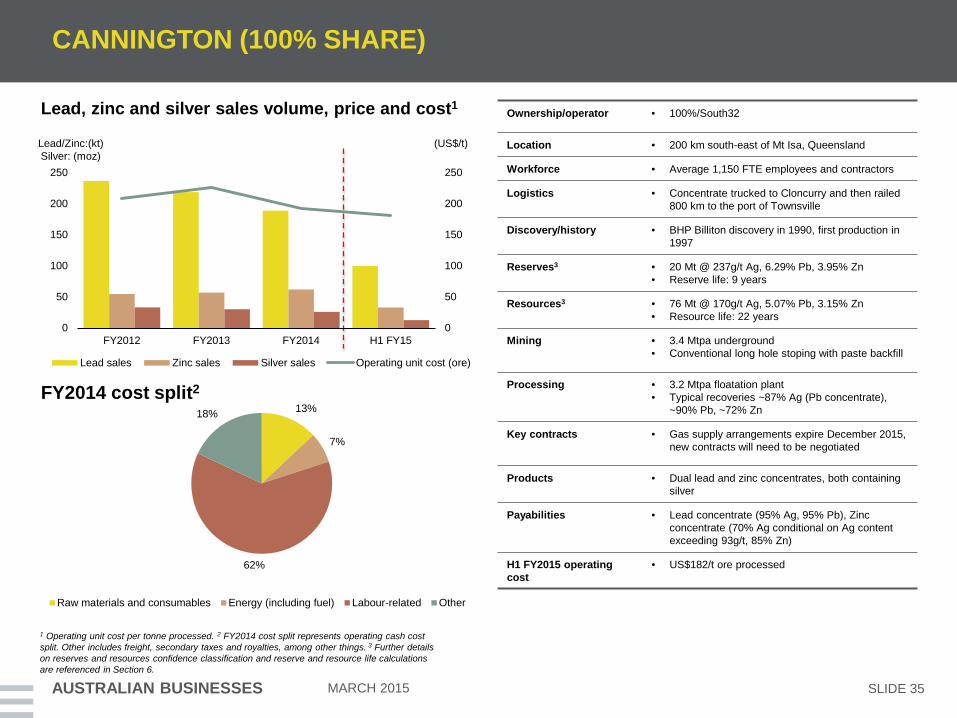
CANNINGTON (100% SHARE)
AUSTRALIAN BUSINESSES SLIDE 35 MARCH 2015
FY2014 cost split2
Lead, zinc and silver sales volume, price and cost1
13%
7%
62%
18%
1 Operating unit cost per tonne processed. 2 FY2014 cost split represents operating cash cost split. Other includes freight, secondary taxes and royalties, among other things. 3 Further details on reserves and resources confidence classification and reserve and resource life calculations are referenced in Section 6.
Lead/Zinc:(kt) Silver: (moz)
(US$/t)
Ownership/operator • 100%/South32
Location • 200 km south-east of Mt Isa, Queensland
Workforce • Average 1,150 FTE employees and contractors
Logistics • Concentrate trucked to Cloncurry and then railed 800 km to the port of Townsville
Discovery/history • BHP Billiton discovery in 1990, first production in 1997
Reserves3 • 20 Mt @ 237g/t Ag, 6.29% Pb, 3.95% Zn • Reserve life: 9 years
Resources3 • 76 Mt @ 170g/t Ag, 5.07% Pb, 3.15% Zn • Resource life: 22 years
Mining • 3.4 Mtpa underground • Conventional long hole stoping with paste backfill
Processing • 3.2 Mtpa floatation plant • Typical recoveries ~87% Ag (Pb concentrate),
~90% Pb, ~72% Zn
Key contracts • Gas supply arrangements expire December 2015, new contracts will need to be negotiated
Products • Dual lead and zinc concentrates, both containing silver
Payabilities • Lead concentrate (95% Ag, 95% Pb), Zinc concentrate (70% Ag conditional on Ag content exceeding 93g/t, 85% Zn)
H1 FY2015 operating cost
• US$182/t ore processed
Raw materials and consumables Energy (including fuel) Labour-related Other
Lead sales Zinc sales Silver sales Operating unit cost (ore)
0
50
100
150
200
250
0
50
100
150
200
250
FY2012 FY2013 FY2014 H1 FY15

TAO2013\Comms\2015.03.16 - South32 Global Roadshow Pres\150305 South32 Global Roadshow Pres POST BAC Submission_v14.pptx
SLIDE 36 MARCH 2015
This page has been left intentionally blank

TAO2013\Comms\2015.03.16 - South32 Global Roadshow Pres\150305 South32 Global Roadshow Pres POST BAC Submission_v14.pptx
SECTION 4: SOUTHERN AFRICAN BUSINESSES

TAO2013\Comms\2015.03.16 - South32 Global Roadshow Pres\150305 South32 Global Roadshow Pres POST BAC Submission_v14.pptx
(50)
0
50
100
150
200
250
FY2012 FY2013 FY2014 H1 FY15(5%)
0
5%
10%
15%
20%
25%
SOUTH AFRICA ALUMINIUM (100% SHARE)
SOUTHERN AFRICAN BUSINESSES SLIDE 38 MARCH 2015
• The largest smelter in the southern hemisphere with capacity of 723 Ktpa aluminium
• Hillside extends across first and second quartile on the aluminium industry cost curve1
• Alumina feed sourced from Worsley Alumina
• Long term power contracts with Eskom
– Frequency of load shedding has increased
• FY2014 operating cost of US$1,771/t aluminium; down 23% from FY2012 of US$2,303/t
• Bayside smelter closed in FY2014 and Bayside casthouse to be sold
Key financials2
Hillside
margin (%) (US$m)
1 Sourced from Wood Mackenzie based on CY2013 production. 2 Includes financials from Bayside smelter until FY2014.
Underlying EBITDA Capital expenditureEBITDA margin

TAO2013\Comms\2015.03.16 - South32 Global Roadshow Pres\150305 South32 Global Roadshow Pres POST BAC Submission_v14.pptx
0
500
1,000
1,500
2,000
2,500
0
100
200
300
400
500
600
700
800
FY2012 FY2013 FY2014 H1 FY15
56%
22%
14%
8%
SOUTH AFRICA ALUMINIUM (100% SHARE)
SOUTHERN AFRICAN BUSINESSES SLIDE 39 MARCH 2015
FY2014 cost split2
Aluminium sales volume, price and cost1
1 Operating unit cost per tonne produced. Includes sales volume from Bayside smelter until FY2014 (Bayside sales volume contribution of 97 Kt, 105 Kt, 96 Kt for each of FY2012, FY2013 and FY2014 respectively). 2 FY2014 cost split represents operating cash cost split. Other includes freight, consumables and maintenance, among other things.
(US$/t) (kt)
Hillside
Ownership/operator • 100%/South32
Location • 200 km north of Durban in Richards Bay, South Africa
Workforce • 2,597 FTE employees and contractors (post Bayside closure)
Logistics • Exported through Richards Bay • Remaining product sold domestically (transported
by road)
Discovery/history • Hillside smelter commissioned between 1995 and 1996
Processing • Processes c. 1,400 Ktpa alumina imported from Worsley Alumina
• Electrolytic reduction of alumina and casting into aluminium ingots
• Solid aluminium production capacity of 723 Ktpa
Key contracts • Long term contract for power from Eskom • Three long term port facility agreements (expire
2019)
Products • Aluminium ingot and liquid aluminium (trucked to Bayside casthouse)
H1 FY2015 operating cost
• US$1,747/t produced
Raw materials and consumables Energy (including fuel) Labour-related Other
Aluminium sales Realised aluminium sales price Operating unit cost
TAO2013\Comms\2015.03.16 - South32 Global Roadshow Pres\150305 South32 Global Roadshow Pres POST BAC Submission_v14.pptx
MOZAL ALUMINIUM (47.1% SHARE)
SOUTHERN AFRICAN BUSINESSES SLIDE 40 MARCH 2015
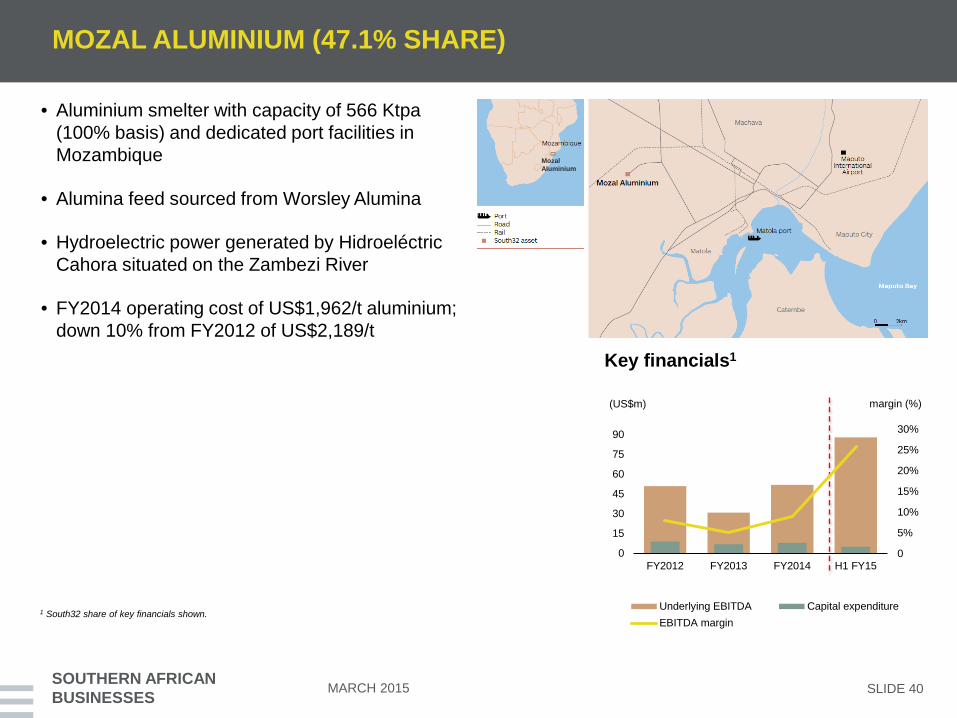
• Aluminium smelter with capacity of 566 Ktpa (100% basis) and dedicated port facilities in Mozambique
• Alumina feed sourced from Worsley Alumina
• Hydroelectric power generated by Hidroeléctric Cahora situated on the Zambezi River
• FY2014 operating cost of US$1,962/t aluminium; down 10% from FY2012 of US$2,189/t
Key financials1
Mozal Aluminium
margin (%) (US$m)
1 South32 share of key financials shown. Underlying EBITDA Capital expenditureEBITDA margin
0
15
30
45
60
75
90
FY2012 FY2013 FY2014 H1 FY150
5%
10%
15%
20%
25%
30%

TAO2013\Comms\2015.03.16 - South32 Global Roadshow Pres\150305 South32 Global Roadshow Pres POST BAC Submission_v14.pptx
Raw materials and consumables Energy (including fuel) Labour-related Other
55% 29%
13% 3%
MOZAL ALUMINIUM (47.1% SHARE)
SOUTHERN AFRICAN BUSINESSES SLIDE 41 MARCH 2015
FY2014 cost split2
Aluminium sales volume, price and cost1
1 Operating unit cost per tonne produced. South32 share of sales volumes. 2 FY2014 cost split represents operating cash cost split. Other includes freight, secondary taxes and royalties, among other things.
(US$/t) (kt)
Ownership/operator • 47.1%/South32
Location • 17 km from Maputo, Mozambique
Workforce • Average 1,950 FTE employees and contractors
Logistics • Aluminium is exported via the Matola Port, 15 km from the smelter
Discovery/history • Production commenced in 2000 • Capacity expanded to 566 Ktpa in 2003 (100%
basis)
Processing • Processes alumina feed from Worsley Alumina • Electrolytic reduction of alumina to produce liquid
aluminium which is then tapped and cast
Key contracts • Power sourced from Motraco (JV between Eskom and Mozambique and Swaziland electrical utilities)
• Long term domestic aluminium metal supply agreement
Products • Aluminium ingots with a purity grade of, or greater than, 99.7%
H1 FY2015 operating cost
• US$1,867/t produced
0
500
1,000
1,500
2,000
2,500
0
50
100
150
200
250
300
FY2012 FY2013 FY2014 H1 FY15
Aluminium sales Realised aluminium sales price Operating unit cost

TAO2013\Comms\2015.03.16 - South32 Global Roadshow Pres\150305 South32 Global Roadshow Pres POST BAC Submission_v14.pptx
SOUTH AFRICA ENERGY COAL (90% SHARE)
SOUTHERN AFRICAN BUSINESSES SLIDE 42 MARCH 2015
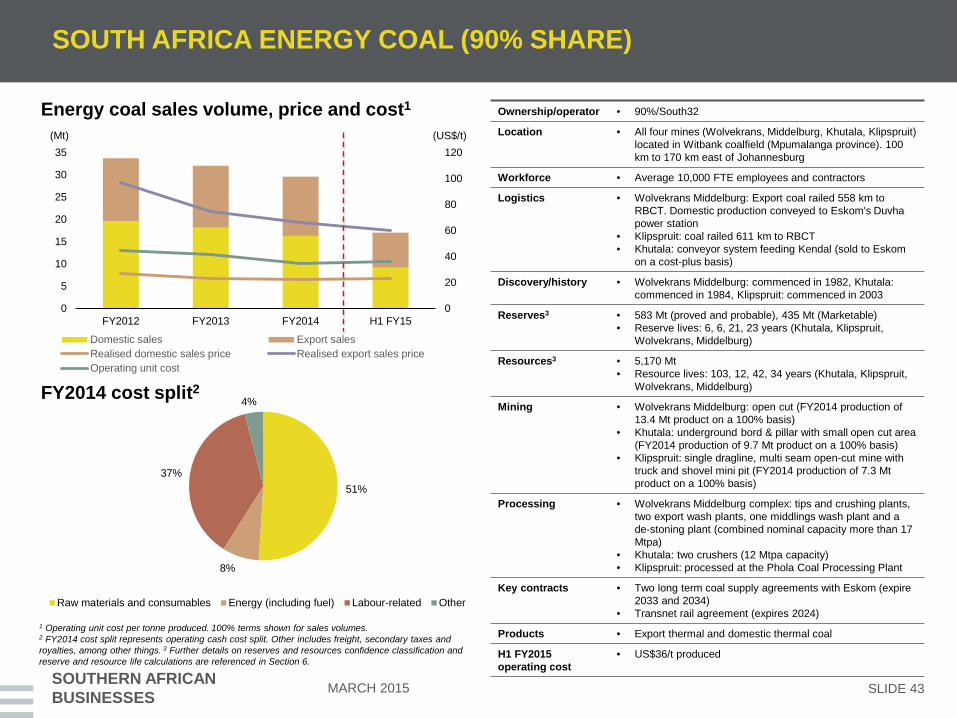
• Four mines producing a mix of export (~45%) and domestic coal (~55%) – FY2014 product output of 30.4 Mt (100% basis)
• Reserve lives between 6 and 23 years1
• Second quartile on energy coal industry cost curve2
• Richards Bay port capacity entitlement of 17 Mtpa
• FY2014 operating cost of US$35/t product; down 20% from FY2012 of US$44/t
• Rail haulage agreements in place with Transnet to 2024
• Assessing major life of mine extension projects at Klipspruit (export) and Khutala (domestic) with other brownfield development options under review
• Accredited as a Level 4 BEE contributor4
Key financials3
South Africa Energy Coal
margin (%) (US$m)
1 Further details on reserve life calculations are referenced in Section 6. 2 Sourced from Wood Mackenzie based on CY2013 production. 3 100% terms shown for key financials. 4A Level 4 BEE Contributor means the entity scores 65 to 74.99 scorecard points in terms of the South African BEE Codes of Good Practice and confers a BEE procurement spend recognition of 100%.
Underlying EBITDA Capital expenditureEBITDA margin
0
90
180
270
360
450
FY2012 FY2013 FY2014 H1 FY150
5%
10%
15%
20%
25%
TAO2013\Comms\2015.03.16 - South32 Global Roadshow Pres\150305 South32 Global Roadshow Pres POST BAC Submission_v14.pptx
0
20
40
60
80
100
120
0
5
10
15
20
25
30
35
FY2012 FY2013 FY2014 H1 FY15
51%
8%
37%
4%
SOUTH AFRICA ENERGY COAL (90% SHARE)
SOUTHERN AFRICAN BUSINESSES SLIDE 43 MARCH 2015
FY2014 cost split2
Energy coal sales volume, price and cost1
1 Operating unit cost per tonne produced. 100% terms shown for sales volumes. 2 FY2014 cost split represents operating cash cost split. Other includes freight, secondary taxes and royalties, among other things. 3 Further details on reserves and resources confidence classification and reserve and resource life calculations are referenced in Section 6.
(US$/t) (Mt)
Raw materials and consumables Energy (including fuel) Labour-related Other
Ownership/operator • 90%/South32
Location • All four mines (Wolvekrans, Middelburg, Khutala, Klipspruit) located in Witbank coalfield (Mpumalanga province). 100 km to 170 km east of Johannesburg
Workforce • Average 10,000 FTE employees and contractors
Logistics • Wolvekrans Middelburg: Export coal railed 558 km to RBCT. Domestic production conveyed to Eskom's Duvha power station
• Klipspruit: coal railed 611 km to RBCT • Khutala: conveyor system feeding Kendal (sold to Eskom
on a cost-plus basis)
Discovery/history • Wolvekrans Middelburg: commenced in 1982, Khutala: commenced in 1984, Klipspruit: commenced in 2003
Reserves3 • 583 Mt (proved and probable), 435 Mt (Marketable) • Reserve lives: 6, 6, 21, 23 years (Khutala, Klipspruit,
Wolvekrans, Middelburg)
Resources3 • 5,170 Mt • Resource lives: 103, 12, 42, 34 years (Khutala, Klipspruit,
Wolvekrans, Middelburg)
Mining • Wolvekrans Middelburg: open cut (FY2014 production of 13.4 Mt product on a 100% basis)
• Khutala: underground bord & pillar with small open cut area (FY2014 production of 9.7 Mt product on a 100% basis)
• Klipspruit: single dragline, multi seam open-cut mine with truck and shovel mini pit (FY2014 production of 7.3 Mt product on a 100% basis)
Processing • Wolvekrans Middelburg complex: tips and crushing plants, two export wash plants, one middlings wash plant and a de-stoning plant (combined nominal capacity more than 17 Mtpa)
• Khutala: two crushers (12 Mtpa capacity) • Klipspruit: processed at the Phola Coal Processing Plant
Key contracts • Two long term coal supply agreements with Eskom (expire 2033 and 2034)
• Transnet rail agreement (expires 2024)
Products • Export thermal and domestic thermal coal
H1 FY2015 operating cost
• US$36/t produced
Domestic sales Export salesRealised domestic sales price Realised export sales priceOperating unit cost

TAO2013\Comms\2015.03.16 - South32 Global Roadshow Pres\150305 South32 Global Roadshow Pres POST BAC Submission_v14.pptx
(50)
0
50
100
150
200
FY2012 FY2013 FY2014 H1 FY15(5%)
0
5%
10%
15%
20%
SOUTH AFRICA MANGANESE (HOTAZEL 44.4%, METALLOYS 60%)
SOUTHERN AFRICAN BUSINESSES SLIDE 44 MARCH 2015
• Hotazel mines and Metalloys smelter
– ROM capacity of 3.5 Mtpa at Mamatwan open-pit and 1.2 Mtpa at Wessels underground (100% basis)
• Reserve lives of 46 years (Wessels) and 18 years (Mamatwan)1
• High quality ore suitable for high manganese content alloy production
• Third quartile on manganese ore industry cost curve2
• Contract for Transnet rail capacity for the next five years being finalised
• FY2014 ore operating cost of US$82/t; down 41% from FY2012 of US$139/t
• Project to increase Wessels underground crushing capacity to 1.5 Mtpa (on a 100% basis) in execution phase
• Transnet expansion at Coega Port could deliver potential for higher ore sales volumes from FY19
• Hotazel accredited as a Level 3 BEE contributor3
Key financials4
(US$m) margin (%)
1 Further details on reserve life calculations are referenced in Section 6. 2 Sourced from CRU based on CY2013 production. 3 A Level 3 BEE Contributor means the entity scores 75 to 84.99 scorecard points in terms of the South African BEE Codes of Good Practice and confers a BEE procurement spend recognition of 110%. 4 100% terms shown for key financials; underlying EBITDA for Metalloys of $7m, $(3)m, $(47)m, $(6)m in FY2012, FY2013, FY2014 and H1 FY2015 respectively
Underlying EBITDA - ore Underlying EBITDA - alloyCapital expenditure EBITDA margin

TAO2013\Comms\2015.03.16 - South32 Global Roadshow Pres\150305 South32 Global Roadshow Pres POST BAC Submission_v14.pptx
0
20
40
60
80
100
120
140
160
0
500
1,000
1,500
2,000
2,500
3,000
3,500
FY2012 FY2013 FY2014 H1 FY15
42%
17%
31%
10%
SOUTH AFRICA MANGANESE (HOTAZEL 44.4%, METALLOYS 60%)
SOUTHERN AFRICAN BUSINESSES SLIDE 45 MARCH 2015
FY2014 cost split2
Manganese ore sales volume, price and cost1
1 Operating unit cost per tonne produced. 100% terms shown for sales volumes. FY2012-FY2014 average manganese alloy sales volume of 385 Ktpa. 2 FY2014 cost split represents operating cash cost split. Other includes freight, secondary taxes and royalties, among other things. 3 On a 100% basis . Further details on reserves and resources confidence classification and reserve and resource life calculations are referenced in Section 6.
(US$/t) (kt)
Raw materials and consumables Energy (including fuel) Labour-related Other
Hotazel Ownership/operator • 44.4%/South32 Location • 600 km from Johannesburg in the Northern Cape, South
Africa Workforce • Average 2,100 FTE employees and contractors Logistics • Ore distributed to domestic customers by rail and road
• Exports railed via Transnet or transported by road to three ports 900 - 1,200 km away (Port Elizabeth, Durban’s port and Saldanha Multi-Purpose Terminal)
Discovery/history • Mamatwan commenced production in 1964 and Wessels in 1973
Reserves3 • Mamatwan: 64 Mt @ 37.3%; Wessels: 69 Mt @ 42.2% • Reserve life: 18, 46 years (Mamatwan, Wessels)
Resources3 • Mamatwan: 110 Mt @ 35.1%; Wessels: 140 Mt @ 42.4% • Resource life: 24, 92 years (Mamatwan, Wessels)
Mining • Mamatwan: open-cut (3.5 Mtpa ROM capacity on a 100% basis). Wessels: underground bord & pillar (1.2 Mtpa ROM capacity on a 100% basis)
Processing • Mamatwan: crushing, screening, dense media separation and sintering. Wessels: crushing, washing and screening
Key contracts • Rail contract for 1.45 Mtpa for 5 years expected to be concluded in H2 FY2015
Products • ~75% of manganese ore is exported, remainder converted to ferromanganese alloy at Metalloys
H1 FY2015 operating cost
• US$79/t
Metalloys Ownership/operator • 60%/South32 Location • 50 km south of Johannesburg, South Africa Workforce • Average 1,550 FTE employees and contractors Logistics • Road and rail to Richards Bay Port and Durban Port Discovery/history • Smelter was established in 1951 Processing • Four electric arc furnaces Products • Ferromanganese alloy H1 FY2015 operating cost
• US$901/t
Manganese ore sales Realised manganese ore sales priceManganese ore operating unit cost

TAO2013\Comms\2015.03.16 - South32 Global Roadshow Pres\150305 South32 Global Roadshow Pres POST BAC Submission_v14.pptx
SLIDE 46 MARCH 2015
This page has been left intentionally blank
TAO2013\Comms\2015.03.16 - South32 Global Roadshow Pres\150305 South32 Global Roadshow Pres POST BAC Submission_v14.pptx
SECTION 5: SOUTH AMERICAN BUSINESSES

TAO2013\Comms\2015.03.16 - South32 Global Roadshow Pres\150305 South32 Global Roadshow Pres POST BAC Submission_v14.pptx
Underlying EBITDA - alumina Underlying EBITDA - aluminium
Capital expenditure Alumina EBITDA margin
BRAZIL ALUMINIUM (MRN 14.8%, REFINERY 36%, SMELTER 40%)
SOUTH AMERICAN BUSINESSES SLIDE 48 MARCH 2015
• Non-operated joint venture interest in 18 Mtpa (100% basis) bauxite mine, 3.5 Mtpa (100% basis) capacity alumina refinery and aluminium smelter
• Reserve life of 6 years1
• Refinery second quartile on industry cost curve2
• Refinery sources high grade bauxite feed from MRN under long term offtake
• Long term power contracts expiring in 2024
– Excess power recently sold into the market
• FY2014 operating cost of US$239/t alumina; down 7% from FY2012 of US$258/t
• Refinery debottlenecking options under study
• Assessing 20+ year MRN mine life extension
• Smelter Potlines II and III are currently suspended due to market conditions and Potline I is subject to ongoing review
Key financials3
Alumar
margin (%) (US$m)
1 Further details on reserve life calculations are referenced in Section 6. 2 Sourced from Wood Mackenzie based on CY2013 production. 3 South32 share of key financials shown.
(80)
(40)
0
40
80
120
160
FY2012 FY2013 FY2014 H1 FY15
0
10%
20%
30%
40%
50%

TAO2013\Comms\2015.03.16 - South32 Global Roadshow Pres\150305 South32 Global Roadshow Pres POST BAC Submission_v14.pptx
0
50
100
150
200
250
300
350
0
200
400
600
800
1,000
1,200
1,400
FY2012 FY2013 FY2014 H1 FY15
53%
28%
16% 3%
BRAZIL ALUMINIUM (MRN 14.8%, REFINERY 36%, SMELTER 40%)
SOUTH AMERICAN BUSINESSES SLIDE 49 MARCH 2015
FY2014 cost split2
Alumina sales volume, price and cost1
1 Operating unit cost per tonne of alumina produced. South32 share of sales volumes shown. FY2012-FY2014 average aluminium sales volume of 143 Ktpa. 2. FY2014 cost split represents operating cash cost split for Brazil Aluminium. Other includes freight, secondary taxes and royalties, among other things. 3 Further details on reserves and resources confidence classification and reserve and resource life calculations are referenced in Section 6.
(US$/t) (kt)
MRN Mine Ownership/operator • 14.8% / Independent JV company
Location • 40 km from Porto Trombetas (880 km from Belém, Brazil)
Workforce • Average 3,400 FTE employees and contractors
Logistics • Bauxite transported 28 km by rail to Porto Trombetas
Discovery/history • Mine operations commenced in 1979 • Expansions increased capacity to 18 Mtpa (100% basis)
Reserves3 • 527 million of dmt (washed) @ 50.2% alumina and 4.2% reactive silica
• Reserve life: 6 years Resources3 • 98 million dmt (washed) @ 49.4% alumina and 4.6%
reactive silica • Resource life: 29 years
Mining & processing • Open-cut strip mining operation • Ore is crushed and beneficiated on site
Key contracts • Long term contracts selling bauxite to shareholders
Products • Bauxite
Alumar Refinery
Ownership/operator • Refinery (36%) / Alcoa
Location • São Luís, Maranhão, Brazil
Logistics • Port facilities include two terminals at São Marcos Bay
Discovery/history • Operations commenced in 1984 Processing • Bauxite ore refined using the Bayer Process Key contracts • 6 long term bauxite offtake agreements with MRN
• Long term electricity contract (expires 2024) Products • Alumina
H1 FY2015 operating cost
US$203/t produced
Raw materials and consumables Energy (including fuel) Labour-related Other
Alumina sales Realised alumina sales price Alumina operating unit cost
TAO2013\Comms\2015.03.16 - South32 Global Roadshow Pres\150305 South32 Global Roadshow Pres POST BAC Submission_v14.pptx
CERRO MATOSO (99.94% SHARE)
SOUTH AMERICAN BUSINESSES SLIDE 50 MARCH 2015
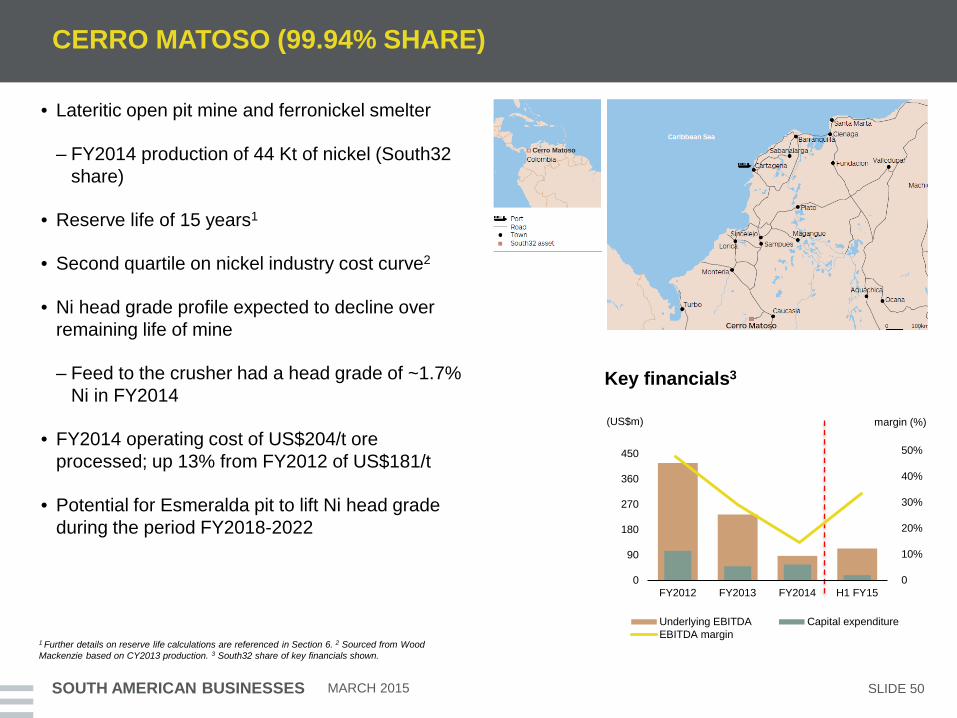
• Lateritic open pit mine and ferronickel smelter
– FY2014 production of 44 Kt of nickel (South32 share)
• Reserve life of 15 years1
• Second quartile on nickel industry cost curve2
• Ni head grade profile expected to decline over remaining life of mine
– Feed to the crusher had a head grade of ~1.7% Ni in FY2014
• FY2014 operating cost of US$204/t ore processed; up 13% from FY2012 of US$181/t
• Potential for Esmeralda pit to lift Ni head grade during the period FY2018-2022
Key financials3
Cerro Matoso
(US$m) margin (%)
Underlying EBITDA Capital expenditureEBITDA margin
1 Further details on reserve life calculations are referenced in Section 6. 2 Sourced from Wood Mackenzie based on CY2013 production. 3 South32 share of key financials shown.
0
90
180
270
360
450
FY2012 FY2013 FY2014 H1 FY150
10%
20%
30%
40%
50%

TAO2013\Comms\2015.03.16 - South32 Global Roadshow Pres\150305 South32 Global Roadshow Pres POST BAC Submission_v14.pptx
0
5,000
10,000
15,000
20,000
0
10
20
30
40
50
60
FY2012 FY2013 FY2014 H1 FY15
23%
33%
35%
9%
CERRO MATOSO (99.94% SHARE)
SOUTH AMERICAN BUSINESSES SLIDE 51 MARCH 2015
FY2014 cost split2
Nickel sales volume, price and cost1
1 Operating unit cost per tonne processed. South32 share of sales volumes shown. 2 FY2014 cost split represents operating cash cost split. Other includes freight, secondary taxes and royalties, among other things. 3 Further details on reserves and resources confidence classification and reserve and resource life calculations are referenced in Section 6.
(US$/t) (kt)
Ownership/operator • 99.94%/South32
Location • 25 km southwest of Montelibano, Córdoba, Colombia
Workforce • Average 2,450 FTE employees and contractors
Logistics • Ferronickel transported approximately 260 km by road to Port of Cartagena
Discovery/history • Mining commenced in 1980, the ferronickel smelter was commissioned in 1982 and was expanded in 2001
Reserves3 • 24 Mt @ 1.1% (laterite ores); 24 Mt @ 1.3% (stockpile material)
• Reserve life: 15 years
Resources3 • 289 Mt @ 0.9% (laterite ores); 51 Mt @ 1.1% (stockpile material); 17 Mt @ 0.2% (slag stockpile)
• Resource life: 37 years
Mining • Truck and shovel open-cut operation
Processing • Mined and stockpiled ore blended, crushed and partially dried
• Ore upgraded, fully dried, blended and calcined • Impurities removed by refining and then granulated and
packed
Key contracts • Electricity supplied by contracts until 2018 • Gas supply contracted until 2021
Products • Nickel
H1 FY2015 operating cost
• US$170/t processed
Raw materials and consumables Energy (including fuel) Labour-related Other
Nickel sales Realised nickel sales price Operating unit cost

TAO2013\Comms\2015.03.16 - South32 Global Roadshow Pres\150305 South32 Global Roadshow Pres POST BAC Submission_v14.pptx
SECTION 6: RESERVES AND RESOURCES
TAO2013\Comms\2015.03.16 - South32 Global Roadshow Pres\150305 South32 Global Roadshow Pres POST BAC Submission_v14.pptx
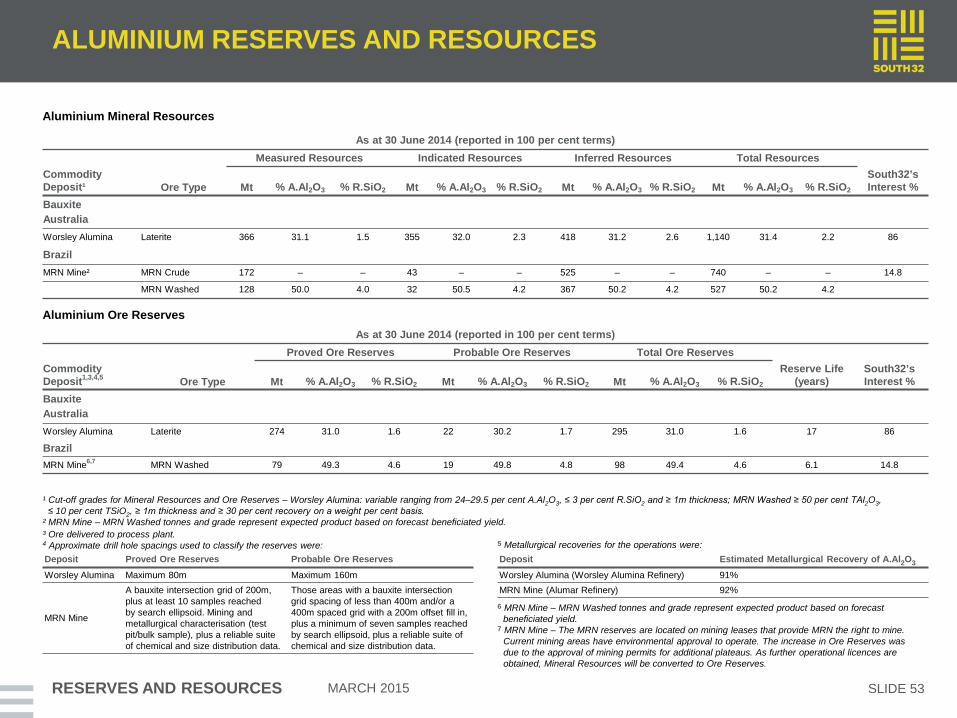
ALUMINIUM RESERVES AND RESOURCES
MARCH 2015 RESERVES AND RESOURCES SLIDE 53
Aluminium Mineral Resources
As at 30 June 2014 (reported in 100 per cent terms) Measured Resources Indicated Resources Inferred Resources Total Resources
Commodity Deposit¹ Ore Type Mt % A.Al2O3 % R.SiO2 Mt % A.Al2O3 % R.SiO2 Mt % A.Al2O3 % R.SiO2 Mt % A.Al2O3 % R.SiO2
South32’s Interest %
Bauxite Australia Worsley Alumina Laterite 366 31.1 1.5 355 32.0 2.3 418 31.2 2.6 1,140 31.4 2.2 86
Brazil
MRN Mine² MRN Crude 172 – – 43 – – 525 – – 740 – – 14.8
MRN Washed 128 50.0 4.0 32 50.5 4.2 367 50.2 4.2 527 50.2 4.2
¹ Cut-off grades for Mineral Resources and Ore Reserves – Worsley Alumina: variable ranging from 24–29.5 per cent A.Al2O3, ≤ 3 per cent R.SiO2 and ≥ 1m thickness; MRN Washed ≥ 50 per cent TAl2O3, ≤ 10 per cent TSiO2, ≥ 1m thickness and ≥ 30 per cent recovery on a weight per cent basis. ² MRN Mine – MRN Washed tonnes and grade represent expected product based on forecast beneficiated yield.
Aluminium Ore Reserves As at 30 June 2014 (reported in 100 per cent terms)
Proved Ore Reserves Probable Ore Reserves Total Ore Reserves Commodity Deposit1,3,4,5 Ore Type Mt % A.Al2O3 % R.SiO2 Mt % A.Al2O3 % R.SiO2 Mt % A.Al2O3 % R.SiO2
Reserve Life (years)
South32’s Interest %
Bauxite Australia
Worsley Alumina Laterite 274 31.0 1.6 22 30.2 1.7 295 31.0 1.6 17 86
Brazil MRN Mine6,7 MRN Washed 79 49.3 4.6 19 49.8 4.8 98 49.4 4.6 6.1 14.8
³ Ore delivered to process plant. 4 Approximate drill hole spacings used to classify the reserves were: Deposit Proved Ore Reserves Probable Ore Reserves Worsley Alumina Maximum 80m Maximum 160m
MRN Mine
A bauxite intersection grid of 200m, plus at least 10 samples reached by search ellipsoid. Mining and metallurgical characterisation (test pit/bulk sample), plus a reliable suite of chemical and size distribution data.
Those areas with a bauxite intersection grid spacing of less than 400m and/or a 400m spaced grid with a 200m offset fill in, plus a minimum of seven samples reached by search ellipsoid, plus a reliable suite of chemical and size distribution data.
5 Metallurgical recoveries for the operations were: Deposit Estimated Metallurgical Recovery of A.Al2O3
Worsley Alumina (Worsley Alumina Refinery) 91% MRN Mine (Alumar Refinery) 92%
6 MRN Mine – MRN Washed tonnes and grade represent expected product based on forecast beneficiated yield.
7 MRN Mine – The MRN reserves are located on mining leases that provide MRN the right to mine. Current mining areas have environmental approval to operate. The increase in Ore Reserves was due to the approval of mining permits for additional plateaus. As further operational licences are obtained, Mineral Resources will be converted to Ore Reserves.

TAO2013\Comms\2015.03.16 - South32 Global Roadshow Pres\150305 South32 Global Roadshow Pres POST BAC Submission_v14.pptx
COAL RESERVES AND RESOURCES
MARCH 2015 RESERVES AND RESOURCES SLIDE 54
Coal Resources
Coal Reserves
As at 30 June 2014 (reported in 100 per cent terms)
Measured Coal Resources Indicated Coal Resources Inferred Coal Resources Total Coal Resources Commodity Deposit1,2
Mining Method
Coal Type Mt % Ash % VM % S Mt % Ash % VM % S Mt % Ash % VM % S Mt % Ash % VM % S
South32’s Interest %
Illawarra Metallurgical Coal Appin UG Met/Th 157 11.2 23.8 0.37 256 12.6 24.2 0.36 289 13.5 23.8 0.36 702 12.7 24.0 0.36 100
West Cliff UG Met/Th 21 12.3 21.3 0.36 21 11.9 20.7 0.34 68 13.9 19.9 0.33 110 13.3 20.3 0.34 100
Dendrobium UG Met/Th 86 29.8 23.7 0.59 91 29.8 23.1 0.58 118 29.4 22.8 0.58 295 29.6 23.2 0.58 100
Cordeaux UG Met/Th 5.2 28.7 21.1 0.58 109 29.1 21.5 0.56 85 29.0 22.1 0.57 199 29.0 21.8 0.57 100
¹ The coal quality for Illawarra Metallurgical Coal is for in situ quality on an air-dried basis. Tonnages are on an in situ moisture basis. ² The cut-off criteria used were: Illawarra Metallurgical Coal no seam thickness cut-off because the minimum thickness is economic.
As at 30 June 2014 (reported in 100 per cent terms)
Proved Coal Reserves
Probable Coal Reserves
Total Coal Reserves
Proved Marketable Coal Reserves
Probable Marketable Coal Reserves
Total Marketable Coal Reserves Reserve
Life (years)
Commodity Deposit3,4,5,6,7
Mining Method
Coal Type Mt Mt Mt Mt
% Ash
% VM
% S Mt
% Ash
% VM
% S Mt
% Ash
% VM
% S
South32’s Interest %
Illawarra Metallurgical Coal Appin UG Met/Th 24 133 157 20 8.9 23.5 0.37 112 8.9 24.9 0.36 132 8.9 24.7 0.36 25 100
West Cliff UG Met/Th 5.4 0.4 5.8 3.8 8.9 20.6 0.36 0.3 8.9 20.1 0.36 4.1 8.9 20.6 0.36 2.0 100
Dendrobium
UG Met/Th 21 24 45 – – – – – – – – – – – – 8.9 100
UG Met – – – 8.6 9.7 23.8 0.59 9.9 9.7 24.2 0.59 18 9.7 24.0 0.59
UG Th – – – 5.2 23.0 – – 6.3 23.0 – – 12 23.0 – –
5 Total Coal Reserves are at the moisture content when mined (6% Appin, West Cliff; 7% Dendrobium). Total Marketable Coal Reserves (tonnes) are the tonnage of coal available, at moisture content (9 per cent Appin, West Cliff; 13.5 per cent Dendrobium Met; 7 per cent Dendrobium Th) and air-dried quality, for sale after the beneficiation of the Total Coal Reserves. Note that where the coal will not be beneficiated, the tonnes of Total Coal Reserves are the tonnes of Total Marketable Coal Reserves, with moisture adjustment where applicable. 6 The cut-off criteria applied were: Appin, West Cliff, Dendrobium ≥ 1.8m seam thickness. 7 Coal delivered to wash plant.
³ Only geophysically logged, fully analysed cored holes with greater than 95 per cent recovery were used to classify the reserves. Drill hole spacings vary between seams and geological domains and were determined in conjunction with geostatistical analyses where applicable. The range of maximum spacings was:
Deposit Proved Ore Reserves Probable Ore Reserves Appin 700m 1,500m West Cliff 700m 1,500m Dendrobium 700m 1,500m
4 Product recoveries for the operations were: Deposit Product Recovery Appin 84% West Cliff 71% Dendrobium 67%
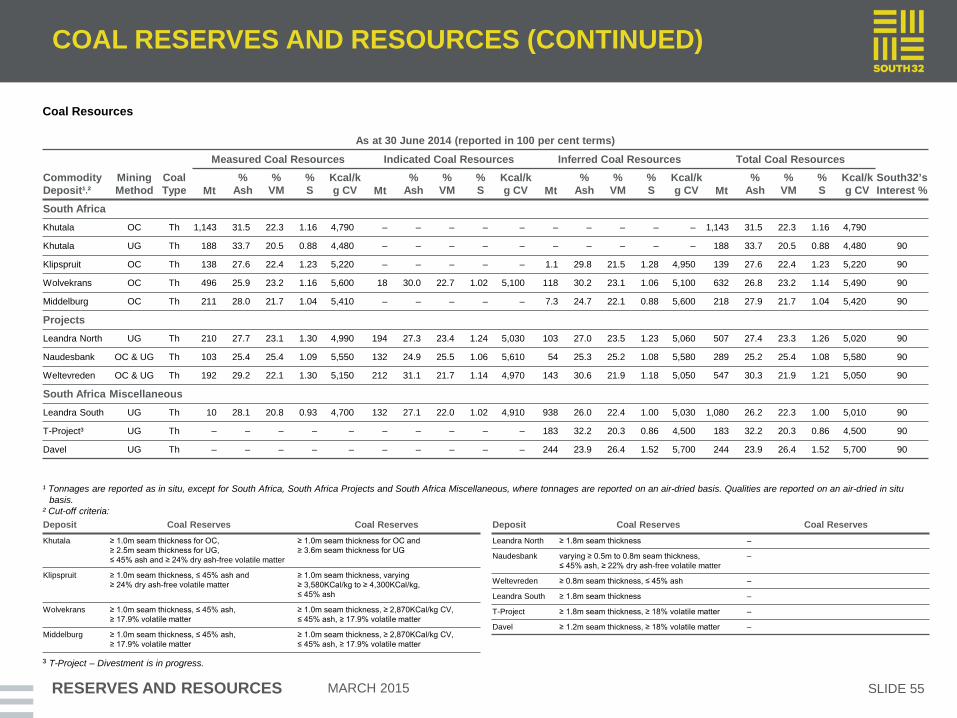
TAO2013\Comms\2015.03.16 - South32 Global Roadshow Pres\150305 South32 Global Roadshow Pres POST BAC Submission_v14.pptx
COAL RESERVES AND RESOURCES (CONTINUED)
MARCH 2015 RESERVES AND RESOURCES SLIDE 55
Coal Resources
¹ Tonnages are reported as in situ, except for South Africa, South Africa Projects and South Africa Miscellaneous, where tonnages are reported on an air-dried basis. Qualities are reported on an air-dried in situ basis.
² Cut-off criteria:
³ T-Project – Divestment is in progress.
As at 30 June 2014 (reported in 100 per cent terms)
Measured Coal Resources Indicated Coal Resources Inferred Coal Resources Total Coal Resources Commodity Deposit¹,²
Mining Method
Coal Type Mt
% Ash
% VM
% S
Kcal/kg CV Mt
% Ash
% VM
% S
Kcal/kg CV Mt
% Ash
% VM
% S
Kcal/kg CV Mt
% Ash
% VM
% S
Kcal/kg CV
South32’s Interest %
South Africa
Khutala OC Th 1,143 31.5 22.3 1.16 4,790 – – – – – – – – – – 1,143 31.5 22.3 1.16 4,790
Khutala UG Th 188 33.7 20.5 0.88 4,480 – – – – – – – – – – 188 33.7 20.5 0.88 4,480 90
Klipspruit OC Th 138 27.6 22.4 1.23 5,220 – – – – – 1.1 29.8 21.5 1.28 4,950 139 27.6 22.4 1.23 5,220 90
Wolvekrans OC Th 496 25.9 23.2 1.16 5,600 18 30.0 22.7 1.02 5,100 118 30.2 23.1 1.06 5,100 632 26.8 23.2 1.14 5,490 90
Middelburg OC Th 211 28.0 21.7 1.04 5,410 – – – – – 7.3 24.7 22.1 0.88 5,600 218 27.9 21.7 1.04 5,420 90
Projects
Leandra North UG Th 210 27.7 23.1 1.30 4,990 194 27.3 23.4 1.24 5,030 103 27.0 23.5 1.23 5,060 507 27.4 23.3 1.26 5,020 90
Naudesbank OC & UG Th 103 25.4 25.4 1.09 5,550 132 24.9 25.5 1.06 5,610 54 25.3 25.2 1.08 5,580 289 25.2 25.4 1.08 5,580 90
Weltevreden OC & UG Th 192 29.2 22.1 1.30 5,150 212 31.1 21.7 1.14 4,970 143 30.6 21.9 1.18 5,050 547 30.3 21.9 1.21 5,050 90
South Africa Miscellaneous Leandra South UG Th 10 28.1 20.8 0.93 4,700 132 27.1 22.0 1.02 4,910 938 26.0 22.4 1.00 5,030 1,080 26.2 22.3 1.00 5,010 90
T-Project³ UG Th – – – – – – – – – – 183 32.2 20.3 0.86 4,500 183 32.2 20.3 0.86 4,500 90
Davel UG Th – – – – – – – – – – 244 23.9 26.4 1.52 5,700 244 23.9 26.4 1.52 5,700 90
Deposit Coal Reserves Coal Reserves Khutala ≥ 1.0m seam thickness for OC,
≥ 2.5m seam thickness for UG, ≤ 45% ash and ≥ 24% dry ash-free volatile matter
≥ 1.0m seam thickness for OC and ≥ 3.6m seam thickness for UG
Klipspruit ≥ 1.0m seam thickness, ≤ 45% ash and ≥ 24% dry ash-free volatile matter
≥ 1.0m seam thickness, varying ≥ 3,580KCal/kg to ≥ 4,300KCal/kg, ≤ 45% ash
Wolvekrans ≥ 1.0m seam thickness, ≤ 45% ash, ≥ 17.9% volatile matter
≥ 1.0m seam thickness, ≥ 2,870KCal/kg CV, ≤ 45% ash, ≥ 17.9% volatile matter
Middelburg ≥ 1.0m seam thickness, ≤ 45% ash, ≥ 17.9% volatile matter
≥ 1.0m seam thickness, ≥ 2,870KCal/kg CV, ≤ 45% ash, ≥ 17.9% volatile matter
Deposit Coal Reserves Coal Reserves Leandra North ≥ 1.8m seam thickness –
Naudesbank varying ≥ 0.5m to 0.8m seam thickness, ≤ 45% ash, ≥ 22% dry ash-free volatile matter
–
Weltevreden ≥ 0.8m seam thickness, ≤ 45% ash –
Leandra South ≥ 1.8m seam thickness –
T-Project ≥ 1.8m seam thickness, ≥ 18% volatile matter –
Davel ≥ 1.2m seam thickness, ≥ 18% volatile matter –
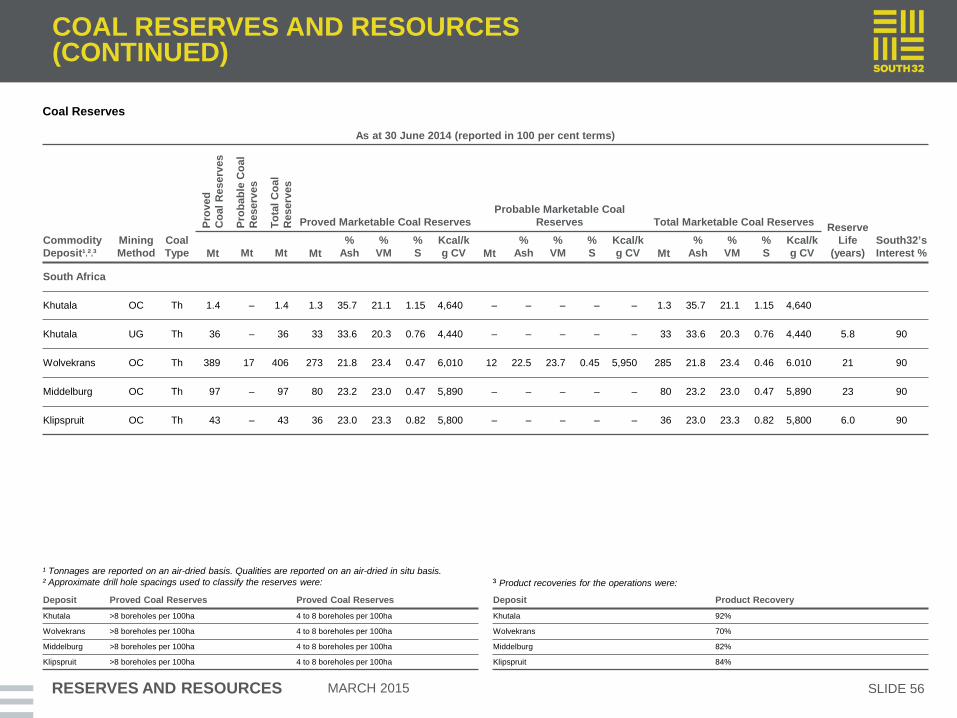
TAO2013\Comms\2015.03.16 - South32 Global Roadshow Pres\150305 South32 Global Roadshow Pres POST BAC Submission_v14.pptx COAL RESERVES AND RESOURCES
(CONTINUED)
MARCH 2015 RESERVES AND RESOURCES SLIDE 56
Coal Reserves
¹ Tonnages are reported on an air-dried basis. Qualities are reported on an air-dried in situ basis. ² Approximate drill hole spacings used to classify the reserves were:
As at 30 June 2014 (reported in 100 per cent terms)
Prov
ed
Coa
l Res
erve
s
Prob
able
Coa
l R
eser
ves
Tota
l Coa
l R
eser
ves
Proved Marketable Coal Reserves Probable Marketable Coal
Reserves Total Marketable Coal Reserves Reserve Life
(years) South32’s Interest %
Commodity Deposit¹,²,³
Mining Method
Coal Type Mt Mt Mt Mt
% Ash
% VM
% S
Kcal/kg CV Mt
% Ash
% VM
% S
Kcal/kg CV Mt
% Ash
% VM
% S
Kcal/kg CV
South Africa
Khutala OC Th 1.4 – 1.4 1.3 35.7 21.1 1.15 4,640 – – – – – 1.3 35.7 21.1 1.15 4,640
Khutala UG Th 36 – 36 33 33.6 20.3 0.76 4,440 – – – – – 33 33.6 20.3 0.76 4,440 5.8 90
Wolvekrans OC Th 389 17 406 273 21.8 23.4 0.47 6,010 12 22.5 23.7 0.45 5,950 285 21.8 23.4 0.46 6.010 21 90
Middelburg OC Th 97 – 97 80 23.2 23.0 0.47 5,890 – – – – – 80 23.2 23.0 0.47 5,890 23 90
Klipspruit OC Th 43 – 43 36 23.0 23.3 0.82 5,800 – – – – – 36 23.0 23.3 0.82 5,800 6.0 90
Deposit Proved Coal Reserves Proved Coal Reserves Khutala >8 boreholes per 100ha 4 to 8 boreholes per 100ha
Wolvekrans >8 boreholes per 100ha 4 to 8 boreholes per 100ha
Middelburg >8 boreholes per 100ha 4 to 8 boreholes per 100ha
Klipspruit >8 boreholes per 100ha 4 to 8 boreholes per 100ha
Deposit Product Recovery Khutala 92%
Wolvekrans 70%
Middelburg 82%
Klipspruit 84%
³ Product recoveries for the operations were:

TAO2013\Comms\2015.03.16 - South32 Global Roadshow Pres\150305 South32 Global Roadshow Pres POST BAC Submission_v14.pptx
MANGANESE RESERVES AND RESOURCES
MARCH 2015 RESERVES AND RESOURCES SLIDE 57
Manganese Mineral Resources
As at 30 June 2014 (reported in 100 per cent terms)
Measured Resources Indicated Resources Inferred Resources Total Resources
Commodity Deposit¹ Ore Type Mt % Mn % Yield Mt % Mn % Yield Mt % Mn % Yield Mt % Mn % Yield
South32’s Interest %
Manganese Australia
GEMCO² Sands – – – 13 20.8 – 2.3 20.0 – 15 20.7 – 60
ROM 95 46.1 48 46 43.6 47 34 42.7 49 175 44.8 48
South Africa³ Mt % Mn % Fe Mt % Mn % Fe Mt % Mn % Fe Mt % Mn % Yield
Wessels
Lower Body-HG 5.8 47.7 12.0 13 48.0 12.2 – – – 19 47.9 12.2 44.4
Lower Body-LG 9.4 42.1 13.4 20 41.8 13.3 – – – 29 41.9 13.3
Upper Body – – – 92 41.4 18.3 – – – 92 41.4 18.3
Total for Wessels 15 44.2 12.9 125 42.2 16.9 – – – 140 42.4 16.4 44.4
Mamatwan
M, C, N Zones 19 37.7 4.4 45 37.2 4.5 5.2 37.4 4.7 69 37.4 4.5 44.4
Top Cut (balance I&O) 9.0 30.5 6.6 20 29.9 6.3 5.6 29.1 6.2 34 29.9 6.4
X Zone 2.4 38.0 4.6 4.6 37.0 4.8 0.3 36.2 5.0 7.3 37.3 4.8
Total for Mamatwan 30 35.6 5.1 70 35.1 5.0 11 33.2 5.5 110 35.1 5.1 44.4
¹ Cut-off grades for Mineral Resources and Ore Reserves – GEMCO: ≥ 40 per cent Mn washed product and ≥ 1m ore thickness for ROM, > 0 per cent Mn in situ for Sands; Wessels: ≥ 45 per cent Mn for Lower Body-HG, ≥ 37.5 per cent Mn for Lower Body-LG and Upper Body; Mamatwan: ≥ 35 per cent Mn for M, C, N and X Zones, ≥ 28 per cent Mn for Top Cut (balance I&O).
² GEMCO – Mineral Resource ROM tonnes are stated as in situ, manganese grades are given as per washed ore sample and should be read together with their respective tonnage yields. Mineral Resource Sands tonnes and manganese grades are reported as in situ. Ore Reserve tonnes are stated as ROM, manganese grades are reported as expected product and should be read together with their respective tonnage yields.
³ Wessels and Mamatwan – Tonnes are stated as wet tonnes.

TAO2013\Comms\2015.03.16 - South32 Global Roadshow Pres\150305 South32 Global Roadshow Pres POST BAC Submission_v14.pptx MANGANESE RESERVES AND RESOURCES
(CONTINUED)
MARCH 2015 RESERVES AND RESOURCES SLIDE 58
Manganese Ore Reserves
As at 30 June 2014 (reported in 100 per cent terms)
Commodity Deposit1,4,5,6
Proved Ore Reserves Probable Ore Reserves Total Ore Reserves Reserve Life
(Years) South32’s Interest% Ore Type Mt % Mn % Yield Mt % Mn % Yield Mt % Mn % Yield
Manganese Australia
GEMCO² ROM 78 45.0 58 16 42.6 57 94 44.6 58 11 60
South Africa³ Mt % Mn % Fe Mt % Mn % Fe Mt % Mn % Fe
Wessels Lower Body-HG 1.2 48.0 12.2 7.2 47.6 12.3 8.4 47.7 12.3 46 44.4
Lower Body-LG 2.2 41.3 11.9 13 41.8 13.2 15 41.7 13.0
Upper Body – – – 46 41.4 18.2 46 41.4 18.2
Total for Wessels 3 43.7 12.0 66 42.2 16.6 69 42.2 16.4 44.4
Mamatwan M, C, N Zones 19 37.6 4.4 41 37.1 4.5 60 37.3 4.5 18 44.4
X Zone 1.6 38.2 4.7 2.4 36.7 4.8 4.0 37.3 4.8
Total for Mamatwan 21 37.7 4.4 43 37.1 4.5 64 37.3 4.5 44.4
¹ Cut-off grades for Mineral Resources and Ore Reserves as for Table 7.40 per Listing Document. ² GEMCO – Ore Reserve tonnes are stated as ROM, manganese grades are reported as expected product and should be read together with their respective tonnage yields. ³ Wessels and Mamatwan – Tonnes are stated as wet tonnes. 4 Approximate drill hole spacings used to classify the reserves were:
Deposit Proved Ore Reserves Probable Ore Reserves GEMCO 60m x 120m and 60m x 60m 120m x 120m
Wessels Defined as rim ±30m wide around mined-out areas, supplemented by some economically viable remnant blocks within mined-out areas
Defined as all ground beyond 30m
Mamatwan 80m x 80m 160m x 160m
Deposit Metallurgical Recovery GEMCO See yield in Ore Reserves table
Wessels 88%
Mamatwan 96%
5 Metallurgical recoveries for the operations were:
6 Ore delivered to process plant.

TAO2013\Comms\2015.03.16 - South32 Global Roadshow Pres\150305 South32 Global Roadshow Pres POST BAC Submission_v14.pptx
NICKEL RESERVES AND RESOURCES
MARCH 2015 RESERVES AND RESOURCES SLIDE 59
Nickel Mineral Resources As at 30 June 2014 (reported in 100 per cent terms)
Measured Resources Indicated Resources Inferred Resources Total Resources South32’s Interest % Commodity Deposit Ore Type Mt %Ni Mt %Ni Mt %Ni Mt %Ni
Nickel Colombia
Cerro Matoso
Laterite 44 1.2 179 0.9 66 0.8 289 0.9 99.94
SP 51 1.1 – – – – 51 1.1
MNR Ore 17 0.2 – – – – 17 0.2
Nickel Ore Reserves
¹ Approximate drill hole spacings used to classify the reserves were:
As at 30 June 2014 (reported in 100 per cent terms) Proved Ore Reserves Probable Ore Reserves Total Ore Reserves
Reserve Life (years)
South32’s Interest %
Commodity Deposit1,2,3 Ore Type Mt %Ni Mt %Ni Mt %Ni Nickel Colombia
Cerro Matoso4 Laterite 16 1.2 7.7 1.0 24 1.1 15 99.94
SP 24 1.3 – – 24 1.3
² Metallurgical recoveries for the operations were:
Deposit Proved Ore Reserves Probable Ore Reserves Cerro Matoso 35m or less with three drill holes 35m to 100m with three drill holes
Deposit Metallurgical Recovery
Cerro Matoso 82% (reserves to metal)
3 Ore delivered to process plant. 4 Cerro Matoso – Environmental licence approval required for the mine expansion project has been
delayed, but is expected to be granted. Approval of both the Environmental and Social Impact Assessment and Mining Work Program Plan is a consultative process and forms part of the normal course of business.
Deposit Cut-off Grades Ore Type Mineral Resources Ore Reserves
Cerro Matoso Laterite, SP ≥0.6% Ni ≥0.7% Ni MNR Ore ≥0.12% Ni -

TAO2013\Comms\2015.03.16 - South32 Global Roadshow Pres\150305 South32 Global Roadshow Pres POST BAC Submission_v14.pptx SILVER, LEAD AND ZINC RESERVES AND
RESOURCES
MARCH 2015 RESERVES AND RESOURCES SLIDE 60
Silver, Lead and Zinc Mineral Resources
Silver, Lead and Zinc Ore Reserves
As at 30 June 2014 (reported in 100 per cent terms)
Commodity Deposit¹
Measured Resources Indicated Resources Inferred Resources Total Resources South32’s Interest% Ore Type Mt g/t Ag %Pb %Zn Mt g/t Ag %Pb %Zn Mt g/t Ag %Pb %Zn Mt g/t Ag %Pb %Zn
Cannington
OC Sulphide 15 70 3.04 2.12 1.2 67 2.64 1.32 – – – – 16 70 3.01 2.06 100
UG Sulphide 42 226 6.18 3.86 11 147 4.51 3.04 6.7 98 3.52 2.00 60 197 5.57 3.50
Deposit Cut-off Grades Ore Type Mineral Resources Ore Reserves
Cannington
OC Sulphide Net value incorporating material revenue and cost factors and includes metallurgical recovery (see footnote 4 for averages). Mineralisation at A$45/t averages 27g/t Ag, 0.85% Pb and 0.90% Zn.
–
UG Sulphide Net value incorporating material revenue and cost factors and includes metallurgical recovery (see footnote 4 for averages). Mineralisation at A$90/t averages 48g/t Ag, 1.66% Pb and 2.15% Zn.
Net value cut-off incorporating material revenue and cost factors and includes metallurgical recovery (see footnote 4 for averages). Mineralisation at A$140/t averages 99g/t Ag, 4.40% Pb and 2.82% Zn.
As at 30 June 2014 (reported in 100 per cent terms)
Commodity Deposit1,2,3,4
Proved Ore Reserves Probable Ore Reserves Total Ore Reserves Reserve Life
(Years) South32’s Interest% Ore Type Mt g/t Ag %Pb %Zn Mt g/t Ag %Pb %Zn Mt g/t Ag %Pb %Zn
Cannington UG Sulphide 18 239 6.38 3.92 2.7 240 6.15 4.01 21 239 6.35 3.93 9.0 100
² Approximate drill hole spacings used to classify the reserves were: Deposit Proved Ore Reserves Probable Ore Reserves Cannington 12.5m sectional x 15m vertical 25m sectional x 25m vertical
Deposit Metallurgical Recovery Cannington Ag 87%, Pb 86%, Zn 79%
¹ Cut-off grades:
4 Metallurgical recoveries for the operations were:
3 Ore delivered to process plant.
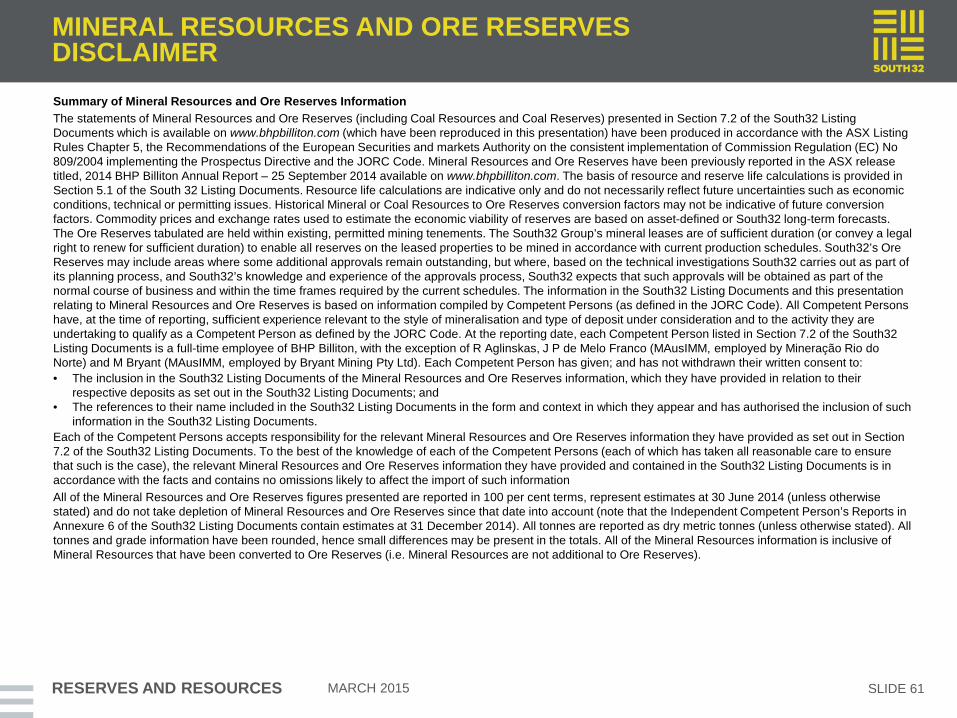
TAO2013\Comms\2015.03.16 - South32 Global Roadshow Pres\150305 South32 Global Roadshow Pres POST BAC Submission_v14.pptx MINERAL RESOURCES AND ORE RESERVES
DISCLAIMER
RESERVES AND RESOURCES
Summary of Mineral Resources and Ore Reserves Information The statements of Mineral Resources and Ore Reserves (including Coal Resources and Coal Reserves) presented in Section 7.2 of the South32 Listing Documents which is available on www.bhpbilliton.com (which have been reproduced in this presentation) have been produced in accordance with the ASX Listing Rules Chapter 5, the Recommendations of the European Securities and markets Authority on the consistent implementation of Commission Regulation (EC) No 809/2004 implementing the Prospectus Directive and the JORC Code. Mineral Resources and Ore Reserves have been previously reported in the ASX release titled, 2014 BHP Billiton Annual Report – 25 September 2014 available on www.bhpbilliton.com. The basis of resource and reserve life calculations is provided in Section 5.1 of the South 32 Listing Documents. Resource life calculations are indicative only and do not necessarily reflect future uncertainties such as economic conditions, technical or permitting issues. Historical Mineral or Coal Resources to Ore Reserves conversion factors may not be indicative of future conversion factors. Commodity prices and exchange rates used to estimate the economic viability of reserves are based on asset-defined or South32 long-term forecasts. The Ore Reserves tabulated are held within existing, permitted mining tenements. The South32 Group’s mineral leases are of sufficient duration (or convey a legal right to renew for sufficient duration) to enable all reserves on the leased properties to be mined in accordance with current production schedules. South32’s Ore Reserves may include areas where some additional approvals remain outstanding, but where, based on the technical investigations South32 carries out as part of its planning process, and South32’s knowledge and experience of the approvals process, South32 expects that such approvals will be obtained as part of the normal course of business and within the time frames required by the current schedules. The information in the South32 Listing Documents and this presentation relating to Mineral Resources and Ore Reserves is based on information compiled by Competent Persons (as defined in the JORC Code). All Competent Persons have, at the time of reporting, sufficient experience relevant to the style of mineralisation and type of deposit under consideration and to the activity they are undertaking to qualify as a Competent Person as defined by the JORC Code. At the reporting date, each Competent Person listed in Section 7.2 of the South32 Listing Documents is a full-time employee of BHP Billiton, with the exception of R Aglinskas, J P de Melo Franco (MAusIMM, employed by Mineração Rio do Norte) and M Bryant (MAusIMM, employed by Bryant Mining Pty Ltd). Each Competent Person has given; and has not withdrawn their written consent to: • The inclusion in the South32 Listing Documents of the Mineral Resources and Ore Reserves information, which they have provided in relation to their
respective deposits as set out in the South32 Listing Documents; and • The references to their name included in the South32 Listing Documents in the form and context in which they appear and has authorised the inclusion of such
information in the South32 Listing Documents. Each of the Competent Persons accepts responsibility for the relevant Mineral Resources and Ore Reserves information they have provided as set out in Section 7.2 of the South32 Listing Documents. To the best of the knowledge of each of the Competent Persons (each of which has taken all reasonable care to ensure that such is the case), the relevant Mineral Resources and Ore Reserves information they have provided and contained in the South32 Listing Documents is in accordance with the facts and contains no omissions likely to affect the import of such information All of the Mineral Resources and Ore Reserves figures presented are reported in 100 per cent terms, represent estimates at 30 June 2014 (unless otherwise stated) and do not take depletion of Mineral Resources and Ore Reserves since that date into account (note that the Independent Competent Person’s Reports in Annexure 6 of the South32 Listing Documents contain estimates at 31 December 2014). All tonnes are reported as dry metric tonnes (unless otherwise stated). All tonnes and grade information have been rounded, hence small differences may be present in the totals. All of the Mineral Resources information is inclusive of Mineral Resources that have been converted to Ore Reserves (i.e. Mineral Resources are not additional to Ore Reserves).
MARCH 2015 SLIDE 61

TAO2013\Comms\2015.03.16 - South32 Global Roadshow Pres\150305 South32 Global Roadshow Pres POST BAC Submission_v14.pptx
MARCH 2015
This page has been left intentionally blank
SLIDE 62

TAO2013\Comms\2015.03.16 - South32 Global Roadshow Pres\150305 South32 Global Roadshow Pres POST BAC Submission_v14.pptx
SECTION 7: SUPPLEMENTARY PRO FORMA FINANCIAL INFORMATION

TAO2013\Comms\2015.03.16 - South32 Global Roadshow Pres\150305 South32 Global Roadshow Pres POST BAC Submission_v14.pptx PRO FORMA INCOME STATEMENT
RECONCILIATION (H1 FY2015)
SUPPLEMENTARY PRO FORMA FINANCIAL INFORMATION MARCH 2015
1 South32’s historical combined income statement has been extracted, without material adjustment from the historical combined financial information in Annexures 1 and 2 of the South32 Listing Documents. 2 A pro forma adjustment has been made to reflect the loss of control and subsequent de-consolidation of the Manganese Business assuming the changes to the shareholder agreement were effective 1 July 2013. This information has been extracted, without material adjustment from the underlying accounting records of South32. The de-consolidation of the Manganese Business includes Australia Manganese, South Africa Manganese and certain balances and transactions included within South32 Group and Unallocated representing the Manganese Business’ share of central functions, consolidation adjustments and sale of third party product. For this reason, the de-consolidation pro forma adjustment will not fully reconcile with Australia Manganese and South Africa Manganese results contained in note 2 ‘Segment reporting’ to the historical combined financial information in Annexures 1 and 2 of the South32 Listing Documents. 3 The adjustment represents South32’s equity share of the profit/(loss) after taxation of the equity accounted investment in the Manganese Business. This adjustment has been calculated from the underlying accounting records of South32 and adjusted for the impact of additional depreciation arising from the uplift in the fair value of the Manganese Business. Also refer to ‘Equity accounted investment in Manganese Business’ in Section 10.8(b) of the South32 Listing Documents under accounting judgements and estimates. US$m H1 FY2015 FY2014 Profit after taxation of Manganese Business 127 214 Attributable to non controlling interests (50) (85) Attributable to members of South32 77 129 Depreciation charge on fair value uplift (after taxation) (45) (80) Share of operating profit of equity accounted investment in Manganese Business 32 49 4 This adjustment reflects the removal of the historical net finance costs associated with BHP Billiton centrally managed borrowings, and the removal of dividends received from BHP Billiton. Both adjustments have been tax effected at 30 per cent. Net finance costs and dividends associated to BHP Billiton have been extracted, without material adjustment from the historical combined financial information in Annexures 1 and 2 of the South32 Listing Documents. 5 Further details regarding earnings adjustments are set out in Table A3.3 of the South32 Listing Documents.
H1 FY2015 US$m
South32 Combined
Financial Information1
Change of Control of Manganese Business
Intercompany Financing4
South32 pro forma Consolidated
Financial Information Removal of
Consolidated Results2 Equity Accounted
Profit/(Loss)3
Revenue 5,040 (951) – – 4,089
Other income 521 (7) – (364) 150
Expenses excluding net finance costs (4,313) 763 – – (3,550)
Share of operating profit of equity accounted investments 3 – 32 – 35
Profit from operations 1,251 (195) 32 (364) 724
Net finance costs (37) 3 – 39 5
Taxation expense (476) 65 – (12) (423)
Profit after taxation 738 (127) 32 (337) 306
Other financial information
Profit from operations 1,251 (195) 32 (364) 724
Earnings adjustments5 (451) 17 (6) 364 (76)
Underlying EBIT 800 (178) 26 – 648
Depreciation and amortisation 506 (89) – – 417
Underlying EBITDA 1,306 (267) 26 – 1,065
Profit after taxation 738 (127) 32 (337) 306
Earnings adjustments after taxation5 (204) 9 (6) 337 136
Underlying Earnings 534 (118) 26 – 442
SLIDE 64

TAO2013\Comms\2015.03.16 - South32 Global Roadshow Pres\150305 South32 Global Roadshow Pres POST BAC Submission_v14.pptx PRO FORMA INCOME STATEMENT
RECONCILIATION (FY2014)
SUPPLEMENTARY PRO FORMA FINANCIAL INFORMATION MARCH 2015
FY2014 US$m
South32 Combined
Financial Information1
Change of Control of Manganese Business
Intercompany Financing4
South32 pro forma Consolidated
Financial Information Removal of
Consolidated Results2 Equity Accounted
Profit/(Loss)3
Revenue 10,444 (2,100) - - 8,344
Other income 310 (30) - (11) 269
Expenses excluding net finance costs (9,990) 1,652 - - (8,338)
Share of operating profit of equity accounted investments 10 - 49 3 62
Profit from operations 774 (478) 49 (8) 337
Net finance costs (352) 81 - 84 (187)
Taxation expense (205) 183 - (25) (47)
Profit after taxation 217 (214) 49 51 103
Other financial information
Profit from operations 774 (478) 49 (8) 337
Earnings adjustments5 296 15 4 8 323
Underlying EBIT 1,070 (463) 53 - 660
Depreciation and amortisation 985 (162) - - 823
Underlying EBITDA 2,055 (625) 53 - 1,483
Profit after taxation 217 (214) 49 51 103
Earnings adjustments after taxation5 397 (7) 4 (51) 343
Underlying Earnings 614 (221) 53 - 446
SLIDE 65
1 South32’s historical combined income statement has been extracted, without material adjustment from the historical combined financial information in Annexures 1 and 2 of the South32 Listing Documents. 2 A pro forma adjustment has been made to reflect the loss of control and subsequent de-consolidation of the Manganese Business assuming the changes to the shareholder agreement were effective 1 July 2013. This information has been extracted, without material adjustment from the underlying accounting records of South32. The de-consolidation of the Manganese Business includes Australia Manganese, South Africa Manganese and certain balances and transactions included within South32 Group and Unallocated representing the Manganese Business’ share of central functions, consolidation adjustments and sale of third party product. For this reason, the de-consolidation pro forma adjustment will not fully reconcile with Australia Manganese and South Africa Manganese results contained in note 2 ‘Segment reporting’ to the historical combined financial information in Annexures 1 and 2 of the South32 Listing Documents. 3 The adjustment represents South32’s equity share of the profit/(loss) after taxation of the equity accounted investment in the Manganese Business. This adjustment has been calculated from the underlying accounting records of South32 and adjusted for the impact of additional depreciation arising from the uplift in the fair value of the Manganese Business. Also refer to ‘Equity accounted investment in Manganese Business’ in Section 10.8(b) of the South32 Listing Documents under accounting judgements and estimates. US$m H1 FY2015 FY2014 Profit after taxation of Manganese Business 127 214 Attributable to non controlling interests (50) (85) Attributable to members of South32 77 129 Depreciation charge on fair value uplift (after taxation) (45) (80) Share of operating profit of equity accounted investment in Manganese Business 32 49 4 This adjustment reflects the removal of the historical net finance costs associated with BHP Billiton centrally managed borrowings, and the removal of dividends received from BHP Billiton. Both adjustments have been tax effected at 30 per cent. Net finance costs and dividends associated to BHP Billiton have been extracted, without material adjustment from the historical combined financial information in Annexures 1 and 2 of the South32 Listing Documents. 5 Further details regarding earnings adjustments are set out in Table A3.3 of the South32 Listing Documents.

TAO2013\Comms\2015.03.16 - South32 Global Roadshow Pres\150305 South32 Global Roadshow Pres POST BAC Submission_v14.pptx
PRO FORMA EARNINGS ADJUSTMENTS
SUPPLEMENTARY PRO FORMA FINANCIAL INFORMATION MARCH 2015
US$m H1 FY2015 FY2014 Earnings adjustments to Underlying EBIT
Exchange gains on restatement of monetary items (64) (53)
Impairment losses - 327
Impairment reversals - (8)
Fair value (gain)/loss on derivative instruments (6) 2
Other:
Bayside closure costs (excluding impairments) - 138
Gain on sale of Optimum coal rights - (84)
Equity share of earnings adjustment to Manganese after net finance costs and taxation (6) 1
Total earnings adjustments to Underlying EBIT (76) 323
Earnings adjustments to net finance costs
Exchange variations on net debt (93) 40
Total earnings adjustments to net finance costs (93) 40
Earnings adjustments to income tax expense
Tax effect of earnings adjustments to Underlying EBIT 22 (25)
Tax effect of earnings adjustments to net finance costs 28 (13)
Exchange rate movements 144 (9)
Re-measurement of deferred tax assets associated with the MRRT 111 -
Non-recognition of tax benefits where benefit remains with BHP Billiton - 27
Total earnings adjustments to income tax expense 305 (20)
Total earnings adjustments (136) 343
SLIDE 66
TAO2013\Comms\2015.03.16 - South32 Global Roadshow Pres\150305 South32 Global Roadshow Pres POST BAC Submission_v14.pptx
MARCH 2015
This page has been left intentionally blank
SLIDE 67
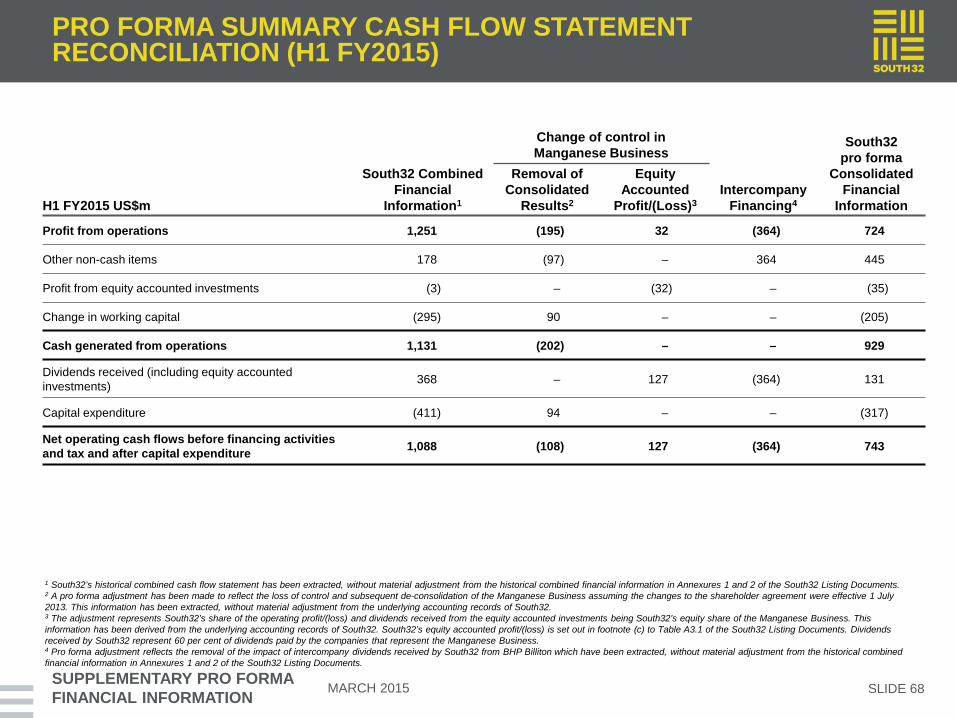
TAO2013\Comms\2015.03.16 - South32 Global Roadshow Pres\150305 South32 Global Roadshow Pres POST BAC Submission_v14.pptx PRO FORMA SUMMARY CASH FLOW STATEMENT
RECONCILIATION (H1 FY2015)
SUPPLEMENTARY PRO FORMA FINANCIAL INFORMATION MARCH 2015
1 South32’s historical combined cash flow statement has been extracted, without material adjustment from the historical combined financial information in Annexures 1 and 2 of the South32 Listing Documents. 2 A pro forma adjustment has been made to reflect the loss of control and subsequent de-consolidation of the Manganese Business assuming the changes to the shareholder agreement were effective 1 July 2013. This information has been extracted, without material adjustment from the underlying accounting records of South32. 3 The adjustment represents South32’s share of the operating profit/(loss) and dividends received from the equity accounted investments being South32’s equity share of the Manganese Business. This information has been derived from the underlying accounting records of South32. South32’s equity accounted profit/(loss) is set out in footnote (c) to Table A3.1 of the South32 Listing Documents. Dividends received by South32 represent 60 per cent of dividends paid by the companies that represent the Manganese Business. 4 Pro forma adjustment reflects the removal of the impact of intercompany dividends received by South32 from BHP Billiton which have been extracted, without material adjustment from the historical combined financial information in Annexures 1 and 2 of the South32 Listing Documents.
H1 FY2015 US$m
South32 Combined Financial
Information1
Change of control in Manganese Business
Intercompany Financing4
South32 pro forma
Consolidated Financial
Information
Removal of Consolidated
Results2
Equity Accounted
Profit/(Loss)3
Profit from operations 1,251 (195) 32 (364) 724
Other non-cash items 178 (97) – 364 445
Profit from equity accounted investments (3) – (32) – (35)
Change in working capital (295) 90 – – (205)
Cash generated from operations 1,131 (202) – – 929
Dividends received (including equity accounted investments) 368 – 127 (364) 131
Capital expenditure (411) 94 – – (317)
Net operating cash flows before financing activities and tax and after capital expenditure 1,088 (108) 127 (364) 743
SLIDE 68

TAO2013\Comms\2015.03.16 - South32 Global Roadshow Pres\150305 South32 Global Roadshow Pres POST BAC Submission_v14.pptx PRO FORMA SUMMARY CASH FLOW STATEMENT
RECONCILIATION (FY2014)
SUPPLEMENTARY PRO FORMA FINANCIAL INFORMATION MARCH 2015
FY2014 US$m
South32 Combined
Financial Information1
Change of Control in Manganese Business
Intercompany Financing4
South32 pro forma
Consolidated Financial
Information
Removal Of Consolidated
Results2 Equity Accounted
Profit/(Loss)3
Profit from operations 774 (478) 49 (8) 337
Other non-cash items 1,267 (149) - 11 1,129
Profit from equity accounted investments (10) - (49) (3) (62)
Change in working capital 77 (62) - - 15
Cash generated from operations 2,108 (689) - - 1,419
Dividends received (including equity accounted investments)
31 (12) 198 (11) 206
Capital expenditure (769) 179 - - (590)
Net operating cash flows before financing activities and tax and after capital expenditure 1,370 (522) 198 (11) 1,035
SLIDE 69
1 South32’s historical combined cash flow statement has been extracted, without material adjustment from the historical combined financial information in Annexures 1 and 2 of the South32 Listing Documents. 2 A pro forma adjustment has been made to reflect the loss of control and subsequent de-consolidation of the Manganese Business assuming the changes to the shareholder agreement were effective 1 July 2013. This information has been extracted, without material adjustment from the underlying accounting records of South32. 3 The adjustment represents South32’s share of the operating profit/(loss) and dividends received from the equity accounted investments being South32’s equity share of the Manganese Business. This information has been derived from the underlying accounting records of South32. South32’s equity accounted profit/(loss) is set out in footnote (c) to Table A3.1 of the South32 Listing Documents. Dividends received by South32 represent 60 per cent of dividends paid by the companies that represent the Manganese Business. 4 Pro forma adjustment reflects the removal of the impact of intercompany dividends received by South32 from BHP Billiton which have been extracted, without material adjustment from the historical combined financial information in Annexures 1 and 2 of the South32 Listing Documents.

TAO2013\Comms\2015.03.16 - South32 Global Roadshow Pres\150305 South32 Global Roadshow Pres POST BAC Submission_v14.pptx PRO FORMA BALANCE SHEET
RECONCILIATION
SUPPLEMENTARY PRO FORMA FINANCIAL INFORMATION MARCH 2015
Change of Control in Manganese Business
US$m
South32 Combined Balance Sheet
31 December 20141
Removal of Consolidated
Balances2
Equity Accounted
Interest3
Intercompany Settlement and
Debt Drawdown4
South32 Setup Costs5
Tax Consolidation6
South32 Pro forma
31 December 2014
Assets
Current assets
Cash and cash equivalents 459 (43) - 59 (111) - 364
Trade and other receivables 1,098 (139) - - - - 959
Receivable from BHP Billiton 9,508 (295) - (9,213) - - -
Receivable from related party - - 60 - - - 60
Other financial assets 15 - - - - - 15
Inventories 1,406 (382) - - - - 1,024
Current tax assets 107 - - - - - 107
Other 37 (11) - - - - 26
Total current assets 12,630 (870) 60 (9,154) (111) - 2,555
Non-current assets
Trade and other receivables 185 (4) - - - - 181
Receivables from related party - - 240 - - - 240
Other financial assets 508 (158) - - - - 350
Investments accounted for using the equity method 13 - 3,027 - - - 3,040
Inventories 60 - - - - - 60
Property, plant and equipment 12,220 (1,907) - 18 22 - 10,353
Intangible assets 290 (74) - 90 - - 306
Deferred tax assets 801 (43) - - - (174) 584
Other 16 - - - - - 16
Total non-current assets 14,093 (2,186) 3,267 108 22 (174) 15,130
Total assets 26,723 (3,056) 3,327 (9,046) (89) (174) 17,685
SLIDE 70
1 South32’s historical combined balance sheet has been extracted, without material adjustment from the historical combined financial information in Annexure 2 of the South32 Listing Documents (refer to discussion in Section 10.8(a) of the South32 Listing Documents for transfer of assets and liabilities at existing book value). 2 Pro forma adjustment has been made to reflect the loss of control and subsequent de-consolidation of the Manganese Business assuming the changes to the joint venture agreement were effective 31 December 2014. This information has been extracted, without material adjustment from the underlying accounting records of South32. 3 This adjustment represents the fair value of the equity accounted investment in the Manganese Business as at 2 March 2015 the date the change of control became effective and as disclosed in note 10 Subsequent events of Annexure 2 of the South32 Listing Documents. 4 This adjustment represents the settlement of net intercompany balances sourced from the South32 historical combined balance sheet (less the Manganese Business), the transfer of property, plant and equipment of US$18 million and intangible assets of US$90 million relating to the capital spend incurred by BHP Billiton on information technology infrastructure and corporate facilities for South32. The settlement of net intercompany balances with BHP Billiton of US$5,446 million (current receivables of US$9,213 million, current payables of US$39 million and non-current interest bearing liabilities payable of US$3,728 million) will be by a return of South32 capital of US$5,429 million and cash settlements. The cash settlement amount of US$59million is calculated to provide South32 with a target net cash and interest bearing liabilities position and assumes an indicative drawdown of U$150million from available debt facilities. 5 The adjustment made to cash reflects South32 set up costs associated with the Demerger to be incurred by South32 after the Demerger. These totals primarily include information technology set up costs and relocation costs as well as costs incurred under transitional service arrangements but exclude debt establishment fees. 6 As a consequence of the Demerger, South32 is required by Australian tax legislation to exit BHP Billiton’s existing Australian tax consolidated groups and re-consolidate in its own, new Australian tax consolidated group. As a result, certain deferred tax assets will reduce due to the resetting of the tax bases of certain tangible and intangible assets. It is expected that there will be a step down in the South32 cost base for income tax and/or capital gains tax of US$1,460 million that results in a reduction in South32’s deferred tax assets of US$174 million, a deferred tax liability of US$127 million and a current tax liability of US$28 million. The pro forma adjustment is based on the South32 Directors’ best estimate of the value of tax cost bases at the effective date of the tax consolidation. Refer to Section 10.8(e) of the South32 Listing Documents for more details.

TAO2013\Comms\2015.03.16 - South32 Global Roadshow Pres\150305 South32 Global Roadshow Pres POST BAC Submission_v14.pptx PRO FORMA BALANCE SHEET
RECONCILIATION (CONTINUED)
SUPPLEMENTARY PRO FORMA FINANCIAL INFORMATION MARCH 2015
Change of Control of Manganese Business
US$m
South32 Combined Balance Sheet
31 December 20141
Removal of Consolidated
Balances2
Equity Accounted
Interest3
Intercompany Settlement and
Debt Drawdown4
South32 Setup Costs5
Tax Consolidation6
South32 Pro forma
31 December 2014 Liabilities Current liabilities
Trade and other payables 1,232 (228) - - - - 1,004 Payable to BHP Billiton 41 (2) - (39) - - - Interest bearing liabilities 136 (4) - 150 - - 282 Other financial liabilities 6 - - - - - 6 Current tax payables 104 (30) - - (23) 28 79 Provisions 413 (52) - - - - 361 Deferred income 4 (1) - - - - 3
Total current liabilities 1,936 (317) - 111 (23) 28 1,735 Non-current liabilities
Trade and other payables 34 - - - - - 34 Interest bearing liabilities 877 (135) - - - - 742 Interest bearing liabilities payable to BHP Billiton 3,728 - - (3,728) - - - Other financial liabilities 18 - - - - - 18 Deferred tax liabilities 569 (26) - - - 127 670 Provisions 2,010 (478) - - - - 1,532 Deferred income 4 - - - - - 4
Total non-current liabilities 7,240 (639) - (3,728) - 127 3,000 Total liabilities 9,176 (956) - (3,617) (23) 155 4,735 Net assets 17,547 (2,100) 3,327 (5,429) (66) (329) 12,950 Invested Capital
Invested capital attributable to members of South32 16,710 (1,263) 3,327 (5,429) (66) (329) 12,950 Invested capital attributable to non-controlling interests 837 (837) - - - - -
Total invested capital 17,547 (2,100) 3,327 (5,429) (66) (329) 12,950
SLIDE 71
1 South32’s historical combined balance sheet has been extracted, without material adjustment from the historical combined financial information in Annexure 2 of the South32 Listing Documents (refer to discussion in Section 10.8(a) of the South32 Listing Documents for transfer of assets and liabilities at existing book value). 2 Pro forma adjustment has been made to reflect the loss of control and subsequent de-consolidation of the Manganese Business assuming the changes to the joint venture agreement were effective 31 December 2014. This information has been extracted, without material adjustment from the underlying accounting records of South32. 3 This adjustment represents the fair value of the equity accounted investment in the Manganese Business as at 2 March 2015 the date the change of control became effective and as disclosed in note 10 Subsequent events of Annexure 2 of the South32 Listing Documents. 4 This adjustment represents the settlement of net intercompany balances sourced from the South32 historical combined balance sheet (less the Manganese Business), the transfer of property, plant and equipment of US$18 million and intangible assets of US$90 million relating to the capital spend incurred by BHP Billiton on information technology infrastructure and corporate facilities for South32. The settlement of net intercompany balances with BHP Billiton of US$5,446 million (current receivables of US$9,213 million, current payables of US$39 million and non-current interest bearing liabilities payable of US$3,728 million) will be by a return of South32 capital of US$5,429 million and cash settlements. The cash settlement amount of US$59million is calculated to provide South32 with a target net cash and interest bearing liabilities position and assumes an indicative drawdown of U$150million from available debt facilities. 5 The adjustment made to cash reflects South32 set up costs associated with the Demerger to be incurred by South32 after the Demerger. These totals primarily include information technology set up costs and relocation costs as well as costs incurred under transitional service arrangements but exclude debt establishment fees. 6 As a consequence of the Demerger, South32 is required by Australian tax legislation to exit BHP Billiton’s existing Australian tax consolidated groups and re-consolidate in its own, new Australian tax consolidated group. As a result, certain deferred tax assets will reduce due to the resetting of the tax bases of certain tangible and intangible assets. It is expected that there will be a step down in the South32 cost base for income tax and/or capital gains tax of US$1,460 million that results in a reduction in South32’s deferred tax assets of US$174 million, a deferred tax liability of US$127 million and a current tax liability of US$28 million. The pro forma adjustment is based on the South32 Directors’ best estimate of the value of tax cost bases at the effective date of the tax consolidation. Refer to Section 10.8(e) of the South32 Listing Documents for more details.

TAO2013\Comms\2015.03.16 - South32 Global Roadshow Pres\150305 South32 Global Roadshow Pres POST BAC Submission_v14.pptx
PRO FORMA SEGMENT REPORTING H1 FY2015
SUPPLEMENTARY PRO FORMA FINANCIAL INFORMATION SLIDE 72 MARCH 2015
1 Third party products purchased by Marketing comprise US$358 million for aluminium (2014: US$802 million), US$46 million for coal (2014: US$456 million) and US$ nil for manganese (2014: US$2 million). Underlying EBIT on third party products comprise US$17 million for aluminium (2014: US$14 million), US$13 million for coal (2014: US$18 million) and US$ nil for manganese (2014: (US$2) million). 2 Underlying EBIT is earnings before net finance costs, taxation and any earnings adjustments items. Underlying EBIT is reported net of South32’s share of net finance costs and taxation of equity accounted investments. Underlying EBITDA is Underlying EBIT, before depreciation and amortisation. 3 Share of operating profit of equity accounted investments includes the impacts of earnings adjustments to Underlying EBIT. 4 Total segment assets and liabilities represent operating assets and liabilities including the carrying amount of equity accounted investments and predominantly excludes cash balances, interest bearing liabilities and deferred tax balances. The carrying amount of investments accounted for using the equity method represents the balance of the Group’s investment in equity accounted investments, with no adjustment for any cash balances, interest bearing liabilities and deferred tax balances of the equity accounted investment.
H1 FY2015 US$m.
Worsley Alumina
South Africa
Aluminium Mozal
Aluminium Brazil
Aluminium
South Africa Energy
Coal
Illawarra Metall-urgical
Coal Australia
Manganese
South Africa
Manganese Cerro
Matoso Cannin-
gton
Group and Unalloc-
ated Items/ Elimin-ations
Statutory Adjus-tment
Total South32
Revenue
Group production 319 823 340 268 683 425 339 231 340 486 - (569) 3,685
Third party products1 - - - - - - - - - - 404 - 404
Inter-segment revenue 332 - - - - - - - - - (332) -
Total revenue 651 823 340 268 683 425 339 231 340 486 72 (569) 4,089
Underlying EBITDA2 143 201 88 140 83 120 129 38 113 183 (32) (141) 1,065
Depreciation and amortisation (76) (34) (18) (39) (92) (100) (83) (33) (27) (29) (2) 116 (417)
Underlying EBIT2 67 167 70 101 (9) 20 46 5 86 154 (34) (25) 648
Comprising:
Group production 67 167 70 101 (12) 20 46 5 86 154 (64) (51) 589
Third party products - - - - - - - - - - 30 - 30
Share of operating profit of equity accounted investments3 - - - - 3 - - - - - - 26 29
Underlying EBIT 67 167 70 101 (9) 20 46 5 86 154 (34) (25) 648
Net finance costs (88)
Income tax expense (118)
Underlying earnings 442
Earnings adjustments (136)
Profit/(loss) after tax 306
Capital expenditure 27 10 5 5 58 180 34 22 18 14 - (56) 317
Investments accounted for using equity method - - - - 13 - - - - - - 3,027 3,040
Total assets4 3,793 1,502 719 1,078 2,051 1,770 1,861 1,305 1,082 402 5,198 (3,076) 17,685
Total liabilities4 380 307 91 140 1,037 236 272 179 228 210 2,106 (451) 4,735

TAO2013\Comms\2015.03.16 - South32 Global Roadshow Pres\150305 South32 Global Roadshow Pres POST BAC Submission_v14.pptx
PRO FORMA SEGMENT REPORTING FY2014
SUPPLEMENTARY PRO FORMA FINANCIAL INFORMATION SLIDE 73 MARCH 2015
FY2014 US$m
Worsley Alumina
South Africa
Aluminium Mozal
Aluminium Brazil
Aluminium
South Africa Energy
Coal
Illawarra Metall-urgical
Coal Australia
Manganese
South Africa
Manganese Cerro
Matoso Cannin-
gton
Group and Unalloc-
ated Items/ Elimin-ations
Statutory Adjus-tment
Total South32
Revenue
Group production 570 1,614 574 529 1,247 878 785 473 595 1,079 – (1,258) 7,086
Third party products1 – – – – – – – – – – 1,260 (2) 1,258
Inter-segment revenue 659 – – – – – – – – – (659) – –
Total revenue 1,229 1,614 574 529 1,247 878 785 473 595 1,079 601 (1,260) 8,344
Underlying EBITDA2 162 190 52 127 197 135 303 72 87 460 18 (320) 1,483
Depreciation and amortisation (138) (69) (36) (83) (193) (170) (148) (62) (88) (47) 1 210 (823)
Underlying EBIT2 24 121 16 44 4 (35) 155 10 (1) 413 19 (110) 660
Comprising:
Group production 24 121 16 44 (6) (35) 155 10 (1) 413 (11) (165) 565
Third party products – – – – – – – – – – 30 2 32
Share of operating profit of equity accounted investments3
– – – – 10 – – – – – – 53 63
Underlying EBIT 24 121 16 44 4 (35) 155 10 (1) 413 19 (110) 660
Net finance costs (147)
Income tax expense (67)
Underlying earnings 446
Earnings adjustments (343)
Profit/(loss) after tax 103
Capital expenditure 56 28 8 9 65 309 65 42 56 60 (1) (107) 590
1 Third party products purchased by Marketing comprise US$358 million for aluminium (2014: US$802 million), US$46 million for coal (2014: US$456 million) and US$ nil for manganese (2014: US$2 million). Underlying EBIT on third party products comprise US$17 million for aluminium (2014: US$14 million), US$13 million for coal (2014: US$18 million) and US$ nil for manganese (2014: (US$2) million). 2 Underlying EBIT is earnings before net finance costs, taxation and any earnings adjustments items. Underlying EBIT is reported net of South32’s share of net finance costs and taxation of equity accounted investments. Underlying EBITDA is Underlying EBIT, before depreciation and amortisation. 3 Share of operating profit of equity accounted investments includes the impacts of earnings adjustments to Underlying EBIT. 4 Total segment assets and liabilities represent operating assets and liabilities including the carrying amount of equity accounted investments and predominantly excludes cash balances, interest bearing liabilities and deferred tax balances. The carrying amount of investments accounted for using the equity method represents the balance of the Group’s investment in equity accounted investments, with no adjustment for any cash balances, interest bearing liabilities and deferred tax balances of the equity accounted investment.
TAO2013\Comms\2015.03.16 - South32 Global Roadshow Pres\150305 South32 Global Roadshow Pres POST BAC Submission_v14.pptx
SECTION 8: COMMODITY PRICE AND CURRENCY SENSITIVITIES

TAO2013\Comms\2015.03.16 - South32 Global Roadshow Pres\150305 South32 Global Roadshow Pres POST BAC Submission_v14.pptx
COMMODITY PRICE AND CURRENCY SENSITIVITIES
COMMODITY PRICE AND CURRENCY SENSITIVITIES MARCH 2015
Estimated impact on FY2014 combined Underlying EBIT of change of: US$m
US$5/t on alumina price 26
US$20/t on aluminium price 24
US$1/t on metallurgical coal price 6
US$1/t on energy coal price 15
US¢5/dmtu on manganese ore price 19
US$10/t on manganese alloy price 7
US¢10/lb on nickel price 10
US$20/t on lead price 4
US$20/t on zinc price 1
US¢20/oz on silver price 5
SLIDE 75
Estimated impact on FY2014 combined Underlying EBIT of strengthening US$ relative to: US$m
Australian dollar (US1 cent/A$) 30
South African rand (0.1 rand/US$) 15
Brazilian real (0.02 real/US$) 3
Colombian peso (20 peso/US$) 3
Mozambican metical (0.5 metical/US$) 1
TAO2013\Comms\2015.03.16 - South32 Global Roadshow Pres\150305 South32 Global Roadshow Pres POST BAC Submission_v14.pptx
SECTION 9: REVOLVING CREDIT FACILITY SUMMARY
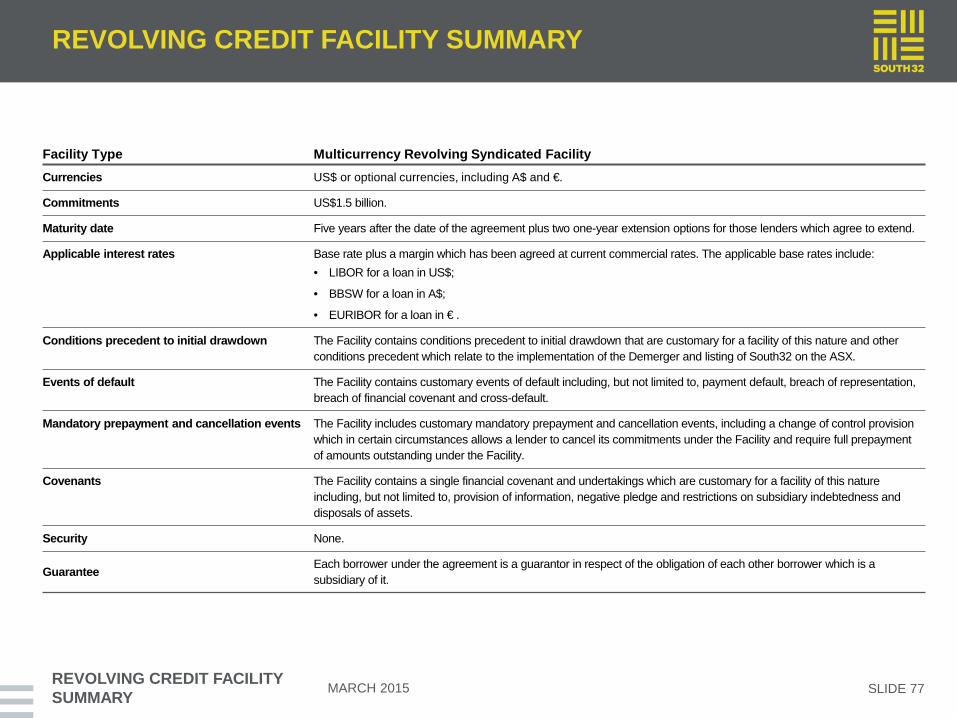
TAO2013\Comms\2015.03.16 - South32 Global Roadshow Pres\150305 South32 Global Roadshow Pres POST BAC Submission_v14.pptx
REVOLVING CREDIT FACILITY SUMMARY
REVOLVING CREDIT FACILITY SUMMARY MARCH 2015
Facility Type Multicurrency Revolving Syndicated Facility Currencies US$ or optional currencies, including A$ and €.
Commitments US$1.5 billion.
Maturity date Five years after the date of the agreement plus two one-year extension options for those lenders which agree to extend.
Applicable interest rates Base rate plus a margin which has been agreed at current commercial rates. The applicable base rates include: • LIBOR for a loan in US$;
• BBSW for a loan in A$;
• EURIBOR for a loan in € .
Conditions precedent to initial drawdown The Facility contains conditions precedent to initial drawdown that are customary for a facility of this nature and other conditions precedent which relate to the implementation of the Demerger and listing of South32 on the ASX.
Events of default The Facility contains customary events of default including, but not limited to, payment default, breach of representation, breach of financial covenant and cross-default.
Mandatory prepayment and cancellation events The Facility includes customary mandatory prepayment and cancellation events, including a change of control provision which in certain circumstances allows a lender to cancel its commitments under the Facility and require full prepayment of amounts outstanding under the Facility.
Covenants The Facility contains a single financial covenant and undertakings which are customary for a facility of this nature including, but not limited to, provision of information, negative pledge and restrictions on subsidiary indebtedness and disposals of assets.
Security None.
Guarantee Each borrower under the agreement is a guarantor in respect of the obligation of each other borrower which is a subsidiary of it.
SLIDE 77

TAO2013\Comms\2015.03.16 - South32 Global Roadshow Pres\150305 South32 Global Roadshow Pres POST BAC Submission_v14.pptx
SECTION 10: LISTING MECHANICS

TAO2013\Comms\2015.03.16 - South32 Global Roadshow Pres\150305 South32 Global Roadshow Pres POST BAC Submission_v14.pptx
LISTING AND DISTRIBUTION OF SHARES
LISTING MECHANICS
• Demerger effected through a 1 for 1 pro-rata distribution of shares by way of an in-specie dividend
• Australian incorporated company
﹣Primary listing: ASX
﹣Standard listing: UKLA
﹣Secondary listing: JSE
﹣OTC ADS program in the United States
• Expected South32 shares will qualify for inclusion in the S&P/ASX indices
MARCH 2015
Worsley Alumina, Australia
SLIDE 79

TAO2013\Comms\2015.03.16 - South32 Global Roadshow Pres\150305 South32 Global Roadshow Pres POST BAC Submission_v14.pptx
KEY TRADING DATES
LISTING MECHANICS MARCH 2015 SLIDE 80
Event Date
Last date on which BHP Billiton shares trade on the ASX, JSE and LSE with an entitlement to South32 shares 15 May 2015
South32 shares commence trading on the ASX on a deferred settlement basis, the JSE (normal trading), and the LSE on a when-issued basis
18 May 2015
Date for determining entitlement to South32 shares of BHP Billiton Plc Shareholders 19 May 2015
Date for determining entitlement to South32 shares of BHP Billiton Limited Shareholders 20 May 2015
Date for determining entitlement to South32 shares of BHP Billiton Plc Dematerialised Shareholders in Strate 22 May 2015
Normal trading of South32 shares on the LSE commences 26 May 2015
South32 ADSs commence regular way trading in the over the counter market 1 June 2015
Normal trading of South32 shares on the ASX commences 2 June 2015

TAO2013\Comms\2015.03.16 - South32 Global Roadshow Pres\150305 South32 Global Roadshow Pres POST BAC Submission_v14.pptx
SECTION 11: KEY RISKS

TAO2013\Comms\2015.03.16 - South32 Global Roadshow Pres\150305 South32 Global Roadshow Pres POST BAC Submission_v14.pptx
KEY RISKS
KEY RISKS
External Risks Relating to the Industries in Which South32 Operates a) Fluctuations in commodity prices and impacts of ongoing global economic volatility may negatively affect South32’s results, including cash
flows and asset values b) South32’s financial results may be negatively affected by currency exchange rate fluctuations c) Actions by governments or political events could have a negative impact on the business d) Challenges by administrative bodies, in particular tax authorities, may lead to additional liabilities for South32 e) South32’s operations are dependent on licences and permits, the obtaining, renewal or maintenance of which may be uncertain or challenging f) South32 may be exposed to litigation and claims that could result in a significant cost to South32 or affect its operations
Operational Risks a) Cost pressures and reduced productivity could negatively impact South32’s operating margins and expansion plans b) South32’s Businesses are dependent on access to infrastructure that is economical, and without such access these operations may be
disrupted or further development may be prevented c) South32’s Businesses are dependent on access to water and power that is economical, and without such access these operations may be
disrupted or further development may be prevented d) Unexpected natural or operational catastrophes may adversely impact South32’s operations e) South32 is reliant on non-controlled operators and contractors at some operations f) Outputs produced from processing are dependent on quality and consistent supply of inputs g) South32’s operations may be affected by unfavourable employee and union relations, which could disrupt its activities h) Due to the nature of its business and operations, South32 is exposed to the risks of fraud and corruption i) South32 will be smaller in scale than BHP Billiton following the Demerger j) The Demerger may fail to realise anticipated benefits for South32 k) Third party consents required as part of the Demerger may not be obtained l) Potential for delays, unexpected costs or other issues in establishing South32 as a stand-alone legal entity m) Breaches of South32’s information technology security processes may adversely impact South32’s business activities n) Failure to retain and attract key employees to South32 may impact on operations and financial results
Business Risks a) Failure to maintain, realise or enhance existing reserves, discover new reserves or develop new operations could negatively affect South32’s
future results and financial condition b) Increased costs or schedule delays may adversely affect South32’s development projects
MARCH 2015 SLIDE 82
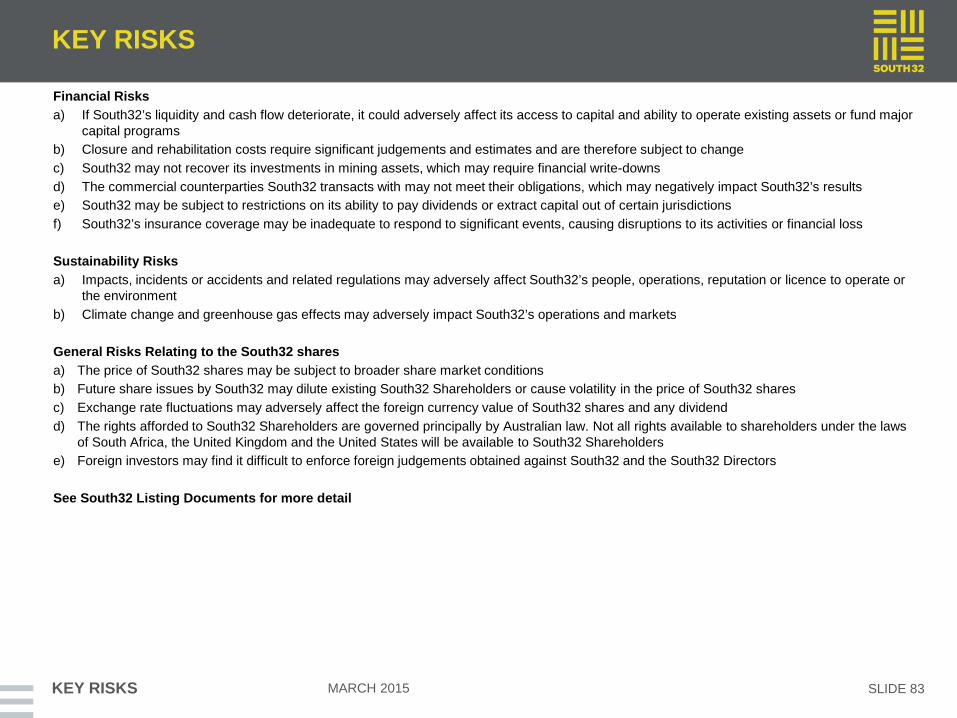
TAO2013\Comms\2015.03.16 - South32 Global Roadshow Pres\150305 South32 Global Roadshow Pres POST BAC Submission_v14.pptx
KEY RISKS
KEY RISKS
Financial Risks a) If South32’s liquidity and cash flow deteriorate, it could adversely affect its access to capital and ability to operate existing assets or fund major
capital programs b) Closure and rehabilitation costs require significant judgements and estimates and are therefore subject to change c) South32 may not recover its investments in mining assets, which may require financial write-downs d) The commercial counterparties South32 transacts with may not meet their obligations, which may negatively impact South32’s results e) South32 may be subject to restrictions on its ability to pay dividends or extract capital out of certain jurisdictions f) South32’s insurance coverage may be inadequate to respond to significant events, causing disruptions to its activities or financial loss
Sustainability Risks a) Impacts, incidents or accidents and related regulations may adversely affect South32’s people, operations, reputation or licence to operate or
the environment b) Climate change and greenhouse gas effects may adversely impact South32’s operations and markets General Risks Relating to the South32 shares a) The price of South32 shares may be subject to broader share market conditions b) Future share issues by South32 may dilute existing South32 Shareholders or cause volatility in the price of South32 shares c) Exchange rate fluctuations may adversely affect the foreign currency value of South32 shares and any dividend d) The rights afforded to South32 Shareholders are governed principally by Australian law. Not all rights available to shareholders under the laws
of South Africa, the United Kingdom and the United States will be available to South32 Shareholders e) Foreign investors may find it difficult to enforce foreign judgements obtained against South32 and the South32 Directors See South32 Listing Documents for more detail
MARCH 2015 SLIDE 83

TAO2013\Comms\2015.03.16 - South32 Global Roadshow Pres\150305 South32 Global Roadshow Pres POST BAC Submission_v14.pptx
MARCH 2015 INVESTOR PRESENTATION SLIDE 083