South Walton County and 30A Real Estate Report for May 2015
18
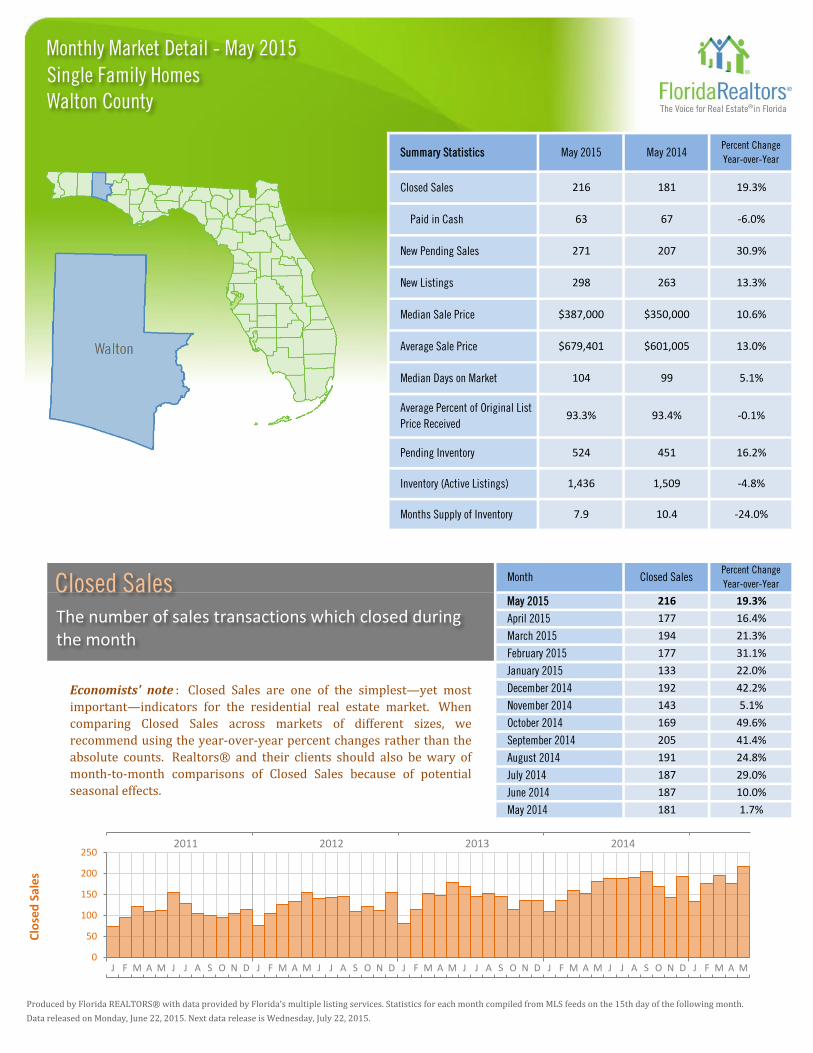
Produced by Florida REALTORS® with data provided by Florida's multiple listing services. Statistics for each month compiled from MLS feeds on the 15th day of the following month. Data released on Monday, June 22, 2015. Next data release is Wednesday, July 22, 2015. -0.1% 451 16.2% Percent Change Year-over-Year 19.3% 1,509 -4.8% Closed Sales 216 93.4% 10.4 -24.0% May 2015 Average Sale Price Median Days on Market 93.3% 524 Average Percent of Original List Price Received Pending Inventory Inventory (Active Listings) Month 1,436 Months Supply of Inventory 7.9 Summary Statistics Closed Sales Paid in Cash $679,401 May 2015 271 New Pending Sales New Listings Median Sale Price May 2014 Percent Change Year-over-Year 63 67 -6.0% 216 181 19.3% 207 30.9% $387,000 $350,000 10.6% 298 263 13.3% $601,005 13.0% 104 99 5.1% Economists' note : Closed Sales are one of the simplest—yet most important—indicators for the residential real estate market. When comparing Closed Sales across markets of different sizes, we recommend using the year-over-year percent changes rather than the absolute counts. Realtors® and their clients should also be wary of month-to-month comparisons of Closed Sales because of potential seasonal effects. January 2015 133 December 2014 192 November 2014 143 June 2014 187 May 2014 181 October 2014 169 September 2014 205 1.7% August 2014 191 July 2014 187 24.8% 29.0% 10.0% 22.0% 42.2% 49.6% 41.4% 5.1% April 2015 177 16.4% 21.3% 31.1% March 2015 194 February 2015 177 J F M A M J J A S O N D J F M A M J J A S O N D J F M A M J J A S O N D J F M A M J J A S O N D J F M A M Monthly Market Detail - May 2015 Walton County Single Family Homes 0 50 100 150 200 250 Closed Sales 2011 2012 2013 2014 Closed Sales The number of sales transactions which closed during the month
-
Upload
sowal-30a-sandestin-real-estate -
Category
Real Estate
-
view
92 -
download
0
Transcript of South Walton County and 30A Real Estate Report for May 2015
Produced by Florida REALTORS® with data provided by Florida's multiple listing services. Statistics for each month compiled from MLS feeds on the 15th day of the following month.
Data released on Monday, June 22, 2015. Next data release is Wednesday, July 22, 2015.
-0.1%
451 16.2%
Percent Change
Year-over-Year
19.3%
1,509 -4.8%
Closed Sales
216
93.4%
10.4 -24.0%
May 2015
Average Sale Price
Median Days on Market
93.3%
524
Average Percent of Original List
Price Received
Pending Inventory
Inventory (Active Listings)
Month
1,436
Months Supply of Inventory 7.9
Summary Statistics
Closed Sales
Paid in Cash
$679,401
May 2015
271New Pending Sales
New Listings
Median Sale Price
May 2014Percent Change
Year-over-Year
63 67 -6.0%
216 181 19.3%
207 30.9%
$387,000 $350,000 10.6%
298 263 13.3%
$601,005 13.0%
104 99 5.1%
Economists' note : Closed Sales are one of the simplest—yet most
important—indicators for the residential real estate market. When
comparing Closed Sales across markets of different sizes, we
recommend using the year-over-year percent changes rather than the
absolute counts. Realtors® and their clients should also be wary of
month-to-month comparisons of Closed Sales because of potential
seasonal effects.
January 2015 133
December 2014 192
November 2014 143
June 2014 187
May 2014 181
October 2014 169
September 2014 205
1.7%
August 2014 191
July 2014 187
24.8%
29.0%
10.0%
22.0%
42.2%
49.6%
41.4%
5.1%
April 2015 177 16.4%
21.3%
31.1%
March 2015 194
February 2015 177
J F M A M J J A S O N D J F M A M J J A S O N D J F M A M J J A S O N D J F M A M J J A S O N D J F M A M
Monthly Market Detail - May 2015
Walton County Single Family Homes
0
50
100
150
200
250
Clo
sed
Sal
es
2011 2012 2013 2014
Closed Sales The number of sales transactions which closed during the month
Produced by Florida REALTORS® with data provided by Florida's multiple listing services. Statistics for each month compiled from MLS feeds on the 15th day of the following month.
Data released on Monday, June 22, 2015. Next data release is Wednesday, July 22, 2015.
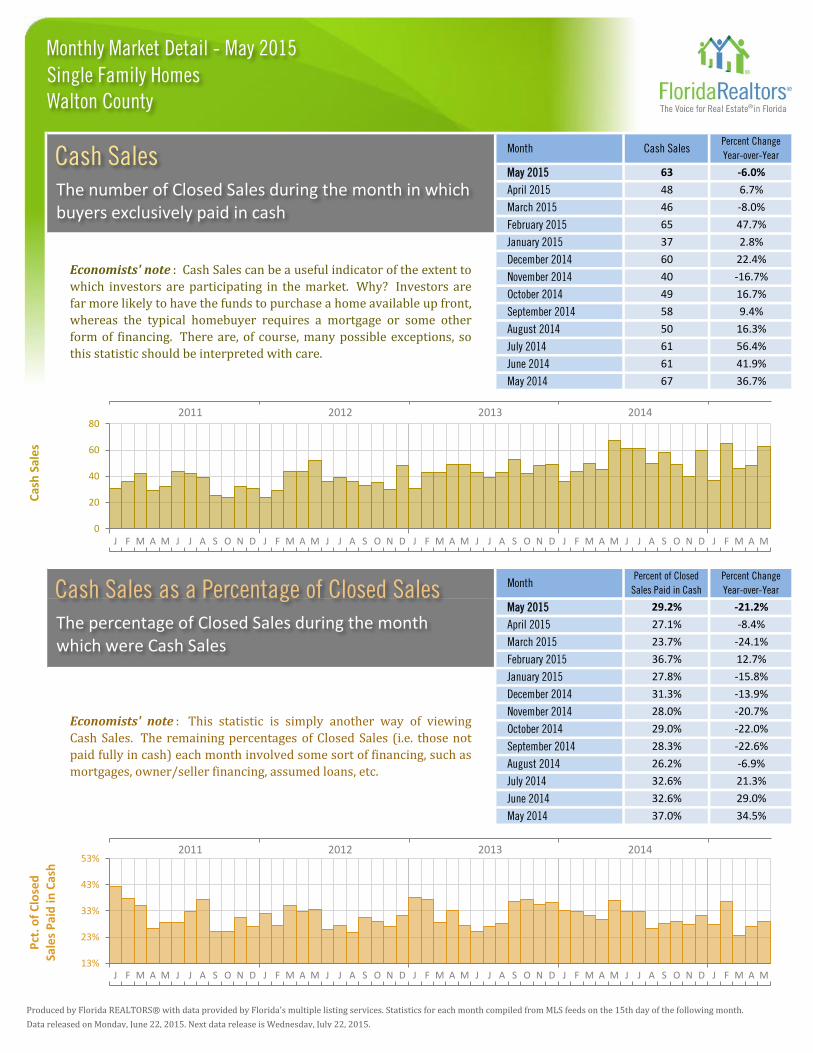
Month Cash SalesPercent Change
Year-over-Year
May 2015 63 -6.0%
April 2015 48 6.7%
March 2015 46 -8.0%
February 2015 65 47.7%
Economists' note : Cash Sales can be a useful indicator of the extent to
which investors are participating in the market. Why? Investors are
far more likely to have the funds to purchase a home available up front,
whereas the typical homebuyer requires a mortgage or some other
form of financing. There are, of course, many possible exceptions, so
this statistic should be interpreted with care.
January 2015 37 2.8%
December 2014 60 22.4%
November 2014 40 -16.7%
October 2014 49 16.7%
September 2014 58 9.4%
August 2014 50 16.3%
July 2014 61 56.4%
June 2014 61 41.9%
May 2014 67 36.7%
MonthPercent of Closed
Sales Paid in Cash
Percent Change
Year-over-Year
May 2015 29.2% -21.2%
April 2015 27.1% -8.4%
March 2015 23.7% -24.1%
February 2015 36.7% 12.7%
Economists' note : This statistic is simply another way of viewing
Cash Sales. The remaining percentages of Closed Sales (i.e. those not
paid fully in cash) each month involved some sort of financing, such as
mortgages, owner/seller financing, assumed loans, etc.
January 2015 27.8% -15.8%
December 2014 31.3% -13.9%
November 2014 28.0% -20.7%
October 2014 29.0% -22.0%
September 2014 28.3% -22.6%
August 2014 26.2% -6.9%
July 2014 32.6% 21.3%
June 2014 32.6% 29.0%
May 2014 37.0% 34.5%
13%
23%
33%
43%
53%
Pct
. of
Clo
sed
Sa
les
Pai
d in
Cas
h
J F M A M J J A S O N D J F M A M J J A S O N D J F M A M J J A S O N D J F M A M J J A S O N D J F M A M
0
20
40
60
80
Cas
h S
ale
s
J F M A M J J A S O N D J F M A M J J A S O N D J F M A M J J A S O N D J F M A M J J A S O N D J F M A M
Monthly Market Detail - May 2015
2011 2012 2013 2014
Walton County Single Family Homes
Cash Sales The number of Closed Sales during the month in which buyers exclusively paid in cash
2011 2012 2013 2014
Cash Sales as a Percentage of Closed Sales The percentage of Closed Sales during the month which were Cash Sales
Produced by Florida REALTORS® with data provided by Florida's multiple listing services. Statistics for each month compiled from MLS feeds on the 15th day of the following month.
Data released on Monday, June 22, 2015. Next data release is Wednesday, July 22, 2015.
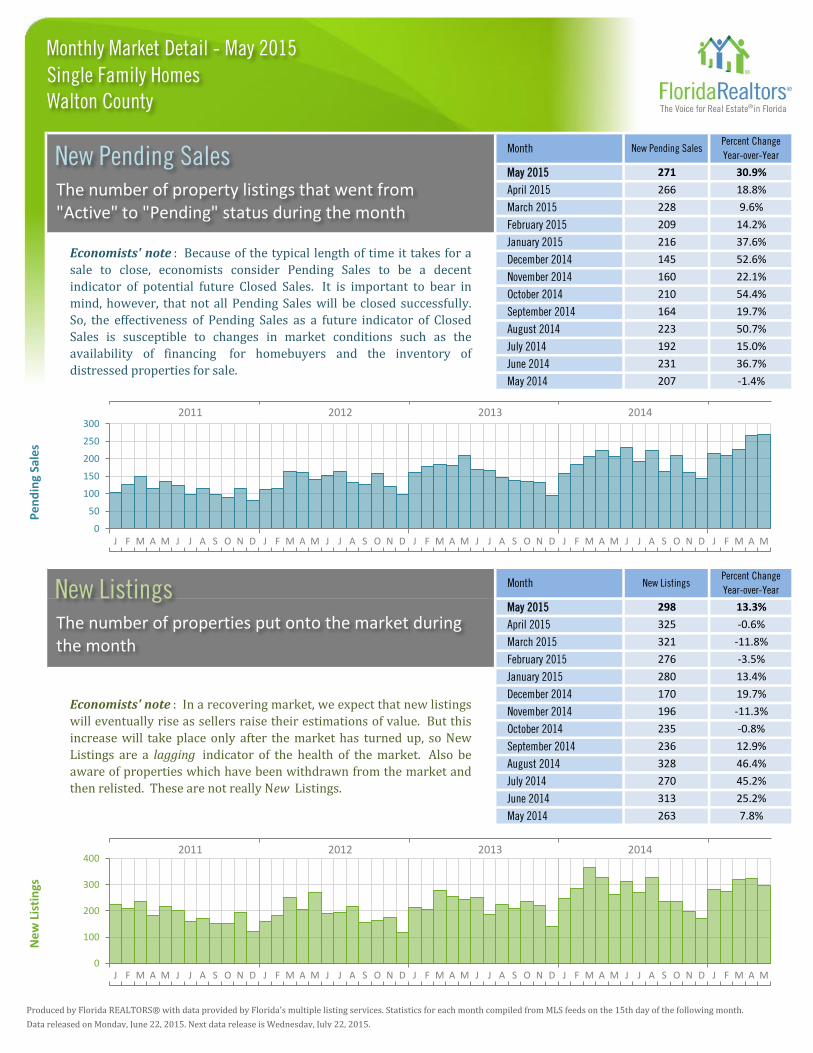
Month
MonthPercent Change
Year-over-YearNew Listings
-0.6%325April 2015
13.3%298May 2015
36.7%
-1.4%
30.9%
18.8%
9.6%
14.2%
-3.5%276February 2015
-11.8%321March 2015
7.8%263May 2014
25.2%313June 2014
45.2%270July 2014
46.4%328August 2014
12.9%236
223
192
231
207
50.7%
15.0%
-0.8%235
-11.3%196
19.7%170
13.4%280
37.6%
52.6%
22.1%
54.4%
19.7%
209
Percent Change
Year-over-YearNew Pending Sales
271
266
228
216
145
160
210
164
May 2015
April 2015
March 2015
February 2015
January 2015Economists' note : Because of the typical length of time it takes for a
sale to close, economists consider Pending Sales to be a decent
indicator of potential future Closed Sales. It is important to bear in
mind, however, that not all Pending Sales will be closed successfully.
So, the effectiveness of Pending Sales as a future indicator of Closed
Sales is susceptible to changes in market conditions such as the
availability of financing for homebuyers and the inventory of
distressed properties for sale.
Economists' note : In a recovering market, we expect that new listings
will eventually rise as sellers raise their estimations of value. But this
increase will take place only after the market has turned up, so New
Listings are a lagging indicator of the health of the market. Also be
aware of properties which have been withdrawn from the market and
then relisted. These are not really New Listings.
July 2014
June 2014
May 2014
December 2014
November 2014
October 2014
September 2014
August 2014
September 2014
October 2014
November 2014
December 2014
January 2015
J F M A M J J A S O N D J F M A M J J A S O N D J F M A M J J A S O N D J F M A M J J A S O N D J F M A M
J F M A M J J A S O N D J F M A M J J A S O N D J F M A M J J A S O N D J F M A M J J A S O N D J F M A M
0
100
200
300
400
Ne
w L
isti
ngs
0
50
100
150
200
250
300
Pe
nd
ing
Sale
s
Monthly Market Detail - May 2015
2011 2012 2013 2014
Walton County Single Family Homes
New Pending Sales The number of property listings that went from "Active" to "Pending" status during the month
2011 2012 2013 2014
New Listings The number of properties put onto the market during the month
Produced by Florida REALTORS® with data provided by Florida's multiple listing services. Statistics for each month compiled from MLS feeds on the 15th day of the following month.
Data released on Monday, June 22, 2015. Next data release is Wednesday, July 22, 2015.
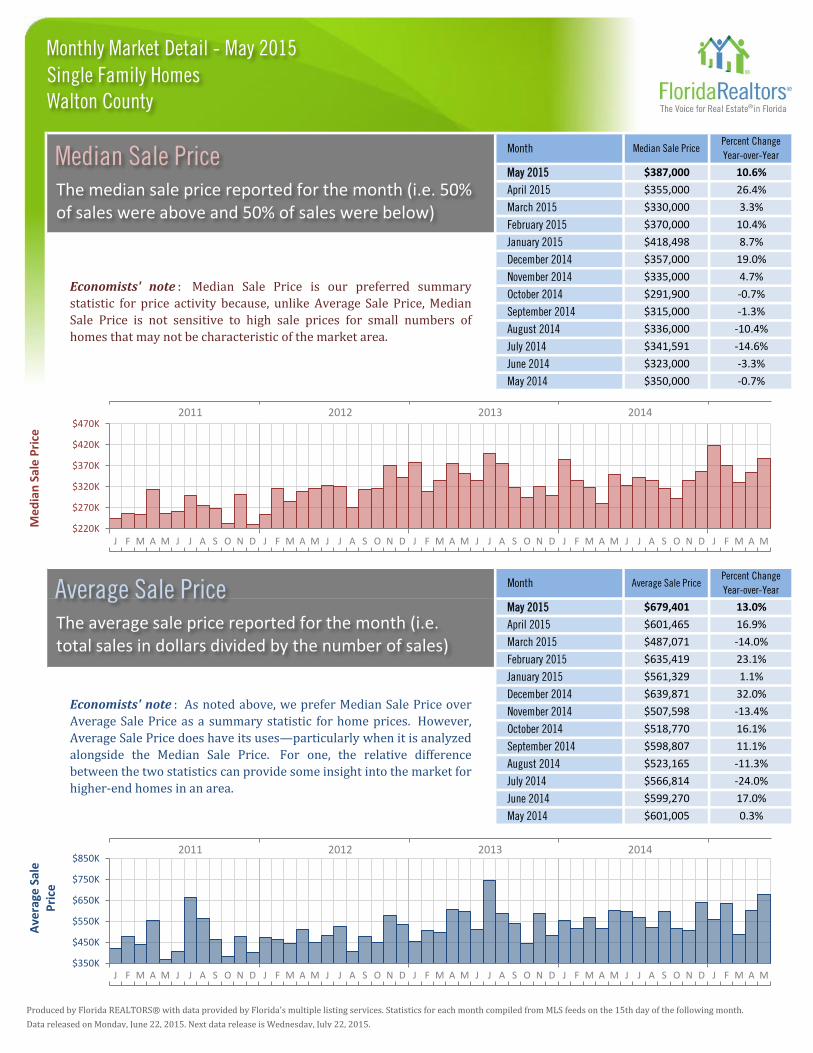
April 2015 $355,000 26.4%
Median Sale PricePercent Change
Year-over-Year
May 2015 $387,000 10.6%
Month
March 2015 $330,000 3.3%
February 2015 $370,000 10.4%
Economists' note : Median Sale Price is our preferred summary
statistic for price activity because, unlike Average Sale Price, Median
Sale Price is not sensitive to high sale prices for small numbers of
homes that may not be characteristic of the market area.
January 2015 $418,498 8.7%
December 2014 $357,000 19.0%
November 2014 $335,000 4.7%
October 2014 $291,900 -0.7%
September 2014 $315,000 -1.3%
August 2014 $336,000 -10.4%
July 2014 $341,591 -14.6%
April 2015 $601,465 16.9%
June 2014 $323,000 -3.3%
May 2014 $350,000 -0.7%
Average Sale PricePercent Change
Year-over-Year
May 2015 $679,401 13.0%
Month
March 2015 $487,071 -14.0%
February 2015 $635,419 23.1%
Economists' note : As noted above, we prefer Median Sale Price over
Average Sale Price as a summary statistic for home prices. However,
Average Sale Price does have its uses—particularly when it is analyzed
alongside the Median Sale Price. For one, the relative difference
between the two statistics can provide some insight into the market for
higher-end homes in an area.
January 2015 $561,329 1.1%
December 2014 $639,871 32.0%
November 2014 $507,598 -13.4%
October 2014 $518,770 16.1%
September 2014 $598,807 11.1%
August 2014 $523,165 -11.3%
July 2014 $566,814 -24.0%
June 2014 $599,270 17.0%
May 2014 $601,005 0.3%
$350K
$450K
$550K
$650K
$750K
$850K
Ave
rage
Sal
e
Pri
ce
J F M A M J J A S O N D J F M A M J J A S O N D J F M A M J J A S O N D J F M A M J J A S O N D J F M A M
$220K
$270K
$320K
$370K
$420K
$470K
Me
dia
n S
ale
Pri
ce
J F M A M J J A S O N D J F M A M J J A S O N D J F M A M J J A S O N D J F M A M J J A S O N D J F M A M
Monthly Market Detail - May 2015
2011 2012 2013 2014
Walton County Single Family Homes
Median Sale Price The median sale price reported for the month (i.e. 50% of sales were above and 50% of sales were below)
2011 2012 2013 2014
Average Sale Price The average sale price reported for the month (i.e. total sales in dollars divided by the number of sales)
Produced by Florida REALTORS® with data provided by Florida's multiple listing services. Statistics for each month compiled from MLS feeds on the 15th day of the following month.
Data released on Monday, June 22, 2015. Next data release is Wednesday, July 22, 2015.
April 2015 101 6.3%
Median Days on
Market
Percent Change
Year-over-Year
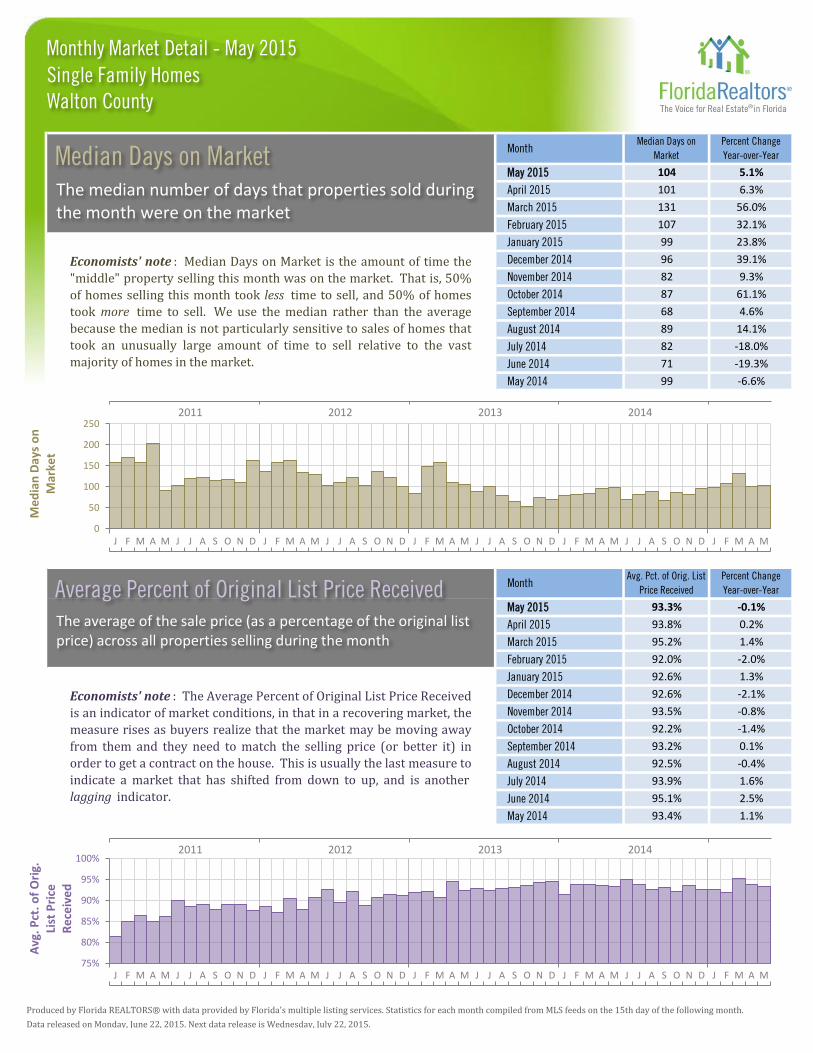
May 2015 104 5.1%
Month
March 2015 131 56.0%
February 2015 107 32.1%
Economists' note : Median Days on Market is the amount of time the
"middle" property selling this month was on the market. That is, 50%
of homes selling this month took less time to sell, and 50% of homes
took more time to sell. We use the median rather than the average
because the median is not particularly sensitive to sales of homes that
took an unusually large amount of time to sell relative to the vast
majority of homes in the market.
January 2015 99 23.8%
December 2014 96 39.1%
November 2014 82 9.3%
October 2014 87 61.1%
September 2014 68 4.6%
August 2014 89 14.1%
July 2014 82 -18.0%
April 2015 93.8% 0.2%
June 2014 71 -19.3%
May 2014 99 -6.6%
Avg. Pct. of Orig. List
Price Received
Percent Change
Year-over-Year
May 2015 93.3% -0.1%
Month
March 2015 95.2% 1.4%
February 2015 92.0% -2.0%
Economists' note : The Average Percent of Original List Price Received
is an indicator of market conditions, in that in a recovering market, the
measure rises as buyers realize that the market may be moving away
from them and they need to match the selling price (or better it) in
order to get a contract on the house. This is usually the last measure to
indicate a market that has shifted from down to up, and is another
lagging indicator.
January 2015 92.6% 1.3%
December 2014 92.6% -2.1%
November 2014 93.5% -0.8%
October 2014 92.2% -1.4%
September 2014 93.2% 0.1%
August 2014 92.5% -0.4%
July 2014 93.9% 1.6%
June 2014 95.1% 2.5%
May 2014 93.4% 1.1%
75%
80%
85%
90%
95%
100%
Avg
. Pct
. o
f O
rig.
Li
st P
rice
R
ece
ive
d
J F M A M J J A S O N D J F M A M J J A S O N D J F M A M J J A S O N D J F M A M J J A S O N D J F M A M
0
50
100
150
200
250
Me
dia
n D
ays
on
M
arke
t
J F M A M J J A S O N D J F M A M J J A S O N D J F M A M J J A S O N D J F M A M J J A S O N D J F M A M
Monthly Market Detail - May 2015
2011 2012 2013 2014
Walton County Single Family Homes
Median Days on Market The median number of days that properties sold during the month were on the market
2011 2012 2013 2014
Average Percent of Original List Price Received The average of the sale price (as a percentage of the original list price) across all properties selling during the month
Produced by Florida REALTORS® with data provided by Florida's multiple listing services. Statistics for each month compiled from MLS feeds on the 15th day of the following month.
Data released on Monday, June 22, 2015. Next data release is Wednesday, July 22, 2015.
April 2015 1,487 -2.4%
InventoryPercent Change
Year-over-Year
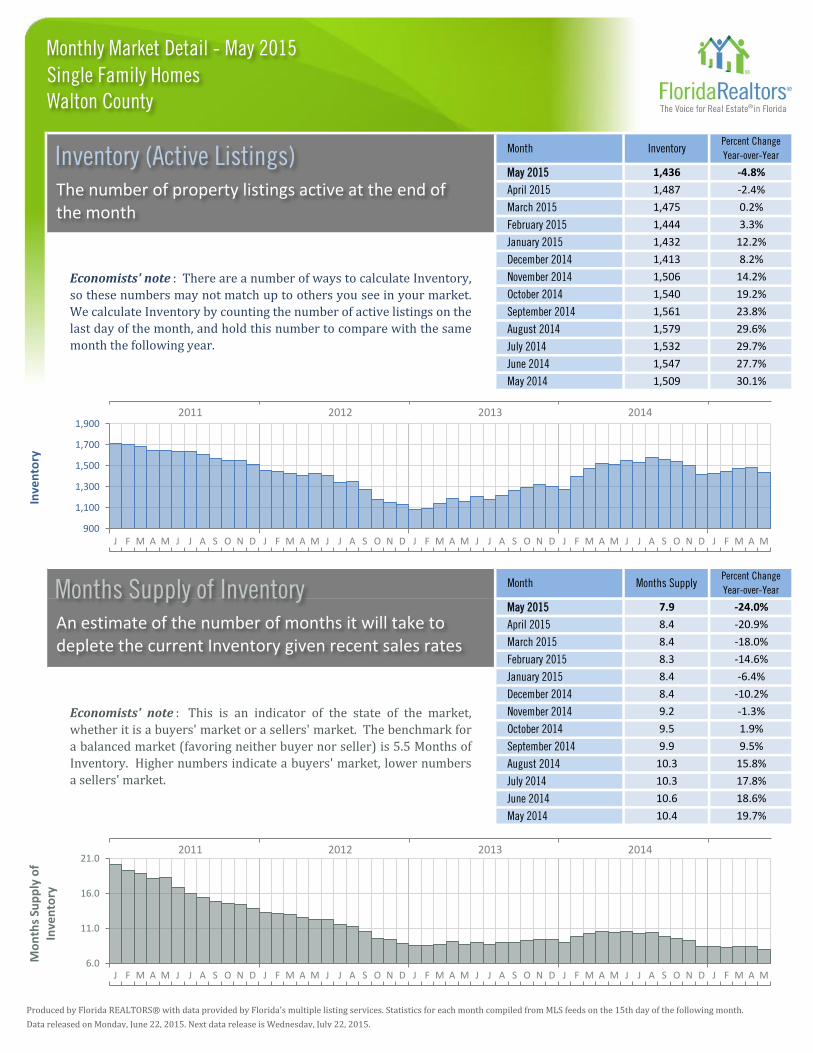
May 2015 1,436 -4.8%
Month
March 2015 1,475 0.2%
February 2015 1,444 3.3%
Economists' note : There are a number of ways to calculate Inventory,
so these numbers may not match up to others you see in your market.
We calculate Inventory by counting the number of active listings on the
last day of the month, and hold this number to compare with the same
month the following year.
January 2015 1,432 12.2%
December 2014 1,413 8.2%
November 2014 1,506 14.2%
October 2014 1,540 19.2%
September 2014 1,561 23.8%
August 2014 1,579 29.6%
July 2014 1,532 29.7%
April 2015 8.4 -20.9%
June 2014 1,547 27.7%
May 2014 1,509 30.1%
Months SupplyPercent Change
Year-over-Year
May 2015 7.9 -24.0%
Month
March 2015 8.4 -18.0%
February 2015 8.3 -14.6%
Economists' note : This is an indicator of the state of the market,
whether it is a buyers' market or a sellers' market. The benchmark for
a balanced market (favoring neither buyer nor seller) is 5.5 Months of
Inventory. Higher numbers indicate a buyers' market, lower numbers
a sellers' market.
January 2015 8.4 -6.4%
December 2014 8.4 -10.2%
November 2014 9.2 -1.3%
October 2014 9.5 1.9%
September 2014 9.9 9.5%
August 2014 10.3 15.8%
July 2014 10.3 17.8%
June 2014 10.6 18.6%
May 2014 10.4 19.7%
900
1,100
1,300
1,500
1,700
1,900
Inve
nto
ry
J F M A M J J A S O N D J F M A M J J A S O N D J F M A M J J A S O N D J F M A M J J A S O N D J F M A M
Monthly Market Detail - May 2015
2011 2012 2013 2014
Walton County Single Family Homes
Inventory (Active Listings) The number of property listings active at the end of the month
6.0
11.0
16.0
21.0
Mo
nth
s Su
pp
ly o
f In
ven
tory
2011 2012 2013 2014
Months Supply of Inventory An estimate of the number of months it will take to deplete the current Inventory given recent sales rates
J F M A M J J A S O N D J F M A M J J A S O N D J F M A M J J A S O N D J F M A M J J A S O N D J F M A M
Produced by Florida REALTORS® with data provided by Florida's multiple listing services. Statistics for each month compiled from MLS feeds on the 15th day of the following month.
Data released on Monday, June 22, 2015. Next data release is Wednesday, July 22, 2015.
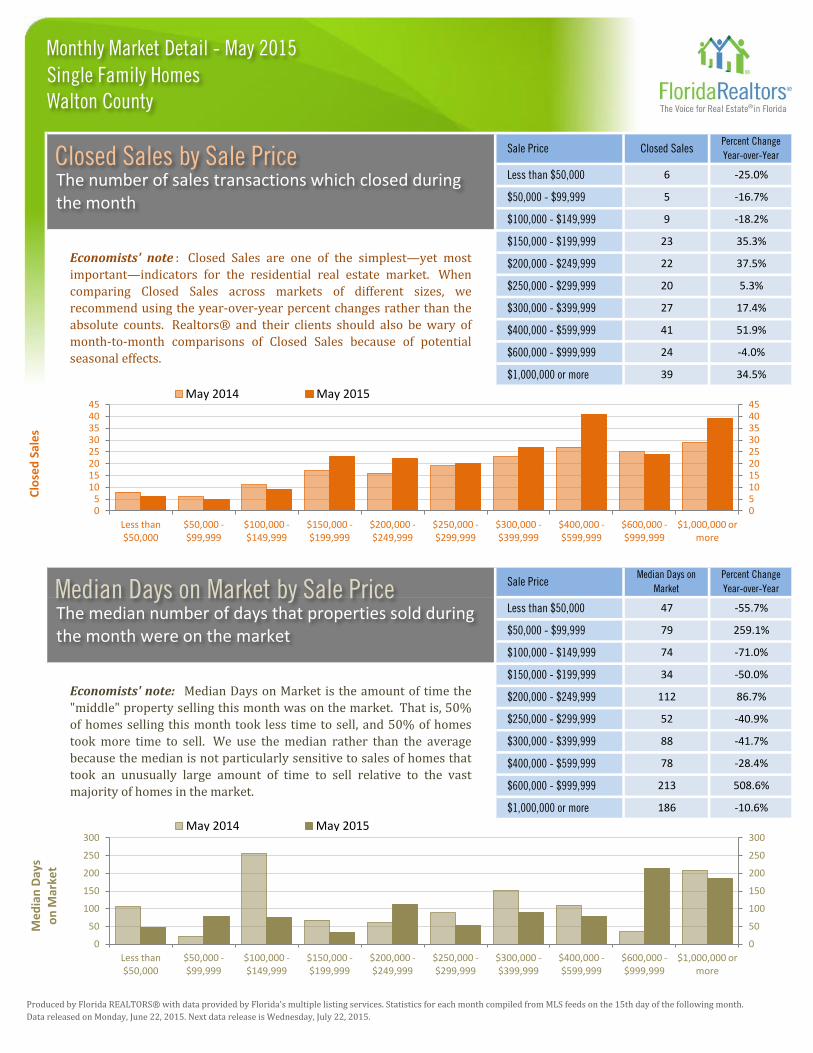
$600,000 - $999,999 213 508.6%
$1,000,000 or more 186 -10.6%
Economists' note: Median Days on Market is the amount of time the
"middle" property selling this month was on the market. That is, 50%
of homes selling this month took less time to sell, and 50% of homes
took more time to sell. We use the median rather than the average
because the median is not particularly sensitive to sales of homes that
took an unusually large amount of time to sell relative to the vast
majority of homes in the market.
$150,000 - $199,999 34 -50.0%
$200,000 - $249,999 112 86.7%
$250,000 - $299,999
$400,000 - $599,999 78 -28.4%
52 -40.9%
$300,000 - $399,999 88 -41.7%
Economists' note : Closed Sales are one of the simplest—yet most
important—indicators for the residential real estate market. When
comparing Closed Sales across markets of different sizes, we
recommend using the year-over-year percent changes rather than the
absolute counts. Realtors® and their clients should also be wary of
month-to-month comparisons of Closed Sales because of potential
seasonal effects.
Sale PriceMedian Days on
Market
Percent Change
Year-over-Year
Less than $50,000 47 -55.7%
$1,000,000 or more 39 34.5%
$250,000 - $299,999 20 5.3%
$300,000 - $399,999 27 17.4%
$50,000 - $99,999 79 259.1%
$100,000 - $149,999
$400,000 - $599,999 41 51.9%
$600,000 - $999,999 24 -4.0%
74 -71.0%
$150,000 - $199,999 23 35.3%
$200,000 - $249,999 22 37.5%
$100,000 - $149,999 9 -18.2%
Sale Price Closed SalesPercent Change
Year-over-Year
Less than $50,000 6 -25.0%
$50,000 - $99,999 5 -16.7%
0 5
10 15 20 25 30 35 40 45
Less than $50,000
$50,000 - $99,999
$100,000 - $149,999
$150,000 - $199,999
$200,000 - $249,999
$250,000 - $299,999
$300,000 - $399,999
$400,000 - $599,999
$600,000 - $999,999
$1,000,000 or more
Clo
sed
Sal
es
May 2014 May 2015
0 5 10 15 20 25 30 35 40 45
0
50
100
150
200
250
300
Less than $50,000
$50,000 - $99,999
$100,000 - $149,999
$150,000 - $199,999
$200,000 - $249,999
$250,000 - $299,999
$300,000 - $399,999
$400,000 - $599,999
$600,000 - $999,999
$1,000,000 or more
Me
dia
n D
ays
on
Mar
ket
May 2014 May 2015
0
50
100
150
200
250
300
Monthly Market Detail - May 2015
Walton County Single Family Homes
Closed Sales by Sale Price The number of sales transactions which closed during the month
Median Days on Market by Sale Price The median number of days that properties sold during the month were on the market
Produced by Florida REALTORS® with data provided by Florida's multiple listing services. Statistics for each month compiled from MLS feeds on the 15th day of the following month.
Data released on Monday, June 22, 2015. Next data release is Wednesday, July 22, 2015.
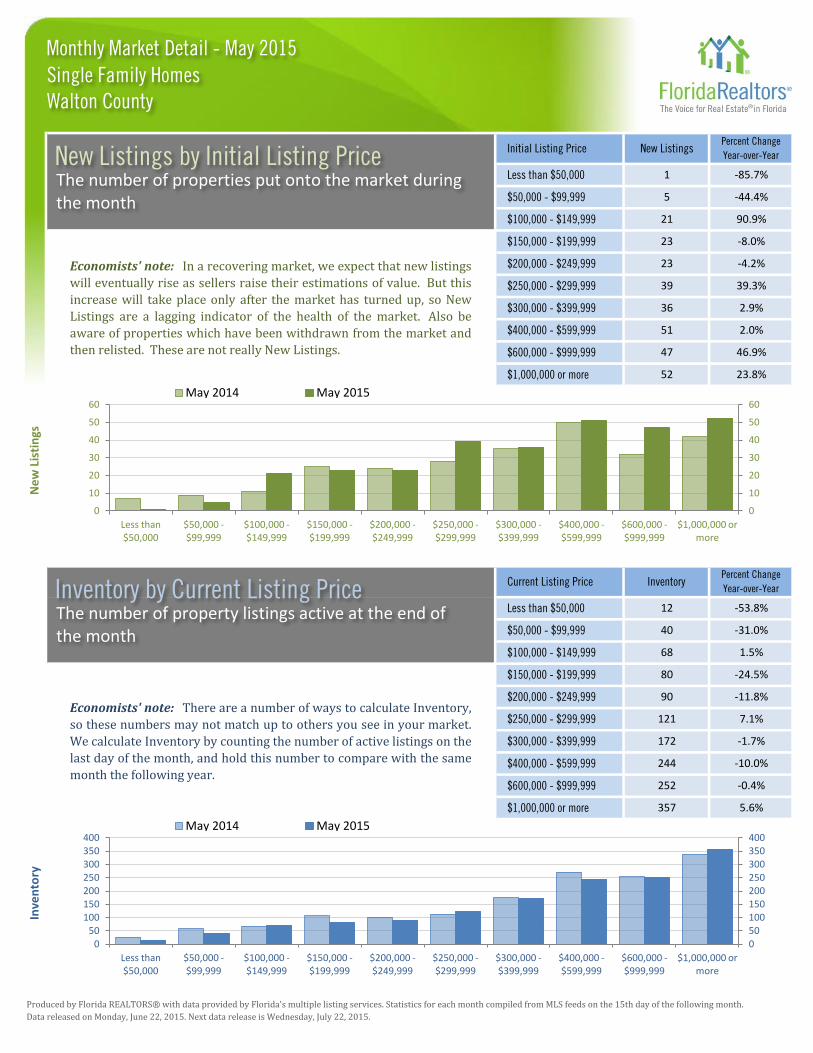
$600,000 - $999,999 252 -0.4%
$1,000,000 or more 357 5.6%
Economists' note: There are a number of ways to calculate Inventory,
so these numbers may not match up to others you see in your market.
We calculate Inventory by counting the number of active listings on the
last day of the month, and hold this number to compare with the same
month the following year.
$150,000 - $199,999 80 -24.5%
$200,000 - $249,999 90 -11.8%
$250,000 - $299,999 121 7.1%
$300,000 - $399,999 172 -1.7%
$400,000 - $599,999 244 -10.0%
$50,000 - $99,999 40 -31.0%
$100,000 - $149,999 68 1.5%
Current Listing Price InventoryPercent Change
Year-over-Year
Less than $50,000 12 -53.8%
$600,000 - $999,999 47 46.9%
$1,000,000 or more 52 23.8%
Economists' note: In a recovering market, we expect that new listings
will eventually rise as sellers raise their estimations of value. But this
increase will take place only after the market has turned up, so New
Listings are a lagging indicator of the health of the market. Also be
aware of properties which have been withdrawn from the market and
then relisted. These are not really New Listings.
$150,000 - $199,999 23 -8.0%
$200,000 - $249,999 23 -4.2%
$250,000 - $299,999 39 39.3%
$300,000 - $399,999 36 2.9%
$400,000 - $599,999 51 2.0%
$50,000 - $99,999 5 -44.4%
$100,000 - $149,999 21 90.9%
Initial Listing Price New ListingsPercent Change
Year-over-Year
Less than $50,000 1 -85.7%
0
10
20
30
40
50
60
Less than $50,000
$50,000 - $99,999
$100,000 - $149,999
$150,000 - $199,999
$200,000 - $249,999
$250,000 - $299,999
$300,000 - $399,999
$400,000 - $599,999
$600,000 - $999,999
$1,000,000 or more
Ne
w L
isti
ngs
May 2014 May 2015
0 50
100 150 200 250 300 350 400
Less than $50,000
$50,000 - $99,999
$100,000 - $149,999
$150,000 - $199,999
$200,000 - $249,999
$250,000 - $299,999
$300,000 - $399,999
$400,000 - $599,999
$600,000 - $999,999
$1,000,000 or more
Inve
nto
ry
May 2014 May 2015
0 50 100 150 200 250 300 350 400
0
10
20
30
40
50
60
Monthly Market Detail - May 2015
Walton County Single Family Homes
New Listings by Initial Listing Price The number of properties put onto the market during the month
Inventory by Current Listing Price The number of property listings active at the end of the month
Closed Sales
Median Sale Price
Closed Sales
Median Sale Price
Closed Sales
Median Sale Price
A
M
J
J
A
S
O
N
D
J
F
M
A
M
J
J
Produced by Florida REALTORS® with data provided by Florida's multiple listing services. Statistics for each month compiled from MLS feeds on the 15th day of the following month.
Data released on Monday, June 22, 2015. Next data release is Wednesday, July 22, 2015.
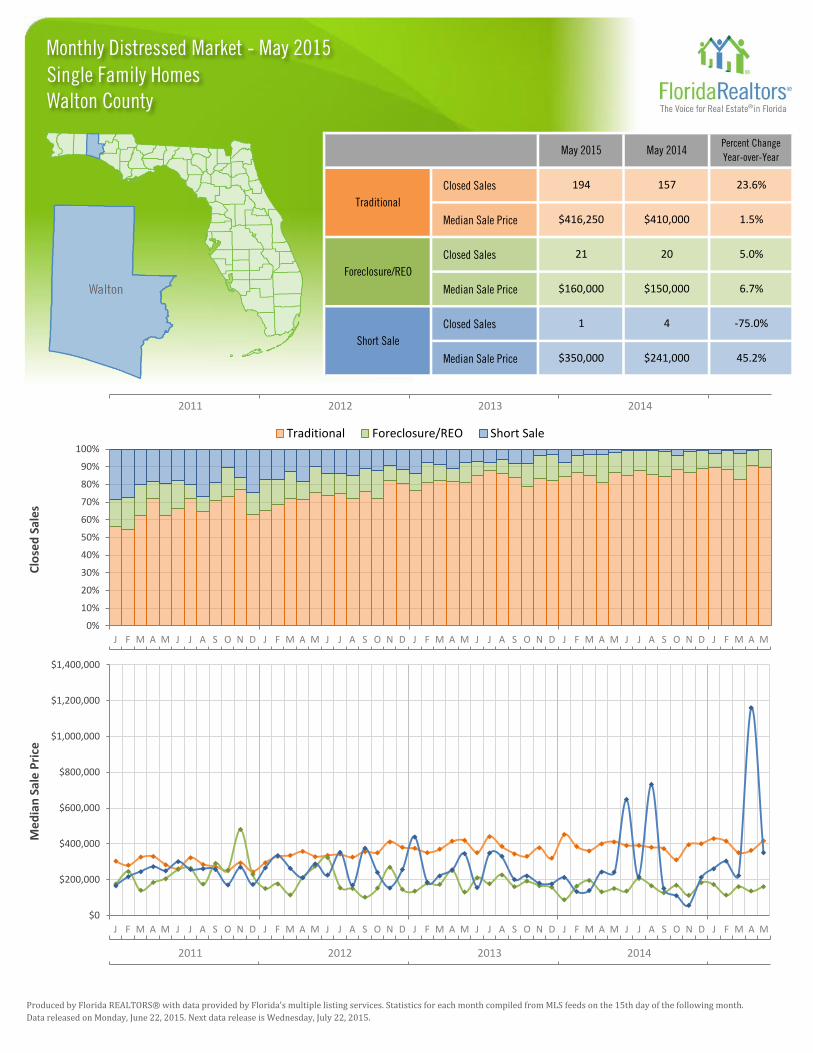
Short Sale
1 4 -75.0%
$350,000 $241,000 45.2%
Foreclosure/REO
21 20 5.0%
$160,000 $150,000 6.7%
May 2015 May 2014Percent Change
Year-over-Year
Traditional
194 157 23.6%
$416,250 $410,000 1.5%
$0
$200,000
$400,000
$600,000
$800,000
$1,000,000
$1,200,000
$1,400,000
Me
dia
n S
ale
Pri
ce
0%
10%
20%
30%
40%
50%
60%
70%
80%
90%
100%
Clo
sed
Sal
es
Traditional Foreclosure/REO Short Sale
2011 2012 2013 2014
J F M A M J J A S O N D J F M A M J J A S O N D J F M A M J J A S O N D J F M A M J J A S O N D J F M A M
J F M A M J J A S O N D J F M A M J J A S O N D J F M A M J J A S O N D J F M A M J J A S O N D J F M A M
Monthly Distressed Market - May 2015
Walton County Single Family Homes
2011 2012 2013 2014
Produced by Florida REALTORS® with data provided by Florida's multiple listing services. Statistics for each month compiled from MLS feeds on the 15th day of the following month.
Data released on Monday, June 22, 2015. Next data release is Wednesday, July 22, 2015.
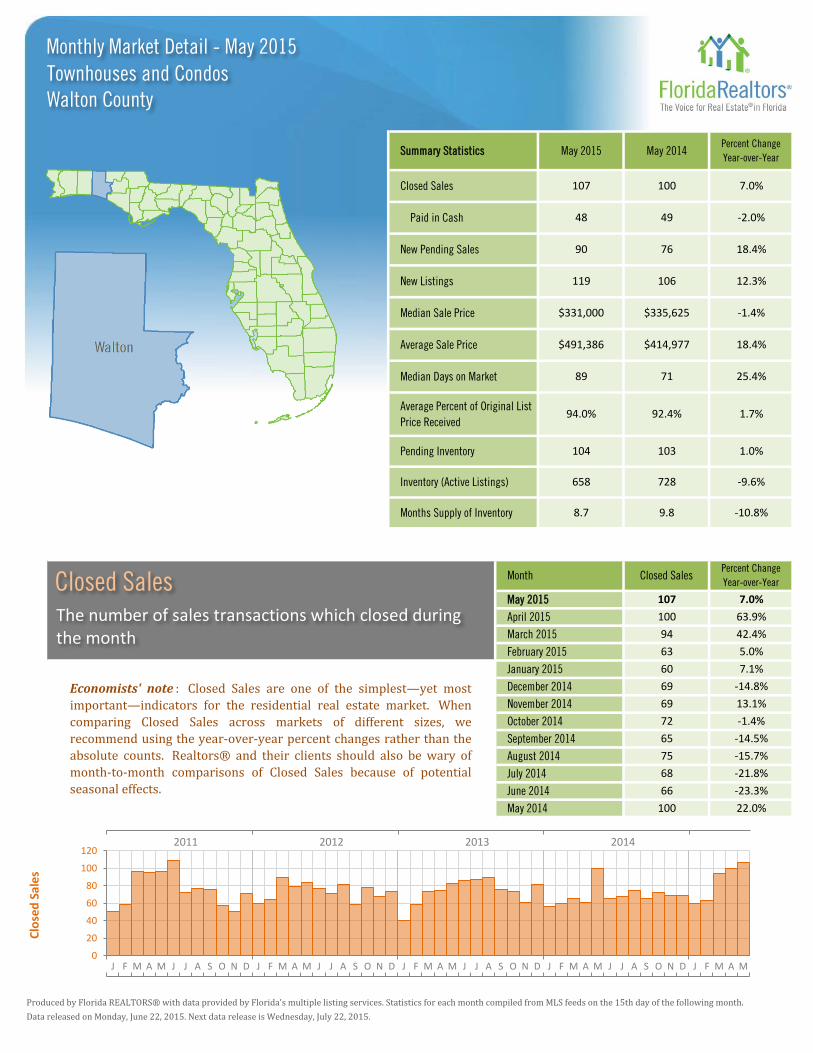
1.7%
103 1.0%
Percent Change
Year-over-Year
7.0%
728 -9.6%
Closed Sales
107
92.4%
9.8 -10.8%
May 2015
Average Sale Price
Median Days on Market
94.0%
104
Average Percent of Original List
Price Received
Pending Inventory
Inventory (Active Listings)
Month
658
Months Supply of Inventory 8.7
Summary Statistics
Closed Sales
Paid in Cash
$491,386
May 2015
90New Pending Sales
New Listings
Median Sale Price
May 2014Percent Change
Year-over-Year
48 49 -2.0%
107 100 7.0%
76 18.4%
$331,000 $335,625 -1.4%
119 106 12.3%
$414,977 18.4%
89 71 25.4%
Economists' note : Closed Sales are one of the simplest—yet most
important—indicators for the residential real estate market. When
comparing Closed Sales across markets of different sizes, we
recommend using the year-over-year percent changes rather than the
absolute counts. Realtors® and their clients should also be wary of
month-to-month comparisons of Closed Sales because of potential
seasonal effects.
January 2015 60
December 2014 69
November 2014 69
June 2014 66
May 2014 100
October 2014 72
September 2014 65
22.0%
August 2014 75
July 2014 68
-15.7%
-21.8%
-23.3%
7.1%
-14.8%
-1.4%
-14.5%
13.1%
April 2015 100 63.9%
42.4%
5.0%
March 2015 94
February 2015 63
J F M A M J J A S O N D J F M A M J J A S O N D J F M A M J J A S O N D J F M A M J J A S O N D J F M A M
Monthly Market Detail - May 2015
Walton County Townhouses and Condos
0
20
40
60
80
100
120
Clo
sed
Sal
es
2011 2012 2013 2014
Closed Sales The number of sales transactions which closed during the month
Produced by Florida REALTORS® with data provided by Florida's multiple listing services. Statistics for each month compiled from MLS feeds on the 15th day of the following month.
Data released on Monday, June 22, 2015. Next data release is Wednesday, July 22, 2015.
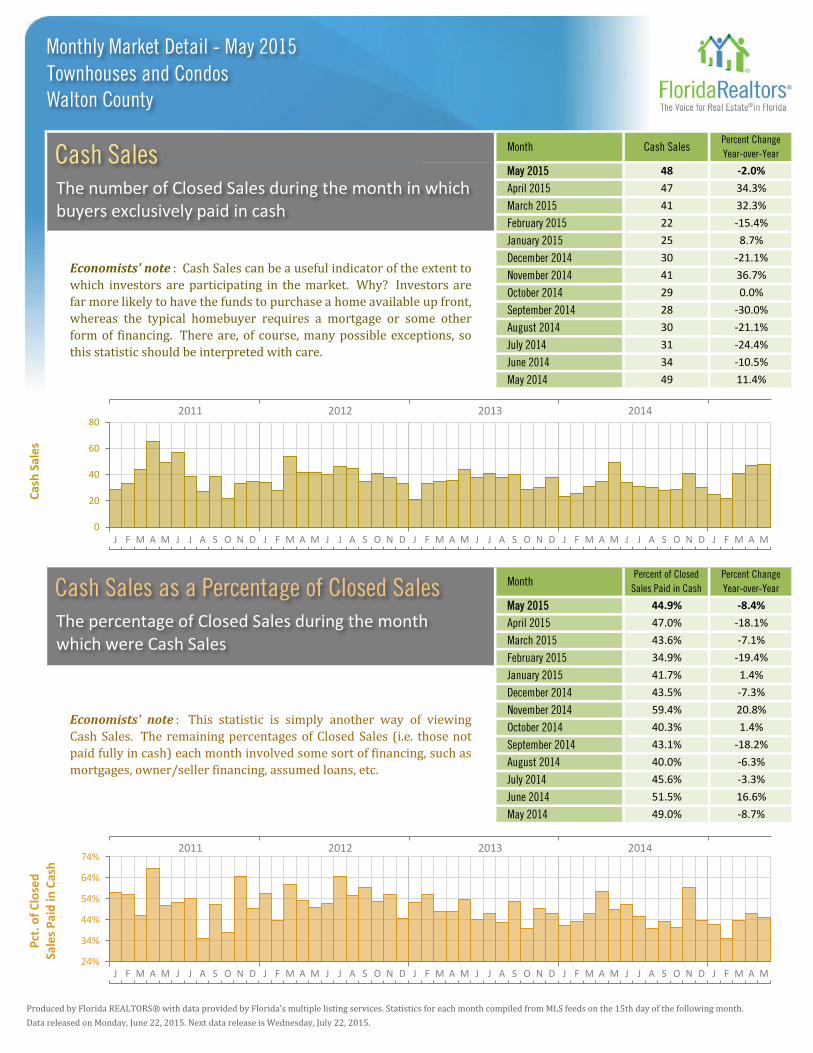
Month Cash SalesPercent Change
Year-over-Year
May 2015 48 -2.0%
April 2015 47 34.3%
March 2015 41 32.3%
February 2015 22 -15.4%
Economists' note : Cash Sales can be a useful indicator of the extent to
which investors are participating in the market. Why? Investors are
far more likely to have the funds to purchase a home available up front,
whereas the typical homebuyer requires a mortgage or some other
form of financing. There are, of course, many possible exceptions, so
this statistic should be interpreted with care.
January 2015 25 8.7%
December 2014 30 -21.1%
November 2014 41 36.7%
October 2014 29 0.0%
September 2014 28 -30.0%
August 2014 30 -21.1%
July 2014 31 -24.4%
June 2014 34 -10.5%
May 2014 49 11.4%
MonthPercent of Closed
Sales Paid in Cash
Percent Change
Year-over-Year
May 2015 44.9% -8.4%
April 2015 47.0% -18.1%
March 2015 43.6% -7.1%
February 2015 34.9% -19.4%
Economists' note : This statistic is simply another way of viewing
Cash Sales. The remaining percentages of Closed Sales (i.e. those not
paid fully in cash) each month involved some sort of financing, such as
mortgages, owner/seller financing, assumed loans, etc.
January 2015 41.7% 1.4%
December 2014 43.5% -7.3%
November 2014 59.4% 20.8%
October 2014 40.3% 1.4%
September 2014 43.1% -18.2%
August 2014 40.0% -6.3%
July 2014 45.6% -3.3%
June 2014 51.5% 16.6%
May 2014 49.0% -8.7%
24%
34%
44%
54%
64%
74%
Pct
. of
Clo
sed
Sa
les
Pai
d in
Cas
h
J F M A M J J A S O N D J F M A M J J A S O N D J F M A M J J A S O N D J F M A M J J A S O N D J F M A M
0
20
40
60
80
Cas
h S
ale
s
J F M A M J J A S O N D J F M A M J J A S O N D J F M A M J J A S O N D J F M A M J J A S O N D J F M A M
Monthly Market Detail - May 2015
2011 2012 2013 2014
Walton County Townhouses and Condos
Cash Sales The number of Closed Sales during the month in which buyers exclusively paid in cash
2011 2012 2013 2014
Cash Sales as a Percentage of Closed Sales The percentage of Closed Sales during the month which were Cash Sales
Produced by Florida REALTORS® with data provided by Florida's multiple listing services. Statistics for each month compiled from MLS feeds on the 15th day of the following month.
Data released on Monday, June 22, 2015. Next data release is Wednesday, July 22, 2015.
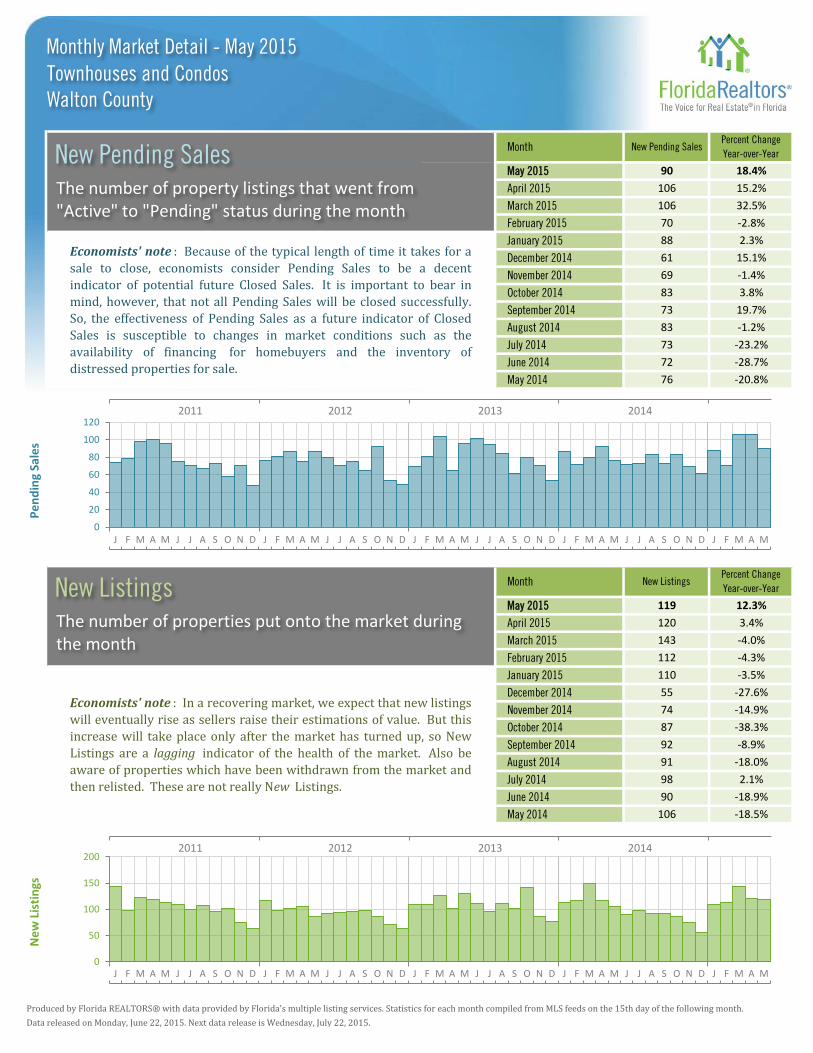
Month
MonthPercent Change
Year-over-YearNew Listings
3.4%120April 2015
12.3%119May 2015
-28.7%
-20.8%
18.4%
15.2%
32.5%
-2.8%
-4.3%112February 2015
-4.0%143March 2015
-18.5%106May 2014
-18.9%90June 2014
2.1%98July 2014
-18.0%91August 2014
-8.9%92
83
73
72
76
-1.2%
-23.2%
-38.3%87
-14.9%74
-27.6%55
-3.5%110
2.3%
15.1%
-1.4%
3.8%
19.7%
70
Percent Change
Year-over-YearNew Pending Sales
90
106
106
88
61
69
83
73
May 2015
April 2015
March 2015
February 2015
January 2015Economists' note : Because of the typical length of time it takes for a
sale to close, economists consider Pending Sales to be a decent
indicator of potential future Closed Sales. It is important to bear in
mind, however, that not all Pending Sales will be closed successfully.
So, the effectiveness of Pending Sales as a future indicator of Closed
Sales is susceptible to changes in market conditions such as the
availability of financing for homebuyers and the inventory of
distressed properties for sale.
Economists' note : In a recovering market, we expect that new listings
will eventually rise as sellers raise their estimations of value. But this
increase will take place only after the market has turned up, so New
Listings are a lagging indicator of the health of the market. Also be
aware of properties which have been withdrawn from the market and
then relisted. These are not really New Listings.
July 2014
June 2014
May 2014
December 2014
November 2014
October 2014
September 2014
August 2014
September 2014
October 2014
November 2014
December 2014
January 2015
J F M A M J J A S O N D J F M A M J J A S O N D J F M A M J J A S O N D J F M A M J J A S O N D J F M A M
J F M A M J J A S O N D J F M A M J J A S O N D J F M A M J J A S O N D J F M A M J J A S O N D J F M A M
0
50
100
150
200
Ne
w L
isti
ngs
0
20
40
60
80
100
120
Pe
nd
ing
Sale
s Monthly Market Detail - May 2015
2011 2012 2013 2014
Walton County Townhouses and Condos
New Pending Sales The number of property listings that went from "Active" to "Pending" status during the month
2011 2012 2013 2014
New Listings The number of properties put onto the market during the month

Produced by Florida REALTORS® with data provided by Florida's multiple listing services. Statistics for each month compiled from MLS feeds on the 15th day of the following month.
Data released on Monday, June 22, 2015. Next data release is Wednesday, July 22, 2015.
April 2015 $347,000 5.2%
Median Sale PricePercent Change
Year-over-Year
May 2015 $331,000 -1.4%
Month
March 2015 $316,000 -11.6%
February 2015 $322,000 16.2%
Economists' note : Median Sale Price is our preferred summary
statistic for price activity because, unlike Average Sale Price, Median
Sale Price is not sensitive to high sale prices for small numbers of
homes that may not be characteristic of the market area.
January 2015 $256,000 -2.5%
December 2014 $300,000 -3.2%
November 2014 $285,000 4.6%
October 2014 $253,000 -15.7%
September 2014 $290,000 -9.4%
August 2014 $300,000 11.1%
July 2014 $289,250 0.1%
April 2015 $391,302 -11.1%
June 2014 $282,500 20.9%
May 2014 $335,625 30.2%
Average Sale PricePercent Change
Year-over-Year
May 2015 $491,386 18.4%
Month
March 2015 $396,277 -22.5%
February 2015 $522,407 46.1%
Economists' note : As noted above, we prefer Median Sale Price over
Average Sale Price as a summary statistic for home prices. However,
Average Sale Price does have its uses—particularly when it is analyzed
alongside the Median Sale Price. For one, the relative difference
between the two statistics can provide some insight into the market for
higher-end homes in an area.
January 2015 $351,195 2.9%
December 2014 $367,120 -2.9%
November 2014 $456,821 32.3%
October 2014 $328,970 -23.0%
September 2014 $419,245 -2.9%
August 2014 $381,963 4.4%
July 2014 $390,146 7.0%
June 2014 $432,575 26.8%
May 2014 $414,977 28.3%
$200K
$300K
$400K
$500K
$600K
Ave
rage
Sal
e
Pri
ce
J F M A M J J A S O N D J F M A M J J A S O N D J F M A M J J A S O N D J F M A M J J A S O N D J F M A M
$170K
$220K
$270K
$320K
$370K
Me
dia
n S
ale
Pri
ce
J F M A M J J A S O N D J F M A M J J A S O N D J F M A M J J A S O N D J F M A M J J A S O N D J F M A M
Monthly Market Detail - May 2015
2011 2012 2013 2014
Walton County Townhouses and Condos
Median Sale Price The median sale price reported for the month (i.e. 50% of sales were above and 50% of sales were below)
2011 2012 2013 2014
Average Sale Price The average sale price reported for the month (i.e. total sales in dollars divided by the number of sales)
Produced by Florida REALTORS® with data provided by Florida's multiple listing services. Statistics for each month compiled from MLS feeds on the 15th day of the following month.
Data released on Monday, June 22, 2015. Next data release is Wednesday, July 22, 2015.
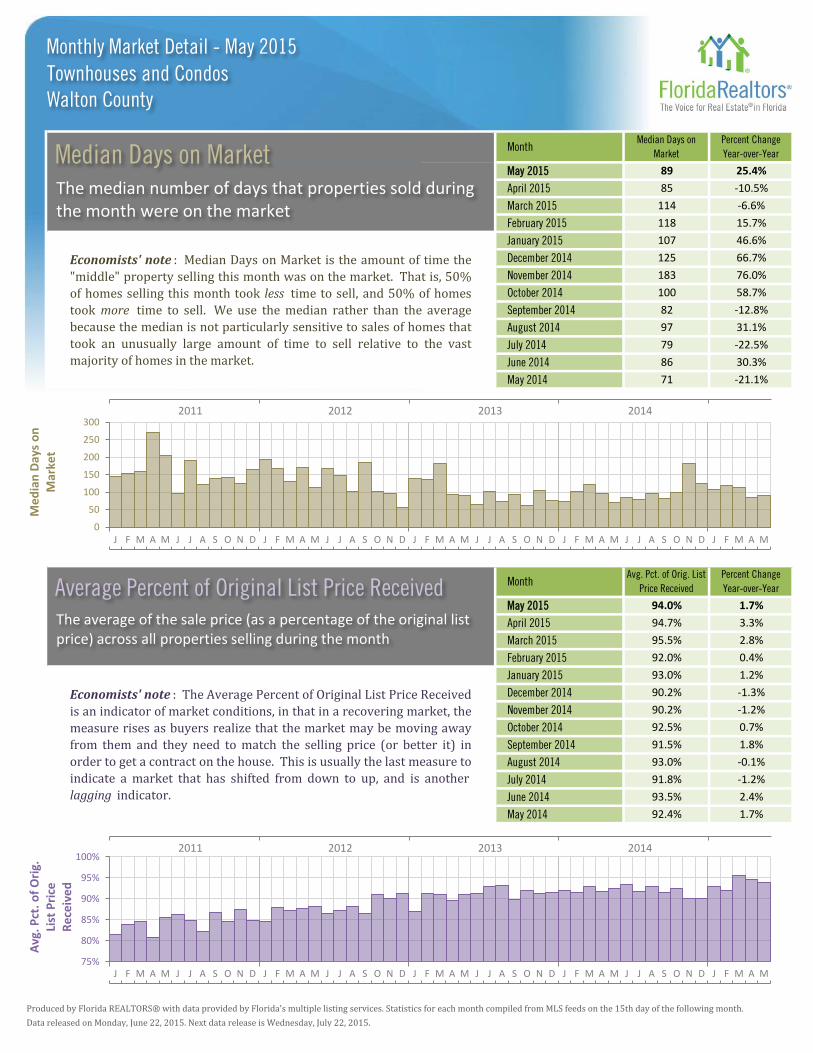
April 2015 85 -10.5%
Median Days on
Market
Percent Change
Year-over-Year
May 2015 89 25.4%
Month
March 2015 114 -6.6%
February 2015 118 15.7%
Economists' note : Median Days on Market is the amount of time the
"middle" property selling this month was on the market. That is, 50%
of homes selling this month took less time to sell, and 50% of homes
took more time to sell. We use the median rather than the average
because the median is not particularly sensitive to sales of homes that
took an unusually large amount of time to sell relative to the vast
majority of homes in the market.
January 2015 107 46.6%
December 2014 125 66.7%
November 2014 183 76.0%
October 2014 100 58.7%
September 2014 82 -12.8%
August 2014 97 31.1%
July 2014 79 -22.5%
April 2015 94.7% 3.3%
June 2014 86 30.3%
May 2014 71 -21.1%
Avg. Pct. of Orig. List
Price Received
Percent Change
Year-over-Year
May 2015 94.0% 1.7%
Month
March 2015 95.5% 2.8%
February 2015 92.0% 0.4%
Economists' note : The Average Percent of Original List Price Received
is an indicator of market conditions, in that in a recovering market, the
measure rises as buyers realize that the market may be moving away
from them and they need to match the selling price (or better it) in
order to get a contract on the house. This is usually the last measure to
indicate a market that has shifted from down to up, and is another
lagging indicator.
January 2015 93.0% 1.2%
December 2014 90.2% -1.3%
November 2014 90.2% -1.2%
October 2014 92.5% 0.7%
September 2014 91.5% 1.8%
August 2014 93.0% -0.1%
July 2014 91.8% -1.2%
June 2014 93.5% 2.4%
May 2014 92.4% 1.7%
75%
80%
85%
90%
95%
100%
Avg
. Pct
. o
f O
rig.
Li
st P
rice
R
ece
ive
d
J F M A M J J A S O N D J F M A M J J A S O N D J F M A M J J A S O N D J F M A M J J A S O N D J F M A M
0
50
100
150
200
250
300
Me
dia
n D
ays
on
M
arke
t
J F M A M J J A S O N D J F M A M J J A S O N D J F M A M J J A S O N D J F M A M J J A S O N D J F M A M
Monthly Market Detail - May 2015
2011 2012 2013 2014
Walton County Townhouses and Condos
Median Days on Market The median number of days that properties sold during the month were on the market
2011 2012 2013 2014
Average Percent of Original List Price Received The average of the sale price (as a percentage of the original list price) across all properties selling during the month
Produced by Florida REALTORS® with data provided by Florida's multiple listing services. Statistics for each month compiled from MLS feeds on the 15th day of the following month.
Data released on Monday, June 22, 2015. Next data release is Wednesday, July 22, 2015.
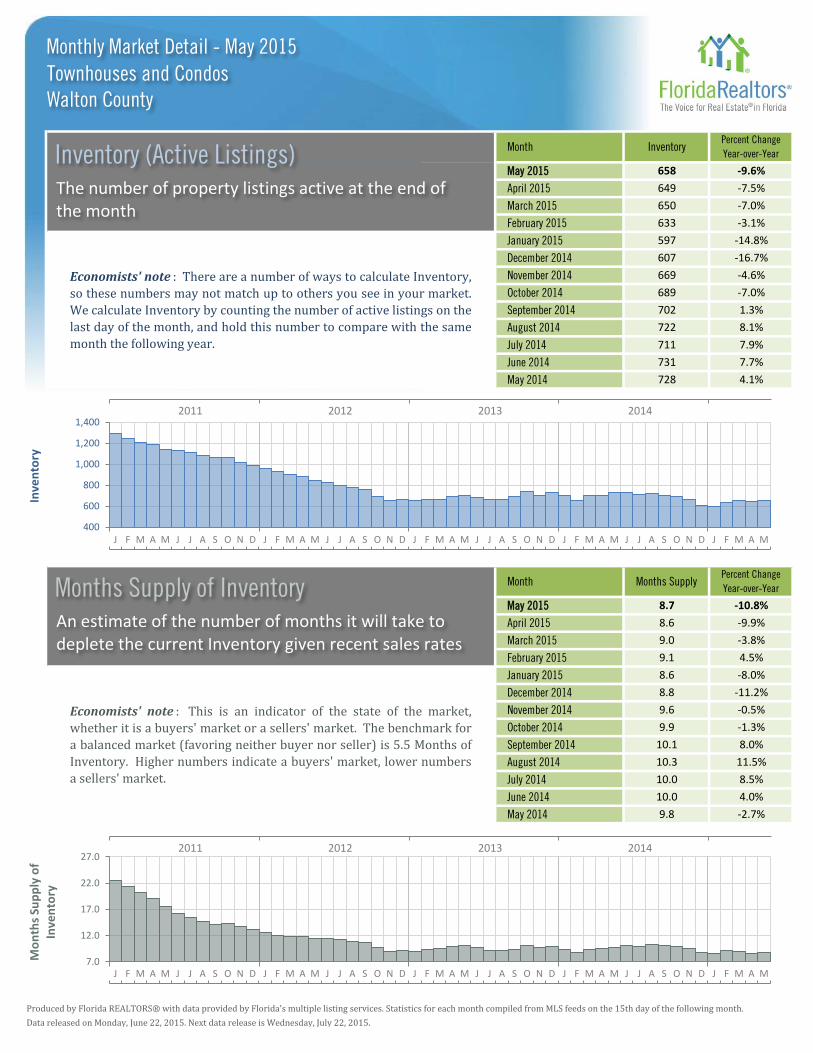
April 2015 649 -7.5%
InventoryPercent Change
Year-over-Year
May 2015 658 -9.6%
Month
March 2015 650 -7.0%
February 2015 633 -3.1%
Economists' note : There are a number of ways to calculate Inventory,
so these numbers may not match up to others you see in your market.
We calculate Inventory by counting the number of active listings on the
last day of the month, and hold this number to compare with the same
month the following year.
January 2015 597 -14.8%
December 2014 607 -16.7%
November 2014 669 -4.6%
October 2014 689 -7.0%
September 2014 702 1.3%
August 2014 722 8.1%
July 2014 711 7.9%
April 2015 8.6 -9.9%
June 2014 731 7.7%
May 2014 728 4.1%
Months SupplyPercent Change
Year-over-Year
May 2015 8.7 -10.8%
Month
March 2015 9.0 -3.8%
February 2015 9.1 4.5%
Economists' note : This is an indicator of the state of the market,
whether it is a buyers' market or a sellers' market. The benchmark for
a balanced market (favoring neither buyer nor seller) is 5.5 Months of
Inventory. Higher numbers indicate a buyers' market, lower numbers
a sellers' market.
January 2015 8.6 -8.0%
December 2014 8.8 -11.2%
November 2014 9.6 -0.5%
October 2014 9.9 -1.3%
September 2014 10.1 8.0%
August 2014 10.3 11.5%
July 2014 10.0 8.5%
June 2014 10.0 4.0%
May 2014 9.8 -2.7%
400
600
800
1,000
1,200
1,400
Inve
nto
ry
J F M A M J J A S O N D J F M A M J J A S O N D J F M A M J J A S O N D J F M A M J J A S O N D J F M A M
Monthly Market Detail - May 2015
2011 2012 2013 2014
Walton County Townhouses and Condos
Inventory (Active Listings) The number of property listings active at the end of the month
7.0
12.0
17.0
22.0
27.0
Mo
nth
s Su
pp
ly o
f In
ven
tory
2011 2012 2013 2014
Months Supply of Inventory An estimate of the number of months it will take to deplete the current Inventory given recent sales rates
J F M A M J J A S O N D J F M A M J J A S O N D J F M A M J J A S O N D J F M A M J J A S O N D J F M A M
Produced by Florida REALTORS® with data provided by Florida's multiple listing services. Statistics for each month compiled from MLS feeds on the 15th day of the following month.
Data released on Monday, June 22, 2015. Next data release is Wednesday, July 22, 2015.
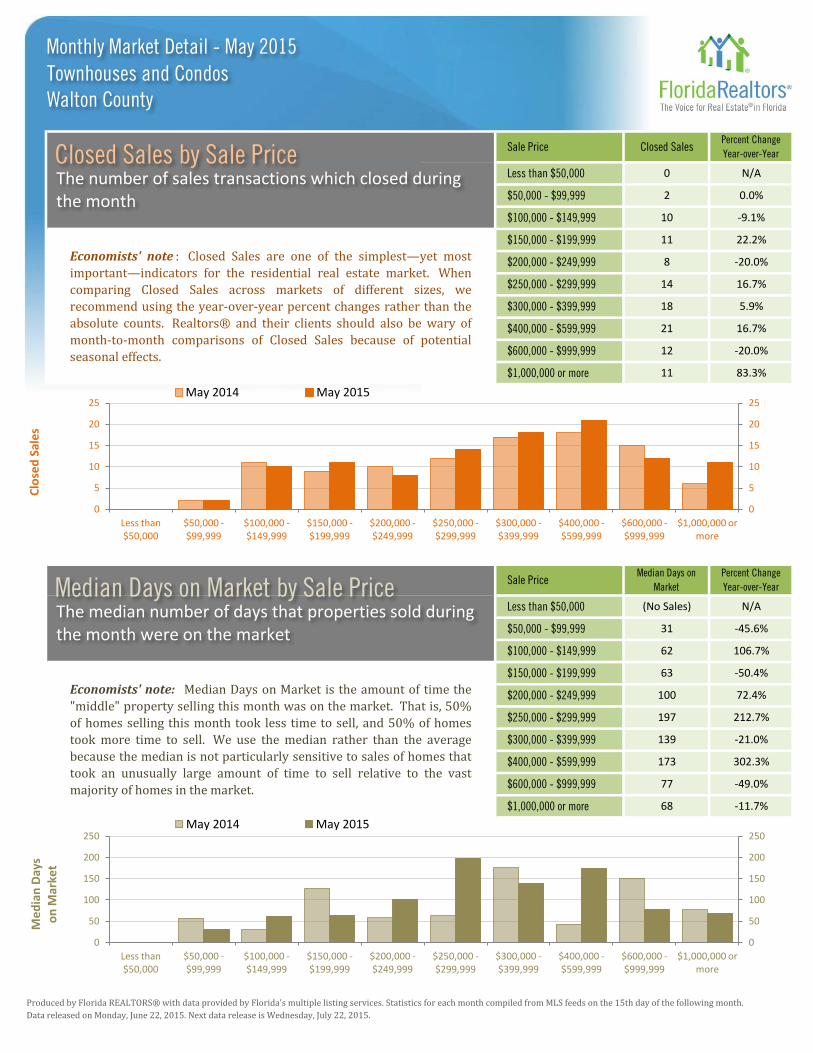
$600,000 - $999,999 77 -49.0%
$1,000,000 or more 68 -11.7%
Economists' note: Median Days on Market is the amount of time the
"middle" property selling this month was on the market. That is, 50%
of homes selling this month took less time to sell, and 50% of homes
took more time to sell. We use the median rather than the average
because the median is not particularly sensitive to sales of homes that
took an unusually large amount of time to sell relative to the vast
majority of homes in the market.
$150,000 - $199,999 63 -50.4%
$200,000 - $249,999 100 72.4%
$250,000 - $299,999
$400,000 - $599,999 173 302.3%
197 212.7%
$300,000 - $399,999 139 -21.0%
Economists' note : Closed Sales are one of the simplest—yet most
important—indicators for the residential real estate market. When
comparing Closed Sales across markets of different sizes, we
recommend using the year-over-year percent changes rather than the
absolute counts. Realtors® and their clients should also be wary of
month-to-month comparisons of Closed Sales because of potential
seasonal effects.
Sale PriceMedian Days on
Market
Percent Change
Year-over-Year
Less than $50,000 (No Sales) N/A
$1,000,000 or more 11 83.3%
$250,000 - $299,999 14 16.7%
$300,000 - $399,999 18 5.9%
$50,000 - $99,999 31 -45.6%
$100,000 - $149,999
$400,000 - $599,999 21 16.7%
$600,000 - $999,999 12 -20.0%
62 106.7%
$150,000 - $199,999 11 22.2%
$200,000 - $249,999 8 -20.0%
$100,000 - $149,999 10 -9.1%
Sale Price Closed SalesPercent Change
Year-over-Year
Less than $50,000 0 N/A
$50,000 - $99,999 2 0.0%
0
5
10
15
20
25
Less than $50,000
$50,000 - $99,999
$100,000 - $149,999
$150,000 - $199,999
$200,000 - $249,999
$250,000 - $299,999
$300,000 - $399,999
$400,000 - $599,999
$600,000 - $999,999
$1,000,000 or more
Clo
sed
Sal
es
May 2014 May 2015
0
5
10
15
20
25
0
50
100
150
200
250
Less than $50,000
$50,000 - $99,999
$100,000 - $149,999
$150,000 - $199,999
$200,000 - $249,999
$250,000 - $299,999
$300,000 - $399,999
$400,000 - $599,999
$600,000 - $999,999
$1,000,000 or more
Me
dia
n D
ays
on
Mar
ket
May 2014 May 2015
0
50
100
150
200
250
Monthly Market Detail - May 2015
Walton County Townhouses and Condos
Closed Sales by Sale Price The number of sales transactions which closed during the month
Median Days on Market by Sale Price The median number of days that properties sold during the month were on the market
Produced by Florida REALTORS® with data provided by Florida's multiple listing services. Statistics for each month compiled from MLS feeds on the 15th day of the following month.
Data released on Monday, June 22, 2015. Next data release is Wednesday, July 22, 2015.
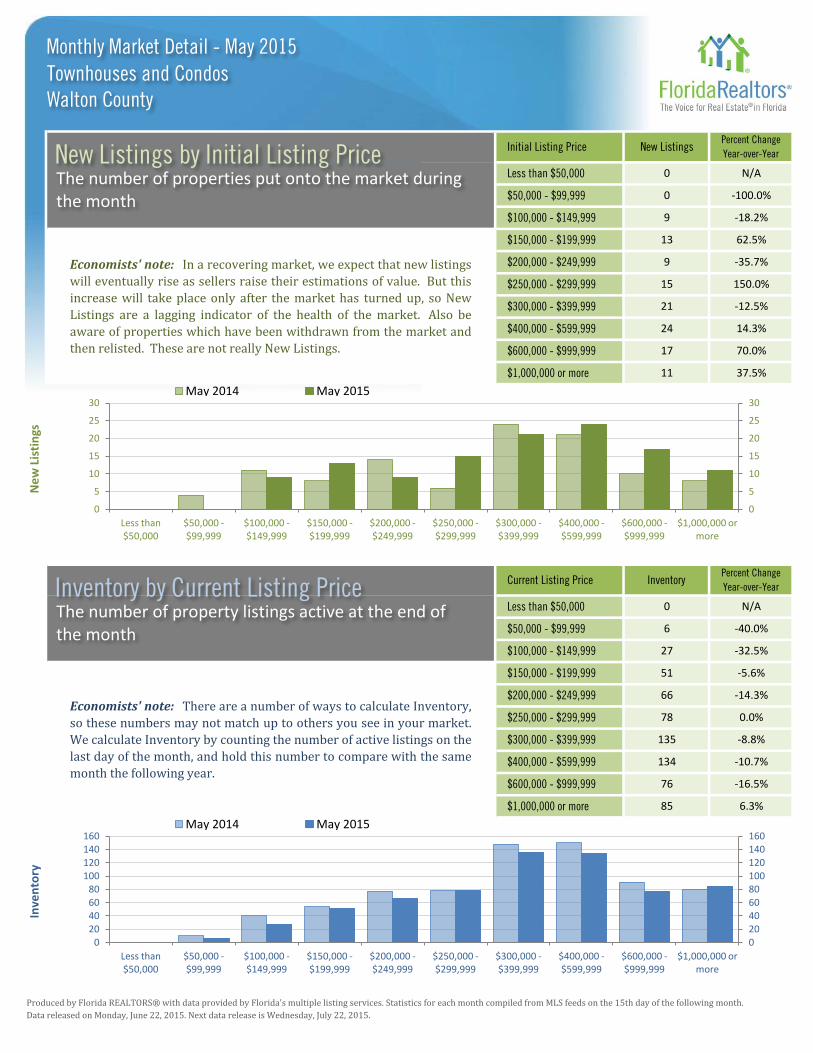
$600,000 - $999,999 76 -16.5%
$1,000,000 or more 85 6.3%
Economists' note: There are a number of ways to calculate Inventory,
so these numbers may not match up to others you see in your market.
We calculate Inventory by counting the number of active listings on the
last day of the month, and hold this number to compare with the same
month the following year.
$150,000 - $199,999 51 -5.6%
$200,000 - $249,999 66 -14.3%
$250,000 - $299,999 78 0.0%
$300,000 - $399,999 135 -8.8%
$400,000 - $599,999 134 -10.7%
$50,000 - $99,999 6 -40.0%
$100,000 - $149,999 27 -32.5%
Current Listing Price InventoryPercent Change
Year-over-Year
Less than $50,000 0 N/A
$600,000 - $999,999 17 70.0%
$1,000,000 or more 11 37.5%
Economists' note: In a recovering market, we expect that new listings
will eventually rise as sellers raise their estimations of value. But this
increase will take place only after the market has turned up, so New
Listings are a lagging indicator of the health of the market. Also be
aware of properties which have been withdrawn from the market and
then relisted. These are not really New Listings.
$150,000 - $199,999 13 62.5%
$200,000 - $249,999 9 -35.7%
$250,000 - $299,999 15 150.0%
$300,000 - $399,999 21 -12.5%
$400,000 - $599,999 24 14.3%
$50,000 - $99,999 0 -100.0%
$100,000 - $149,999 9 -18.2%
Initial Listing Price New ListingsPercent Change
Year-over-Year
Less than $50,000 0 N/A
0
5
10
15
20
25
30
Less than $50,000
$50,000 - $99,999
$100,000 - $149,999
$150,000 - $199,999
$200,000 - $249,999
$250,000 - $299,999
$300,000 - $399,999
$400,000 - $599,999
$600,000 - $999,999
$1,000,000 or more
Ne
w L
isti
ngs
May 2014 May 2015
0 20 40 60 80
100 120 140 160
Less than $50,000
$50,000 - $99,999
$100,000 - $149,999
$150,000 - $199,999
$200,000 - $249,999
$250,000 - $299,999
$300,000 - $399,999
$400,000 - $599,999
$600,000 - $999,999
$1,000,000 or more
Inve
nto
ry
May 2014 May 2015
0 20 40 60 80 100 120 140 160
0
5
10
15
20
25
30
Monthly Market Detail - May 2015
Walton County Townhouses and Condos
New Listings by Initial Listing Price The number of properties put onto the market during the month
Inventory by Current Listing Price The number of property listings active at the end of the month
Closed Sales
Median Sale Price
Closed Sales
Median Sale Price
Closed Sales
Median Sale Price
A
M
J
J
A
S
O
N
D
J
F
M
A
M
J
J
Produced by Florida REALTORS® with data provided by Florida's multiple listing services. Statistics for each month compiled from MLS feeds on the 15th day of the following month.
Data released on Monday, June 22, 2015. Next data release is Wednesday, July 22, 2015.
Short Sale
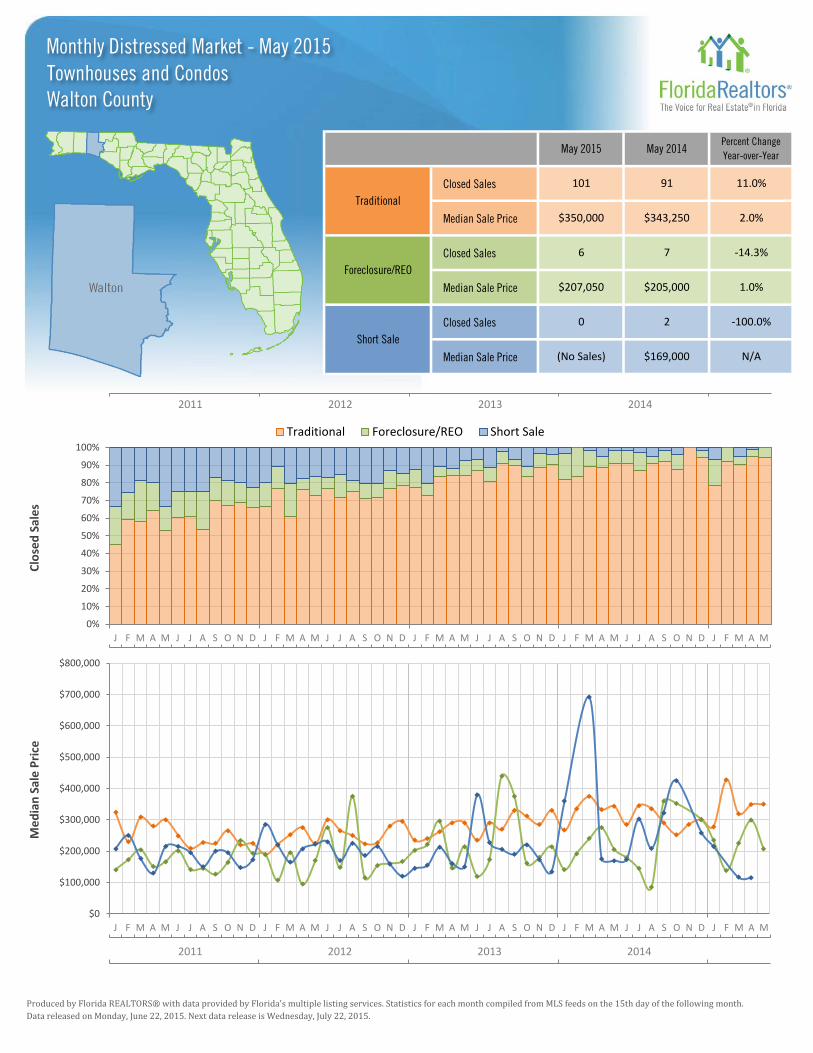
0 2 -100.0%
(No Sales) $169,000 N/A
Foreclosure/REO
6 7 -14.3%
$207,050 $205,000 1.0%
May 2015 May 2014Percent Change
Year-over-Year
Traditional
101 91 11.0%
$350,000 $343,250 2.0%
$0
$100,000
$200,000
$300,000
$400,000
$500,000
$600,000
$700,000
$800,000
Me
dia
n S
ale
Pri
ce
0%
10%
20%
30%
40%
50%
60%
70%
80%
90%
100%
Clo
sed
Sal
es
Traditional Foreclosure/REO Short Sale
2011 2012 2013 2014
J F M A M J J A S O N D J F M A M J J A S O N D J F M A M J J A S O N D J F M A M J J A S O N D J F M A M
J F M A M J J A S O N D J F M A M J J A S O N D J F M A M J J A S O N D J F M A M J J A S O N D J F M A M
Monthly Distressed Market - May 2015
Walton County Townhouses and Condos
2011 2012 2013 2014


![JOHN R. WALTON [S.B. #130666] LAW OFFICES OF JOHN … · JOHN R. WALTON [S.B. #130666] ... Hilao v. Estate of Marcos, 103 F.3d 767 ... Trajano v. Marcos (In re: Estate of Ferdinand](https://static.fdocuments.net/doc/165x107/5b570c817f8b9a022e8d475b/john-r-walton-sb-130666-law-offices-of-john-john-r-walton-sb-130666.jpg)