South Dakota Agricultural Land Market Trendsageconsearch.umn.edu/bitstream/9281/1/ci070272.pdfSouth...
46
South Dakota Agricultural Land Market Trends 1991–2007 The 2007 SDSU South Dakota Farm Real Estate Survey South Dakota State University Agricultural Experiment Station U.S. Department of Agriculture C272
-
Upload
nguyenduong -
Category
Documents
-
view
216 -
download
0
Transcript of South Dakota Agricultural Land Market Trendsageconsearch.umn.edu/bitstream/9281/1/ci070272.pdfSouth...
South Dakota
Agricultural Land Market Trends
1991–2007The 2007 SDSU South Dakota Farm Real Estate Survey
South Dakota State UniversityAgricultural Experiment StationU.S. Department of Agriculture
C272


South Dakota
Agricultural Land Market Trends
1991–2007The 2007 SDSU South Dakota Farm Real Estate Survey
Dr. Larry Janssen, Dr. Burton Pflueger, and Tyler Ahrendt1
South Dakota State UniversityAgricultural Experiment StationU.S. Department of Agriculture
http://agbiopubs.sdstate.edu/articles/C272.pdf
C272

iv
CONTENTSSummary . . . . . . . . . . . . . . . . . . . . . . . . . . . . . . . . . . . . . . . . . . . . . . . . . . . . . 1
Introduction . . . . . . . . . . . . . . . . . . . . . . . . . . . . . . . . . . . . . . . . . . . . . . . . . . . 3
Changing economic conditions in South Dakota agriculture . . . . . . . . . . . . . . . . . . . . . . . . . 4
South Dakota agricultural land values, 2007 . . . . . . . . . . . . . . . . . . . . . . . . . . . . . . . . . . 5
Procedures to estimate and report land values . . . . . . . . . . . . . . . . . . . . . . . . . . . . 5
All-agricultural land value estimates . . . . . . . . . . . . . . . . . . . . . . . . . . . . . . . . . 6
Land values and values changes by type of land and region . . . . . . . . . . . . . . . . . . . . . . . . . . 8
Cropland values . . . . . . . . . . . . . . . . . . . . . . . . . . . . . . . . . . . . . . . . . . . . . 9
Hayland values . . . . . . . . . . . . . . . . . . . . . . . . . . . . . . . . . . . . . . . . . . . . . 9
Pasture and rangeland values . . . . . . . . . . . . . . . . . . . . . . . . . . . . . . . . . . . . 10
Irrigated land values . . . . . . . . . . . . . . . . . . . . . . . . . . . . . . . . . . . . . . . . . 10
Variation in land values by land productivity and county clusters . . . . . . . . . . . . . . . . . . . . . . 11
Major reasons for purchase and sale of farmland . . . . . . . . . . . . . . . . . . . . . . . . . . . . . . 15
Cash rental rates of South Dakota’s agricultural land . . . . . . . . . . . . . . . . . . . . . . . . . . . . 16
2007 cash rental rates: cropland, hayland, and irrigated land . . . . . . . . . . . . . . . . . . . 17
2007 cash rental rates: rangeland and pasture . . . . . . . . . . . . . . . . . . . . . . . . . . . 22
New publications on agricultural land rental arrangements in South Dakota . . . . . . . . . . 22
Rates of return to South Dakota’s agricultural land . . . . . . . . . . . . . . . . . . . . . . . . . . . . . 23
Longer-term perspective on farmland market changes, 1991 – 2007 . . . . . . . . . . . . . . . . . . . . 24
Respondents’ assessment of factors influencing farmland markets in South Dakota . . . . . . . . . . . 26
Agricultural land market expectations: recent past and prospective . . . . . . . . . . . . . . . . . . . . 27
List of references . . . . . . . . . . . . . . . . . . . . . . . . . . . . . . . . . . . . . . . . . . . . . . . . 28
Appendix I . Survey methods and respondent characteristics . . . . . . . . . . . . . . . . . . . . . . . . 29
Appendix II . Historical data on agricultural land values and cash rental rates
by land use by region, South Dakota, 1991 – 2007 . . . . . . . . . . . . . . . . . . . . . . . . . . . . . . 31

v
FIGURES1 . Agricultural land use patterns in South Dakota, statewide and regional . . . . . . . . . . . . . . . . . . 5
2 . Average value of South Dakota agricultural land, February 1, 2007, and 2006
and percent change from one year ago . . . . . . . . . . . . . . . . . . . . . . . . . . . . . . . . . . . 6
3 . Average value of South Dakota cropland, irrigated land and hayland, by region,
February 2007, dollars per acre . . . . . . . . . . . . . . . . . . . . . . . . . . . . . . . . . . . . . . . . 8
4 . Average value of South Dakota rangeland and tame pasture, by region, February 2007,
dollars per acre . . . . . . . . . . . . . . . . . . . . . . . . . . . . . . . . . . . . . . . . . . . . . . . . 8
5 . Reasons for buying farmland . . . . . . . . . . . . . . . . . . . . . . . . . . . . . . . . . . . . . . . . 15
6 . Reasons for selling farmland . . . . . . . . . . . . . . . . . . . . . . . . . . . . . . . . . . . . . . . . 16
7 . Average cash rental rate of South Dakota nonirrigated cropland, hay land,
and rangeland, by region, 2007, dollars per acre . . . . . . . . . . . . . . . . . . . . . . . . . . . . . 17
8a . Gross rent-to-value ratio by land use, 1991 – 2007 . . . . . . . . . . . . . . . . . . . . . . . . . . . . 23
8b . Net rate of return by land use, 1991 – 2007 . . . . . . . . . . . . . . . . . . . . . . . . . . . . . . . 23
9 . Annual percentage change in all ag land values, 1991 – 1996, 1996 – 2001, and 2001 – 2007 . . . . . 25
10 . Positive factors in the farm real estate market . . . . . . . . . . . . . . . . . . . . . . . . . . . . . . 27
11 . Negative factors in the farm real estate market . . . . . . . . . . . . . . . . . . . . . . . . . . . . . 27

vi
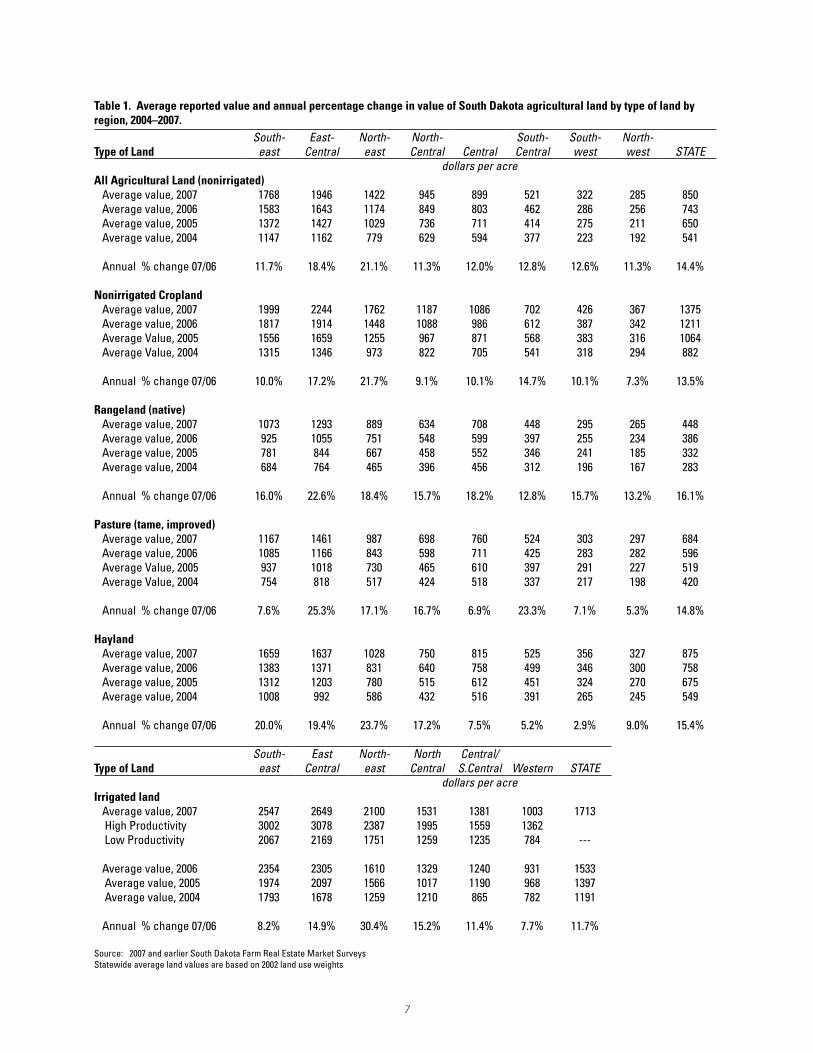
TABLES1 . Average reported value and annual percentage change in value of South Dakota agricultural land
by type of land by region, 2004 – 2007 . . . . . . . . . . . . . . . . . . . . . . . . . . . . . . . . . . . . 7
2 . Average reported value per acre of agricultural land by South Dakota region, county clusters,
type of land, and land productivity, February 2007, 2006, 2005, and 2004 . . . . . . . . . . . . . . . 12
3 . Reported cash rental rates of South Dakota agricultural land by type of land by region,
2004 – 2007 . . . . . . . . . . . . . . . . . . . . . . . . . . . . . . . . . . . . . . . . . . . . . . . . . 18
4 . Reported cash rental rates of South Dakota agricultural land by region and county clusters,
2007, 2006, 2005, and 2004 rates . . . . . . . . . . . . . . . . . . . . . . . . . . . . . . . . . . . . . . 19
5 . Estimated rates of return to South Dakota agricultural land by type of land and by region,
1991 – 2006 . . . . . . . . . . . . . . . . . . . . . . . . . . . . . . . . . . . . . . . . . . . . . . . . . 24
AppENdIx TABLES
1 . Selected characteristics of respondents, 2007 . . . . . . . . . . . . . . . . . . . . . . . . . . . . . . . 30
2 . Average reported value and annual percentage change in value of South Dakota agricultural land
by type of land by region, 1991 – 2007 . . . . . . . . . . . . . . . . . . . . . . . . . . . . . . . . . . . 31
3 . Reported cash rental rates of South Dakota agricultural land by type of land by region,
1991 – 2007 . . . . . . . . . . . . . . . . . . . . . . . . . . . . . . . . . . . . . . . . . . . . . . . . . 34

vii
FOREWORdAgricultural land values and cash rental rates in South Dakota, by region and by state, are the primary topics of this report . The target audiences for this report are farmers and ranchers, landowners, agricultural professionals (lenders, rural appraisers, professional farm managers), and policy makers interested in agricultural land market trends . This report contains the results of the 2007 SDSU South Dakota Farm Real Estate Market Survey, the 17th annual SDSU survey developed to estimate agricultural land values and cash rental rates by land use in different regions of South Dakota .
We wish to thank our reviewers for their constructive comments on an earlier draft of this report . The reviewers are Dr . Richard Shane, Economics Department head, and Dr . Gerald Warmann, Extension economics specialist .
Mr . Tyler Ahrendt, graduate student in economics and co-author, also handled many of the daily tasks during the survey period and updating of tables and charts . We also wish to thank Janet Wilson for developing and maintaining the mailing lists and Penny Stover for assistance with various survey and publication related tasks . Janet Wilson and Penny Stover are secretaries in the Economics Department .
General funding for this project is from the SDSU Agricultural Experiment Station project H - 252: Representative farm and agricultural land market analysis in South Dakota .
Finally, we wish to thank all of the 214 respondents who participated in the 2007 South Dakota Farm Real Estate Market Survey . Many have also participated in one or more past annual land market surveys . Without their responses, this report would not be possible .
The electronic version of this report is available at:http://agbiopubs.sdstate.edu/articles/C272.pdf
South Dakota State University, South Dakota counties and U .S . Department of Agriculture cooperating . South Dakota State University is an Affirmative Action/Equal Opportunity Employer and offers all benefits, services, education and employment opportunities without regard for race, color, creed, religion, national origin, ancestry, citizenship, age, gender, sexual orientation, disability, or Vietnam Era Veteran status . C272 . 600 copies printed at a cost of $2 .03 each . June 2007 .

viii

�
The 2007 SDSU Farm Real Estate Market Survey report contains information on current agricultural land values and cash rental rates by land use in different regions of South Dakota, with comparisons to values from earlier years . Key findings are highlighted below .
• The most recent annual change (2006 to 2007) in South Dakota agricultural land values of 14 .4% is almost the same as the average annual percentage increase from 2001 to 2007 . These rates of annual increase are considerably higher than the annual increases of 4% to 10% during the 1990s .
Land value increases from 2006 to 2007 are the third highest annual rate of change in the past 16 years, exceeded only by higher annual percentage rates of change from 2003 to 2005 . From 2006 to 2007, annual rates of increase for rangeland exceeded 10% in all regions of the state, while cropland values increased 10% or more in all regions except the north-central and northwest regions .
• Cash rental rates per acre for cropland, hayland, and rangeland/pasture increased statewide and in most regions from 2006 to 2007 .
Statewide average cash rental rates increased $3 .85 per acre for cropland, $1 .55 per acre for hayland, and $0 .60 per acre for rangeland . In general, cash rental rate increases were strongest in the more crop-intensive regions east of the Missouri River . Some weaknesses in cash rental rates are noted in the south-central and southwest regions .
• Statewide, cropland and rangeland values per acre have doubled since 2002 and tripled since 1996 . Cash rental rates have nearly doubled since 1993 .
Increases in agricultural land values were largely
supported by increases in cash rental rates during the 1990s but only partially supported by cash rental rate increases after 2000 . During most of the 1990s, land values increased at only slightly higher rates than cash rents . However, from 2001 to 2007 land values have generally increased at more than twice the rate of increase in cash rents . Thus, cash rates of return to farmland declined slowly during the 1990s and more rapidly from 2001 to 2007 .
• Current average rates of cash return on agricultural land are lower in 2007 than in any previous year since the survey was started .
For 2007 the average ratio of gross cash rent to current land value was 4 .4% for all agricultural land, 4 .9% for nonirrigated cropland, and 4 .0% for rangeland . Net rates of return to farmland, given current land values, averaged 3 .8% for all agricultural land, 4 .2% for nonirrigated cropland, and 3 .4% for rangeland .
• Longer-term trends in land values, cash rental rates, and cash rates of return are closely related to key economic factors including: (1) sharp declines in farm mortgage interest rates
from early 2001 to late 2004;(2) federal farm program provisions of the 1996
and 2002 farm bills, especially the level of crop subsidies and removal of planting restrictions; and
(3) general economic conditions of low inflation rates . For 1991–2007, the average annual inflation rate in the U .S . was less than 2 .5%
From 1991 to 2007, farmland values increased more rapidly than the rate of general price inflation in all regions of South Dakota . Cash rental rate increases provided underlying support for increases in land values . These two basic economic factors, along with declining mortgage
SUMMARy

�
interest rates, attracted interest in farmland purchases by investors and by farmers expanding their operations .
However, gross and net cash rates of return are approaching the lower end of historical rates of return to agricultural land in South Dakota . At current market conditions, most of expected total returns from agricultural land investment are from anticipated capital appreciation instead of current cash returns . This pattern of declining rates of cash return to land historically has occurred during the latter stages of land market price booms .
• Agricultural land values and average cash rental rates differ greatly by region and land use .
In each region per-acre values and cash rental rates are highest for irrigated land, followed in descending order by nonirrigated cropland, hayland, tame pasture, and native rangeland . For each land use, per-acre land values and cash rental rates are highest in the east-central or southeast region and lowest in the western regions of South Dakota .
The average value of nonirrigated agricultural land (as of February 2007) in South Dakota is $850 per acre . Nonirrigated agricultural land values vary from $1,946 per acre in the east-central to $285 per acre in the northwest region . Average nonirrigated cropland values vary from $2,244 in the east-central to $1,086 in the central region and $367 per acre in the northwest . Average rangeland values vary from $1,293 in the east-central to $265 per acre in the northwest .
Within each region, differences in land productivity and land use account for substantial differences in per-acre values .
In 2007 the average value of nonirrigated cropland exceeds $2,500 per acre and average cash rental rates exceed $110 per acre in two county clusters (Minnehaha-Moody and Clay-Lincoln-Turner-Union) in eastern South Dakota . These are the highest average land values and cash rental rates reported during the past 17 years of the SDSU Farm Real Estate Market Survey .
At the regional level average cash rental rates per acre for cropland in 2007 vary from $92 .30 in the southeast region to $21 .80 in the northwest region . Average rangeland and pasture rental rates vary from $44 in the southeast region to $9 .95 in the northwest region .
• Farm expansion, investment potential, and hunting/recreation continue as the major reasons for purchasing farmland, while favorable market conditions (seller’s market), retirement from farming, and settling estates are the three major reasons for selling farmland .
Strong farm profits, crop yields, higher crop prices, good livestock prices, and markets were most frequently listed as positive factors in the farmland market, followed by hunting/recreation demand and investor purchase of farmland . Drought conditions, higher input costs, and increased interest rates were most often listed as negative factors .

�
The 2007 SDSU Farm Real Estate Market Survey is the 17th annual survey of agricultural land values and cash rental rates by land use and quality in different regions of South Dakota . We report on the results of the survey and also include a discussion of factors influencing buyer/seller decisions and of positive/negative factors impacting farmland markets . Publication of survey findings is a response to numerous requests by farmland owners, renters, appraisers, lenders, potential buyers, and others for detailed information on farmland markets in South Dakota .
The 2007 estimates are based on reports from 214 respondents to the 2007 SDSU survey . Respon-dents are agricultural lenders, Farm Service Agency officials, rural appraisers, assessors, realtors, professional farm managers, and Extension agricultural educators . All are familiar with farmland market trends in their localities .
Copies of the survey were mailed in February and March 2007 and requested information on cash rental rates and agricultural land values as of February 2007 . Response rates, respondent characteristics, and estimation procedures are in Appendix I .
Results are presented in a format similar to surveys published by Janssen and Pflueger from 1991 through 2006 . Regional information on land values and cash rents by land use (crop, hay, range, pasture, and irrigated crop/hay)2 is emphasized in each of these reports . Current year findings are compared to those of earlier years .
This report contains an overview and may or may not reflect actual land values or cash rental rates unique to specific localities or properties . Readers should use this report as a general reference and rely on local sources for more specific details .
South Dakota
Agricultural Land Market Trends
1991–2007Dr. Larry Janssen, Dr. Burton Pflueger, and Tyler Ahrendt1
1 Janssen and Pflueger are professors of economics, SDSU . Dr . Janssen has teaching and research responsibilities in agricultural finance, farmland markets, economic development, and research methodology . Dr . Pflueger is Extension farm financial management specialist and also teaches an undergraduate course on agricultural cooperatives . Mr . Ahrendt is a graduate student in the Economics Department .
2 A major purpose of this survey is to report land values and cash rental rates by major uses of privately owned agricultural land, excluding farm building sites . The major nonirrigated land uses reported are crops, hay, tame pasture, and rangeland . Rangeland is native grass pasture while tame pasture is seeded to introduced grasses . Agricultural land typically used for production of alfalfa hay, other tame hay, or native hay is considered hayland in this report . Cropland is agricultural land typically used for crop production other than hay production . Since most irrigated land in South Dakota is used for crop or hay production, we report the value and rental rates of irrigated land used for these purposes . These major land uses comprise nearly 98% of privately owned land in farms in South Dakota (Janssen 1999) .

�
County data on cropland and pasture land rents and values are provided by the South Dakota Agricultural Statistics Service (SDASS) in their report: South Dakota 2007 County Level Land Rents and Values.3 This SDASS report is based on a telephone survey of South Dakota farm/ranch producers and is the 13th annual survey of county level land rents and values . Major trends in per-acre cash rental rates and land values over time are similar in both the SDASS and SDSU surveys . A comparison of trends from 1995 to 2007 from both surveys will be made available later in 2007 .
Changing economic conditions in South dakota agricultureMost renters, buyers, and sellers of farmland continue to be local area residents, although there is greater outside interest in recent years . Consequently, land market participants are influenced by many social, financial, and economic factors in their localities . Many of the influential factors are related to changing economic conditions in agriculture . Land markets tend to reflect these changing economic conditions as land market participants adjust over time to current and prospective conditions .
Land market trends usually lag behind changing conditions in the general and agricultural economies and are strongly influenced by expectations of future trends and the availability of debt or equity financing .
Most of the 1990s were characterized by low inflation rates, declining-to-stable interest rates, and increasing export markets for grains, oilseeds, livestock, and meat products . The amount of farm debt, including farm real estate debt, gradually increased, and interest expense averaged between 9–11% of South Dakota farm production expenses .
Net farm income has been very unstable but trended slightly upward from 1990 to 2003 and
increased substantially in 2004, 2005, and 2006 .
Average prices of principal crops (feed grains, wheat, and soybeans) rebounded considerably in 2002 and 2003 from the marketing years of 1998 through 2001, which had seen the lowest average prices recorded in the past 15–20 years . Cattle and calf prices generally increased since 1996, resulting in improved profit margins .
By early 2006, crop prices had generally declined from the levels of the previous 3 years . Calf prices also declined .
Since September 2006, corn prices have climbed to levels higher than previous price spikes in 1995 or 1996 . Soybean and wheat prices have also rebounded but not as much as corn . Strong demand for ethanol production has been a major factor contributing to higher crop prices, especially corn . Current price projections suggest crop prices will be at a higher level than realized in the past 10 years . This is a major factor leading to upward pressures on land values and cash rents .
Farm real estate mortgage interest rates dropped substantially from 2001 through 2003 to their lowest levels in more than 35 years . Rates annually averaged between 8% and 10% from 1991 to 2000 but declined to around 5 .5% in 2002 and approached 6 .75–8 .0% in late 2006 . Greatly reduced mortgage interest rates and relatively low inflation rates for several years have had major positive impacts on real estate values, including farmland values .
Farmland values became more dependent on government farm program payments from 1999 to 2001 and in 2005 . Federal farm program payments in South Dakota increased from a range of $230 million to $268 million annually during the 1995–1997 period to more than $700 million annually from 1999–2001 . Farm program payments were 25% to 50% lower in 2002–2004 but spiked to more
3 The SDASS report on county level rents and values can be obtained from the Sioux Falls office, phone 605-323-6500 or South Dakota Agricultural Statistics Service / PO Box 5068 / Sioux Falls SD 57117-5068 . The report also can be accessed at http://www .nass .usda .gov/sd/

�
than $800 million in 2005 . Lower loan deficiency and countercyclical payments produced lower farm program payments in 2006 .
Federal farm payments increased from 5–7% of total value of production in 1995–1997 to 16–20% of total production value in South Dakota in 1999–2001 and 14% in 2005 . Market participants generally expect federal program benefits to continue, when needed by the farm sector, into the indefinite future although the rationale for payments may change . A USDA-ERS study of farm program impacts estimated that 22% to 24% of cropland values in 2000 in the Northern Plains, which includes South Dakota, were attributed to commodity program payments (Barnard et al . 2001) . This upward pressure of farm program payments on cropland values has continued .
After several years of relatively stable production costs, South Dakota farm production expenses for purchased inputs increased by at least 20–25% from 2003 to 2006, with further increases projected for 2007 . Most of the increase has been in fertilizer and energy-related costs .
The strong employment base in many South Dakota trade centers provides off-farm employment for increasing numbers of farm families . This permits greater economic stability and opportunities for many persons involved in land market decisions . Many investors, including farmland owners, have received capital gains from sale of stocks, land, or other investments that can be used for purchasing agricultural land for a variety of purposes . Credit has been readily available at greatly reduced interest rates in the past 6 years to help finance land purchases and farm operating expenses .
Finally, strong ethanol demand and growth in ethanol production facilities in South Dakota and surrounding states has been another factor leading to substantially higher prices for 2006 crop production . This also places upward pressure on land values and cash rental rates, especially in eastern and north-central regions of South Dakota .
South dakota agricultural land values, 2007 procedures to estimate and report land valuesRespondents to the 2007 South Dakota Farm Real Estate Market Survey estimated the per-acre value of nonirrigated cropland, hayland, rangeland, tame pasture land, and irrigated land in their counties and the percent change in value from one year earlier . Responses for nonirrigated land uses are grouped into eight agricultural regions (Fig 1) . The six regions in eastern and central South Dakota correspond with USDA Agricultural Statistics Districts . In western South Dakota, farmland values and cash rental rates are reported for the northwest and southwest regions . Land values and cash rental rates are reported only for privately owned land and should not be considered as estimated values for tribal lands or federal lands .
Irrigated land is only 1% of farmland acres in South Dakota . Due to the small number of irrigated land reports in several regions, responses for irrigated land values and rental rates are regrouped into six regions: western, central/south-central, north-central, northeast, east-central, and southeast .
The average value per acre and percent change in value were obtained for each agricultural land use in each region . Regional and statewide all-land
Fig 1. Nonirrigated agricultural land use patterns inSouth Dakota, statewide and regional.
20%80%
23%77% 37%
63%
64%36%
57%43%
70%30%
75%25%
79%21%
Statewide Top: crop and hay = 47%Bottom: range and pasture = 53%
Source: Compiled from land use data in 2002 Census of Agriculture and related surveys

�
(nonirrigated land) value estimates are weighted averages based on the relative acreage and value of each nonirrigated agricultural land use in each region of South Dakota . In this report, land use acreage weights for each region and statewide were developed from data reported in the 2002 Census of Agriculture and related sources (Appendix I) . These land use acreage weights have considerable impact on regional and statewide estimates of all nonirrigated land values .
Regional differences in all-agricultural land values are primarily related to major differences in: (1) agricultural land productivity among regions, (2) per-acre values of cropland and rangeland in each region, and (3) the proportion of cropland and rangeland in each region . More than 80% of farmland acres in each region are either cropland or rangeland, with cropland dominant in eastern South Dakota and rangeland dominant in western South Dakota (Fig 1) . Tame pasture and hayland are the remaining major land uses, excluding farm building sites . Tame pasture varies from 5 .5% to 9% of farmland acres in each region and is nearly 7% of statewide farmland acres . Hayland varies from 11% to 14% of total farmland acres in each of the six central and eastern regions, but only 3% to 5% of farmland acres in western South Dakota . Statewide, hayland is about 9% of privately owned farmland .
The combined proportion of cropland and hayland in each region varies from 20% of private agricultural land in the northwest region to 79% of farmland acres in the southeast region . The remainder is rangeland or tame (improved) pasture . Statewide, an estimated 47% of private farmland acres are cropland or hayland and 53% is rangeland or tame pasture (Fig 1) .
In summary, statewide cropland values are highly influenced by values estimated in the north-central and eastern regions, while statewide rangeland values are greatly influenced by values reported in the western and south-central region .
All-agricultural land value estimates, 2007As of February 2007, the average value of all agricultural land in South Dakota was $850 per acre, a 14 .4% increase in value from one year earlier (Fig 2 and Table 1) . This rate of increase is the same as reported from 2005 to 2006 and is lower than the record high increase of 20 .2% from 2004 to 2005 (Table 1 and Appendix Table 2) .
The increase of $107 per acre in the value of all agricultural land is the second highest annual dollar per-acre increase during the past 17 years . Overall, agricultural land values in South Dakota have doubled since 2002 and tripled since 1996 . Agricultural land values increased at double-digit rates in all regions of South Dakota, with the strongest increase of 21 .1% in the northeast and 18 .4% in the east-central region . In all other regions, land values increased between 11 .3% and 12 .8% .
The all-land average values are highest in the three eastern regions with per-acre values, varying from $1,946 in the east-central region to $1,768 in the
Fig 2. Average value of South Dakota agricultural land,February 1, 2007 and 2006, and percent change fromone year ago.
$285/acre$256/acre11.3%
$945/acre$849/acre
11.3%$1422/acre$1174/acre
21.1%
$1946/acre$1643/acre
18.4%
$899/acre$803/acre
12.0%
$521/acre$462/acre
12.8%
$322/acre$286/acre
12.6% $1768/acre$1583/acre+ 11.7%
Regional and statewide average values of agricultural land are theweighted averages of dollar value per acre and percent change byproportion of acres of each nonirrigated land use by region.
Top: Average per-acre value—February 1, 2007Middle: Average per-acre value—February 1, 2006
Bottom: Annual percent change in per-acre land value
Source: 2007 South Dakota Farm Real Estate Market Survey, SDSU.
State: $850/acre$743/acre
14.4%
�
Table 1. Average reported value and annual percentage change in value of South Dakota agricultural land by type of land by region, 2004–2007.
South- East- North- North- South- South- North-Type of Land east Central east Central Central Central west west STATE
dollars per acreAll Agricultural Land (nonirrigated) Average value, 2007 1768 1946 1422 945 899 521 322 285 850 Average value, 2006 1583 1643 1174 849 803 462 286 256 743 Average value, 2005 1372 1427 1029 736 711 414 275 211 650 Average value, 2004 1147 1162 779 629 594 377 223 192 541
Annual % change 07/06 11.7% 18.4% 21.1% 11.3% 12.0% 12.8% 12.6% 11.3% 14.4%
Nonirrigated Cropland Average value, 2007 1999 2244 1762 1187 1086 702 426 367 1375 Average value, 2006 1817 1914 1448 1088 986 612 387 342 1211 Average Value, 2005 1556 1659 1255 967 871 568 383 316 1064 Average Value, 2004 1315 1346 973 822 705 541 318 294 882
Annual % change 07/06 10.0% 17.2% 21.7% 9.1% 10.1% 14.7% 10.1% 7.3% 13.5%
Rangeland (native) Average value, 2007 1073 1293 889 634 708 448 295 265 448 Average value, 2006 925 1055 751 548 599 397 255 234 386 Average value, 2005 781 844 667 458 552 346 241 185 332 Average value, 2004 684 764 465 396 456 312 196 167 283
Annual % change 07/06 16.0% 22.6% 18.4% 15.7% 18.2% 12.8% 15.7% 13.2% 16.1%
Pasture (tame, improved) Average value, 2007 1167 1461 987 698 760 524 303 297 684 Average value, 2006 1085 1166 843 598 711 425 283 282 596 Average Value, 2005 937 1018 730 465 610 397 291 227 519 Average Value, 2004 754 818 517 424 518 337 217 198 420
Annual % change 07/06 7.6% 25.3% 17.1% 16.7% 6.9% 23.3% 7.1% 5.3% 14.8%
Hayland Average value, 2007 1659 1637 1028 750 815 525 356 327 875 Average value, 2006 1383 1371 831 640 758 499 346 300 758 Average value, 2005 1312 1203 780 515 612 451 324 270 675 Average value, 2004 1008 992 586 432 516 391 265 245 549
Annual % change 07/06 20.0% 19.4% 23.7% 17.2% 7.5% 5.2% 2.9% 9.0% 15.4%
South- East North- North Central/Type of Land east Central east Central S.Central Western STATE
dollars per acreIrrigated land Average value, 2007 2547 2649 2100 1531 1381 1003 1713 High Productivity 3002 3078 2387 1995 1559 1362 Low Productivity 2067 2169 1751 1259 1235 784 ---
Average value, 2006 2354 2305 1610 1329 1240 931 1533 Average value, 2005 1974 2097 1566 1017 1190 968 1397 Average value, 2004 1793 1678 1259 1210 865 782 1191
Annual % change 07/06 8.2% 14.9% 30.4% 15.2% 11.4% 7.7% 11.7%
Source: 2007 and earlier South Dakota Farm Real Estate Market SurveysStatewide average land values are based on 2002 land use weights

�
southeast region and $1,422 in the northeast region . This is the first year that all-land values exceed $1,350 per acre in the northeast region and the third year in the east-central and southeast regions . The per-acre increase in all-land values from 2006 to 2007 varied from $303 per acre in the east-central region to $185 per acre in the southeast region .
These three eastern regions contain the most productive land in South Dakota and benefit from the most rainfall . Cropland and hayland are the dominant agricultural land uses in eastern South Dakota, varying from 70% of farmland acres in the northeast to 79% in the southeast (Fig 1) .
Average per-acre agricultural land values in the north-central and central regions are much higher than corresponding land values in western and south-central South Dakota and considerably lower than average land values in the eastern regions . Average land values were $945 per acre in the north-central region and $899 per acre in the central region . In both regions, farmland values increased by more than $95 per acre from 2006 to 2007 . Land values are slightly higher in the north-central region due to a greater proportion of crop/hay land, compared to land use in the central region .
Agricultural land values are much lower in regions west of the Missouri River than in the eastern and central regions of South Dakota . The average value per acre ranges from $521 in the south-central region to $285 per acre in the northwest region, respectively . Rangeland and pasture are the dominant agricultural land uses in these regions .
Land values and value changes by type of land and region In each region, per-acre values are highest for irrigated land followed by nonirrigated cropland, hayland, tame pasture, and native rangeland . For each nonirrigated land use, per-acre land values are highest in the three eastern regions and lowest in the northwest, southwest, and south-central regions (Figs 3 and 4; Table 1) . In the north-central and central regions, per-acre values of cropland are higher in the north-central region, while per-acre values of hay, pasture, and rangeland are higher in the central region . These regional differences in land values by land use have largely remained consistent over time and are closely related to climate patterns, soil productivity differences, and crop/forage yield differences across the state .
Fig 3. Average value of South Dakota cropland, irri-gated land, and hayland, by region, February 2007,dollars per acre.
Crop = Nonirrigated croplandIrr. = Irrigated landa,b
Hay = Hayland
Source: 2007 South Dakota Farm Real Estate Market Survey, SDSU.
Crop $1187Irr. $1531Hay $ 750
Crop $2244Irr. $2649Hay $1637
Crop $ 702Irr. $1381Hay $ 525
Crop $1086Irr. $1381Hay $ 815
Crop $ 426Irr. $1003Hay $ 356
aIrrigated land values shown for the northwest and southwest regions are based on the average value reported for gravity irrigated land in both western areas.
bIrrigated land values shown for the central and south-central regions are based on the average value reported in both regions.
Crop $ 367Irr. $1003Hay $ 327
Crop $1999Irr. $2547Hay $1659
Crop $1762Irr. $2100Hay $1028
Source: 2007 South Dakota Farm Real Estate Market Survey, SDSU.
Range $265Pasture $297
Range $634Pasture $698
Range $295Pasture $303
Range $708Pasture $760
Range $448Pasture $524
Range $1293Pasture $1461
Range $1073Pasture $1167
Range $889Pasture $987
Fig 4. Average value of South Dakota rangeland andtame pasture, by region, February 2007, dollars peracre.
�
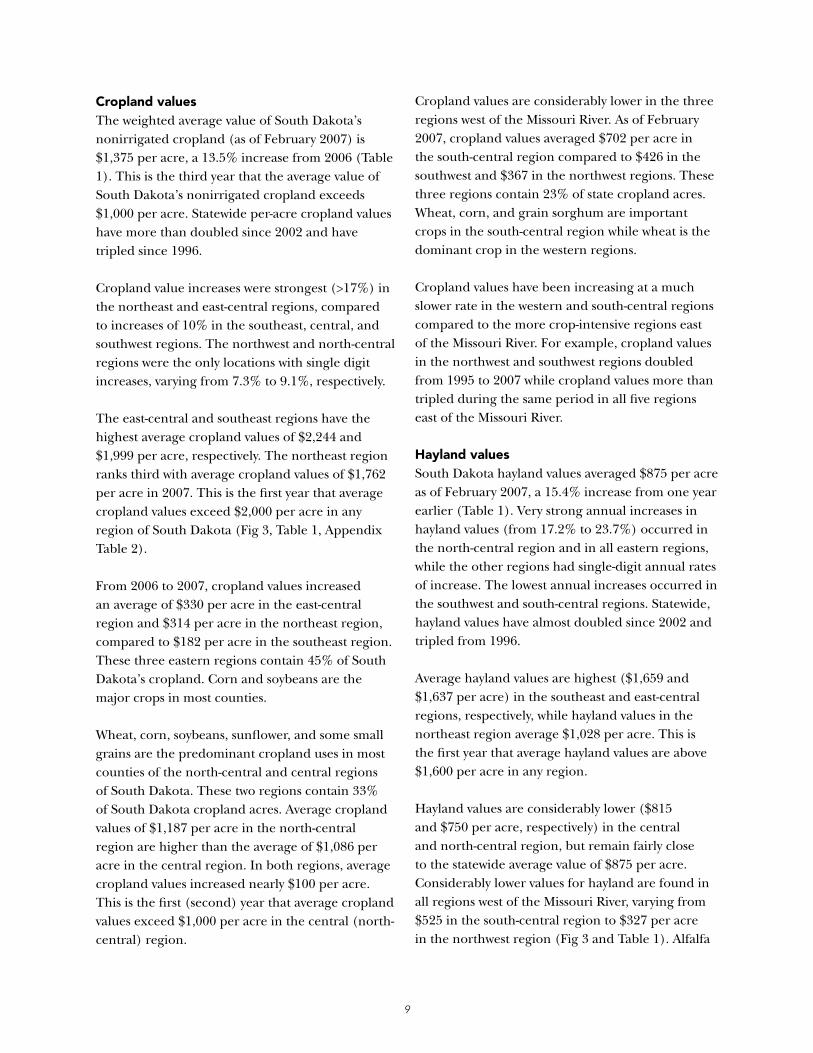
Cropland valuesThe weighted average value of South Dakota’s nonirrigated cropland (as of February 2007) is $1,375 per acre, a 13 .5% increase from 2006 (Table 1) . This is the third year that the average value of South Dakota’s nonirrigated cropland exceeds $1,000 per acre . Statewide per-acre cropland values have more than doubled since 2002 and have tripled since 1996 .
Cropland value increases were strongest (>17%) in the northeast and east-central regions, compared to increases of 10% in the southeast, central, and southwest regions . The northwest and north-central regions were the only locations with single digit increases, varying from 7 .3% to 9 .1%, respectively .
The east-central and southeast regions have the highest average cropland values of $2,244 and $1,999 per acre, respectively . The northeast region ranks third with average cropland values of $1,762 per acre in 2007 . This is the first year that average cropland values exceed $2,000 per acre in any region of South Dakota (Fig 3, Table 1, Appendix Table 2) . From 2006 to 2007, cropland values increased an average of $330 per acre in the east-central region and $314 per acre in the northeast region, compared to $182 per acre in the southeast region . These three eastern regions contain 45% of South Dakota’s cropland . Corn and soybeans are the major crops in most counties .
Wheat, corn, soybeans, sunflower, and some small grains are the predominant cropland uses in most counties of the north-central and central regions of South Dakota . These two regions contain 33% of South Dakota cropland acres . Average cropland values of $1,187 per acre in the north-central region are higher than the average of $1,086 per acre in the central region . In both regions, average cropland values increased nearly $100 per acre . This is the first (second) year that average cropland values exceed $1,000 per acre in the central (north-central) region .
Cropland values are considerably lower in the three regions west of the Missouri River . As of February 2007, cropland values averaged $702 per acre in the south-central region compared to $426 in the southwest and $367 in the northwest regions . These three regions contain 23% of state cropland acres . Wheat, corn, and grain sorghum are important crops in the south-central region while wheat is the dominant crop in the western regions .
Cropland values have been increasing at a much slower rate in the western and south-central regions compared to the more crop-intensive regions east of the Missouri River . For example, cropland values in the northwest and southwest regions doubled from 1995 to 2007 while cropland values more than tripled during the same period in all five regions east of the Missouri River .
Hayland valuesSouth Dakota hayland values averaged $875 per acre as of February 2007, a 15 .4% increase from one year earlier (Table 1) . Very strong annual increases in hayland values (from 17 .2% to 23 .7%) occurred in the north-central region and in all eastern regions, while the other regions had single-digit annual rates of increase . The lowest annual increases occurred in the southwest and south-central regions . Statewide, hayland values have almost doubled since 2002 and tripled from 1996 .
Average hayland values are highest ($1,659 and $1,637 per acre) in the southeast and east-central regions, respectively, while hayland values in the northeast region average $1,028 per acre . This is the first year that average hayland values are above $1,600 per acre in any region .
Hayland values are considerably lower ($815 and $750 per acre, respectively) in the central and north-central region, but remain fairly close to the statewide average value of $875 per acre . Considerably lower values for hayland are found in all regions west of the Missouri River, varying from $525 in the south-central region to $327 per acre in the northwest region (Fig 3 and Table 1) . Alfalfa

�0
hay is the most common hay in the eastern regions, while native hay is more common in the central and western regions .
pasture and rangeland valuesIn February 2007, the value of South Dakota native rangeland averaged $448 per acre, while the average value of tame pasture was $684 per acre (Table 1) . Native rangeland is concentrated in the western and central regions of South Dakota, while tame pasture is concentrated in the central and eastern regions . The statewide average values of rangeland and tame pasture increased 16 .1% and 14 .8%, respectively, during the past year (February 2006 to February 2007) . This is the fifth consecutive year that double-digit (>10%) increases in both pasture and rangeland values occurred in South Dakota . Statewide, rangeland and tame pasture land values have more than doubled since 2002 and tripled in per-acre value from 1996 .
Average rangeland values are highest in the east-central and southeast regions ($1,293 and $1,073 per acre) and lowest in the southwest and northwest regions, with average values of $295 and $265 per acre, respectively . In other regions, average rangeland values vary from the statewide average of $448 per acre in the south-central region to $987 per acre in the northeast region (Fig 4 and Table 1) .
In most regions, average values of tame pasture exceed rangeland values by 8% to 12% . However, the statewide average value of tame pasture was 52% higher than the average value of rangeland due to differences in regional concentration . Three-fourths of rangeland acres are located in counties west of the Missouri River while less than half of tame (improved) pasture acres are located in these counties .
In the crop-intensive regions of eastern South Dakota and in the north-central region, the average per-acre value of nonirrigated cropland varies from 1 .85 to 2 .0 times the average value of native rangeland . In the more rangeland-intensive
central and western regions, the average per-acre value of cropland varies from 1 .38 to 1 .58 times the average value of rangeland . Tame pasture land values are in between rangeland and hayland values in all regions . Also, pasture and hayland values are considerably lower than cropland values in all regions of South Dakota .
The relative variation in rangeland and cropland values across South Dakota is lower than reported for all-agricultural land values . In 2007, average per-acre values of cropland and rangeland in the northwest region are between 16% and 20% of per-acre values for the same land uses in the east-central region . However, due to the changing proportion of crop/hay land and pasture/range land across the state, the average value of all-agricultural land in the northwest is only 15% of all-agricultural land values in the east-central region (Table 1) .
Irrigated land valuesIrrigated land value reports are consolidated into six regions (Fig 3 and Table 1) . Very few irrigated land reports were received from respondents in the central and south-central regions, which made it necessary to combine the reports from these two regions . The northwest and southwest regions are combined into a western region because almost all irrigated land reports are for gravity-irrigated cropland in counties adjacent to the Black Hills . In all other regions, the value of irrigated land was reported for center pivot irrigation systems, excluding the value of the center pivot equipment .
We continue to caution readers that irrigated land value data are less reliable than data for other agricultural land uses . Irrigated land is not common (less than 1% of total acres) in most regions, and there are few sales of irrigated land tracts . Con-sequently, only 37% of all respondents were familiar with and able to provide information on irrigated land values .
Based on 79 responses, irrigated land value increases from 2006 to 2007 occurred in all regions . Statewide average irrigated land values

��
are $1,713 per acre, a 11 .7% increase from a year earlier . Regional average irrigated land values are considerably above the statewide average in the eastern regions and considerably below the statewide average in the central and western regions of South Dakota . Irrigated land values vary from an average of $2,649 and $2,547 per acre, respectively, in the east-central and southeast regions to $1,003 per acre in the western regions (Fig 3 and Table 1) . This is the first year that average irrigated land values exceed $1,000 in all regions of South Dakota .
Variation in land values by land productivity and county clustersWithin each region and for each nonirrigated agricultural land use, there is considerable variation in land values . In this section, we report the February 2007 per-acre values of average quality, high-productivity, and low-productivity land by agricultural land use by region and by county clusters within several regions (Table 2) .
A county cluster is a group of counties within the same region that have similar agricultural land use and value characteristics . Three clusters are identified in each of the following regions: southeast, east-central, northeast, north-central, and central . Land values are not reported for county clusters in regions west of the Missouri River because there are too few reports for most county groupings . This survey is not designed to reflect the substantially higher land values in or near the Black Hills .
Substantial variation in per-acre land value occurs by degree of land productivity for each land use in each region . For example, 2007 cropland values in the east-central region vary from an average of $1,771 per acre for low-productivity cropland to $2,865 per acre for high-productivity cropland . At the other extreme, the average value of low- (high-) productivity cropland values is $295 ($453) per acre in the northwest region . Across regions, average values of low-productivity cropland were 53% to 68% of the average values of high-productivity cropland .
Rangeland values in the east-central region vary from an average of $1,048 per acre for low-productivity rangeland to $1,575 per acre for high productivity rangeland . In the northwest region, at the other extreme, the average value of low- (high-) productivity rangeland is $203 ($324) per acre . The average value of low-productivity rangeland varies from 58% to 72% of the average value of high-productivity rangeland (Table 2) .
In 2007, average nonirrigated cropland values were above $2,000 per acre in three county clusters: Minnehaha-Moody; Clay-Lincoln-Turner-Union (CLTU), and Brookings-Lake-McCook . Cropland values were above $1,500 per acre in six additional county clusters of eastern and north-central South Dakota including all county clusters in the northeast region (Table 2) . As recently as 2004, average cropland values exceeded $1,500 per acre in only two county clusters, Minnehaha-Moody and CLTU .
In 2007, average cropland values in the east-central and southeast regions varied from $2,892 per acre in the Minnehaha-Moody cluster to $1,253 per acre in the Charles Mix-Douglas cluster . Average hayland values varied from $2,265 per acre in the Minnehaha-Moody cluster to $1,000 per acre in the Charles Mix-Douglas cluster .
Similar patterns of land values also occur for rangeland and pasture in these two eastern regions . For example, rangeland values varied from an average of $1,547 per acre in Minnehaha-Moody to $870 per acre in Charles Mix-Douglas (Table 2) .
In the northeast region, the average values of cropland in 2007 were nearly $1,860 per acre in the Codington-Deuel-Hamlin and Grant-Roberts clusters and about $1,560 per acre in the Clark- Day-Marshall cluster . Average per-acre values of other land uses were much lower than per-acre cropland values in each cluster . For each remaining land use, per-acre values were similar (within 5–6%) across all county clusters in this region .

��
Table 2. Average reported value per acre of agricultural land by South Dakota region, county clusters, type of land, and land productivity, February 1, 2007, 2006, 2005, and 2004.
Southeast East-CentralSanborn
Clay DavisonLincoln Bon Homme Brookings Hanson
Agricultural Land Turner Hutchinson Charles Mix Minnehaha Lake KingsburyType and Productivity All Union Yankton Douglas All Moody McCook Miner
dollars per acreNonirrigated Cropland Average 2007 1999 2527 1881 1253 2242 2892 2288 1874 High Productivity 2532 3255 2405 1457 2865 3740 3042 2290 Low Productivity 1551 1962 1423 1026 1771 2330 1722 1514
Average 2006 1817 2266 1603 1219 1914 2595 2019 1434 Average 2005 1556 2021 1283 1042 1659 2196 1665 1307 Average 2004 1315 1652 1150 937 1346 1822 1207 1088
Rangeland (native) Average 2007 1073 1264 1032 870 1293 1547 1292 1204 High Productivity 1265 1484 1209 1044 1575 1996 1583 1420 Low Productivity 865 1016 813 732 1048 1275 949 1034
Average 2006 925 1047 881 791 1055 1432 1041 973 Average 2005 781 851 778 686 844 910 810 838 Average 2004 684 785 629 599 764 936 689 706
Pastureland (tame, improved) Average 2007 1167 1389 1085 927 1461 1703 1440 1403 High Productivity 1374 1658 1264 1076 1728 2181 1700 1614 Low Productivity 985 1184 900 785 1227 1419 1089 1250
Average 2006 1085 1242 986 933 1166 1453 1134 1063 Average 2005 937 1108 839 771 1018 1156 936 1007 Average 2004 754 820 728 703 818 923 786 796
Hayland Average 2007 1659 2084 1669 1000 1637 2265 1685 1328 High Productivity 2087 2691 2095 1156 1982 2835 2093 1527 Low Productivity 1316 1716 1225 830 1293 1748 1254 1125
Average 2006 1383 1700 1312 932 1371 2250 1315 1037 Average 2005 1312 1759 1111 805 1203 1716 1149 904 Average 2004 1008 1218 919 717 992 1300 902 855
Source: 2007, 2006, 2005, and 2004 South Dakota Farm Real Estate Market Survey, SDSU.Irrigation land values are not reported in this table, due to insufficient number of reports in most county clusters.** Insufficient number of reports to make estimates by county cluster..

��
Table 2. (continued)
NortheastNorth
CentralCodington Clark Edmund Campbell
Agricultural Land Deuel Grant Day Brown Faulk PotterType and Productivity All Hamlin Roberts Marshall All Spink Walworth
dollars per acreNonirrigated Cropland Average 2007 1762 1856 1866 1558 1187 1691 951 814 High Productivity 2308 2417 2346 2132 1676 2575 1264 996 Low Productivity 1246 1325 1254 1133 895 1233 724 664
Average 2006 1448 1541 1557 1298 1088 1498 818 775 Average 2005 1255 1308 1349 1104 967 1342 766 683 Average 2004 973 1059 1054 775 822 1094 552 653
Rangeland (native) Average 2007 889 937 912 808 634 798 611 400 High Productivity 1035 1080 1032 974 768 947 761 481 Low Productivity 732 797 734 641 517 649 509 311
Average 2006 751 763 771 728 548 704 489 422 Average 2005 667 654 673 678 458 580 459 292 Average 2004 465 505 468 403 396 498 341 294
Pastureland (tame,improved) Average 2007 987 1027 1000 908 698 910 694 408 High Productivity 1181 1220 1155 1136 845 1088 867 467 Low Productivity 846 926 850 706 568 734 584 307
Average 2006 843 834 860 847 598 760 537 437 Average 2005 730 744 720 721 465 605 454 290 Average 2004 517 516 565 479 424 535 391 267 Hayland Average 2007 1028 1084 1013 964 749 1020 663 474 High Productivity 1260 1284 1150 1282 925 1282 816 553 Low Productivity 737 790 750 663 584 763 547 367
Average 2006 831 924 844 736 640 814 591 477 Average 2005 780 809 743 776 515 678 521 326 Average 2004 586 654 510 524 432 554 369 306

��
Table 2. (continued)South South North
Central Central West WestBuffalo
Aurora BruleAgricultural Land Beadle Hand HughesType and Productivity All Jerauld Hyde Sully All All All
dollars per acreNonirrigated Cropland Average 2007 1086 1110 1139 977 702 426 368 High Productivity 1418 1514 1409 1295 900 509 453 Low Productivity 826 867 873 701 557 321 295
Average 2006 986 1068 994 858 612 387 342 Average 2005 871 873 888 846 568 383 316 Average 2004 705 785 603 710 541 318 294
Rangeland (native) Average 2007 708 780 821 459 448 295 265 High Productivity 834 955 913 575 533 395 324 Low Productivity 537 572 649 335 355 237 203
Average 2006 599 677 611 450 397 255 234 Average 2005 552 608 590 388 346 241 185 Average 2004 456 530 409 384 312 196 167
Pastureland (tame,improved) Average 2007 760 854 854 481 524 303 297 High Productivity 913 1022 984 638 583 396 379 Low Productivity 600 619 765 363 405 221 235
Average 2006 711 771 728 531 425 283 282 Average 2005 610 683 606 411 397 291 227 Average 2004 518 586 463 450 337 217 198
Hayland Average 2007 815 931 876 560 526 356 327 High Productivity 992 1129 1021 760 612 414 393 Low Productivity 629 693 739 365 446 278 254
Average 2006 758 812 767 558 498 346 300 Average 2005 612 674 599 470 451 324 270 Average 2004 516 581 461 433 391 265 245

��
In the north-central region, average land values in Brown and Spink counties were much higher than those found in other counties, especially for cropland . Most cropland in Brown and Spink counties is located in the James River valley and is more productive than other land in this region . As an example, nonirrigated cropland values averaged $1,691 per acre in the Brown-Spink county cluster compared to only $814 per acre in the Campbell-Potter-Walworth cluster .
East of the Missouri River, the lowest per-acre values for each agricultural land use are found in the Campbell-Potter-Walworth cluster . For each land use, per-acre land values in this cluster are about half of corresponding land values in the Brown-Spink cluster and less than 20 to 25% of cropland or rangeland values in the Minnehaha-Moody cluster .
In the central region, land values for each land use were similar in the Aurora-Beadle-Jerauld and Brule-Hand-Hyde clusters and considerably lower in the Hughes-Sully cluster . Land values vary from an average of $459 per acre for rangeland in the Hughes-Sully cluster to above $1,100 for cropland in the other clusters of the central region .
Strong increases (often greater than 20%) were reported for land uses in most county clusters in the northeast and east-central regions . Some weaknesses in per-acre value changes were evident for some land uses in county clusters along the Missouri River .
For regions west of the Missouri River, average land values for each land use are highest in the south-central region and lowest in the northwest . Land values increased more rapidly in the south-central region compared to the southwest and northwest regions . Average land values vary from $265 per acre for rangeland in the northwest region to $702 per acre for cropland in the south-central region .
Major reasons for purchase and sale of farmland During each of the 17 years of the SDSU Farm Real Estate Market survey, respondents have been asked to provide major reasons for buying and selling farmland in their locality . Almost 97% of respondents provided one or two reasons in each category .
During all of the years this survey has been conducted, the top three or four most commonly cited reasons for purchase or sale of farmland have not changed . However, their relative importance has changed .
Farm expansion and investment purposes were the two most common reasons given for purchasing farmland (Fig 5) . Investment purposes varied from purchasing farmland and speculating on further increases in land values (i .e ., a potential to obtain large capital gains on investment) to purchasing land and leasing it out to local farmers .
Farmland potential for fee-based hunting and recreation can also influence investment decisions . Twenty-three percent of survey participants indicated hunting/recreation was a major reason for purchasing farmland . Responses indicating investment purposes or hunting/recreation purposes as the major reason(s) for purchasing farmland have increased from 23% of 1994 responses to 45% of responses in 2000 and 48% of responses in 2007 .
Conversely, the proportion of responses indicating farm expansion as the major reason for purchasing
Crop Prices 4%
Location/Availability6%
Tax/Gov’t Prog 7%
Hunting/Recreation23%
Investment25%
Expansion 30%Other 5%
Fig 5. Reasons for buying farmland.

��
farmland declined from 48% of responses in 1994 to 43% of responses in 2000 and 30% of responses in 2007 .
The opportunity to purchase land in advantageous locations or secure land available for sale that had been previously cash rented made up 6% of responses . Another 7% of respondents indicated farmland was purchased primarily for tax purposes (e .g ., 1031 exchanges in the federal Internal Revenue Service tax code) or to participate in government farm programs . Four percent of respondents indicated that current high crop prices are enticing individuals to buy farmland .
Retirement, estate settlement, and favorable market conditions continue as the three main reasons for selling farmland . Retirement or settlement of an estate was listed by 43% of respondents as reasons for selling . Forty percent of respondents indicated farmland was sold to capitalize on the current high land prices and demand in the land market . Eight percent listed financial/cash flow pressures as the main reasons for selling farmland (Fig 6) .
From 2000 to 2007, the major shift in reasons for selling farmland has been the increase in responses of favorable market conditions for sellers, 40% of responses in 2007 compared to 17% in 2000 . The proportion of respondents listing retirement or estate settlement as the major reason for sale declined from 60% to 43% during the same period .
Financial or cash flow pressures as the major reason for sale also declined from 16% to 8% of response in the same 7-year period .
The shift in perception that farmland expansion is no longer the dominant reason for farmland purchases is closely related to the rapid increase of farmland values, especially from 2000 to 2007, and the growth of hunting/recreation activities as a motivation for purchasing farmland in the 1990s and continuing to the present . In most areas of South Dakota, farmers and ranchers expanding their operation are still the principal buyers of agricultural land in their locality . However, their dominance in the land market is challenged by local area investors and nonlocal investors interested in purchasing agricultural land for various reasons including leasing land to local farmers, leasing/developing land for hunting and other recreational opportunities, and other motives . The implication is that farm expansion comes at a higher price than before .
Cash rental rates of South dakota agricultural land Three-eighths of South Dakota agricultural land acres are in cash, share, or other lease arrangements (South Dakota Census of Agriculture 2002) . The cash rental market provides important information on returns to agricultural land . Three-fourths of South Dakota farmland renters are involved in one or more cash leases for agricultural land . The majority of farmland leases (57%) were cash leases, and five-eighths of cash leases were annual renewable agreements (Janssen and Xu 2003) .
Respondents were asked about average cash rental rates per acre for nonirrigated cropland, irrigated land, and hayland in their localities . Cash rental rates for pasture/rangeland were provided on a per-acre basis and, if possible, on an Animal Unit Month (AUM) basis .4 Respondents were also asked to report cash rental rates for high-productivity and
Seller’s Market40%
Retire 31%
Estate 12%
Financial & Cash Flow8%
Other 8%
4 Animal Unit Month (AUM) is defined as the amount of forage required to maintain a mature cow with calf for 30 days . An AUM is somewhat of a “generic” value and should be about equal across regions . Therefore, private cash lease rates quoted on a per-AUM basis should be roughly equivalent in different geographic areas of the state unless there are major differences in forage availability, forage quality, and demand for leased land .
Fig 6. Reasons for selling farmland.

��
low-productivity land by different land uses in their locality . Cash rental rates by land use by region are summarized in Figure 7 and Table 3 . The same information is summarized by region and county cluster in Table 4 .
Cash rental rates differ greatly by region and by land use . For nonirrigated land uses, cash rental rates per acre are highest in the southeast and east-central regions and lowest in northwest and southwest South Dakota . In every region, cash rental rates are highest for cropland and lowest for rangeland and pasture (Fig 7 and Table 3) .
From 2006 to 2007, statewide average cash rental rates increased $3 .85 per acre for cropland, $1 .55 for hayland, and $0 .60 for pasture/rangeland . The average percentage increase in cash rental rates was 6 .3% for cropland, 3 .9% for hayland, and 3 .6% for rangeland .
Average cash rental rates increased for cropland in all regions except in the south-central and southwest regions . Hayland average cash rental rates increased in all regions except in the south-central, southwest, and central regions . Pasture/rangeland cash rental rates increased in all regions except in the south-central region . In general, cash rental rate increases were greatest in the same regions where the strongest land value increases were reported .
2007 cash rental rates: cropland, hayland, and irrigated landAverage cash rental rates in 2007 for nonirrigated cropland vary from $21 .80 to $23 .35 per acre in the western regions to $91 .65 per acre in the east-central and $92 .30 in the southeast regions (Fig 7 and Table 3) . Average cash rental rates for cropland are highest ($118 .60 and $110 .30 per acre, respectively) in the Minnehaha-Moody and Clay-Lincoln-Turner-Union (CLTU) county clusters (Table 4) .
This is the fifth year that average cash rental rates exceeded $100 per acre for high-productivity non-irrigated cropland in both the southeast and east-central regions . Average cash rental rates for high-productivity cropland in the CLTU and Minnehaha-Moody clusters currently exceed $145 per acre . Cash rental rates for high-productivity cropland currently exceed $100 per acre in the Brown-Spink county cluster of the north-central region and in all but one county cluster (Charles Mix-Douglas county cluster) located in the three eastern regions of South Dakota .
Within each region and county cluster, cash rental rate averages for low-productivity cropland are considerably lower than those reported for high-productivity cropland . For example, reported average cash rent for nonirrigated cropland in the southeast region is $67 .10 per acre for low-productivity cropland and $122 .10 for high-productivity cropland . In the northwest region, the average cash rent for low-productivity cropland is $16 .70 per acre while cash rental rates for high-productivity cropland average $26 .65 (Table 3) .
Hayland cash rental rates in 2007 vary from an average of $18 .40 to $18 .80 per acre in western South Dakota and from $31 .35 to $34 .25 in the central and north-central regions, respectively . In the three regions of eastern South Dakota, hayland cash rental rates vary from an average of $45 .10 in the northeast region to $74 .00 in the southeast region (Fig 7 and Table 3) .
Fig 7. Average cash rental rate of South Dakota non-irrigated cropland, hayland, and rangeland, by region,2007, dollars per acre.
Source: 2007 South Dakota Farm Real Estate Market Survey, SDSU.
Crop $21.80Hay $18.40Range $ 9.95
Crop $91.65Hay $67.55Range $42.80
Crop $32.65Hay $25.70Range $16.90
Crop $23.35Hay $18.80Range $11.60
Crop $48.95Hay $31.35Range $26.85
Crop $56.75Hay $34.25Range $28.50 Crop $77.85
Hay $45.10Range $34.95
Crop = CroplandHay = Hayland
Range = Rangeland and Pasture
Crop $92.30Hay $74.00Range $44.00

��
Table 3. Reported cash rental rates of South Dakota agricultural land by type of land by region, 2004–2007.South- East North- North- South- South- North-
Type of Land east Central east Central Central Central west west Statedollars per acre
Nonirrigated Cropland Average 2007 rate 92.30 91.65 77.85 56.75 48.95 32.65 23.35 21.80 64.80 High Productivity 122.10 127.70 118.60 82.65 65.90 45.30 29.85 26.65 Low Productivity 67.10 66.25 56.75 38.80 34.15 19.90 17.15 16.70
Average 2006 rate 89.25 82.60 70.50 53.85 46.35 34.00 24.70 21.45 60.95 Average 2005 rate 87.20 82.60 65.70 49.40 45.80 31.50 24.90 22.90 58.90 Average 2004 rate 83.70 78.80 64.50 47.60 43.40 34.10 23.10 21.40 56.80
Hayland Average 2007 rate 74.00 67.55 45.10 34.25 31.35 25.70 18.80 18.40 41.35 High Productivity 97.70 90.50 65.15 45.35 43.51 32.75 24.25 22.40 Low Productivity 53.50 47.70 31.65 24.10 21.63 17.15 14.05 13.80
Average 2006 rate 72.90 60.50 40.20 30.20 34.60 27.30 19.55 18.15 39.80 Average 2005 rate 71.60 56.40 38.70 28.90 29.80 22.20 17.60 18.80 37.20 Average 2004 rate 68.50 53.40 36.80 27.10 28.40 24.80 18.50 17.70 36.05
Pasture/Rangeland Average 2007 rate 44.00 42.80 34.95 28.50 26.85 16.90 11.60 9.95 17.10 High Productivity 57.70 58.50 47.65 38.05 37.95 22.45 14.65 13.05 Low Productivity 28.90 31.30 24.30 20.40 18.70 11.10 7.85 6.70
Average 2006 rate 42.10 40.00 31.35 25.90 26.30 19.60 10.70 9.25 16.50 Average 2005 rate 40.55 36.05 29.80 24.60 24.95 14.85 10.70 9.75 15.60 Average 2004 rate 37.40 35.90 27.20 22.20 23.90 17.30 10.00 7.90 14.60
dollars per Animal Unit Month
Average 2007 rate 22.70 *** 26.50 27.00 25.35 23.80 24.30 21.95 High Productivity 29.00 *** 32.50 36.10 30.00 29.10 29.55 27.55 Low Productivity 16.70 *** 19.00 20.30 19.10 17.00 18.00 16.90
Average 2006 rate 25.15 26.00 25.25 23.10 24.45 24.45 24.15 20.85 Average 2005 rate 21.45 21.10 23.75 22.40 20.60 23.20 22.30 19.45 Average 2004 rate 21.30 ** ** 21.10 24.00 23.60 21.90 19.80
South- East- North- North- Central/Type of Land east Central east Central S.Central Western State
dollars per acreIrrigated land Average 2007 rate 131.65 113.80 98.70 89.65 86.20 67.00 94.70 High Productivity 158.10 145.35 141.40 109.75 106.45 84.15 Low Productivity 106.10 92.65 76.50 73.65 68.05 51.35
Average 2006 rate 121.20 109.50 96.25 84.75 81.25 62.85 88.90 Average 2005 rate 118.30 109.30 84.45 80.95 73.10 60.50 84.50 Average 2004 rate 118.80 103.80 97.50 75.00 73.20 56.90 83.85
** Insufficient number of reports to make regional estimates.
Source: South Dakota Farm Real Estate Market Surveys, SDSU, 2007 and earlier year reports.
Statewide average rental rates are based on 2002 regional land use weights.

��
Table 4. Reported cash rental rates of South Dakota agricultural land by region and county clusters, 2007, 2006, 2005, and 2004 rates.
Southeast East-CentralSanborn
Clay DavisonLincoln Bon Homme Brookings HansonTurner Hutchinson Charles Mix Minnehaha Lake Kingsbury
All Union Yankton Douglas All Moody McCook Minerdollars per acre
Nonirrigated Cropland Average 2007 rate 92.30 110.30 88.70 64.20 91.65 118.60 96.00 75.05 High Productivity 122.10 147.85 116.95 81.80 127.70 163.10 136.95 103.35 Low Productivity 67.10 83.00 62.30 44.75 66.25 86.55 72.15 51.90
Average 2006 rate 89.25 106.15 82.85 59.65 82.60 109.30 85.75 67.00 Average 2005 rate 87.20 106.70 76.70 59.10 82.60 102.10 89.10 65.50 Average 2004 rate 83.70 99.30 77.50 58.10 78.80 100.20 80.60 62.50
Hayland Average 2007 rate 74.00 88.50 77.90 46.25 67.55 94.15 75.90 52.00 High Productivity 97.70 115.50 102.40 63.75 90.50 123.90 103.20 69.45 Low Productivity 53.50 66.20 55.95 30.55 47.70 65.45 57.85 34.15
Average 2006 rate 72.90 85.50 72.55 47.45 60.50 94.15 57.95 48.05 Average 2005 rate 71.60 91.30 68.10 43.50 56.40 80.10 57.60 41.70 Average 2004 rate 68.50 81.90 68.20 40.70 53.40 67.10 51.10 46.80
Pasture/Rangeland Average 2007 rate 44.00 48.00 43.00 39.30 42.80 48.40 43.00 40.10 High Productivity 57.70 61.92 56.60 52.85 58.50 66.30 62.25 52.15 Low Productivity 28.90 31.10 28.85 25.80 31.30 35.00 31.65 29.35
Average 2006 rate 42.10 47.70 38.40 36.55 40.00 51.50 41.60 35.65 Average 2005 rate 40.55 48.65 38.40 30.50 36.05 42.05 34.70 34.10 Average 2004 rate 37.40 44.70 33.20 30.00 35.90 38.80 35.40 34.80
Irrigated cropland rental rates per acre and rangeland rental rates per AUM are not reported in this table, due to insufficient number of reports in most county clusters.Source: South Dakota Farm Real Estate Market Surveys, SDSU, 2007, 2006, 2005, and 2004.

�0
Table 4. (continued)
NortheastNorth-
CentralCodington Clark Edmund Campbell
Deuel Grant Day Brown Faulk PotterAll Hamlin Roberts Marshall All Spink McPherson Walworth
dollars per acreNonirrigated Cropland Average 2007 rate 77.85 84.20 80.00 67.70 56.75 76.30 48.05 39.25 High Productivity 118.60 123.15 117.55 113.10 82.65 114.10 68.90 54.10 Low Productivity 56.75 64.35 55.95 47.00 38.80 53.00 32.50 26.20
Average 2006 rate 70.50 77.00 73.55 63.05 53.85 68.85 46.60 40.35 Average 2005 rate 65.70 71.90 68.40 57.30 49.40 64.80 42.50 38.70 Average 2004 rate 64.50 70.80 68.70 54.40 47.60 56.90 38.90 39.10
Hayland Average 2007 rate 45.10 51.30 45.00 38.25 34.25 44.55 33.00 22.20 High Productivity 65.15 68.55 60.00 64.40 45.35 57.35 44.50 30.15 Low Productivity 31.60 38.95 31.25 23.70 24.10 31.55 22.90 15.80
Average 2006 rate 40.20 50.70 33.00 31.45 30.20 34.20 30.75 24.70 Average 2005 rate 38.70 41.40 41.60 31.40 28.90 35.40 28.20 21.20 Average 2004 rate 36.80 43.30 29.80 30.70 27.10 31.10 26.10 20.30
Pasture/Rangeland Average 2007 rate 34.95 40.35 31.45 29.70 28.50 33.70 29.65 18.15 High Productivity 47.65 55.90 39.30 41.90 38.05 43.35 40.10 26.10 Low Productivity 24.30 29.65 22.15 18.20 20.40 25.00 20.85 12.20
Average 2006 rate 31.35 36.80 29.45 27.75 25.90 31.60 27.25 16.90 Average 2005 rate 29.80 34.05 28.35 26.35 24.60 29.60 25.15 17.10 Average 2004 rate 27.20 29.80 26.90 24.20 22.20 25.60 22.70 15.40

��
Table 4. (continued) South- South- North-
Central Central West West Buffalo
Aurora BruleBeadle Hand Hughes
All Jerauld Hyde Sully All All All dollars per acreNonirrigated Cropland Average 2007 rate 48.95 58.00 45.40 43.75 32.65 23.35 21.80 High Productivity 65.90 78.60 61.00 58.40 45.30 29.85 26.65 Low Productivity 34.15 39.15 31.50 32.50 19.90 17.15 16.70
Average 2006 rate 46.35 53.40 42.10 42.40 34.00 24.70 21.45 Average 2005 rate 45.80 49.50 41.50 45.00 31.50 24.90 22.90 Average 2004 rate 43.40 47.10 38.20 44.80 34.10 23.10 21.40
Hayland Average 2007 rate 31.35 38.70 30.95 21.00 25.70 18.80 18.40 High Productivity 43.51 58.40 40.80 27.25 32.75 24.25 22.40 Low Productivity 21.63 27.60 21.20 13.50 17.15 14.05 13.80
Average 2006 rate 34.60 37.90 31.95 ** 27.30 19.55 18.15 Average 2005 rate 29.80 36.50 26.50 17.50 22.20 17.60 18.80 Average 2004 rate 28.40 31.90 28.40 23.60 24.80 18.50 17.70
Pasture/Rangeland Average 2007 rate 26.85 33.20 27.10 19.45 16.90 11.60 9.95 High Productivity 37.95 48.40 37.45 27.15 22.45 14.65 13.05 Low Productivity 18.70 22.75 19.65 12.75 11.10 7.85 6.70
Average 2006 rate 26.30 30.10 25.80 20.20 19.60 10.70 9.25 Average 2005 rate 24.95 29.30 23.80 18.70 14.85 10.70 9.75 Average 2004 rate 23.90 28.60 22.00 19.10 17.30 9.90 7.90
** insufficient number of reports to make estimates at the regional level

��
In eastern South Dakota, average cash rental rates for hayland vary from $94 .15 in the Minnehaha-Moody cluster to $75 .90 per acre in the Brookings-Lake-McCook cluster to $38 .25 in the Clark-Day-Marshall cluster . For several counties in each eastern region, average cash rental rates for hayland are between $45 .00 and $55 .00 per acre (Table 4) .
Within each region and county cluster, there are considerable differences in average cash rental rates of low-productivity and high-productivity hayland . For example, the average rental rates for high- and low-productivity hayland in the CLTU county cluster are $115 .50 and $66 .20 per acre, respectively . In many regions, the lower cash rental rates are reported for native hayland, while the higher rates are quoted for alfalfa or other tame hayland .
Cash rental rates for irrigated land vary from an average of $67 .00 per acre in western South Dakota to $113 .80 in the east-central region and $131 .65 in the southeast region (Table 3) .
2007 cash rental rates: rangeland and pastureNearly three-eighths of South Dakota’s 26 .2 million acres of range and pasture acres are leased to farmers and ranchers . Several million acres of rangeland in western and central South Dakota are controlled by federal, state, or tribal agencies and are leased to ranchers using cash leases or grazing permits . A majority of leased rangeland and almost all leased pasture are cash rented from private landlords (Janssen and Xu 2003) . Respondents were asked to report 2007 cash rental rates per acre and per AUM (Animal Unit Month) on privately owned rangeland and pastureland in their localities .
Average cash rental rates per acre reflect regional differences in productivity and carrying capacity of pasture and rangeland tracts . Average cash rental rates vary from $9 .95 to $11 .60 per acre in western South Dakota to $44 .00 in the southeast region . Typical cash rental rates for low-productivity and high-productivity rangeland vary from $6 .70 to $13 .05 in the northwest region and from $28 .90 to $57 .70 in the southeast region (Fig 7 and Table 3) .
In counties east of the Missouri River, average cash rental rates for rangeland and pasture vary from a high of $48 .40 per acre in the Minnehaha-Moody cluster to a low of $18 .15 in the Campbell-Potter-Walworth county cluster (Table 4) .
Rangeland rates per AUM in 2007 vary from an average of $21 .95 per AUM in the northwest region to $27 .00 per AUM in the north-central region . Rental rates per AUM increased in all regions from 2006 to 2007 except in the southeast and south-central regions .
New publications on agricultural land rental arrangements in South dakotaThere are several new publications available from the SDSU Extension Economics Department that address issues for both landlords and tenants and summarize some issues that should be considered when entering into lease agreements . Also available through these publications are worksheets that can be used to assist in the determination of equitable lease rates . These publications listed are only a few of the available resources . Additional publications and related decision aid resources are available at http://econ .sdstate .edu .
SDSU Extension Extra 5063, Crop cash lease agreements, is available online at: http://agbiopubs .sdstate .edu/articles/ExEx5063 .pdf
SDSU Extension Extra 5064, the short version of a cash farm lease, is available online at: http://agbiopubs .sdstate .edu/articles/ExEx5064 .pdf
SDSU Extension Extra 5065, Crop share lease agreements, is available online at: http://agbiopubs .sdstate .edu/articles/ExEx5065 .pdf
SDSU Extension Extra 5066, the short version of a crop share farm lease, is available online at: http://agbiopubs .sdstate .edu/articles/ExEx5066 .pdf
SDSU Extension Extra 5067, Flexible-cash lease agreements, is available online at: http://agbiopubs .sdstate .edu/articles/ExEx5067 .pdf
SDSU Extension Extra 5068, the short version of a flexible-cash farm lease, is available online at: http://agbiopubs .sdstate .edu/articles/ExEx5068 .pdf
SDSU Extension Extra 5071, Pasture lease agreements, is available online at: http://agbiopubs .sdstate .edu/articles/ExEx5071 .pdf

��
SDSU Extension Extra 5072, the short version of a pasture lease, is available online at: http://agbiopubs .sdstate .edu/articles/ExEx5072 .pdf
Rates of return to South dakota agricultural land Two approaches (gross rates of return and net rates of return) are used in each annual survey to obtain information on current rates of return to agricultural land .5,6 The 1991 to 2007 trend of gross rent-to-value ratio by land use and net rate of return by land use is depicted in Figs 8a and 8b respectively .
First, gross rent-to-value ratios (gross cash rent as a percent of land value) are calculated from respondents’ reported cash rental rates and estimated values of leased land . This is a measure of the gross rate of return obtained by landlords before deduction of property taxes and other landlord expenses .
In 2007, the statewide average gross rate of return (rent-to-value ratio) is 4 .9% for nonirrigated cropland, 4 .8% for hayland, 4 .0% for rangeland, and 4 .4% for all agricultural land . This is the second year in the 17 years of this annual survey that the statewide average gross rates of return to all nonirrigated agricultural land is lower than 5% . Regional average rent-to-value ratios in 2007 vary from 3 .8% in the southwest to 4 .9% in the north-central region (Table 5) .
Next, respondents were asked to estimate the current net rate of return (percent) that landowners in their locality could expect given current land values . Appraisers refer to the current annual net
rate of return as the market-derived capitalization rate, which is widely used in the income approach to farmland appraisal . The net rate of return is a return to agricultural land ownership after deducting property taxes, real estate maintenance, and other ownership expenses .7
Average net rates of return for 2007 varied from 4 .2% for nonirrigated cropland to 3 .9% for hayland and to 3 .4% for rangeland and pasture and averaged 3 .8% for all agricultural land .
5 The range of reported rates of return and calculated rent-to-value ratios is obtained for the middle 90% of responses for each land use . For most respondents, the estimated gross rate of return (rent-to-value ratio) varies from 3 .1% to 7 .5% for cropland, from 3 .0% to 7 .5% for hayland, and 2 .5% to 6 .5% for rangeland . For most respondents, the reported net rate of return varies from 2% to 8% for cropland and hayland and from 1 .5% to 7 .5% for rangeland . This represents the practical range of reported rates of return and rent-to-value ratios .
6 The median rent-to-value ratio (gross rate of return) on 2007 is 4 .75% for cropland, 4 .45% for hayland, and 3 .75% for rangeland . The median net rate of return is 4 .0% for cropland, 3 .75% for hayland, and 3 .25% for rangeland .
7 The market-derived income capitalization rate used by appraisers is equal to net returns to land divided by its current market value . One widely used method of estimating net return to agricultural land is subtracting property taxes, land maintenance expense, and other land ownership expenses from the gross cash rental rate for the same land . In each SDSU farmland market survey, respondents were requested to estimate this net rate of return by land use for agricultural land in their localities .
Fig 8b : Net rate of return by land use 1991–2007
1991 1995 1999 2003 2007Year
Fig 8a : Gross rent to value ratio by land use, 1991–2007
1991 1995 1999 2003 2007Year
Perc
ent
Perc
ent
3.03.54.04.55.05.56.06.57.07.58.08.5
3.03.54.04.55.05.56.06.57.07.58.08.5
Source: 2007 SDSU Farm Real Estate Market Survey and earlier publications
All agricultural land
Nonirrigated cropland
Rangeland & pasture
All agricultural land
Nonirrigated cropland
Rangeland & pasture

��
This is the third consecutive year during the past 17 years that average net rates of return for all agricultural land were below 4% . Also, average net rates of return in 2007 are below 4 .5% for each agricultural land use and for all regions of South Dakota .
Average net rates of return by region in 2007 varied from 3 .0% in the southwest region to 4 .4% in the north-central and southeast regions . In all other regions, the average net rate of return was between 3 .4% and 4 .2% . The regional differences in rates of return reflect the consistent pattern of cropland rates of return (both gross and net) exceeding rates of return to rangeland in each of the past 17 years .
The calculated difference between gross and net rates of return to agricultural land ownership in 2007 is 0 .6 percentage points for all agricultural land and varies somewhat across regions and agricultural land uses (Table 5) . Most of the difference between gross returns and net returns is caused by property tax levies .
Table 5. Estimated rates of return to South Dakota agricultural land by type of land and by region, 1991–2007.Average Average Average Average
2007 2006 2005 2004 2000–2003 1991–1999 2007 2006 2005 2004 2000–2003 1991–1999Type of land-statewide GROSS rate of return (%) NET rate of return (%)b All agricultural land 4.4 4.7 5.2 5.8 6.6 7.4 3.8 3.9 3.9 4.3 4.7 5.4Nonirrigated cropland 4.9 5.2 5.7 6.6 7.5 8.0 4.2 4.2 4.5 4.9 5.3 6.1Rangeland & pasture 4.0 4.3 4.8 5.2 5.9 6.8 3.4 3.8 3.5 3.9 4.3 4.8Hayland 4.8 5.2 5.7 6.5 7.3 8.0 3.9 4.0 4.0 4.4 4.9 5.6
Regiond GROSS rate of return (%) NET rate of return (%)Southeast 4.7 5.0 5.5 6.2 7.0 7.4 4.4 4.1 4.5 4.9 5.1 5.9East-Central 3.8 4.4 4.9 5.6 6.9 7.6 3.8 4.1 4.7 4.7 5.2 5.5Northeast 4.6 4.9 5.1 6.8 7.6 8.1 3.8 3.9 4.3 4.8 5.5 6.2North-Central 4.9 5.2 5.8 6.2 6.9 7.9 4.4 4.4 4.4 4.6 5.8 6.1Central 4.2 4.6 4.9 6.0 6.9 7.7 4.2 4.1 4.1 4.4 4.5 5.3South-Central 4.5 5.1 4.9 6.2 6.3 6.9 3.8 4.0 4.0 4.2 4.7 5.2Southwest 4.3 4.2 4.7 5.4 6.1 6.7 3.0 3.1 3.2 4.0 3.8 4.4Northwest 4.4 4.7 5.5 5.2 6.1 7.1 3.4 4.0 3.4 3.7 4.4 5.1
aGROSS rate of return (percent) is calculated by dividing the average gross cash rental rate by reported value of rental land. bNET rate return is the reporter’s estimate of the percentage rate of cash return to ownership given current land values. Appraisers often refer to this measure as the market capitalization rate.cState level GROSS and NET rate of return estimates are calculated by weighting regional estimates by proportion of acres of each land use by region.dRegional level GROSS and NET rate of return estimates are calculated by weighting the rate of return estimates for each land use by proportion of the region agricul-tural acres in each land use. Source: 2007 South Dakota Farm Real Estate Survey, SDSU and earlier reports.
Longer-term perspective on farmland market changes, 1991–2007Longer-term historical data from annual SDSU surveys of agricultural land values and cash rental rates in South Dakota from 1991 to 2007 are located in Appendix Tables 2 and 3 of this report . Long-term trends in average annual cash rates of return are shown in Fig 8a and Fig 8b . Regional and statewide comparisons of annual percentage changes in all agricultural land values in three periods (1991–1996, 1996–2001, and 2001–2007) are shown in Fig 9 .
Based on 17 years of examining trends in rates of return to agricultural land and trends in land values and cash rental rates by agricultural land use across regions and county clusters, a few key observations are offered .
First, gross rates of return (cash rent to land value ratio) for cropland, rangeland, and all agricultural land declined slowly from 1991 to 2000 and more

��
rapidly each year from 2001 to 2007 . In all 17 years, average rates of return to cropland exceeded average rates of return to rangeland (Fig 8a and 8b) . During the same time period, trends for net rates of return were similar, but more erratic, than trends in gross cash rates of return to land .
Second, considerable insight about impacts of federal policies on land values is gained by comparing annual rates of land value increases for the three time periods . The first period, 1991 to 1996, reflects the impacts of the 1990 farm bill, continued recovery of the farm sector from the farm financial crisis of the mid-1980s, and long-term farm mortgage interest rates averaging 8–10% . The second period, 1996 to 2001, reflects the impacts of the 1996 farm bill and subsequent increases in federal farm program spending . However, there were no major changes in farm mortgage interest rates from the earlier period . The third period, 2001–2007, reflects the impacts of major reductions in farm mortgage interest rates, continued farm program support, and relatively low rates of inflation .
Agricultural land values increased more rapidly in the 2001 to 2007 period than in the earlier periods (Fig 9) . From 2001 to 2007, average annual increases in land values exceeded 10% in all regions of the state . From 1996 to 2001, average annual increases in land values were between 5% and 9% . They were generally less than 5% in the 1991 to 1996 period . The impacts of lower interest rates along with relatively low inflation rates overwhelmed the considerable impacts of federal farm programs on land values . Also, rapid adoption of biotechnology, reduced tillage, and development of soybean meal plants and ethanol plants in the past 10 years have also increased per-acre returns to farming and enhanced land values .
Third, increases in agricultural land values from 1991 to 2000 were strongly supported by increases in cash rental rates . However, the declining rates of return from 2001 to 2007 indicate that cash rental rates have increased at a slower rate than land values in this period .
For example, South Dakota cropland cash rental rates increased an annual average rate of 5 .8% from 1996 to 2001 and 5 .5% from 2001 to 2007 . However, cropland values increased at a similar rate to cropland cash rents (+6 .6%) from 1996 to 2001 and accelerated to an annual average of 14 .1% from 2001 to 2007 .
The earlier time period (1996 to 2001) reflects the major impacts of farm program benefits on both cash rental rates and land values, while the latter time period shows the much greater positive impact of reduced interest rates on land values compared to the impact on cash rental rates . During this latter period of 2001 to 2007, the real estate market (including farmland) has been in a speculative boom fueled by low interest rates and relatively low rates of general price inflation .
The rapid increase in South Dakota ethanol production has been a contributing factor to rising farmland values and helps to explain why cropland values in eastern and central regions have been
Fig 9. Annual percentage change in all ag land values, 1991–1996, 1996–2001, and 2001–2007.
0% 5% 10% 15% 20%
Stat
e/Re
gion
Annual % change in all ag land values
South Dakota
Southeast
East Central
Northeast
North Central
Central
South Central
Southwest
Northwest 2001–20071996–20011991–1996

��
increasing at a faster rate than cropland values in western South Dakota .
Gross and net cash rates of cash return have reached the lower end of historical rates of return to agricultural land in South Dakota . Farmland investors find market conditions where most of the total returns are from expectations of capital appreciation instead of current cash returns . This pattern of declining rates of cash return to land also occurs during the latter stages of land market price booms . Fourth, the more rapid increases in cash rental rates and land values since 1996 were directly related to crop price or government payment benefits that became quickly capitalized into land rents and values . More recent increases in land values from 2001 to 2006 were strongly related to sharp declines in costs of borrowing money and to many investors (including farmers) shifting some funds into real estate from stocks and bonds . These factors remain important, but the recent surge in crop prices, if maintained for a few years, may lead to sharp increases in cash rental rates .
Fifth, regional and county cluster rankings in per-acre land values are very stable for most land uses, reflecting fundamental differences in soil productivity, long-term weather patterns, and relatively slow shifts in the economic structure of most counties in South Dakota . The greatest changes in land values are generally occurring near growing urban centers, in localities where commercial (fee) hunting has greatly increased, and in areas shifting from wheat and small grains to corn and soybeans .
Sixth, land values across counties and regions tend to move together over time but not at exactly the same time or at the same pace . A typical pattern is three to four years of rapid increases in land values followed by one or two years of consolidation (or even declines) before the next surge in land values . The timing of the growth and consolidation phases are not identical across all regions and counties .
Thus, a long-term perspective on land value changes is warranted .
Finally, agricultural land values show increases above the rate of price inflation in all regions . From 1991 to 2007, the average annual rate of general price inflation has been less than 2 .5% . The statewide average annual rate of increase for all agricultural land was 8 .2% during this period, with regional variation from 6 .6% in the south-central region to 9 .1% in the north-central region (Appendix Table 2) . Trends in land value changes by land use followed similar patterns .
Additional information and numerous charts on longer-term trends in South Dakota agricultural land values and cash rental rates, statewide and regional, can be obtained in a recent electronic publication, “Historical and recent trends in South Dakota’s agricultural land market,” at http://agbiopubs .sdstate .edu/articles/EC918 .pdf (Hamda et al 2003) . An update is planned .
Respondents’ assessment of factors influencing farmland markets in South dakotaRespondents were asked to list major positive and negative factors affecting the farm real estate market in their localities . These factors help explain changes in the amount of farmland for sale, sale prices, and rental rates . Eighty-seven percent of respondents listed one or two positive reasons and 80% listed one or two negative reasons .
This year 30% of respondents indicated farm profits/crop yields as positive factors in the farm real estate market . Thirteen percent of respondents indicated livestock and commodity prices as positive factors (Fig 10) . Drought/weather conditions and higher input costs (especially fuel, energy, and fertilizer costs) were the two most common responses cited as negative factors (Fig 11) .
From 2002 to 2005, low interest rates were cited as the principal positive factor in the farmland market .

��
In 2006 and 2007, relatively low interest rates were still cited as a positive factor, but increasing interest rates were cited nearly as often as a negative factor in the farmland market .
Government programs, tax incentives, and increase in net worth were frequently cited as positive factors, while low agricultural returns, few young farmers, and small farmers’ inability to compete with large operations were often cited as negative factors . Other listed negative factors included farm program uncertainty, competition for nonagricultural uses of farmland, and taxes .
Respondents continue to be divided in their assessment of investor interest in farm real estate and continued escalation of farmland prices . High demand for farmland was listed as a positive factor (6% of responses), while high land prices and cash rental rates were also cited as a negative factor (8% of responses) . Investors (mostly nonlocal) were often listed as a positive factor and as a negative factor (Fig 10 and 11) . Some respondents stated that outside investors are raising land prices to levels that are becoming out of reach for local farmers .
Agricultural land market expectations: past and prospectiveIn each survey, respondents were asked to estimate the percentage change in land values during the
previous year and to forecast percentage changes in land values for the following year . Nearly 80% of respondents provided their perception of previous year land value changes, but only 60% provided forecasts for next year .
During the past year, respondents’ estimated percentage increases in land values averaged 9–10% for rangeland and pasture and 12–13% for cropland or hayland and were a little lower than rates of land value increase estimated in the 2006 and 2005 surveys . The median increase was 10% for all land uses in all 3 years . Most respondents (93% to 97%, depending on land use) reported increases in land values during the previous 12 months and no one indicated farmland values had declined .
Ninety percent of respondents providing forecasts expect land values to increase in the next 12 months, the highest proportion of respondents forecasting land value increases in the 17 years of survey reports .
Most other respondents expect no change in land values, and only 1% of respondents forecast a decline in land values for next year . The median forecast percentage increase is 8% for pasture/ rangeland and 10% for cropland, compared to average (mean) forecasted increases varying from 7 .2% for rangeland to 8 .3% for cropland .
Fig 10. Positive factors in the farm real estate market
Increase in Net Worth 7%
Investor Purchase
11%
High Demand/Expansion
6%
Tax Incentives 5%
Other 4%
Low Interest Rates 9% Government
Programs 5%
Lvstk Prices/Mkts
13%
Hunting/Recreation 11%
Farm Profits/Crop Yields 30%
Fig 11. Negative factors in the farm real estate market
Higher Input Cost
16%
Increased Interest Rates 6%
Low Ag Returns
5%
Drought/Weather 19%
High Land Prices/Rents
8%
No Young/Small Farmers
Can’t Compete 6%
Outside Investors 9%
None 10%
Other 22%

��
In summary, respondents to the 2007 survey are optimistic about further increases in farmland values, with very few predicting declines in land prices or cash rental rates . Prospects of continued increases in input expenses, possible increases in long-term interest rates, and growing concerns about future federal farm program legislation are not sufficient to change their optimistic outlook . Major increases in 2006 crop prices and prospects for continued higher crop prices for the next few years are fueling this optimism .
Prospective buyers and investors, enamored with low interest rates and often perceiving higher prospective cash returns from crop/forage production for bioenergy sources, are investing in farmland . In this speculative market situation, it may take considerable increases in general price inflation and interest rates and farm price/production declines to take the “steam” out of continued upward pressures on land values .
References**, ***Barnard, Charles, Richard Nehring, James Ryan,
Robert Collender, and Bill Quinby . 2001 . Higher cropland value from farm program payments . USDA ERS Agricultural Outlook, AGO-286: 26-30 .
Hamda, Yonas, Burton Pflueger, and Larry Janssen . 2003 . Historical and recent (1991–2003) trends in South Dakota’s agricultural land market . SDSU EC 918 . Available at http://agbiopubs .sdstate .edu/articles/EC918 .pdf
Janssen, Larry . 1999 . Agricultural land values in South Dakota: a comparison of two surveys . SDSU Econ Research Report 99-1 .
Janssen, Larry, and Xuan Xu . 2003 . Farmland leasing in South Dakota . SDSU AES B739 .
Janssen, Larry, and Burton Pflueger . 2004 . South Dakota agricultural land market trends: 1991–2004 . SDSU AES C269 .
Janssen, Larry, Erik Gerlach, and Burton Pflueger . 2005 . South Dakota agricultural land market trends: 1991–2005 . SDSU AES C270 .
Janssen, Larry, and Burton Pflueger . 2006 . South Dakota farmland market trends, 1991–2006 . SDSU AES C271 .
Pflueger, Burton . 2007 . Crop cash lease agreements . SDSU CES ExEx5063 .
Pflueger, Burton . 2007 . Cash farm lease (short version) . SDSU CES ExEx5064 .
Pflueger, Burton . 2007 . Crop share lease agreements, SDSU CES ExEx5065 .
Pflueger, Burton . 2007 . Crop share farm lease (short version) SDSU CES ExEx5066 .
Pflueger, Burton . 2007 . Flexible cash lease agreements . SDSU CES ExEx5067 .
Pflueger, Burton . 2007 . Flexible cash farm lease (short version) . SDSU CES ExEx5068 .
Pflueger, Burton . 2007 . Pasture lease agreements . SDSU CES ExEx5065 .
Pflueger, Burton . 2007 . Pasture lease (short version) . SDSU CES ExEx5065 .
South Dakota Agricultural Statistics Service . 2006 . South Dakota 2006 county level land rents and values . Sioux Falls .
U .S . Dept . of Agriculture . 2002 Census of Agriculture, South Dakota l (41) .
** Reference citations for annual SDSU farm real estate survey
reports for 1991 through 2002 are not listed above but can be
found in the following reports . The annual reports for 1991
and 1992 were published as SDSU Economic Research Reports
91-3 and 92-1 . The annual reports from 1993 to 2002 were
published as SDSU AES Circulars 256, 257, 258, 259, 260, 262,
263, 264, 266, 267, and 268 . Dr . Janssen and Dr . Pflueger, often in
collaboration with an SDSU economics student, were co-authors
of each annual report .
*** An electronic version of C 271 for 2006 can be accessed at
http://agbiopubs .sdstate .edu/articles/C271 .pdf
To obtain previous land market circulars change the circular
number from C271 to the appropriate number for the desired
year (example C270 .pdf for the 2005 circular) .
Electronic versions of the Extension Extra series on farmland
rental arrangements authored by Dr . Burton Pflueger can be
accessed at http://agbiopubs .sdstate .edu/articles/ExEX50xx .pdf
where xx equal the last two digits of the desired publication .

��
Appendix I: Survey methods and respondent characteristicsThe primary purpose of the 2007 South Dakota Farm Real Estate Market Survey was to obtain regional and statewide information on: (1) 2007 per-acre agricultural land values by land use and land productivity, and (2) 2007 cash rental rates by agricultural land use and land productivity . In addition, we obtained respondents’ assessment of positive and negative factors influencing their local farm real estate market and motivations for buyer/seller decisions .
Copies of this survey were mailed to potential respondents on February 15 with a follow-up mailing on March 6 . Potential respondents were persons employed in one of the following occupations: (1) agricultural lenders (senior agricultural loan officers of commercial banks or Farm Credit Service), (2) loan officer or county directors of the USDA Farm Service Agency (FSA), (3) Cooperative Extension Service agricultural educators and area farm management specialists, and (4) licensed appraisers and assessors . Some appraisers were also realtors or professional farm managers, while some lenders were also appraisers .
Respondents were asked to report land values and cash rental rate information for nonirrigated cropland, hayland, rangeland, improved pasture, and irrigated land in their locality . About one-third of respondents provided information for two or more counties, while two-thirds reported information for one county .
The total response rate was 39% of 624 persons contacted . The usable survey response rate was 34% . The distribution of 214 respondents by location and reported occupation is shown in Appendix Table 1 . Two-thirds of Farm Service Agency officials, 49% of licensed appraisers, 39% of Extension educators, 35% of assessors, and 25% of agricultural lenders contacted provided usable responses . Fifty-seven percent of respondents are agricultural lenders or FSA officials .
Fifty percent of the respondents were from the three eastern regions of South Dakota, 33% were from the three regions of central South Dakota, and 17% were from western South Dakota . Most respondents were able to supply land value and cash rental rate information for nonirrigated cropland, hayland, and rangeland in their localities . Less than three-eighths of respondents provided information on irrigated land values and cash rental rates and only 28% reported cash rental rates per AUM on rangeland .
Regional average land values by land use are simple average (mean) values of usable responses . Statewide average land values by land use are weighted by the relative number of acres in each region in the same land use . All-agricultural land values, regional and statewide, are weighted by the proportion of acres in each agricultural land use . Thus, all-agricultural land values in this report are weighted average values by region and land use . This weighted average approach is analogous to the cost (inventory) approach of estimating farmland values in rural land appraisal .
This approach has important implications in the derivation of statewide average land values and regional all-land values . For example, the two western regions of South Dakota with the lowest average land values have nearly 60% of the state’s rangeland acres, 39% of all-agricultural land acres, and only 16% of cropland acres . Our approach increases the relative importance of western South Dakota land values in the final computations and results in lower statewide average land values .
The weighting factors used to develop statewide average land values were based on estimates of agricultural land use for privately owned nonirrigated farmland in South Dakota . It excludes agricultural land (mostly rangeland) leased from tribal or federal agencies, which is mostly located in the western and central regions of the state . Irrigated land is also excluded from regional and statewide all-land values . The land use weighting factors were developed from county level data in the

�0
Appendix Table 1. Selected characteristics of respondents, 2007.
Number of respondents = 214
Respondents:
Reporting location N % Primary Occupation N %
Southeast 40 18.7% Banker/loan officer 84 39.3%
East-Central 37 17.3% Farm Service Agency 39 18.2%
Northeast 31 14.5% Assessor 23 10.7%
North-Central 30 14.0% Appraiser/realtor 43 20.1%
Central 26 12.1% Extension educators 25 11.7%
South-Central 15 7.0% 214 100.0%
Southwest 14 6.5%
Northwest 21 9.8%
214 100.0%
Response rates:
Land values N % Cash Rental Rates N %
Nonirrigated cropland 202 94.4% Nonirrigated cropland 200 93.5%
Irrigated cropland 79 36.9% Irrigated cropland 75 35.1%
Hayland 184 86.0% Hayland 169 79.0%
Rangeland (native) 189 88.3% Rangeland (acre) 183 85.5%
Pastureland (tame) 152 71.0% Rangeland (AUM) 61 28.5%
2002 South Dakota Census of Agriculture and other sources .
Regional average rental rates by land use are simple average (mean) values of usable responses . Statewide average cash rental rates for each land use are weighted by: (1) the relative number of acres in each land use, and (2) the proportion of farmland acres leased in each region .
This is the first SDSU report that uses 2002 land use weighting factors for estimating statewide values by land use and regional or statewide land values for
all nonirrigated agricultural land . Previous reports have used data from the 1992 census for land use weighting factors . Updating land use weights from 1992 to 2002 increases all land values by nearly 3%, primarily due to the higher proportion of cropland and hayland reported for eastern and central regions of South Dakota in the 2002 census .Regional average rental rates by land use are simple average (mean) values of usable responses . Statewide average cash rental rates for each land use are weighted by: (1) the relative number of acres in each land use, and (2) the proportion of farmland acres leased in each region .

��
Appendix Table 2. Average reported value and annual percentage change in value of South Dakota agricultural land
by type of land by region, 1991-2007.South- East- North- North- South- South- North-
Type of Land east Central east Central Central Central west west STATE
All Agricultural Land (nonirrigated) dollars per acre Average value, 2007 1768 1946 1422 945 899 521 322 285 850 Average value, 2006 1583 1643 1174 849 803 462 286 256 743 Average value, 2005 1372 1427 1029 736 711 414 275 211 650 Average value, 2004 1147 1162 779 629 594 377 223 192 541 Average value, 2003 1017 903 641 549 522 309 200 177 461 Average value, 2002 930 875 560 501 424 313 202 150 421 Average value, 2001 893 785 519 450 373 284 167 143 384 Average value, 2000 794 673 492 404 352 286 167 131 352 Average value, 1999 740 644 452 378 345 273 166 122 331 Average value, 1998 772 610 452 353 346 280 155 117 328 Average value, 1997 665 591 432 323 302 241 139 111 298 Average value, 1996 643 522 414 294 296 217 126 115 280 Average value, 1995 633 473 419 279 264 222 130 103 268 Average value, 1994 567 497 393 293 255 191 112 94 250 Average value, 1993 548 498 399 254 233 199 111 90 241 Average value, 1992 519 474 368 259 223 186 104 89 231 Average value, 1991 526 466 362 227 225 177 97 84 223
Av annual % change 07/91 7.9% 9.3% 8.9% 9.3% 9.0% 7.0% 7.8% 7.9% 8.7% Annual % change 07/06 11.7% 18.4% 21.1% 11.3% 12.0% 12.8% 12.6% 11.3% 14.4%
Nonirrigated Cropland dollars per acre Average value, 2007 1999 2244 1762 1187 1086 702 426 367 1375 Average value, 2006 1817 1914 1448 1088 986 612 387 342 1211 Average Value, 2005 1556 1659 1255 967 871 568 383 316 1064 Average Value, 2004 1315 1346 973 822 705 541 318 294 882 Average value, 2003 1156 1040 793 716 631 443 290 281 743 Average value, 2002 1057 1019 691 665 524 445 311 244 684 Average value, 2001 1023 911 652 592 456 423 245 223 626 Average value, 2000 910 785 620 520 436 417 248 208 567 Average value, 1999 866 756 565 488 435 402 246 202 534 Average value, 1998 903 728 564 452 434 399 241 200 534 Average value, 1997 777 699 535 412 386 348 217 188 486 Average value, 1996 751 613 514 372 371 317 214 191 455 Average value, 1995 732 555 522 353 332 326 237 185 437 Average value, 1994 661 590 488 382 331 289 218 169 426 Average value, 1993 655 595 497 326 305 302 197 163 412 Average value, 1992 616 574 460 342 300 287 196 167 400 Average value, 1991 623 554 450 294 300 272 185 153 384
Av annual % change 07/91 7.6% 9.1% 8.9% 9.1% 8.4% 6.1% 5.4% 5.6% 8.3% Annual % change 07/06 10.0% 17.2% 21.7% 9.1% 10.1% 14.7% 10.1% 7.3% 13.5%
Source: South Dakota Farm Real Estate Market Surveys, SDSU, 2007 and earlier. Statewide values by land use are based on 2002 regional land use weights
Appendix II. Historical data on agricultural land values and cash rental rates by land use by region, South dakota, 1991 – 2007

��
Appendix Table 2. (continued)South- East- North- North- South- South- North-
Type of Land east Central east Central Central Central west west STATE
Rangeland (native) dollars per acre Average value, 2007 1073 1293 889 634 708 448 295 265 448 Average value, 2006 925 1055 751 548 599 397 255 234 386 Average value, 2005 781 844 667 458 552 346 241 185 332 Average value, 2004 684 764 465 396 456 312 196 167 283 Average value, 2003 609 580 389 345 397 257 176 153 246 Average value, 2002 538 543 353 297 325 260 172 127 221 Average value, 2001 488 478 315 270 284 232 143 124 198 Average value, 2000 456 417 297 253 265 235 143 111 187 Average value, 1999 405 386 276 241 255 220 143 102 177 Average value, 1998 408 346 274 226 256 231 130 98 172 Average value, 1997 364 354 268 204 214 197 116 92 155 Average value, 1996 336 311 250 194 214 177 100 97 147 Average value, 1995 354 303 247 184 197 180 101 83 140 Average value, 1994 319 283 228 184 190 149 85 80 128 Average value, 1993 283 276 232 169 175 157 89 76 125 Average value, 1992 271 267 209 163 159 145 80 74 117 Average value, 1991 268 271 205 147 163 137 74 69 112
Av annual % change 07/91 9.1% 10.3% 9.6% 9.6% 9.6% 7.7% 9.0% 8.8% 9.1% Annual % change 07/06 16.0% 22.6% 18.4% 15.7% 18.2% 12.8% 15.7% 13.2% 16.1% Pasture (tame, improved) dollars per acre Average value, 2007 1167 1461 987 698 760 524 303 297 684 Average value, 2006 1085 1166 843 598 711 425 283 282 596 Average Value, 2005 937 1018 730 465 610 397 291 227 519 Average Value, 2004 754 818 517 424 518 337 217 198 420 Average value, 2003 683 710 448 389 493 294 191 163 372 Average value, 2002 639 607 391 327 345 287 193 156 327 Average value, 2001 564 522 342 301 332 258 176 153 297 Average value, 2000 516 481 334 289 303 268 167 144 279 Average value, 1999 453 437 314 266 290 240 161 125 256 Average value, 1998 461 406 297 264 302 272 161 120 254 Average value, 1997 416 373 299 236 265 222 138 114 230 Average value, 1996 379 358 279 231 258 188 127 115 217 Average value, 1995 385 346 262 218 214 214 117 102 206 Average value, 1994 371 335 251 200 224 194 109 93 196 Average value, 1993 326 333 249 194 194 193 104 98 188 Average value, 1992 328 306 257 194 190 176 100 88 182 Average value, 1991 315 325 252 170 199 163 92 94 179 Av annual % change 07/91 8.5% 9.8% 8.9% 9.2% 8.7% 7.6% 7.7% 7.5% 8.7% Annual % change 07/06 7.6% 25.3% 17.1% 16.7% 6.9% 23.3% 7.1% 5.3% 14.8%

��
Appendix Table 2. (continued)South- East North- North South- South- North-
Type of Land east Central east Central Central Central west west STATE dollars per acre Hayland Average value, 2007 1659 1637 1028 750 815 525 356 327 875 Average value, 2006 1383 1371 831 640 758 499 346 300 758 Average value, 2005 1312 1203 780 515 612 451 324 270 675 Average value, 2004 1008 992 586 432 516 391 265 245 549 Average value, 2003 932 770 488 379 486 310 228 227 474 Average value, 2002 863 770 412 352 375 325 238 204 439 Average value, 2001 844 735 359 332 337 281 201 181 406 Average value, 2000 722 577 330 317 310 293 203 175 365 Average value, 1999 619 562 317 278 293 294 194 163 340 Average value, 1998 668 504 330 265 295 291 178 149 335 Average value, 1997 553 507 316 262 253 258 169 150 307 Average value, 1996 568 451 314 219 273 232 156 146 293 Average value, 1995 562 365 336 213 229 230 164 145 279 Average value, 1994 489 409 279 235 237 204 137 124 263 Average value, 1993 435 398 275 188 205 204 140 121 244 Average value, 1992 416 336 237 179 197 193 135 119 226 Average value, 1991 461 358 252 169 190 197 126 122 233
Av annual % change 07/91 8.3% 10.0% 9.2% 9.8% 9.5% 6.3% 6.7% 6.4% 8.6% Annual % change 07/06 20.0% 19.4% 23.7% 17.2% 7.5% 5.2% 2.9% 9.0% 15.4%
South- East North- North Central/ Type of Land east Central east Central S. Central Western STATE
dollars per acreIrrigated land Average value, 2007 2547 2649 2100 1531 1381 1003 1713 Average value, 2006 2354 2305 1610 1329 1240 931 1533 Average value, 2005 1974 2097 1566 1017 1190 968 1397 Average value, 2004 1793 1678 1259 1210 865 782 1191 Average value, 2003 1629 1085 1034 1032 817 630 1018 Average value, 2002 1613 1228 935 690 639 568 936 Average value, 2001 1425 1069 863 687 630 576 871 Average value, 2000 1358 1036 802 619 593 575 834 Average value, 1999 1351 913 672 625 492 443 752 Average value, 1998 1245 950 686 676 549 508 763 Average value, 1997 1217 769 736 600 502 469 722 Average value, 1996 1083 714 662 504 460 453 657 Average value, 1995 1144 740 793 535 475 411 677 Average value, 1994 1043 790 683 568 520 433 662 Average value, 1993 979 765 583 547 506 491 650 Average value, 1992 985 844 641 450 470 451 635 Average value, 1991 942 665 563 433 460 419 592
Av annual % change 07/91 6.4% 9.0% 8.6% 8.2% 7.1% 5.6% 6.9% Annual % change 07/06 8.2% 14.9% 30.4% 15.2% 11.4% 7.7% 11.7%

��
Appendix Table 3. Reported cash rental rates of South Dakota agricultural land by type of land by region, 1991-2007.South- East North- North- South- South- North- State
Type of Land east Central east Central Central Central west west dollars per acre
Nonirrigated Cropland Average 2007 rate 92.30 91.65 77.85 56.75 48.95 32.70 23.35 21.80 64.80 Average 2006 rate 89.25 82.60 70.50 53.85 46.35 34.00 24.70 21.45 60.95 Average 2005 rate 87.20 82.6 65.70 49.40 45.80 31.50 24.90 22.90 58.90 Average 2004 rate 83.70 78.80 64.50 47.60 43.40 34.10 23.10 21.40 56.80 Average 2003 rate 78.80 74.70 59.50 44.90 40.60 29.20 22.00 21.00 53.25 Average 2002 rate 76.50 69.80 57.50 42.20 35.95 29.40 22.60 20.40 50.65 Average 2001 rate 72.95 64.60 52.20 37.80 35.30 27.20 20.10 17.50 47.00 Average 2000 rate 67.50 56.40 49.30 36.20 31.90 30.00 18.70 18.70 43.70 Average 1999 rate 63.20 56.00 46.20 36.00 33.20 27.00 19.50 16.90 42.30 Average 1998 rate 65.20 55.00 45.30 34.70 30.90 25.90 19.00 17.90 41.75 Average 1997 rate 57.40 49.20 44.70 32.70 29.30 23.60 19.10 19.30 38.70 Average 1996 rate 54.70 45.30 41.50 28.70 26.30 21.60 17.00 16.00 35.50 Average 1995 rate 52.50 42.10 40.40 27.60 25.10 21.00 17.60 15.90 34.05 Average 1994 rate 51.90 45.10 40.30 29.80 25.00 22.10 17.60 14.90 34.85 Average 1993 rate 51.80 47.10 40.30 26.60 24.20 22.80 16.60 14.60 34.40 Average 1992 rate 48.00 45.70 39.70 25.50 22.70 21.40 17.70 15.10 33.00 Average 1991 rate 49.30 43.20 38.50 24.50 23.20 22.20 15.90 13.50 32.40
Hayland Average 2007 rate 74.00 67.55 47.40 34.25 31.35 25.70 18.80 18.40 41.60 Average 2006 rate 72.90 60.50 40.20 30.20 34.60 27.30 19.55 18.15 39.80 Average 2005 rate 71.60 56.40 38.70 28.90 29.80 22.20 17.60 18.80 37.20 Average 2004 rate 68.50 53.40 36.80 27.10 28.40 24.80 18.50 17.70 36.05 Average 2003 rate 67.20 49.40 34.60 26.20 27.50 19.80 17.80 19.80 34.15 Average 2002 rate 63.70 49.20 31.00 23.40 21.10 20.40 15.50 17.50 31.70 Average 2001 rate 61.20 47.60 28.90 21.00 23.30 18.10 15.90 14.70 30.20 Average 2000 rate 57.80 40.10 28.80 20.30 21.10 19.40 15.10 14.30 28.45 Average 1999 rate 48.50 40.10 22.80 20.40 20.60 19.60 14.80 15.40 26.40 Average 1998 rate 51.40 40.50 24.60 19.40 20.90 18.90 14.20 13.60 27.10 Average 1997 rate 46.10 36.80 28.20 18.70 19.90 16.70 14.90 14.60 25.40 Average 1996 rate 41.50 32.30 26.00 17.00 18.60 15.20 12.60 11.20 22.70 Average 1995 rate 43.80 28.20 25.30 16.70 16.10 14.90 11.10 11.10 21.90 Average 1994 rate 39.50 31.40 23.60 17.00 17.80 15.50 11.90 11.30 21.90 Average 1993 rate 35.60 32.10 22.00 14.70 16.40 16.00 11.30 9.50 20.60 Average 1992 rate 33.30 25.90 20.00 14.20 15.60 15.60 11.40 12.10 19.20 Average 1991 rate 38.50 30.90 22.30 14.20 15.70 14.80 12.10 10.40 20.70
Source: South Dakota Farm Real Estate Market Surveys, SDSU, 2007 and earlier year reports.
Statewide rental rates based on 2002 land use weights.
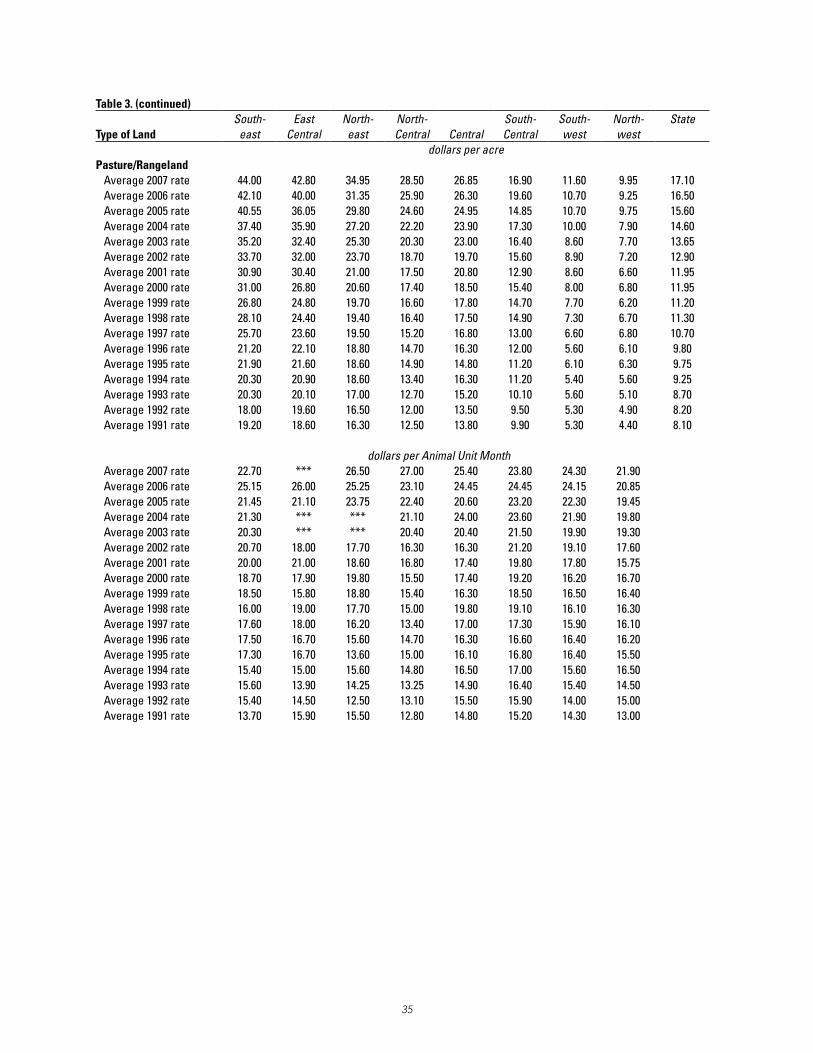
��
Table 3. (continued)South- East North- North- South- South- North- State
Type of Land east Central east Central Central Central west west dollars per acre
Pasture/Rangeland Average 2007 rate 44.00 42.80 34.95 28.50 26.85 16.90 11.60 9.95 17.10 Average 2006 rate 42.10 40.00 31.35 25.90 26.30 19.60 10.70 9.25 16.50 Average 2005 rate 40.55 36.05 29.80 24.60 24.95 14.85 10.70 9.75 15.60 Average 2004 rate 37.40 35.90 27.20 22.20 23.90 17.30 10.00 7.90 14.60 Average 2003 rate 35.20 32.40 25.30 20.30 23.00 16.40 8.60 7.70 13.65 Average 2002 rate 33.70 32.00 23.70 18.70 19.70 15.60 8.90 7.20 12.90 Average 2001 rate 30.90 30.40 21.00 17.50 20.80 12.90 8.60 6.60 11.95 Average 2000 rate 31.00 26.80 20.60 17.40 18.50 15.40 8.00 6.80 11.95 Average 1999 rate 26.80 24.80 19.70 16.60 17.80 14.70 7.70 6.20 11.20 Average 1998 rate 28.10 24.40 19.40 16.40 17.50 14.90 7.30 6.70 11.30 Average 1997 rate 25.70 23.60 19.50 15.20 16.80 13.00 6.60 6.80 10.70 Average 1996 rate 21.20 22.10 18.80 14.70 16.30 12.00 5.60 6.10 9.80 Average 1995 rate 21.90 21.60 18.60 14.90 14.80 11.20 6.10 6.30 9.75 Average 1994 rate 20.30 20.90 18.60 13.40 16.30 11.20 5.40 5.60 9.25 Average 1993 rate 20.30 20.10 17.00 12.70 15.20 10.10 5.60 5.10 8.70 Average 1992 rate 18.00 19.60 16.50 12.00 13.50 9.50 5.30 4.90 8.20 Average 1991 rate 19.20 18.60 16.30 12.50 13.80 9.90 5.30 4.40 8.10 dollars per Animal Unit Month Average 2007 rate 22.70 *** 26.50 27.00 25.40 23.80 24.30 21.90 Average 2006 rate 25.15 26.00 25.25 23.10 24.45 24.45 24.15 20.85 Average 2005 rate 21.45 21.10 23.75 22.40 20.60 23.20 22.30 19.45 Average 2004 rate 21.30 *** *** 21.10 24.00 23.60 21.90 19.80 Average 2003 rate 20.30 *** *** 20.40 20.40 21.50 19.90 19.30 Average 2002 rate 20.70 18.00 17.70 16.30 16.30 21.20 19.10 17.60 Average 2001 rate 20.00 21.00 18.60 16.80 17.40 19.80 17.80 15.75 Average 2000 rate 18.70 17.90 19.80 15.50 17.40 19.20 16.20 16.70 Average 1999 rate 18.50 15.80 18.80 15.40 16.30 18.50 16.50 16.40 Average 1998 rate 16.00 19.00 17.70 15.00 19.80 19.10 16.10 16.30 Average 1997 rate 17.60 18.00 16.20 13.40 17.00 17.30 15.90 16.10 Average 1996 rate 17.50 16.70 15.60 14.70 16.30 16.60 16.40 16.20 Average 1995 rate 17.30 16.70 13.60 15.00 16.10 16.80 16.40 15.50 Average 1994 rate 15.40 15.00 15.60 14.80 16.50 17.00 15.60 16.50 Average 1993 rate 15.60 13.90 14.25 13.25 14.90 16.40 15.40 14.50 Average 1992 rate 15.40 14.50 12.50 13.10 15.50 15.90 14.00 15.00 Average 1991 rate 13.70 15.90 15.50 12.80 14.80 15.20 14.30 13.00

��
Table 3. (continued)South- East- North- North- Central/
Type of Land east Central east Central S.Central Western State dollars per acre
Irrigated land Average 2007 rate 131.65 113.80 98.70 89.65 86.20 67.00 94.70 Average 2006 rate 121.20 109.50 96.25 84.75 81.25 62.85 88.90 Average 2005 rate 118.30 109.30 84.45 80.95 73.10 60.50 84.50 Average 2004 rate 118.80 103.80 97.50 75.00 73.20 56.90 83.85 Average 2003 rate 119.20 98.00 72.60 75.50 *** 58.20 80.00 Average 2002 rate 124.00 98.60 77.40 71.40 52.50 50.20 76.90 Average 2001 rate 106.00 84.40 77.00 65.00 67.10 48.00 72.65 Average 2000 rate 104.80 84.00 75.00 61.80 55.60 46.60 69.40 Average 1999 rate 100.00 63.80 69.50 63.80 45.20 40.00 62.45 Average 1998 rate 99.30 76.10 63.80 70.00 44.30 39.00 62.50 Average 1997 rate 100.20 72.20 63.00 59.30 46.40 42.00 63.00 Average 1996 rate 85.40 61.90 68.70 46.40 43.90 33.80 54.85 Average 1995 rate 89.50 68.00 76.70 65.40 45.80 44.00 61.60 Average 1994 rate 91.90 71.70 66.00 53.80 48.50 *** 61.30 Average 1993 rate 87.20 68.60 60.00 57.80 53.40 44.00 60.90 Average 1992 rate 65.20 70.00 69.20 58.50 49.80 47.50 56.70 Average 1991 rate 82.70 69.00 59.00 *** *** 37.50 ***
*** Insufficient number of reportsSource: South Dakota Farm Real Estate Market Surveys, SDSU, 2007 and earlier year reports.