South Central Labor Market Trends - Workforce Council Central Industry Sector Employment. ......
26
South Central Labor Market Trends
Transcript of South Central Labor Market Trends - Workforce Council Central Industry Sector Employment. ......

South Central Labor Market Trends

UnemploymentRegion Dec. 2014 Rate Dec. 2013 Rate
United States 5.4% 6.5%
Minnesota 3.7% 4.7%
South Central 3.6% 4.4%
Mankato-N. Mankato MSA
2.6% 3.5%
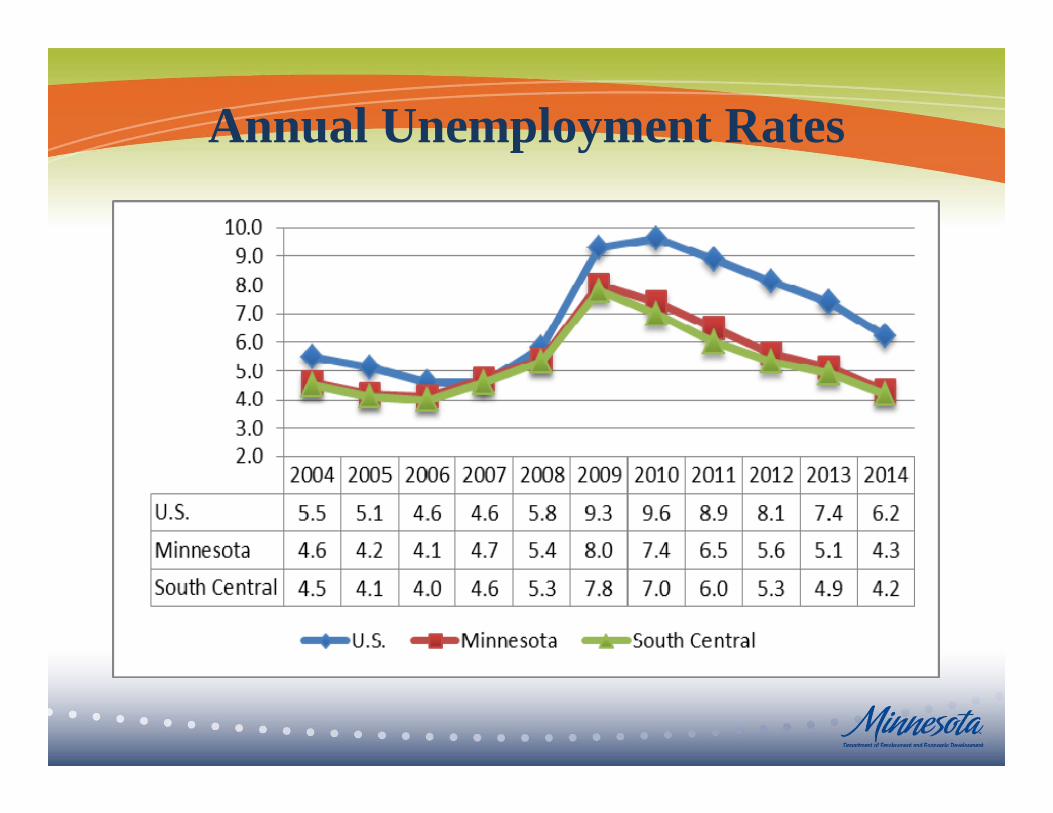
Annual Unemployment Rates

Annual Employment
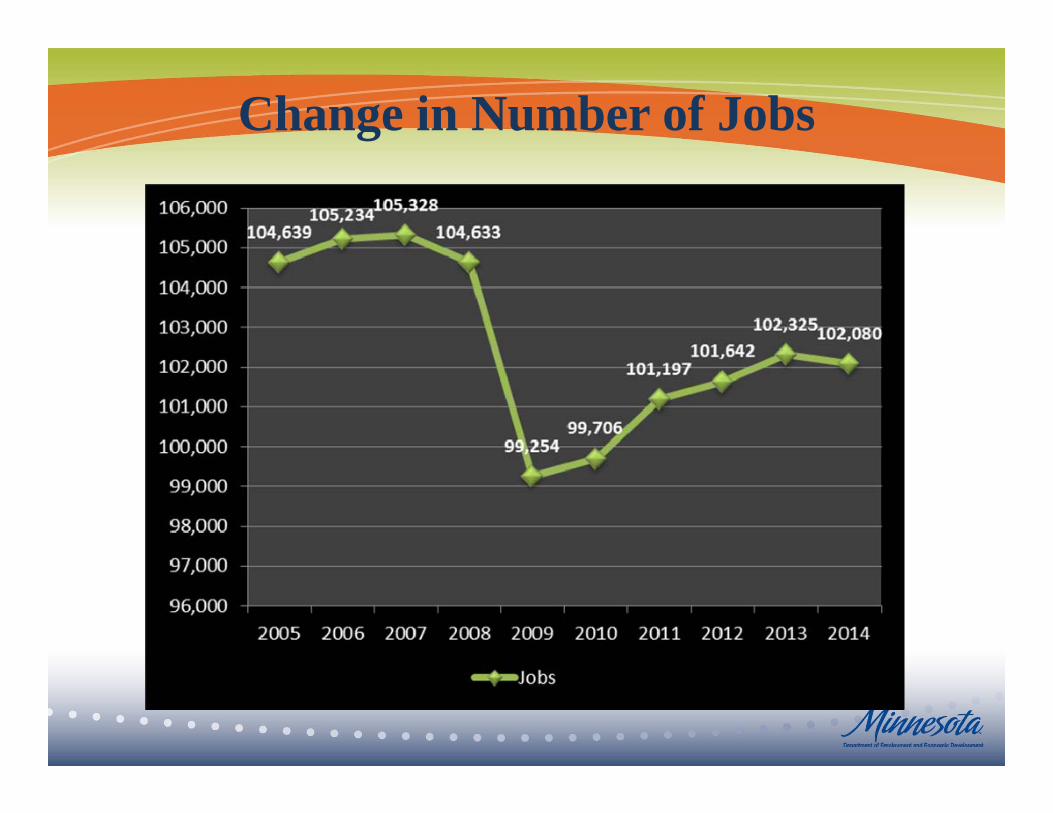
Change in Number of Jobs

Annual 2nd Quarter Employment Change

Employment Changes by CountyCounty Unemployment
Dec. 2014 Labor Force
Dec. 2014 Employment
Dec. 2014 Employment Change
Dec. 2013-2014 Employment Change
Q2, 2008-2014 Blue Earth 2.7% 40,169 39,084 +1,573 +3,264 Brown 3.8% 15,555 14,962 +154 +980 Faribault 4.5% 7,342 7,010 +131 -86 Le Sueur 5.6% 15,321 14,459 +566 +1,401 Martin 4.0% 10,631 10,201 +24 -596 Nicollet 2.5% 20,294 19,785 +797 +781 Sibley 4.0% 9,568 9,186 +38 +1,142 Waseca 4.3% 9,570 9,158 -1 -654 Watonwan 4.7% 5,681 5,414 +76 +254 SC Region 3.6% 134,131 129,259 +3,358 +6,486 Mankato-N. Mankato MSA
2.6% 60,463 58,869 +2,370 +4,045
Minnesota 3.7% 2,985,228 2,876,012 +58,604 +130,518 Source: DEED’s Local Area Unemployment Statistics (LAUS) and Quarterly Census of Employment and Wages

South Central Industry Sector Employment
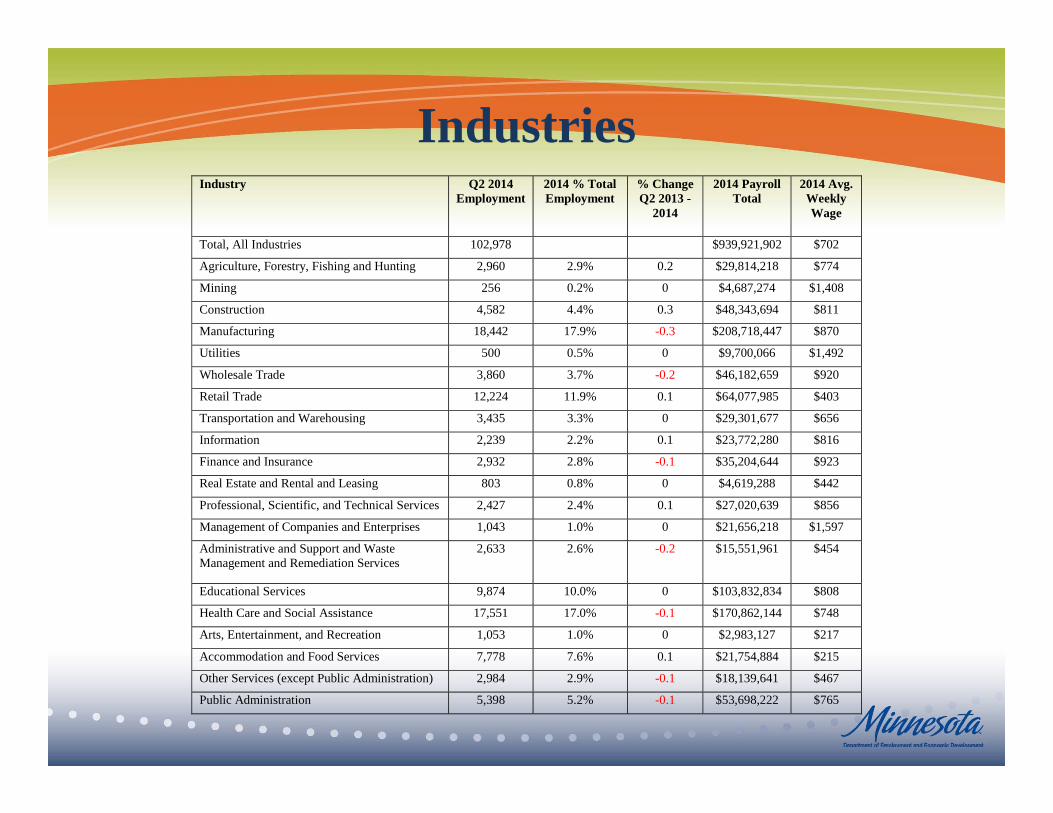
IndustriesIndustry Q2 2014
Employment 2014 % Total Employment
% Change Q2 2013 -
2014
2014 Payroll Total
2014 Avg. Weekly Wage
Total, All Industries 102,978 $939,921,902 $702
Agriculture, Forestry, Fishing and Hunting 2,960 2.9% 0.2 $29,814,218 $774
Mining 256 0.2% 0 $4,687,274 $1,408
Construction 4,582 4.4% 0.3 $48,343,694 $811
Manufacturing 18,442 17.9% -0.3 $208,718,447 $870
Utilities 500 0.5% 0 $9,700,066 $1,492
Wholesale Trade 3,860 3.7% -0.2 $46,182,659 $920
Retail Trade 12,224 11.9% 0.1 $64,077,985 $403
Transportation and Warehousing 3,435 3.3% 0 $29,301,677 $656
Information 2,239 2.2% 0.1 $23,772,280 $816
Finance and Insurance 2,932 2.8% -0.1 $35,204,644 $923
Real Estate and Rental and Leasing 803 0.8% 0 $4,619,288 $442
Professional, Scientific, and Technical Services 2,427 2.4% 0.1 $27,020,639 $856
Management of Companies and Enterprises 1,043 1.0% 0 $21,656,218 $1,597
Administrative and Support and Waste Management and Remediation Services
2,633 2.6% -0.2 $15,551,961 $454
Educational Services 9,874 10.0% 0 $103,832,834 $808
Health Care and Social Assistance 17,551 17.0% -0.1 $170,862,144 $748
Arts, Entertainment, and Recreation 1,053 1.0% 0 $2,983,127 $217
Accommodation and Food Services 7,778 7.6% 0.1 $21,754,884 $215
Other Services (except Public Administration) 2,984 2.9% -0.1 $18,139,641 $467
Public Administration 5,398 5.2% -0.1 $53,698,222 $765
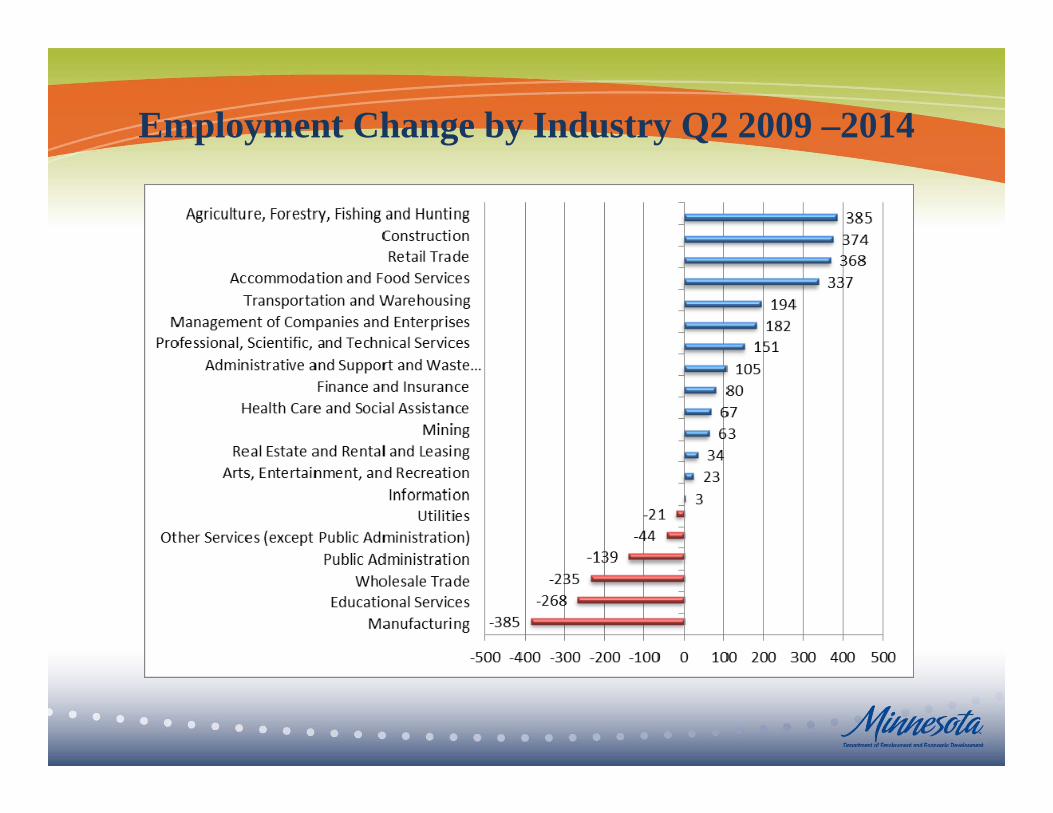
Employment Change by Industry Q2 2009 –2014

Median Hourly Wages – Mankato MSA
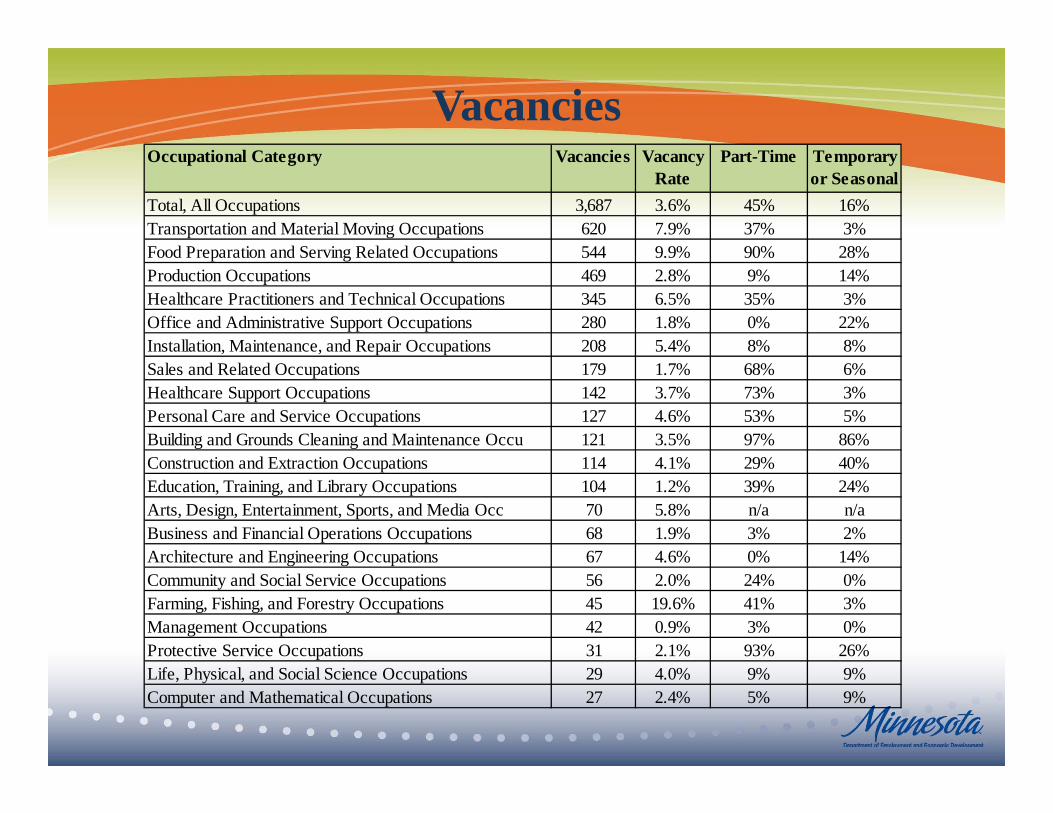
VacanciesOccupational Category Vacancies Vacancy
RatePart-Time Temporary
or SeasonalTotal, All Occupations 3,687 3.6% 45% 16%Transportation and Material Moving Occupations 620 7.9% 37% 3%Food Preparation and Serving Related Occupations 544 9.9% 90% 28%Production Occupations 469 2.8% 9% 14%Healthcare Practitioners and Technical Occupations 345 6.5% 35% 3%Office and Administrative Support Occupations 280 1.8% 0% 22%Installation, Maintenance, and Repair Occupations 208 5.4% 8% 8%Sales and Related Occupations 179 1.7% 68% 6%Healthcare Support Occupations 142 3.7% 73% 3%Personal Care and Service Occupations 127 4.6% 53% 5%Building and Grounds Cleaning and Maintenance Occu 121 3.5% 97% 86%Construction and Extraction Occupations 114 4.1% 29% 40%Education, Training, and Library Occupations 104 1.2% 39% 24%Arts, Design, Entertainment, Sports, and Media Occ 70 5.8% n/a n/aBusiness and Financial Operations Occupations 68 1.9% 3% 2%Architecture and Engineering Occupations 67 4.6% 0% 14%Community and Social Service Occupations 56 2.0% 24% 0%Farming, Fishing, and Forestry Occupations 45 19.6% 41% 3%Management Occupations 42 0.9% 3% 0%Protective Service Occupations 31 2.1% 93% 26%Life, Physical, and Social Science Occupations 29 4.0% 9% 9%Computer and Mathematical Occupations 27 2.4% 5% 9%
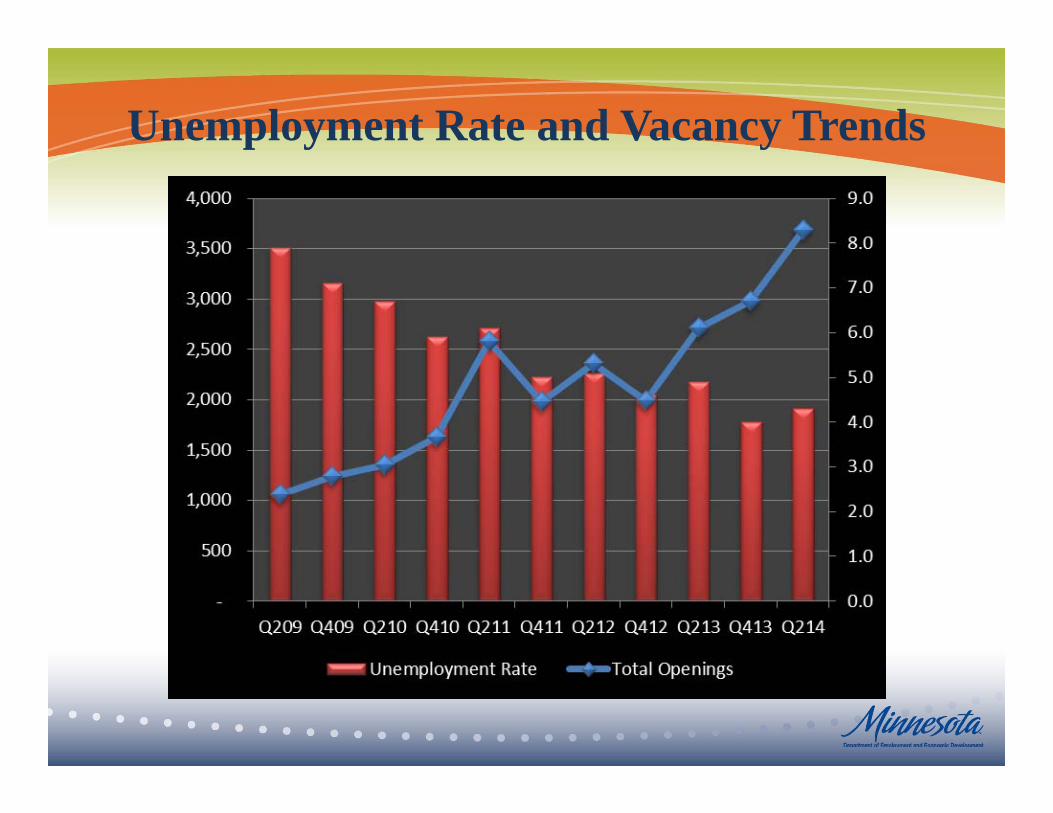
Unemployment Rate and Vacancy Trends

Most Replacement JobsOccupational Category Replacement Jobs Sales and Related 5,920 Office and Administrative Support 5,690 Food Preparation and Serving Related 5,550 Production 4,710 Management 3.920 Transportation and Material Moving 3,070 Education, Training and Library 2,490 Installation, Maintenance and Repair 2,040 Healthcare Practitioners and Technical 1,950 Personal Care and Service 1,840 Healthcare Support 1,560 Building and Grounds Maintenance 1,450 Construction and Extraction 1,350 Business and Financial Operations 1,220 Community and Social Service 1,100 Farming, Fishing and Forestry 1,090 Protective Service 890 Arts, Design, Entertainment, Sports and Media 700 Architecture and Engineering 530 Life, Physical and Social Science 490 Computer and Mathematical 280 Legal 140

Most New JobsOccupational Category Total Jobs Sales and Related 6,370 Office and Administrative Support 6,170 Food Preparation and Serving Related 6,030 Production 5,660 Management 4,230 Personal Care and Service 3,740 Transportation and Material Moving 3,620 Healthcare Practitioners and Technical 2,810 Installation, Maintenance and Repair 2,580 Education, Training and Library 2,530 Healthcare Support 2,380 Construction and Extraction 2,070 Building and Grounds Cleaning and Maintenance 1,780 Business and Financial Operations 1,490 Community and Social Service 1,400 Farming, Fishing and Forestry 1,150 Protective Service 900 Arts, Design, Entertainment, Sports and Media 730 Life, Physical and Social Science 590 Architecture and Engineering 580 Computer and Mathematical 340 Legal 190

Total Openings

Projections
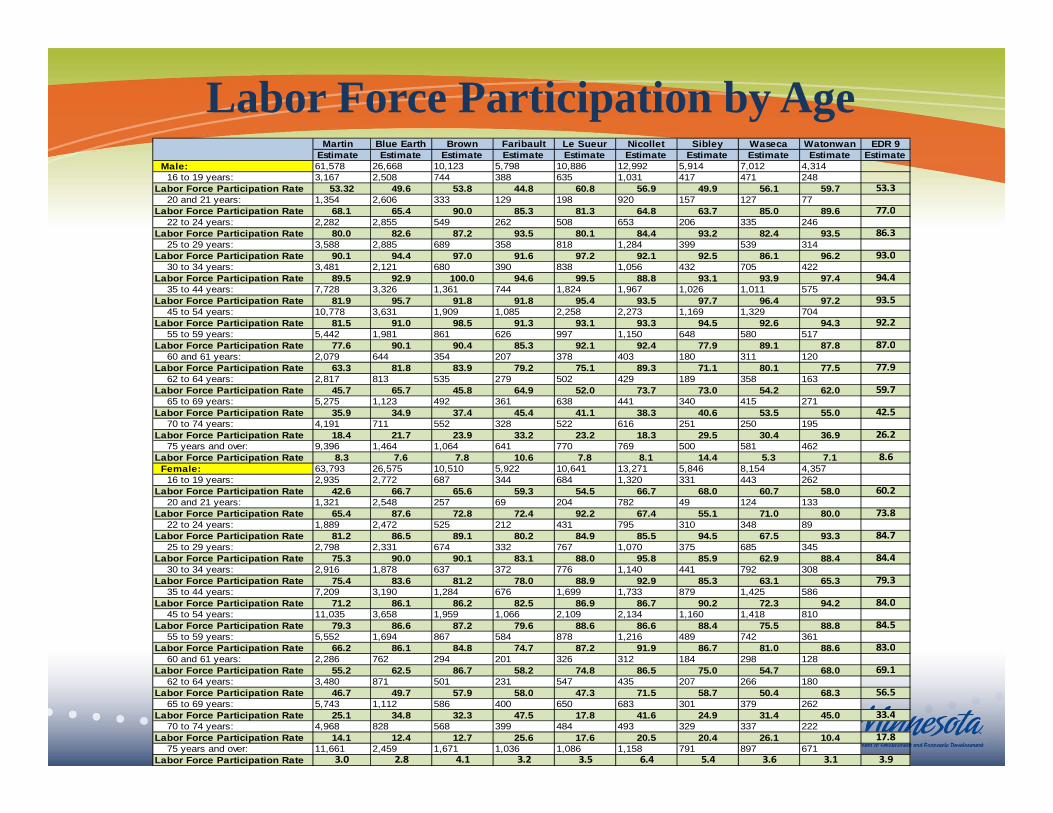
Labor Force Participation by AgeMartin Blue Earth Brown Faribault Le Sueur Nicollet Sibley Waseca Watonwan EDR 9
Estimate Estimate Estimate Estimate Estimate Estimate Estimate Estimate Estimate Estimate26,668 10,123 5,798 10,886 12,992 5,914 7,012 4,3142,508 744 388 635 1,031 417 471 248
49.6 53.8 44.8 60.8 56.9 49.9 56.1 59.7 53.32,606 333 129 198 920 157 127 77
65.4 90.0 85.3 81.3 64.8 63.7 85.0 89.6 77.02,855 549 262 508 653 206 335 246
82.6 87.2 93.5 80.1 84.4 93.2 82.4 93.5 86.32,885 689 358 818 1,284 399 539 314
94.4 97.0 91.6 97.2 92.1 92.5 86.1 96.2 93.02,121 680 390 838 1,056 432 705 422
92.9 100.0 94.6 99.5 88.8 93.1 93.9 97.4 94.43,326 1,361 744 1,824 1,967 1,026 1,011 575
95.7 91.8 91.8 95.4 93.5 97.7 96.4 97.2 93.53,631 1,909 1,085 2,258 2,273 1,169 1,329 704
91.0 98.5 91.3 93.1 93.3 94.5 92.6 94.3 92.21,981 861 626 997 1,150 648 580 517
90.1 90.4 85.3 92.1 92.4 77.9 89.1 87.8 87.0644 354 207 378 403 180 311 120
81.8 83.9 79.2 75.1 89.3 71.1 80.1 77.5 77.9813 535 279 502 429 189 358 163
65.7 45.8 64.9 52.0 73.7 73.0 54.2 62.0 59.71,123 492 361 638 441 340 415 271
34.9 37.4 45.4 41.1 38.3 40.6 53.5 55.0 42.5711 552 328 522 616 251 250 195
21.7 23.9 33.2 23.2 18.3 29.5 30.4 36.9 26.21,464 1,064 641 770 769 500 581 462
7.6 7.8 10.6 7.8 8.1 14.4 5.3 7.1 8.626,575 10,510 5,922 10,641 13,271 5,846 8,154 4,3572,772 687 344 684 1,320 331 443 262
66.7 65.6 59.3 54.5 66.7 68.0 60.7 58.0 60.22,548 257 69 204 782 49 124 133
87.6 72.8 72.4 92.2 67.4 55.1 71.0 80.0 73.82,472 525 212 431 795 310 348 89
86.5 89.1 80.2 84.9 85.5 94.5 67.5 93.3 84.72,331 674 332 767 1,070 375 685 345
90.0 90.1 83.1 88.0 95.8 85.9 62.9 88.4 84.41,878 637 372 776 1,140 441 792 308
83.6 81.2 78.0 88.9 92.9 85.3 63.1 65.3 79.33,190 1,284 676 1,699 1,733 879 1,425 586
86.1 86.2 82.5 86.9 86.7 90.2 72.3 94.2 84.03,658 1,959 1,066 2,109 2,134 1,160 1,418 810
86.6 87.2 79.6 88.6 86.6 88.4 75.5 88.8 84.51,694 867 584 878 1,216 489 742 361
86.1 84.8 74.7 87.2 91.9 86.7 81.0 88.6 83.0762 294 201 326 312 184 298 128
62.5 86.7 58.2 74.8 86.5 75.0 54.7 68.0 69.1871 501 231 547 435 207 266 180
49.7 57.9 58.0 47.3 71.5 58.7 50.4 68.3 56.51,112 586 400 650 683 301 379 262
34.8 32.3 47.5 17.8 41.6 24.9 31.4 45.0 33.4828 568 399 484 493 329 337 222
12.4 12.7 25.6 17.6 20.5 20.4 26.1 10.4 17.82,459 1,671 1,036 1,086 1,158 791 897 671
2.8 4.1 3.2 3.5 6.4 5.4 3.6 3.1 3.9
3,16761,578
3,480
2,286
Labor Force Participation Rate 3.0
Labor Force Participation Rate 14.1 75 years and over: 11,661
Labor Force Participation Rate 25.1 70 to 74 years: 4,968
Labor Force Participation Rate 46.7 65 to 69 years: 5,743
62 to 64 years:Labor Force Participation Rate 55.2
Labor Force Participation Rate 60 and 61 years:
66.2
Labor Force Participation Rate 79.3 55 to 59 years: 5,552
45 to 54 years:Labor Force Participation Rate 71.2
11,035
Labor Force Participation Rate 35 to 44 years: 7,209
Labor Force Participation Rate 75.3 30 to 34 years: 2,916
75.4
25 to 29 years:Labor Force Participation Rate 81.2
2,798
Labor Force Participation Rate 22 to 24 years: 1,889
Labor Force Participation Rate 42.6 20 and 21 years: 1,321
65.4
16 to 19 years:
Labor Force Participation Rate 8.3 Female: 63,793
2,935
Labor Force Participation Rate 18.4 75 years and over: 9,396
Labor Force Participation Rate 35.9 70 to 74 years: 4,191
Labor Force Participation Rate 45.7 65 to 69 years: 5,275
62 to 64 years:Labor Force Participation Rate 63.3
2,817
Labor Force Participation Rate 60 and 61 years: 2,079
Labor Force Participation Rate 81.5 55 to 59 years: 5,442
77.6
45 to 54 years:Labor Force Participation Rate 81.9
10,778
Labor Force Participation Rate 35 to 44 years: 7,728
Labor Force Participation Rate 90.1 30 to 34 years: 3,481
89.5
25 to 29 years:Labor Force Participation Rate 80.0
3,588
Labor Force Participation Rate 22 to 24 years: 2,282
Labor Force Participation Rate 53.32 20 and 21 years: 1,354
68.1
16 to 19 years: Male:

Labor Force Participation By Age

Educational Attainment by County
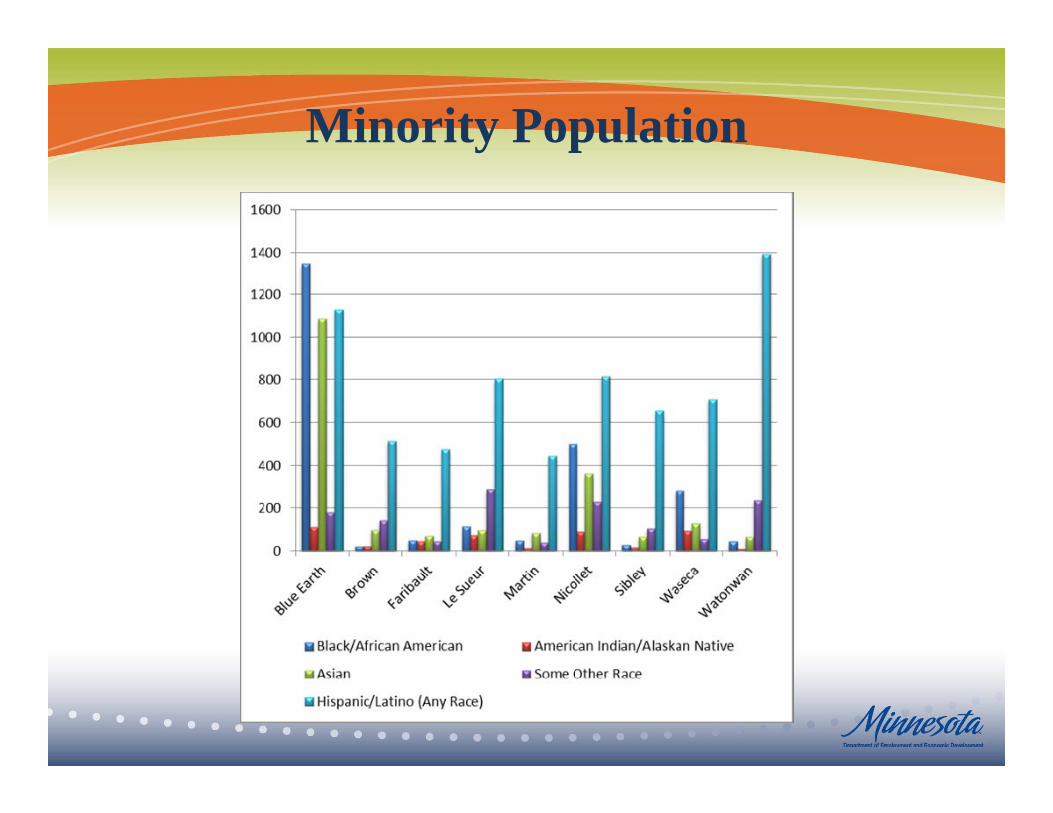
Minority Population

Percent Minority in Labor Force

Poverty


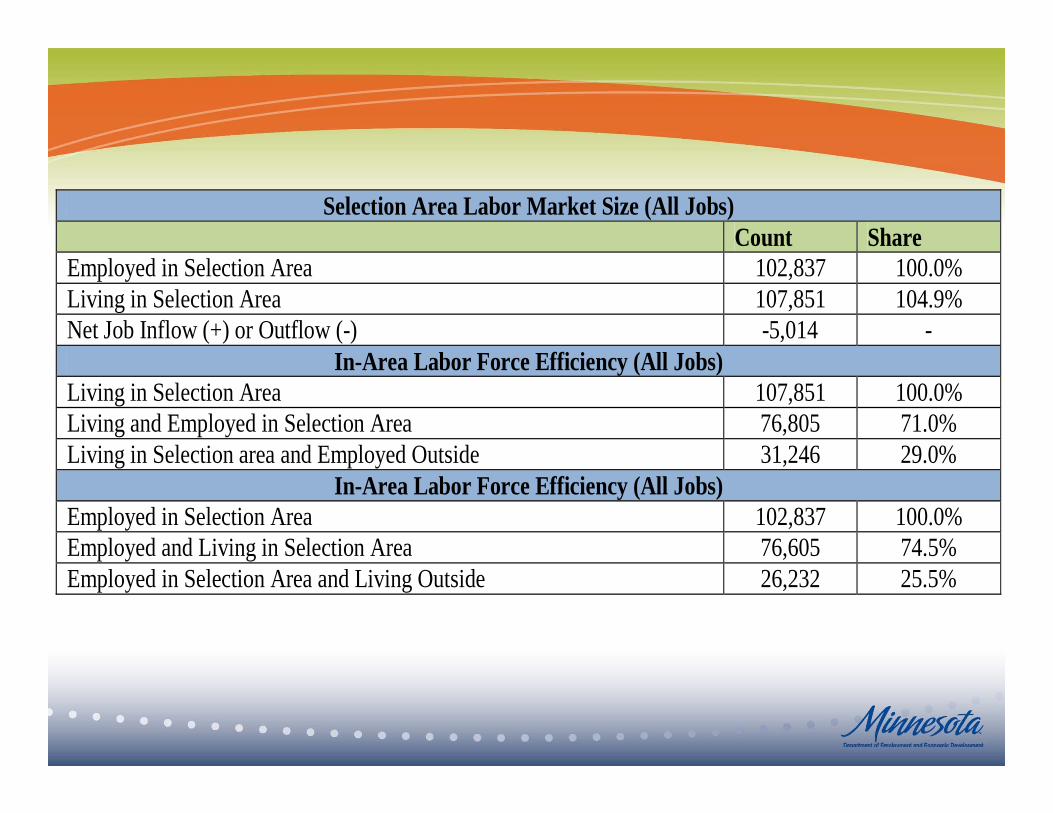
Selection Area Labor Market Size (All Jobs) Count Share Employed in Selection Area 102,837 100.0% Living in Selection Area 107,851 104.9% Net Job Inflow (+) or Outflow (-) -5,014 -
In-Area Labor Force Efficiency (All Jobs) Living in Selection Area 107,851 100.0% Living and Employed in Selection Area 76,805 71.0% Living in Selection area and Employed Outside 31,246 29.0%
In-Area Labor Force Efficiency (All Jobs) Employed in Selection Area 102,837 100.0% Employed and Living in Selection Area 76,605 74.5% Employed in Selection Area and Living Outside 26,232 25.5%