South Carolina Solid Waste Management - DHEC South Carolina Solid Waste Management Annual Report for...
124
South Carolina Solid Waste Management Annual Report l Fiscal Year 2013 Catherine B. Templeton, Director S.C. Department of Health and Environmental Control
Transcript of South Carolina Solid Waste Management - DHEC South Carolina Solid Waste Management Annual Report for...

South Carolina
Solid Waste Management
Annual Report l Fiscal Year 2013Catherine B. Templeton, Director
S.C. Department of Health and Environmental Control


South Carolina Solid Waste Management Annual Report for Fiscal Year 2013 1
SECTION 1: Introduction ............................................................ 1
SECTION 2: Executive Summary .................................................. 3
SECTION 3: Recommendations for Improving Solid Waste Management .......................................................... 7
SECTION 4: Recycling’s Economic Impact ................................. 15
The Local Cost of Solid Waste Management ......................... 21
SECTION 5: Recycling by Commodity........................................ 22
Commingled Collection ........................................................ 30
SECTION
1The mission of the S.C. Department of Health and Environmental Control (DHEC) is to protect human health and the environment. Safe and efficient management of solid waste is an essential part of that responsibility.
The S.C. Solid Waste Policy and Management Act of 1991 (Act) – S.C. Code of Laws §§ 44-96-10 et seq. – supports this mission by establishing a comprehensive framework for the proper management of solid waste. For example, the Act:
l authorizes DHEC to establish solid waste regulations;
l requires DHEC to develop a state solid waste management plan (State Plan) and for county governments or regions to develop plans that are consistent with the State Plan; and
l sets statewide recycling and waste reduction goals.
The Act – S.C. Code of Laws § 44-96-60 – also mandates that DHEC publish an annual report – based in part on the information that counties and permitted solid waste facilities are required to provide – on solid waste management for the previous fiscal year (FY). The “South Carolina Solid Waste Management Annual Report” must be submitted to the Governor and General Assembly annually by March 15.
This report includes:
l detailed information (by county and statewide) on the amount of material recycled by commodity (e.g., glass, metal, paper, plastic, banned items, miscellaneous items and commingled recyclables);
l a summary of the state’s used motor oil recycling program targeting do-it-yourself oil changers;
l recycling data for state agencies and colleges/universities;
l key state programs that assist local governments in meeting the requirements of the Act including the state’s recycling and waste reduction goals;
l a summary of the economic benefits of recycling;
l the amount and type of solid waste disposed of as well as a list of permitted solid waste facilities;
l solid waste import and export data;
l remaining life estimates for landfills;
l planning and demonstration of need; and
l recommendations for improving solid waste management.
This report – which reflects solid waste management activities in FY 2013 (July 1, 2012 to June 30, 2013) – measures and defines two types of solid waste: municipal solid waste (MSW); and total solid waste (TSW).
Continued on the following page
Introduction
SECTION 6: Used Motor Oil Recycling ....................................... 31
SECTION 7: Recycling: State Agencies & Colleges/Universities .. 34
SECTION 8: Recycling: The State & Counties at a Glance .......... 39
SECTION 9: Disposal ................................................................. 87
Import and Export of Solid Waste ........................................ 89
State & County MSW Recycling, Disposal & Generation Rates ................................................ 97
SECTION 10: Permitted Solid Waste Facilities.......................... 102
SECTION 11: Solid Waste Planning ......................................... 107
Table of Contents

2 South Carolina Solid Waste Management Annual Report for Fiscal Year 2013
About this ReportThe “South Carolina Solid Waste Management Annual Report for Fiscal Year 2013” is submitted by the S.C. Department of Health and Environmental Control (DHEC) in compliance with the S.C. Solid Waste Policy and Management Act of 1991 (S.C. Code of Laws § 44-96-60). Additionally, Act 119 of 2005 mandates that agencies provide all reports to the General Assembly in an electronic format.
This report was published on March 15, 2014 by DHEC’s Division of Mining and Solid Waste Management.
The report serves as an update to the State Plan.
DIVISION DIRECTOR: Kent M. Coleman
EDITOR: Amanda St. John
WRITERS: Richard Chesley, Anne McGovern, Stacey Washington and Jana White
LAYOUT/GRAPHIC DESIGN: Gregg Glymph
CONTRIBUTORS/ACKNOWLEDGEMENTS: Karla Isaac, Justin Koon, Michaela Kraus, Joan Litton and Stefanie Vandiver
ECONOMIC IMPACT DATA: Chantal Fryer and Tonya Lott, S.C. Department of Commerce
MSW is mostly comprised of waste generated by households, businesses, institutions, offices and non-profits. TSW is comprised of MSW as well as construction and demolition debris, land-clearing debris and industrial solid waste. See Table 2.2 for the definitions of MSW and TSW.
The distinctions between TSW and MSW are important. TSW, for example, includes all solid waste and provides a more comprehensive look at how much material is generated, disposed of and kept out of landfills by recycling. MSW, conversely, is limited and reflects specific activities and material.
The Act – S.C. Code of Laws § 44-96-80 – requires each county to report annually the amount of MSW recycled within its jurisdiction to DHEC. The Act – S.C. Code of Laws §§ 44-96-10 et seq. – and subsequent regulation (R.61.107.19) also requires permitted public and private solid waste landfills to report annually the amount and type of solid waste disposed of to DHEC.
In 1991, the state’s recycling and disposal goals were based on TSW. In 2000, the state adopted the U.S. Environmental Protection Agency’s definition for measuring MSW with some exceptions.
DHEC set new MSW waste reduction and recycling goals in the FY11 report. The state’s goals are by 2020 to:
l recycle 40 percent or more of its MSW; and
l reduce the average disposal to 3.25 pounds per person per day or less.
When Using this ReportWhen reviewing the tables in this report, it is important to note that – generally – recycling tonnage is rounded to the nearest hundredth and disposal data is rounded to the nearest ton. Some totals do not add up due to rounding of numbers.
MethodologyCounty governments, state agencies and state-supported colleges and universities are required to report annually to DHEC on their recycling efforts. Permitted solid waste facilities also are required to submit annual reports to DHEC on their disposal activities.
In addition, recycling data is collected from municipalities, businesses and the recycling industry. These entities are not required to report; therefore, data collection from these sources is inconsistent from year to year. The data collected is allocated to the counties where the material was generated.
Recycling data is compiled and carefully vetted. Disposal data also is collected and vetted as well as allocated to the county of generation. Recycling and disposal data are then combined to arrive at the solid waste generation tonnage.
Recycling Rate EquationThe equation below is used for calculating the MSW and TSW recycling rates.
RECYCLING RATE (%) =
AMOUNT RECYCLEDX 100
AMOUNT GENERATED*
*Generated = Recycled + Disposed Of
DHEC set new waste reduction
and recycling goals in FY11 to be reached by
2020.
The goals are to recycle
40 percent of the state’s MSW
and reduce disposal to 3.25
pounds per person per day.

South Carolina Solid Waste Management Annual Report for Fiscal Year 2013 3
SECTION
2This report provides a comprehensive overview of the amount of solid waste generated, disposed of and recycled in South Carolina for fiscal year (FY) 2013 (July 1, 2012 to June 30, 2013) as required by the S.C. Solid Waste Policy and Management Act of 1991 (Act) – S.C. Code of Laws § 44-96-60.
Two specific types of waste – municipal solid waste (MSW) and total solid waste (TSW) are defined and measured. As required by the Act, the focus of this report is on MSW.
The amount of MSW generated (disposed of plus recycled) was 4,357,812 tons. Of that amount:
l 1,371,960 tons (31.5 percent) were recycled; and
l 2,985,852 tons (68.5 percent) were disposed of in MSW landfills (including MSW generated in South Carolina, but disposed of out of state).
Here are additional MSW data indicators from FY13.
l The amount of MSW recycled increased 142,860 tons (more than 11 percent) in FY13.
l The state’s MSW recycling rate improved from 29.5 percent in FY12 to 31.5 percent in FY13. This is the fourth straight year the rate has increased. (See Chart 2.3.)
l The per capita MSW recycling rate also increased. On average, each South Carolinian recycled 1.59 pounds per person per day (p/p/d) in FY13 – up from 1.44 p/p/d in FY12.
l On average, each South Carolinian recycled more than 580 pounds of MSW in FY13.
l Electronics recycling jumped from 9,258 tons in FY12 to 11,560 tons in FY13 – about a 25 percent increase.
l Local governments reported earning more than $9 million from the sale of recyclables in FY13 and more than $67 million since FY07.
Executive Summary
CHART 2.1: MSW Management in South Carolina
RECYCLED 31.5%
DISPOSED OF IN LANDFILLS 68.5%
More than 1.3 million tons of MSW were
recycled in FY13 – the most since
FY07.
TABLE 2.2: What is MSW and TSW?
South Carolina voluntarily adopted the U.S. Environmental Protection Agency’s (EPA) definition of MSW in 2000.
EXAMPLES OF MSW EXAMPLES OF TSW
MSW is defined as paper, cans, bottles, food scraps, yard trimmings, packaging and other items. MSW may be generated by residential, commercial, institutional and industrial sources. South Carolina expanded its MSW definition (beyond EPA’s definition) to include tire-derived fuel, yard trimmings used as boiler fuel and used motor oil from do-it-yourselfers.
TSW includes MSW as well as industrial process waste (e.g., scraps and by-products from the manufacturing process), construction and demolition (C&D) debris, land-clearing debris, automobile bodies, combustion ash and other items.

4 South Carolina Solid Waste Management Annual Report for Fiscal Year 2013
Of the 7.7 million tons recycled, the majority (53 percent) of the material was yard trimmings that were recycled into mulch and compost or used as boiler fuel.
Overall, the amount of TSW generated increased from more than 13 million tons in FY12 to more than 15 million tons in FY13.
TSW per capita disposal increased from 9 p/p/d in FY12 to 9.2 p/p/d in FY13.
l The amount of MSW disposed of in FY13 increased nearly 50,000 tons (almost 2 percent) from the previous FY’s total of 2,935,876 tons.
l MSW per capita disposal increased for the first time in eight years from 3.4 p/p/d in FY12 to 3.5 p/p/d in FY13.
The TSW recycling rate improved to more than 49 percent in FY13.
The amount of TSW recycled increased about 45 percent from 5.3 million tons in FY12 to more than 7.7 million tons in FY13.
CHART 2.4 South Carolina’s TSW Recycling Rate by Percentage, FY09 to FY13
0
10
20
30
40
50
29.526.7
38.640.8
49.3
FY09 FY10 FY11 FY12 FY13
CHART 2.3: South Carolina’s MSW Recycling Rate by Percentage, FY09 to FY13
0
5
10
15
20
25
30
35
22.1
25.527.7
29.531.5
FY09 FY10 FY11 FY12 FY13
South Carolinians recycled
31.5%
of all MSW in FY13.
MSW recycling
increased more than
11%
from FY12 to FY13.
Household electronics recycling increased
about
25%
from FY12 to FY13.
Each South Carolinian
recycled more than
580 pounds of MSW
in FY13.
The amount of TSW recycled
improved to more than 49 percent
in FY13.
Of the 7.7 million tons recycled, the majority
(53 percent) of the material was yard trimmings.

South Carolina Solid Waste Management Annual Report for Fiscal Year 2013 5
CHART 2.6: TSW Disposed of in Pounds Per Person Per Day, FY09 to FY13
0
2
4
6
8
10
FY13FY12FY11FY10FY09
9.59.1 9.3 9.0 9.1
CHART 2.5: MSW Disposed of in Pounds Per Person Per Day, FY09 to FY13
0.0
0.5
1.0
1.5
2.0
2.5
3.0
3.5
4.0
FY13FY12FY11FY10FY09
3.93.7 3.6
3.4 3.5
Of the 7.7 million
tons of TSW recycled, more than
53% were yard trimmings.
TSW recycling increased about
45%
in FY13.
Each South Carolinian
disposed of about
3.5 pounds of MSW
in FY13.
Each South Carolinian disposed
of more than
9 pounds of TSW
in FY13.
TABLE 2.7: S.C. Recycling Data by FY
FY09 FY10 FY11 FY12 FY13
MSW Recycled in Tons 912,961 1,063,521 1,172,768 1,229,100 1,371,960
MSW Recycling Rate by Percent 22.1 25.5 27.7 29.5 31.5
MSW Recycled in p/p/d 1.1 1.3 1.4 1.4 1.6
TSW Recycled in Tons 3,239,918 2,781,003 4,913,823 5,314,842 7,700,976
TSW Recycling Rate by Percent 29.5 26.7 38.6 40.8 49.3
TSW Recycled in p/p/d 3.9 3.4 5.8 6.2 8.9

6 South Carolina Solid Waste Management Annual Report for Fiscal Year 2013
TABLE 2.8: S.C. Waste Disposed of by FY
FY09 FY10 FY11 FY12 FY13
MSW Disposed of in Tons 3,226,412 3,113,365 3,065,806 2,935,876 2,985,852
MSW Disposed of in p/p/d 3.9 3.7 3.6 3.4 3.5
TSW Disposed of in Tons 7,789,1431 7,602,7011 7,824,312 7,696,559 8,573,103
TSW Disposed of in p/p/d 9.5 9.1 9.3 9.0 9.2
TABLE 2.9: S.C. Waste Generated by FY
FY09 FY10 FY11 FY12 FY13
MSW Generated in Tons 4,139,373 4,176,886 4,238,574 4,164,976 4,357,812
MSW Generated in p/p/d 5.0 5.0 5.0 4.9 5.1
TSW Generated in Tons 10,983,3641 10,383,7031 12,738,135 13,011,401 15,607,497
TSW Generated in p/p/d 13.4 12.5 15.1 15.2 18.1
TABLE 2.10: S.C. Population
2009 2010 2011 2012 20132
Population 4,494,435 4,576,446 4,625,364 4,679,230 4,723,723
NOTES 1. This number does not include the ash disposed of at Charleston County’s Bees Ferry Landfill. 2. The population data used in this report reflects the most recent estimate available from the U.S. Census Bureau.

South Carolina Solid Waste Management Annual Report for Fiscal Year 2013 7
The S.C. Solid Waste Policy and Management Act of 1991 (Act) – S.C. Code of Laws § 44-96-60 – requires the S.C Department of Health and Environmental Control (DHEC) to make recommendations on how to improve solid waste management in the state.
Since the passage of the Act, South Carolina has made signifcant progress developing a system that: 1) ensures facilities that manage solid waste are properly designed and operated to protect human health and the environment; and 2) promotes waste reduction and recycling.
While much has been accomplished, much remains to be done. To improve solid waste management, two primary challenges must be addressed – making solid waste management cost effective and increasing the state’s recycling rate.
According to full-cost disclosure reports submitted to DHEC, local governments spent more than $330 million to manage solid waste in fiscal year (FY) 2013 (July 1, 2012 to June 30, 2013) and more than $1.2 billion since FY10. See “The Local Cost of Solid Waste Management” on page 21. Clearly, each program should ask how it can be more efficient and cost effective while remaining environmentally responsible.
In addition, although South Carolina’s municipal solid waste (MSW) recycling rate improved for the fourth consecutive year, almost 70 percent of the MSW generated was thrown away in FY13.
Increased recycling is part of the solution. It makes programs more cost efficient by providing the opportunity to avoid disposal costs and earn revenue from the sale of valuable commodities. Recycling also plays a key role in the state’s economy by creating and sustaining businesses and jobs. See Section 4, “Recycling’s Economic Impact.”
The state should continue to work to improve its solid waste management efforts – centered on waste reduction, recycling and composting. South Carolina should:
l reduce the amount of waste it generates and disposes of;
l maximize waste reduction, recycling and composting;
l promote and stimulate the purchase and use of recycled-content products;
SECTION
3Recommendations
for Improving Solid Waste Management l promote and help build local and
statewide recycling markets; and
l provide comprehensive outreach and education programs and campaigns.
The recommendations that follow are strategies to build on the basic foundation of solid waste management outlined above. These strategies, if implemented, will help South Carolina manage its waste more efficiently, achieve its waste reduction and recycling goals and realize more of recycling’s potential economic and environmental benefits.
Update the state plan, review measurement and improve reporting.Smart planning at both the state and local level will allow South Carolina to make short- and long-term decisions that promote efficient and environmentally responsible solid waste management. These efforts, in turn, will help the state meet its recycling and waste reduction goals.
Strategies to update the state’s planning and reporting efforts ...
Revise the S.C. Solid Waste Management Plan to include long-term projections on MSW disposal, an evaluation of solid waste management practices, discussion of new technologies and recommendations to improve solid waste management.
Evaluate current strategies and methodologies used to measure waste reduction and recycling.
Continue to encourage improved reporting through the S.C. Smart Business Recycling Program and the Green Hospitality Program. Continue to encourage local governments to gather data from businesses that recycle.
Evaluate the process local governments use to measure the true cost of solid waste services and develop options (e.g., new methodology, training) that would result in more consistent and meaningful data collection.
8 South Carolina Solid Waste Management Annual Report for Fiscal Year 2013
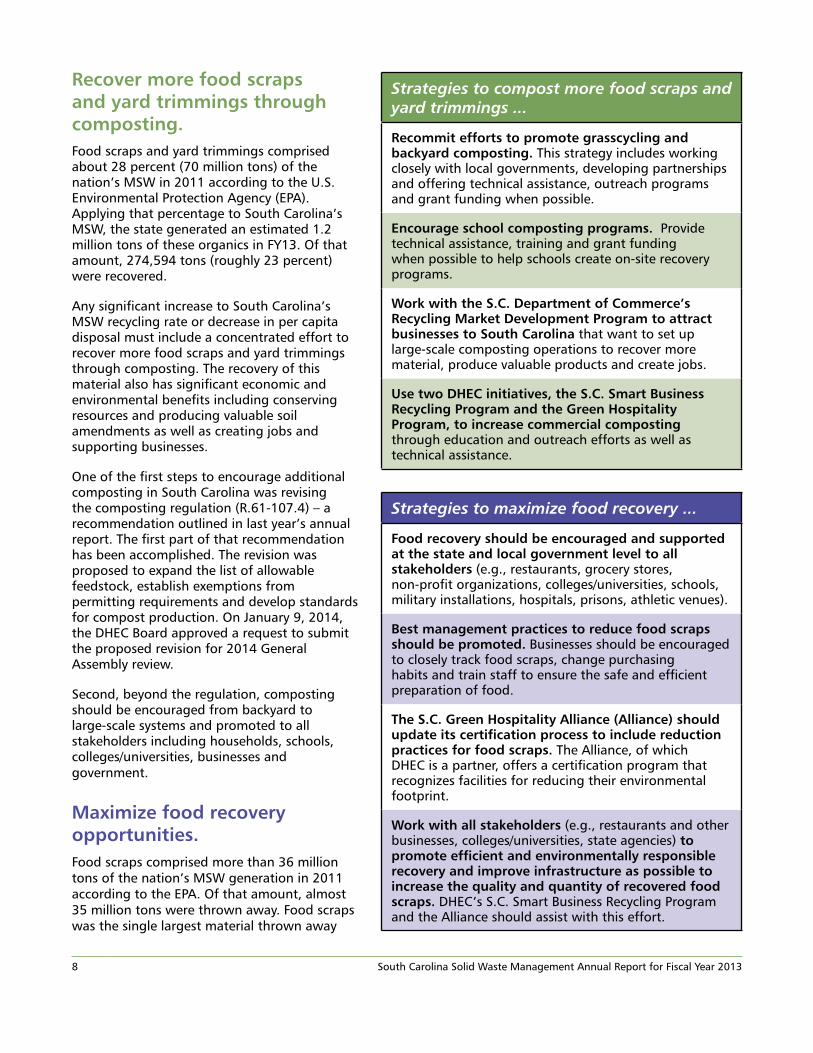
Recover more food scraps and yard trimmings through composting.Food scraps and yard trimmings comprised about 28 percent (70 million tons) of the nation’s MSW in 2011 according to the U.S. Environmental Protection Agency (EPA). Applying that percentage to South Carolina’s MSW, the state generated an estimated 1.2 million tons of these organics in FY13. Of that amount, 274,594 tons (roughly 23 percent) were recovered.
Any significant increase to South Carolina’s MSW recycling rate or decrease in per capita disposal must include a concentrated effort to recover more food scraps and yard trimmings through composting. The recovery of this material also has significant economic and environmental benefits including conserving resources and producing valuable soil amendments as well as creating jobs and supporting businesses.
One of the first steps to encourage additional composting in South Carolina was revising the composting regulation (R.61-107.4) – a recommendation outlined in last year’s annual report. The first part of that recommendation has been accomplished. The revision was proposed to expand the list of allowable feedstock, establish exemptions from permitting requirements and develop standards for compost production. On January 9, 2014, the DHEC Board approved a request to submit the proposed revision for 2014 General Assembly review.
Second, beyond the regulation, composting should be encouraged from backyard to large-scale systems and promoted to all stakeholders including households, schools, colleges/universities, businesses and government.
Maximize food recovery opportunities.Food scraps comprised more than 36 million tons of the nation’s MSW generation in 2011 according to the EPA. Of that amount, almost 35 million tons were thrown away. Food scraps was the single largest material thrown away
Strategies to compost more food scraps and yard trimmings ...
Recommit efforts to promote grasscycling and backyard composting. This strategy includes working closely with local governments, developing partnerships and offering technical assistance, outreach programs and grant funding when possible.
Encourage school composting programs. Provide technical assistance, training and grant funding when possible to help schools create on-site recovery programs.
Work with the S.C. Department of Commerce’s Recycling Market Development Program to attract businesses to South Carolina that want to set up large-scale composting operations to recover more material, produce valuable products and create jobs.
Use two DHEC initiatives, the S.C. Smart Business Recycling Program and the Green Hospitality Program, to increase commercial composting through education and outreach efforts as well as technical assistance.
Strategies to maximize food recovery ...
Food recovery should be encouraged and supported at the state and local government level to all stakeholders (e.g., restaurants, grocery stores, non-profit organizations, colleges/universities, schools, military installations, hospitals, prisons, athletic venues).
Best management practices to reduce food scraps should be promoted. Businesses should be encouraged to closely track food scraps, change purchasing habits and train staff to ensure the safe and efficient preparation of food.
The S.C. Green Hospitality Alliance (Alliance) should update its certification process to include reduction practices for food scraps. The Alliance, of which DHEC is a partner, offers a certification program that recognizes facilities for reducing their environmental footprint.
Work with all stakeholders (e.g., restaurants and other businesses, colleges/universities, state agencies) to promote efficient and environmentally responsible recovery and improve infrastructure as possible to increase the quality and quantity of recovered food scraps. DHEC’s S.C. Smart Business Recycling Program and the Alliance should assist with this effort.

South Carolina Solid Waste Management Annual Report for Fiscal Year 2013 9
– accounting for more than 21 percent of the nation’s discards in 2011.
Reducing food scraps has significant economic, social and environmental benefits. Preventing food scraps can save businesses money by lowering disposal costs as well as improving purchasing and food preparation practices. Food donations also can generate tax benefits.
Additionally, food recovery can provide much needed food to individuals through donations. In 2012, about 47 million Americans lived in households that had difficulty putting food on the table according to the U.S. Department of Agriculture. Businesses that donate wholesome and edible food to food banks and other rescue groups play a pivotal role in their communities by helping those in need.
Composting (see recommendation on the previous page) turns excess food that is not fit for consumption into a nutrient-rich soil amendment.
All three tools – prevention, donation and composting – reduce the amount of food scraps sent to landfills and reduce resource use associated with food production including water and energy.
Increase construction and demolition debris recycling.
Construction and demolition (C&D) debris is comprised of material that is generated during the construction, renovation and demolition of buildings, roads and bridges. C&D debris contains bulky, heavy material such as concrete, wood, metal, glass and other salvaged building components.
Reducing and recycling C&D debris conserves natural resources, saves landfill space, reduces the
Strategies to increase C&D debris recycling ...
Support and encourage C&D debris market development with stakeholders including the S.C. Recycling Market Development Program.
Develop a Web-based C&D debris clearinghouse that includes markets, tools, guidance documents and links that support the recovery, use and availability of material for stakeholders (e.g., recyclers, contractors, local governments, associations). Encourage the use of the S.C. Materials Exchange, the Green Resource Index, the S.C. Green Building Directory and the S.C. Department of Commerce’s Recycling Directory.
Develop a statewide campaign to provide information to contractors about the economic and environmental benefits of recycling C&D debris. As part of this strategy, develop partnerships with stakeholders (e.g., local governments) to offer job-site training programs.
Encourage local governments to incorporate C&D debris recovery into building projects and add recycling requirements to building permits.
Encourage source separation of material at building sites to improve the marketability of C&D debris.
Develop guidance documents and best management practices to promote and assist C&D debris recyclers to operate within the established regulatory framework.
environmental impact of producing new material, creates jobs and reduces building project expenses through avoided purchase and disposal costs.
South Carolina, like other states, faces two stubborn obstacles to increased recovery – low disposal costs and lack of markets. There are limited markets in the state for C&D debris and even more limited markets for specific material such as shingles and gypsum wallboard.
In addition, it is often less expensive for contractors and builders to dispose of the material than take the time to separate, store and find a market.
C&D debris contains material that is valuable
and can be recycled.
Reducing food scraps has significant economic, social and
environmental benefits.

10 South Carolina Solid Waste Management Annual Report for Fiscal Year 2013
State government should lead by example – recycle and buy recycled.State government should lead by example with waste reduction and recycling programs that provide material for South Carolina’s recycling markets. State (as well as local and federal) government also has the unique opportunity to use its purchasing power to buy recycled-content products and influence the marketplace.
The Act – S.C. Code of Laws § 44-96-140 – requires the General Assembly, Governor’s Office and Judiciary as well as state agencies and state-supported colleges/universities to have waste reduction and recycling programs and report those recycling activities annually to DHEC. The Act also outlines requirements and goals for state government and state-supported colleges/universities on purchasing recycled-content products. Those objectives include: 1) setting a goal of 25 percent of product purchases should be recycled-content; 2) tracking and reporting those purchases annually to DHEC; and 3) using the 7.5 percent price preference for recycled-content products.
In addition to the Act, South Carolina established an Environmentally Preferred Purchasing Policy (EPPP) in 2009 that provides additional information, standards, guidance and tools for state agencies and colleges/universities. This valuable tool can help achieve the goals outlined in the Act.
Local governments must improve their solid waste programs.Local government programs are the front line of managing the solid waste recycled and disposed of by residents and, in some cases, businesses and others.
Local government solid waste services represent a significant community investment, but also are often underappreciated in what they do to protect human health and the environment. Part of those services – recycling – can have a considerable impact on the economy. In short, it is critical that local governments continually evaluate and look for ways to improve their solid waste management programs.
Strategies to improve local government solid waste programs ...Maintain an up-to-date solid waste plan that minimizes the amount of material that is disposed of in landfills.
Maximize revenue from the sale of all recyclables.
Identify opportunities to promote the environmental and economic benefits of recycling to community decision makers (e.g., council members, mayors, administrators) to make solid waste management programs a higher priority when making budget and hiring decisions.
Encourage more businesses, organizations and others to reduce waste, recycle and report their recycling activities.
Add and/or support composting programs for all audiences (e.g., residents, schools and businesses). See the recommendation on page 8.
Encourage food scraps recovery where appropriate. See recommendation “Maximize food recovery opportunities” on page 8.
As possible, replace recycling containers with roll carts. This adjustment often increases participation by residents and the amount of material recycled.
Strategies to improve state government recycling and buy recycled programs ...Renew and improve waste reduction, recycling, composting and buying recycled practices by reviewing and developing internal policies and guidelines.
Implement innovative materials management strategies that reduce waste and maximize the amount of material that can be recycled or composted.
Promote the 7.5 percent price preference outlined in the Act that encourages the purchase of recycled-content products to ensure that it is consistently implemented.
Develop a system to track and report recycled-content purchases.
Update and promote the state’s EPPP. When feasible, place additional recycled-content products on state contract.
Develop an initiative to share information and success stories on state government recycling programs. In addition, provide training when necessary and develop a recognition program.

South Carolina Solid Waste Management Annual Report for Fiscal Year 2013 11
Improve and develop recycling markets.Markets are indispensable to sustainable, cost-effective recycling programs. Simply, recycling does not work without markets.
South Carolina and the Southeast are fortunate to have many regional markets – particularly for cardboard and other paper products as well as plastic and scrap metal. But just having a market does not ensure success. Often there are many obstacles to overcome – including cost of collection, lack of infrastructure, market price of the material and distance to the market – to make recycling work.
State government has the potential to be a key player in market development. State government should lead by example by maximizing recycling efforts wherever possible to help increase the amount of material collected. Beyond that, state government should use its collective purchasing power to buy recycled-content products, and when possible, place recycled-content products on state contract.
Consider pay-as-you-throw programs.
Traditionally, residents pay for waste collection through property taxes or a fixed fee regardless of how much or how little waste they generate.
Pay-as-you-throw (PAYT) programs break that tradition by treating waste collection just like electricity, gas and other utilities where consumers pay for what they use. In PAYT programs, residents are charged for the amount of waste they throw away and not charged directly for recycling. This creates a direct economic incentive to recycle more and throw away less.
PAYT programs work. Many communities with PAYT programs have reported significant increases in recycling. In addition, PAYT programs often have proven to be an effective way for local governments to meet increased solid waste management costs.
Setting up a PAYT program is not without its difficulties and will require careful consideration, planning, time and commitment. Still, this option should be considered. Local governments should not just continue to accept the traditional methods of managing waste.
Strategies to improve and develop recycling markets ...
Continue to work with the S.C. Department of Commerce’s Recycling Market Development Program to measure and promote the economic impact of recycling.
Develop a Web-based market clearinghouse that includes information such as commodities, material recyclers, recycling vendors, haulers, processors, end users and manufacturers. Provide links on this site for key existing databases including the Green Resource Index, the S.C. Green Building Directory and other recycling directories.
Focus market development on hard-to-recycle material and less mature markets such as glass, C&D debris, organics and additional types of plastic beyond bottles.
Develop a statewide campaign to promote the recycling industry and the important role it plays in South Carolina’s economy.
Complete the new economic impact study by the end of FY14.
Encourage local governments to coordinate recycling efforts to maximize the amount and quality of material collected as well as the revenue received for that material.
Encourage and assist local governments to develop partnerships with other governments, businesses and other stakeholders to improve collection and recycling infrastructure.
Strategies to encourage PAYT programs ...
Local governments should evaluate their programs and consider implementing a PAYT program.
Local governments should make their solid waste management costs more transparent to residents.

12 South Carolina Solid Waste Management Annual Report for Fiscal Year 2013
Take Action ...“Action for a cleaner tomorrow: A South Carolina Environmental Curriculum Supplement” (“Action”) is an activity-based interdisciplinary curriculum supplement that can serve as a starting place for introducing basic environmental education in the classroom.
The curriculum supplement is the centerpiece environmental education and outreach program of DHEC. “Action” was created in 1992-1993 by DHEC in conjunction with a statewide curriculum development team of teachers and the S.C. Department of Education.
By any account, “Action” has been a success. About 53,000 teachers and other educators have been trained on “Action” since its introduction in 1993. “Action” lessons have been taught in classrooms to thousands of students throughout the state.
“Action” includes 32 lessons that are correlated to the latest South Carolina science standards. Subjects covered include recycling, school recycling, landfills, hazardous household waste and conserving natural resources as well as protecting air and water.
Each lesson is designed to include hands-on activities that help students get the facts, think for themselves, form opinions, make decisions and take “Action” for a cleaner tomorrow.
Expand and improve education, outreach and technical assistance.From elementary school students to local government decision makers, education and outreach are key strategies to help South Carolinians better understand the significant benefits that waste reduction, recycling and composting have on the state’s environment and economy and the role all of us have in making recycling work.
It will require changes in the behavior and practices of residents, students, business and industry, colleges/universities, schools and government to reach the state’s waste reduction and recycling goals. Education and outreach – which includes technical assistance – are the pathways to achieving these goals.
Strategies to expand and improve education, outreach and technical assistance ...
Continue to encourage more teachers and schools to participate in the “Action for a cleaner tomorrow” curriculum supplement program that includes training for kindergarten through 12th grade teachers and classroom presentations to elementary, middle and high school students.
Continue to encourage and assist local governments to persistently educate residents on community recycling options and to look for partnerships to promote recycling.
Continue to encourage more businesses to reduce waste, recycle and use the resources provided by the S.C. Smart Business Recycling Program.
Continue to encourage hotels, motels, restaurants and bars to reduce their environmental impact and take advantage of the resources from DHEC’s Green Hospitality Program and the Green Hospitality Alliance.
Continue to expand public-private partnerships to promote recycling in public places (e.g., airports, state and local parks, welcome centers) and develop partnerships to promote recycling to the public.
Continue to expand comprehensive technical assistance to state agencies, local governments, businesses, organizations, colleges/universities and schools.
Continue to identify opportunities to promote the importance and economic benefits of recycling to local decision makers (e.g., councils, mayors, administrators) and key associations.
Education and outreach are the pathways
to achieving the state’s waste reduction and
recycling goals.

South Carolina Solid Waste Management Annual Report for Fiscal Year 2013 13
Prevent illegal dumping of waste tires.South Carolinians generate an estimated 4.5 million waste tires every year. When managed improperly – that is, dumped or stored illegally – tires can become a health hazard by holding water and attracting mosquitoes as well as creating potential fire hazards and unsightly nuisances.
Unfortunately, many waste tires do not take a direct route to a tire recycler. The state continues to see illegal dumping and is working to identify responsible parties to remove and manage illegally dumped tires. But the cleanup of existing piles is not a solution. Preventing the creation of waste tire piles is critical to the success of any waste tire management program.
In short, illegal dumping of waste tires poses risks to human health, costs taxpayers money, wastes valuable resources and results in environmental hazards. The proper management of waste tires continues to be a goal.
When managed properly, tires can be used in construction activities and new products as well as burned for energy recovery. Most waste tires generated in South Carolina are chipped and burned in place of other fuels (e.g., coal). They also are used frequently as a substitute for gravel or other aggregates in septic tank drain fields or other drainage applications. Wire-free tire rubber can be used for higher-value products. Chipped tire rubber, for example, can be used in place of wood chips in playgrounds. Finely ground tire rubber can be formed into running tracks or molded into industrial mats.
Strategies to prevent the illegal dumping of waste tires ...
Improve markets. DHEC and the S.C. Department of Commerce‘s Recycling Market Development Program should continue efforts in conjunction with tire manufacturers, tire processors and others to promote higher-value uses for waste tires;
Minimize the opportunities for illegal tire disposal. DHEC efforts should include full implementation of the manifesting and registration requirements. Tire generators and retailers must verify their waste tires are hauled only by legally registered haulers and that they are delivered to appropriate facilities;
Revise the tire regulation. DHEC should engage stakeholders in revising R.61-107.3 to clarify regulatory requirements and penalties for waste tire generators, collectors, haulers and processors;
Engage law enforcement. DHEC should work with state and local law enforcement to deter illegal dumping and to ensure offenders are dealt with consistently and with all available force of law and regulation;
Involve local governments. DHEC should assist county and municipal governments in implementing local waste tire management programs that prevent illegal dumping and encourage the purchase of high-value products made from waste tires.
Tires can be used in construction activities and construction
activities as well as burned for
energy recovery.
In the past year, DHEC has implemented new strategies to prevent illegal tire dumping and to help ensure the movement of tires to recycling facilities. Newly implemented strategies include an improved waste tire hauler registration process and a tire manifest to document legal transport and delivery of waste tires.

14 South Carolina Solid Waste Management Annual Report for Fiscal Year 2013
Prevent illegal dumping of other materials.Illegal dumping remains an issue in South Carolina. One commonly seen activity is the illegal dumping of solid waste in remote areas and another is unregulated “sham” recycling. Sham recycling occurs when materials are collected and stockpiled, with a minimal amount being recycled, and the remainder left unmanaged. Both activities result in the creation of illegal dumps that degrade property values and result in both property owners and taxpayers paying for the cleanup.
Tires, C&D debris, land-clearing debris and electronics are the materials most likely to be dumped illegally. The underlying causes of the dumping are as varied as the material being dumped, but generally fall into the following categories:
l Low Risk – Haulers that dump some materials, such as tires and land-clearing debris, face a low risk of being identified because the material they are dumping is difficult to trace to the source. Law enforcement and judicial bodies also may fail to consider the impact of this dumping on the health, environmental or economic welfare of a community, resulting in low fines and penalties against dumpers.
l Cost Factors – The high cost of properly recycling or disposing of certain materials creates an incentive for open dumping. The average tipping fee to recycle waste tires, for example, is much higher in South Carolina than the cost for properly disposing of MSW. In addition, when a recycled material has a low intrinsic value, the costs to process and sell the material may be greater than the revenue received from its sale. Collectors may stockpile material to avoid processing costs.
l Generator Responsibility – Waste generators sometimes encourage open dumping by choosing the lowest cost option available to dispose of waste, without regard for how their waste is managed.
l Statutory and Regulatory Exemptions – The Act provides regulatory exemptions for recycling activities. While this is a positive incentive for legitimate recyclers, some operators use these loopholes to claim they are performing a recycling activity when, in fact, their activities more closely resemble unpermitted landfills, recovery facilities and solid waste processing facilities.
Strategies to prevent illegal dumping ...
Regulatory agencies, local governments, private sector businesses and South Carolina residents should work together to prevent open dumping.
Develop strong markets for recyclable material. The higher value a material has, the more likely it is to be treated as a commodity and the less likely it is to be dumped illegally.
Consider statutory and regulatory changes to hold haulers, processors and generators more accountable for the proper collection, transport, recycling and disposal of solid waste and recyclable material.
Implement more robust litter control policies and practices including cooperation between state and local law enforcement agencies.

South Carolina Solid Waste Management Annual Report for Fiscal Year 2013 15
companies made $1.3 billion in capital investments and added about 3,500 jobs in South Carolina. In 2013, 10 new or existing companies provided nearly $104 million in capital investments and created more than 765 jobs.
While businesses are essential, they are only part of the recycling equation. Manufacturers of recycled-content products rely on a steady stream of recycled material from commercial/institutional and industrial sources as well as residential recycling programs. Local government programs, businesses and organizations, in turn, need outlets for the material they collect. Consumers play an integral role in this process by participating in recycling programs and buying recycled-content products.
In summary, businesses, local governments and individuals together make recycling a South Carolina success story.
Recycling has significant environmental benefits including conserving natural resources, saving energy and reducing the need to build landfills.
Recycling also is an essential part of South Carolina’s economy. By transforming waste into valuable raw material, recycling stimulates economic development, creates jobs and businesses, produces tax revenue and generates income for businesses and local governments from the sale of recyclables. Recycling supports businesses that haul, process and broker recyclables as well as manufacturers that sell products made from the material collected from local programs, businesses and other organizations.
South Carolina is home to about 500 recycling businesses that provide more than 21,000 jobs according to the S.C. Department of Commerce. The state’s recycling industry is diverse, robust and growing. Since 2010, more than 60 new or existing
SECTION
4Recycling’s Economic Impact
South Carolina is home to about 500
recycling-related businesses that
provide more than
21,000 jobs.
Since 2010, 60 companies
made $1.3 billion in capital investments and
added about 3,500 jobs in
South Carolina.
The Palmetto State is a national leader for jobs in recycling.South Carolina has four times more jobs in recycling per capita than California and Massachusetts – states recognized as recycling leaders.
Recycling Market DevelopmentThe S.C. Department of Commerce’s Recycling Market Development Advisory Council (RMDAC) supports the economic growth of the state’s recycling industry by building recycling markets, increasing material recovery and promoting the recycling value chain.
RMDAC is a 14-member, Governor-appointed council representing various recycling industries, government, solid waste, higher education and the public. RMDAC’s 20 years of work connecting business, industry and the public with a statewide recycling infrastructure has helped fuel economic growth and boost South Carolina’s bottom line through continued job creation and capital investment.
The Recycling Market Development Program staff coordinates the activities of the Council, works to improve recycling markets and
provides technical and economic development assistance to the recycling industry.
NOTE: The information in this section is provided by the S.C. Department of Commerce’s Recycling Market Development Program.

16 South Carolina Solid Waste Management Annual Report for Fiscal Year 2013
South Carolina’s Recycling Industry by the NumbersBusinesses of all types and sizes comprise the state’s recycling industry. There are companies that collect and haul material as well as business that shred material (e.g., documents). There are recovery facilities that sort and prepare recyclables for market as well as consolidation facilities. And there are other businesses that offer specific services. Converters,
TABLE 4.1: South Carolina’s Recycling Investment
YEAR JOBS INVESTMENT
2010 1,130 $438,000,000
2011 837 $333,000,000
2012 771 $463,000,000
2013 765 $103,950,000
TOTAL 3,503 $1,337,950,000
Seventeen facilities reported employing more than 700 people
and investing more than $2.4 million in their
businesses.
NOTES: Five public and four private recovery facilities responded. Three public and five private consolidation facilities responded. For the purpose of this table, a consolidation facility is where recyclables are taken for storage and/or consolidation (e.g., baling) before being delivered to a recovery facility or other end user.
*This number includes a recovery facility in Charlotte that received material from South Carolina.
TABLE 4.2: The Economic Impact of South Carolina’s Private/Public MRFs in FY13
FACILITY TYPE
TOTAL NUMBER OF FACILITIES QUERIED
NUMBER WHO REPORTED TONS EMPLOYMENT INVESTMENT
Recovery Facility 9 9 422,385 612 $2,155,000
Consolidation Facility 17 8 196,305 91 $329,000
TOTAL 26* 17 618,690 703 $2,484,000
S.C. Material Recovery Facilities
for example, transform large rolls of paper or paperboard into new products such as bags, boxes and envelopes. Reclaimers prepare recovered plastic for manufacturers.
South Carolina has 25 recovery and consolidation facilities (both public and private – see Table 4.2). In a 2013 survey conducted by the S.C. Department of Commerce, 17 of the 26 facilities reported employing more than 700 people and investing more than $2.4 million in their businesses.

South Carolina Solid Waste Management Annual Report for Fiscal Year 2013 17
Paper
South Carolina has more than 85 companies involved with paper recovery including commercial haulers and shredders as well as processors and end users.
The state has four paper mills that employ about 2,500 people and recycle nearly 1 million tons of paper annually. Of that amount, more than 90 percent is
recovered from North Carolina and South Carolina.
The state’s paper mills turn the recycled paper into linerboard, tubes and cores and other packaging material. South Carolina also is home to several paper converters and a molded fiber products company.
The state has four paper mills that employ about
2,500 people and recycle nearly
1 million tons of paper annually.
Recycling creates more jobs.Nationwide, the recycling industry accounts for nearly a half-million jobs and generates more than $87 billion annually in economic activity according to a study released in 2013 by the Institute of Scrap Recycling.
This study also notes that the recycling industry generates about $4 billion in state and local revenues and pays another $6.3 billion in federal taxes each year.
S.C. Paper Recyclers
18 South Carolina Solid Waste Management Annual Report for Fiscal Year 2013
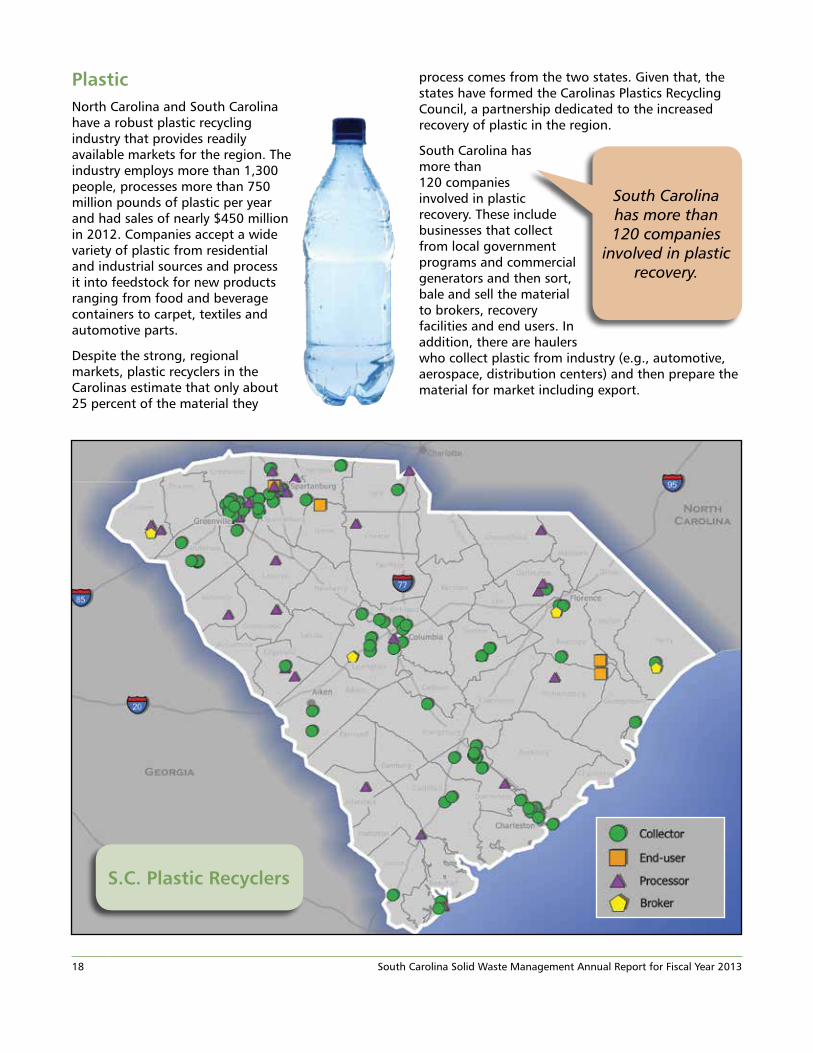
process comes from the two states. Given that, the states have formed the Carolinas Plastics Recycling Council, a partnership dedicated to the increased recovery of plastic in the region.
South Carolina has more than 120 companies involved in plastic recovery. These include businesses that collect from local government programs and commercial generators and then sort, bale and sell the material to brokers, recovery facilities and end users. In addition, there are haulers who collect plastic from industry (e.g., automotive, aerospace, distribution centers) and then prepare the material for market including export.
PlasticNorth Carolina and South Carolina have a robust plastic recycling industry that provides readily available markets for the region. The industry employs more than 1,300 people, processes more than 750 million pounds of plastic per year and had sales of nearly $450 million in 2012. Companies accept a wide variety of plastic from residential and industrial sources and process it into feedstock for new products ranging from food and beverage containers to carpet, textiles and automotive parts.
Despite the strong, regional markets, plastic recyclers in the Carolinas estimate that only about 25 percent of the material they
South Carolina has more than 120 companies
involved in plastic recovery.
S.C. Plastic Recyclers

South Carolina Solid Waste Management Annual Report for Fiscal Year 2013 19
The state has more than 100 scrap yards that conservatively employ more than 2,200 people. The state also has four steel mills – by comparison North Carolina has two and Georgia just one.
South Carolina’s steel mills employ more than 1,700 people and recycle about 16,000 tons of material per day. These mills produce material for the construction, building and automotive industries.
The state is also home to a secondary smelter of aluminum that uses 300 to 350 tons of recycled aluminum per day. This recycled aluminum is used to manufacture products such as fin stock for the heating and cooling industry and different types of foil for the packaging and aerospace industries.
The state also has about a dozen processors that collect post-consumer or post-industrial plastic and convert it into resin, fiber or other material to be used in the automotive, furniture and equestrian industries. Finally, South Carolina has two companies that turn bottles into a resin to make bottles, food-grade plastic and fiber. A third company, opening in 2014, recently invested $45 million and will create more than 300 jobs.
MetalSouth Carolina has more than 170 companies involved in metal recycling from small scrap metal collectors who haul material and sell it to scrap yards, to the scrap metal processing facilities that prepare the material for end use as well as the mills that manufacture new products from recycled steel and aluminum.
South Carolina has four steel
mills that employ more than 1,700
people and recycle about
16,000 tons of material per day.
S.C. Metal Recyclers

20 South Carolina Solid Waste Management Annual Report for Fiscal Year 2013
GlassWhile other commodities have many markets, only a few companies in South Carolina collect glass for recycling. This is due to the fact that glass does not have much value and is expensive to move and process.
One company in South Carolina processes recycled glass into color-sorted, furnace-ready cullet, which is used to make new glass, glass beads for reflective highway paint and a sand-blasting abrasive. Another company uses recycled glass from commercial businesses to make counter tops for homes and businesses as well as landscaping material and sand-blasting products.
Given the lack of markets, the Horry County Solid Waste Authority installed glass crushing equipment at its recovery facility and creates a glass material suitable for landscape and roadbed applications. Beyond these efforts, the nearest recycling option for local governments is a company that has locations in Raleigh, NC and Atlanta, GA. This company makes cullet for container and fiberglass manufacturers.
Charleston is home to a business that recycles glass
into counter tops and landscaping
material.
*A bunker is a semi-enclosed area where color-sorted glass is stored until taken to market.
S.C. Glass Recovery Facilities

South Carolina Solid Waste Management Annual Report for Fiscal Year 2013 21
Recycling Stakeholder GroupsFour recycling stakeholder groups have been formed to increase recovery of plastic, carpet and glass as well as a group to focus on improving recycling on the coast.
The Carolinas Plastic Recycling Council is a regional effort targeting North and South Carolina. Another – the Carpet Recovery Coalition – is focused on recycling post-consumer carpet. The glass stakeholder group is trying to finds ways to overcome the lack of markets for the material as well as find additional high-end uses.
The coastal stakeholder group is focused on increasing the collection of recyclables from hospitality facilities and beaches.
Estimated Lost RevenueIt is projected that more than 448,000 tons of easily recycled material – aluminum cans, cardboard, office paper, newspaper, plastic bottles and glass bottles and jars – may have been disposed of in FY13. Using the state’s average Class 3 landfill tipping fee of $39 per ton, it is estimated that local governments spent about $17.5 million to dispose of this material.
It is also estimated that about $60 million in potential revenue from the sale of this material may have been lost based on the average reported revenue received per ton by local governments for each of these types of material. The estimated amount of lost revenue is calculated by applying EPA’s most recent MSW commodity generation rates to South Carolina’s FY13 generation and recycling data as well as the average Class 3 landfill tipping fee and average market prices.
Beyond the Economic ImpactRecycling programs provide more environmental benefits than those commonly known (e.g., conservation of natural resources and energy, reducing the need to build landfills). For example, environmental equivalencies provide a different perspective on recycling’s benefits. These lesser known benefits can be measured by using the U.S. Environmental Protection Agency’s (EPA) Waste Reduction Model (WARM). This tool helps solid waste planners and organizations calculate the benefits of alternative solid waste management decisions and the impact of recycling as compared to landfill disposal. Using WARM and an environmental equivalency calculator, greenhouse gas (GHG) savings can be presented in a manner that is easy to understand.
Examples of the GHG savings achieved statewide through recycling reported for FY13 are equivalent to eliminating emissions from:
l 525,117 passenger cars for one year; OR
l 282,574,118 gallons of gasoline; OR
l electricity use of 346,802 homes for one year.
The Local Cost of Solid Waste ManagementMore than $330 million was spent in FY13.
Through their full-cost disclosure information submitted to DHEC, counties and municipalities reported spending more than $330 million in FY13 (and more than $1.2 billion since FY10) on this basic service that includes collection, staffing, trucks, equipment and containers. Of that amount, local governments reported spending more than $176 million for collection, more than $112 million for disposal and about $26 million for recycling program operations.
While all solid waste management options have a cost, recycling is the only choice that offers the opportunity to save money (reduced disposal costs) and earn revenue (from the sale of recyclables). For example, recycling more than 1.3 million tons of material saved local governments more than $53 million in avoided disposal costs in FY13 (and more than $316 million since FY07). This estimate is calculated by multiplying the amount of MSW recycled by the average statewide Class 3 landfill (MSW) tipping fee of $39 per ton.
Local governments reported earning more than $9 million in revenue from the sale of recyclables in FY13 and more than $67 million since FY07. Note that these figures would be higher given the fact that not all local governments reported their revenue earned.

22 South Carolina Solid Waste Management Annual Report for Fiscal Year 2013
The S.C. Solid Waste Policy and Management Act of 1991 – S.C. Code of Laws § 44-96-60 – requires the S.C. Department of Health and Environmental Control (DHEC) to report detailed information on the amount of material recycled by commodity and county.
This section highlights the commodities that comprise municipal solid waste (MSW) as defined by South Carolina: glass, metal, paper, plastic, banned items, miscellaneous items and commingled recyclables.
Glass, metal, paper and plastic are considered traditional commodities and serve as the foundation of local government recycling programs.
Banned items represent six specific items – appliances, electronics scrap, lead-acid batteries (e.g., car, truck, boat), used motor oil, whole tires and yard trimmings. Unwanted electronics – also known as e-scrap – became the latest item to be banned beginning in July 2011. Specifically, residents are required to recycle desktop, laptop and notebook computers as well as computer monitors, printers and televisions. Appliances, lead-acid batteries, used motor oil and whole waste tires are prohibited by law from disposal in any landfill. Yard trimmings are banned from disposal in Class 3 landfills, but can be disposed of in Class 1 or Class 2 landfills.
Miscellaneous recyclables are numerous and varied (e.g., fluorescent bulbs, food scraps, mattresses). Levels of collection differ in local government programs throughout South Carolina.
Hazardous Household Material (HHM) is reported as a miscellaneous item and highlighted in this report because it comprises a
significant part of MSW as well as poses a potential risk to human health and the environment. For information on local government HHM programs, see page 28.
Commingled recyclables consist of a variety of material collected together and not reported by individual material type. (See page 30 for more information.)
The amount of each commodity collected is used to calculate the state’s MSW recycling rate. Of the seven commodities that comprise MSW, five (metal, paper, plastic, banned items and commingled recyclables) had an increase in recycling tonnages from the previous FY.
Overall, the amount of MSW collected for recycling grew more than 11 percent (142,860 tons) to 1,371,960 tons in FY13. Paper was the top commodity recycled, comprising 35 percent of all MSW recycled in South Carolina. See Chart 5.1 for a complete breakdown by commodity.
SECTION
5Recycling by Commodity
CHART 5.1: MSW Commodities Recycled as a Percentage of All MSW Recycled in FY13*
METAL
25%PAPER
35%
MISCELLANEOUS ITEMS
4%COMMINGLEDRECYCLABLES
7%
GLASS
<1%
BANNED ITEMS
28%
PLASTIC
1%
*NOTES: Commodities measured by weight.
Total is more than 100 percent due to rounding.
Glass, metal, paper and plastic
serve as the foundation of
local government recycling
programs.
Yard trimmings are banned from disposal in Class 3 landfills, but can be disposed of in Class 1 or Class 2
landfills.

South Carolina Solid Waste Management Annual Report for Fiscal Year 2013 23
TABLE 5.2: Glass Recycled by County in Tons
COUNTY BROWN CLEAR GREEN MIXED COUNTY TOTAL
Abbeville 0.00 0.00 0.00 0.29 0.29
Aiken 0.38 0.00 0.00 217.94 218.32
Allendale 0.00 0.00 0.00 0.00 0.00
Anderson 111.58 111.58 735.50 0.25 958.91
Bamberg 0.00 0.00 0.00 0.00 0.00
Barnwell 0.00 0.00 0.00 19.84 19.84
Beaufort 185.47 462.92 277.45 41.80 967.64
Berkeley 0.00 0.00 0.00 0.00 2.00
Calhoun 0.00 0.00 0.00 0.00 0.00
Charleston 0.00 0.00 0.00 24.93 24.93
Cherokee 6.35 9.35 4.60 0.00 20.3
Chester 0.00 0.00 0.00 61.71 61.71
Chesterfield 0.00 0.00 0.00 0.00 0.00
Clarendon 0.00 0.00 64.41 0.00 64.41
Colleton 0.00 0.00 0.00 0.00 0.00
Darlington 0.00 0.00 0.00 124.72 124.72
Dillon 0.00 0.00 0.00 4.67 4.67
Dorchester 0.00 0.00 0.00 0.00 0.00
Edgefield 0.00 0.00 0.00 0.00 0.00
Fairfield 0.00 0.00 2.30 48.83 51.13
Florence 0.00 2.00 0.00 0.00 2.00
Georgetown 0.00 94.89 96.23 47.79 238.91
Greenville 0.00 0.00 0.00 313.40 313.40
Greenwood 0.00 2.00 0.00 438.00 440.00
Hampton 0.00 0.00 0.00 0.00 0.00
Horry 0.00 0.00 0.00 2,056.58 2,056.58
Jasper 0.00 0.00 0.00 75.62 75.62
Kershaw 0.00 0.00 6.52 0.00 6.52
Lancaster 4.20 5.12 0.00 0.00 9.32
Laurens 14.15 10.92 0.00 0.00 25.07
Lee 0.00 0.00 0.00 0.00 0.00
Lexington 134.08 199.22 97.48 101.99 532.77
Marion 0.00 0.00 0.00 0.00 0.00
Marlboro 0.00 0.00 0.00 0.00 0.00
McCormick 0.00 0.00 0.00 0.00 0.00
Newberry 0.00 0.00 0.00 28.46 28.46
Oconee 76.25 143.09 121.08 0.00 340.42
Orangeburg 3.76 6.03 3.59 16.92 30.3
Pickens 144.44 238.72 106.28 42.10 531.54
Richland 24.94 63.68 104.25 275.78 468.65
Saluda 0.00 0.00 0.00 0.00 0.00
Spartanburg 1.08 4.39 0.00 102.14 107.61
Sumter 0.00 0.00 0.00 498.7 498.7
Union 0.00 19.65 0.00 16.87 36.52
Williamsburg 0.00 0.00 0.00 0.00 0.00
York 515.43 254.78 151.55 0.00 921.76
STATE TOTAL 1,222.11 1,628.34 1,771.24 4,561.33 9,183.02
Horry County recycled more
than
2,000
ton of glass – more than any other
county.
NOTE: This table does not include any glass that was collected in commingled recycling programs.
About
80%
of glass recovered in the state came from residential sources.
Local governments
reported earning more than
$15,000 from glass.
On average, nearly
4
pounds of glass were recycled per South Carolinian.

24 South Carolina Solid Waste Management Annual Report for Fiscal Year 2013
NOTE: This table does not include any metal that was collected in commingled recycling programs.
TABLE 5.3: Metal Recycled by County in Tons
COUNTY ALUMINUM FERROUS NON-FERROUS STEEL MIXED
SCRAPCOUNTY TOTAL
Abbeville 4.42 95.00 1.60 0.10 546.63 647.75
Aiken 38.77 200.00 0.00 0.00 608.95 847.72
Allendale 0.00 0.00 0.00 0.00 18.28 18.28
Anderson 34.78 12,713.40 1,219.00 1.94 1,597.34 15,566.47
Bamberg 0.00 0.00 0.00 0.00 30.27 30.27
Barnwell 0.73 0.00 0.00 0.00 112.00 112.73
Beaufort 262.40 3,016.00 258.20 110.36 6,050.67 9,697.63
Berkeley 271.31 22,875.80 0.00 24.43 938.99 24,110.53
Calhoun 0.50 0.00 0.00 0.00 394.52 395.02
Charleston 744.29 50,442.71 59.00 43.89 2,026.86 53,316.75
Cherokee 4.67 1.64 0.00 6.91 276.51 289.73
Chester 4.88 50.09 0.00 21.35 84.84 161.16
Chesterfield 1.51 62.88 0.00 0.00 86.94 151.33
Clarendon 3.33 0.00 0.00 5.35 142.3 150.98
Colleton 348.94 0.00 0.00 408.00 1,156.36 1,913.30
Darlington 3.50 185.00 388.00 0.00 215.08 791.58
Dillon 0.00 0.00 0.00 0.00 78.54 78.54
Dorchester 7.61 7,907.00 23.00 15.50 7.00 7,960.11
Edgefield 3.83 0.00 0.00 0.00 134.54 138.37
Fairfield 2.53 0.00 0.00 0.00 229.76 232.29
Florence 8.10 7,977.34 23.00 5.84 228.34 8,242.62
Georgetown 10.83 0.00 0.00 0.00 5,886.30 5,897.13
Greenville 69.82 30,822.97 331.11 0.27 1,779.92 33,004.09
Greenwood 8.35 3,468.77 2,997.02 121.65 691.68 7,287.48
Hampton 24.00 0.00 0.00 0.00 121.42 145.42
Horry 566.95 18,140.15 1,112.70 428.40 5,634.40 25,882.60
Jasper 0.67 84.04 1.00 0.00 63.96 149.67
Kershaw 23.37 56.56 2.60 0.00 5.15 87.68
Lancaster 7.17 293.45 0.00 0.00 270.25 570.87
Laurens 8.11 3,389.50 15.00 0.00 382.05 3,794.66
Lee 3.30 0.00 0.00 4.90 188.70 196.90
Lexington 191.82 28,392.55 1,870.00 67.70 3,349.80 33,871.86
Marion 0.00 2,494.45 300.05 0.00 30.02 2,824.52
Marlboro 54.50 1,249.14 929.00 20.00 0.00 2,252.64
McCormick 1.79 0.00 0.00 0.00 48.62 50.41
Newberry 0.00 331.42 0.00 0.00 302.20 633.62
Oconee 18.90 248.79 0.00 11.88 13,213.51 13,493.08
Orangeburg 247.55 15,860.62 16.00 1.18 1,651.85 17,777.20
Pickens 132.39 163.86 33.00 3.13 753.25 1,085.63
Richland 487.97 23,936.76 373.00 220.92 936.10 25,954.74
Saluda 2.75 0.00 0.00 0.00 89.60 92.35
Spartanburg 6.78 17,322.85 621.39 17.27 3,690.19 21,658.48
Sumter 12.70 11.68 0.00 39.26 4,165.5 4,229.14
Union 0.53 0.00 0.00 0.00 126.52 127.05
Williamsburg 0.50 10.00 0.00 139.70 54.57 204.77
York 154.99 12,033.05 10.75 80.39 2,218.99 14,498.17
STATE TOTAL 3,781.83 263,837.46 10,584.42 1,800.32 60,619.26 340,623.29
It takes
60%
less energy to make steel from recycled
material than from iron ore.
Metal made up nearly
25%
of all MSW recycled.
Local governments
reported earning
$1.4 million
from metal.
On average, more than
40
pounds of metal were recycled per South Carolinian.

South Carolina Solid Waste Management Annual Report for Fiscal Year 2013 25
TABLE 5.4: Paper Recycled by County in Tons
COUNTY CARDBOARD MAGAZINES NEWSPAPER OFFICE PAPER
PAPER-BOARD
PHONE BOOKS
MIXED PAPER
COUNTY TOTAL
Abbeville 1,011.38 0.00 0.00 7.13 0.00 0.00 105.38 1,123.89
Aiken 4,998.15 0.00 1,413.99 149.20 0.00 0.00 2,588.35 9,149.69
Allendale 2.69 0.00 8.08 0.00 0.00 0.00 0.00 10.77
Anderson 5,326.16 0.37 1.58 70.19 0.00 0.55 2,465.52 7,864.36
Bamberg 79.15 0.00 0.00 0.00 0.00 0.00 0.00 79.15
Barnwell 192.00 0.00 0.00 0.00 0.00 0.00 64.00 256.00
Beaufort 14,961.05 1.00 1,524.41 690.15 0.00 1.01 1,180.76 18,358.38
Berkeley 5,148.01 0.77 0.51 24.98 0.00 0.21 398.68 5,573.16
Calhoun 295.37 0.00 0.00 9.96 0.00 0.00 0.00 305.33
Charleston 9,985.67 3.89 0.00 1,108.93 14.20 1.30 6,199.33 17,313.32
Cherokee 3,026.40 0.00 0.00 13.63 0.00 0.00 208.71 3,248.73
Chester 254.84 0.08 176.27 3.13 0.00 0.08 0.10 434.50
Chesterfield 545.65 0.92 1.30 4.08 0.00 0.00 0.00 551.95
Clarendon 109.66 0.00 0.00 0.00 0.00 0.00 91.73 201.39
Colleton 285.4 0.00 0.00 0.00 0.00 0.00 0.00 285.40
Darlington 744.35 0.00 18.02 4.00 0.00 0.00 4,254.53 5,020.90
Dillon 298.94 0.00 31.32 0.00 0.00 0.00 0.50 330.76
Dorchester 534.34 0.50 0.00 102.00 0.00 0.00 822.97 1,459.81
Edgefield 116.81 0.00 125.29 0.00 0.00 0.00 36.24 278.34
Fairfield 194.67 0.00 0.00 128.00 0.00 0.05 173.60 496.32
Florence 48.75 1.00 177.48 36.50 0.00 1.10 19.33 284.16
Georgetown 715.82 0.00 428.90 14.81 0.00 0.00 0.60 1,160.13
Greenville 85,558.24 0.04 22.70 5,707.69 0.00 0.42 7,163.75 98,452.84
Greenwood 5,247.82 0.25 8.25 176.09 0.00 0.00 4,072.60 9,505.01
Hampton 66.73 14.63 27.16 1.78 0.00 0.00 0.00 110.30
Horry 137,310.77 29.32 5,584.90 2,699.63 1.72 70.90 262.00 145,959.24
Jasper 135.80 0.00 62.32 0.25 2.00 0.00 1.78 202.15
Kershaw 3,135.98 0.00 318.34 84.49 0.00 0.00 1.71 3,540.51
Lancaster 2,266.84 2.1 30.56 167.52 0.00 2.00 19.90 2,488.92
Laurens 9,447.81 0.00 187.23 103.82 0.00 0.00 135.21 9,874.07
Lee 0.00 0.00 0.00 0.00 0.00 0.00 18.40 18.40
Lexington 12,946.82 53.21 940.62 2,927.64 0.31 0.53 999.27 17,868.40
Marion 1,154.50 0.00 0.00 0.00 0.00 0.00 0.00 1,154.50
Marlboro 1,548.40 20.00 220.00 132.18 0.00 0.00 0.00 1,920.58
McCormick 47.43 0.00 23.99 0.00 0.00 0.00 38.30 109.72
Newberry 1,675.94 0.00 0.00 0.00 0.00 0.00 290.61 1,966.55
Oconee 3,827.95 0.75 179.89 171.33 0.00 0.00 571.52 4,751.45
Orangeburg 3,138.31 0.01 128.78 89.57 1.00 0.01 0.20 3,357.88
Pickens 6,733.33 5.30 0.50 787.89 0.50 0.00 2,345.72 9,873.24
Richland 11,565.04 27.94 1,721.58 3,615.88 2.00 11.40 1,020.56 17,964.39
Saluda 56.29 0.00 63.20 0.00 0.00 0.00 73.01 192.50
Spartanburg 16,268.00 2.50 2.26 314.99 0.25 0.31 24,189.29 40,777.59
Sumter 1,773.17 0.75 0.50 65.02 0.00 0.07 1,262.14 3,101.65
Union 6,387.01 0.00 0.00 0.00 0.00 0.00 255.54 6,642.55
Williamsburg 99.23 0.00 0.00 10.00 0.00 1.00 22.89 133.12
York 18,453.88 781.52 910.60 327.23 0.50 3.77 554.83 21,032.33
STATE TOTAL 377,720.54 946.85 14,340.53 19,749.68 22.48 94.70 61,909.54 474,784.31
NOTE: This table does not include any paper that was collected in commingled recycling programs.
Paper made up nearly
35%
of all MSW recycled.
Local governments
reported earning more than
$1 million
from paper.
On average, more than
200 pounds of paper were recycled per South Carolinian.
Paper recycling increased nearly
20%
from FY12 to FY13.

26 South Carolina Solid Waste Management Annual Report for Fiscal Year 2013
TABLE 5.5: Plastic Recycled by County in Tons
COUNTY HDPE LDPE PET PP PS VINYL COMMINGLED PET & HDPE
MIXED PLASTIC
COUNTY TOTAL
Abbeville 23.42 25.25 26.38 0.00 0.00 140.84 0.00 65.28 281.17
Aiken 72.98 0.00 128.30 0.00 0.00 0.00 0.00 817.15 1,018.43
Allendale 2.30 0.00 0.00 0.00 0.00 0.00 0.55 0.00 2.85
Anderson 12.91 38.39 12.80 0.00 0.00 2.50 0.00 80.35 146.95
Bamberg 0.00 0.00 0.00 0.00 0.00 0.00 0.00 1.72 1.72
Barnwell 0.00 0.00 0.00 0.00 0.00 0.00 16.14 0.00 16.14
Beaufort 0.00 0.00 0.00 0.00 0.00 0.00 320.9 337.05 657.95
Berkeley 14.25 26.33 2.63 0.00 0.00 0.00 0.00 189.69 232.9
Calhoun 26.79 0.00 0.00 0.00 0.00 0.00 0.00 6.28 33.07
Charleston 9.38 0.00 0.00 0.00 0.00 0.00 5.00 263.00 277.38
Cherokee 0.21 0.00 0.06 0.00 0.00 0.00 22.80 200.52 223.59
Chester 0.00 0.00 0.00 0.00 0.00 0.00 0.00 93.15 93.15
Chesterfield 3.10 58.80 0.69 0.00 0.00 0.00 0.00 1.87 64.46
Clarendon 0.00 0.00 0.00 0.00 0.00 0.00 0.00 42.79 42.79
Colleton 0.00 0.00 0.00 0.00 0.00 0.00 0.00 80.01 80.01
Darlington 0.00 0.00 3.00 0.00 0.00 0.00 0.00 51.00 54.00
Dillon 0.00 0.00 0.00 0.00 0.00 0.00 0.00 0.00 0.00
Dorchester 0.00 0.00 0.00 0.00 0.00 0.00 0.00 142.15 142.15
Edgefield 0.00 0.00 0.00 0.00 0.00 0.00 23.79 0.00 23.79
Fairfield 50.99 0.00 0.00 0.00 0.00 0.00 4.14 0.00 55.13
Florence 9.17 0.00 17.35 0.00 0.00 0.00 0.00 25.86 52.38
Georgetown 48.63 0.00 78.19 0.00 0.00 0.00 0.00 14.06 140.88
Greenville 7.43 8.60 14.38 0.00 0.00 0.00 27.00 3,289.02 3,346.43
Greenwood 40.73 0.30 54.41 0.00 0.00 0.00 44.12 292.73 432.29
Hampton 12.15 0.00 0.00 0.00 0.00 0.00 1.17 0.00 13.32
Horry 416.10 0.50 707.49 0.00 0.00 0.36 397.20 152.30 1,673.95
Jasper 0.00 0.00 0.00 0.00 0.00 0.00 0.00 25.81 25.81
Kershaw 418.41 0.00 0.67 0.00 0.00 0.00 7.54 1.31 427.92
Lancaster 0.00 0.00 359.02 0.00 0.00 0.00 0.00 284.07 643.08
Laurens 0.34 0.00 0.30 0.00 0.00 0.00 6.27 1,028.97 1,035.88
Lee 0.00 0.00 0.00 0.00 0.00 0.00 0.00 12.00 12.00
Lexington 74.59 0.00 1.27 14.88 0.00 0.10 228.30 237.19 556.33
Marion 0.00 0.00 0.00 0.00 0.00 0.00 0.00 27.34 27.34
Marlboro 144.08 0.00 131.80 0.00 0.00 0.00 118.00 135.46 529.34
McCormick 0.00 0.00 0.00 0.00 0.00 0.00 0.00 4.45 4.45
Newberry 0.00 0.00 0.00 0.00 0.00 0.00 0.00 60.30 60.30
Oconee 2.26 13.19 19.40 0.00 0.00 0.00 92.22 11.10 138.17
Orangeburg 34.85 0.00 0.00 0.00 0.00 0.00 0.49 19.95 55.29
Pickens 64.18 0.00 45.80 0.00 0.00 1.00 0.00 228.18 339.16
Richland 380.30 32.66 128.69 0.00 0.00 0.60 285.30 347.64 1,175.18
Saluda 0.00 0.00 0.00 0.00 0.00 0.00 16.97 0.00 16.97
Spartanburg 11.51 216.84 20.83 0.00 0.00 0.05 0.00 3,929.76 4,178.99
Sumter 29.54 0.00 0.30 0.00 0.00 0.00 9.34 113.79 152.97
Union 9.34 0.00 11.39 0.00 0.00 0.00 0.00 0.00 20.73
Williamsburg 210.35 0.00 5.65 0.00 0.00 0.00 0.00 0.00 216.00
York 55.02 0.00 261.43 0.00 0.00 0.00 125.99 648.65 1,091.08
STATE TOTAL 2,185.31 420.86 2,032.21 14.88 0.00 145.45 1,753.23 13,261.92 19,813.86
NOTE: This table does not include any plastic that was collected in commingled recycling programs.
Plastic recycling increased
nearly
9% from FY12 to FY13.
Nearly
80% of the plastic recycled came
from commercial, institutional and
industrial sources.
Local governments
reported earning more than
$200,000 from plastic.
On average, more than
8 pounds of plastic were recycled per South Carolinian.

South Carolina Solid Waste Management Annual Report for Fiscal Year 2013 27
TABLE 5.6: Banned Items Recycled by County in Tons
COUNTY APPLIANCES ELECTRONICS LEAD-ACID BATTERIES TIRES USED
MOTOR OILYARD
TRIMMINGSCOUNTY TOTAL
Abbeville 1.38 106.34 226.40 275.99 19.89 0.00 630.00
Aiken 0.55 512.25 814.70 1,293.35 126.31 0.00 2,747.16
Allendale 0.00 25.64 48.38 38.45 5.16 0.00 117.63
Anderson 0.00 320.50 1,709.70 3,391.25 124.25 0.00 5,545.70
Bamberg 0.00 31.34 76.36 182.34 13.00 691.50 994.54
Barnwell 0.80 27.18 107.60 470.78 20.84 0.00 627.20
Beaufort 881.30 286.05 862.07 1,137.53 99.54 16,739.12 20,005.61
Berkeley 1,801.20 376.82 1,132.35 917.96 122.60 13,655.80 18,006.73
Calhoun 20.00 26.05 73.69 151.70 16.65 0.00 288.09
Charleston 2,185.19 472.27 2,084.78 3,393.64 176.80 53,727.11 62,039.79
Cherokee 48.00 29.46 282.59 785.10 23.76 795.84 1,964.75
Chester 0.05 45.38 157.84 227.87 23.18 0.00 454.32
Chesterfield 0.00 110.51 223.51 436.54 27.79 0.00 798.35
Clarendon 0.00 68.73 166.45 132.28 27.70 0.00 395.16
Colleton 7.30 103.18 206.44 505.49 32.05 0.00 854.46
Darlington 0.00 188.22 332.12 702.48 25.87 0.00 1,248.69
Dillon 0.00 87.47 152.34 357.39 16.40 0.00 613.60
Dorchester 435.55 296.84 690.39 729.27 102.56 16,381.18 18,635.79
Edgefield 33.36 73.06 127.65 196.85 37.92 0.00 468.84
Fairfield 0.00 99.03 125.08 581.70 31.24 900.00 1,737.05
Florence 1,087.00 288.93 668.34 1,165.21 77.60 7,521.50 10,808.58
Georgetown 0.00 175.96 291.61 799.89 67.69 4,192.87 5,528.02
Greenville 1,255.83 770.51 2,665.76 9,203.55 229.87 25,898.81 40,024.33
Greenwood 2.00 129.38 339.57 1,192.55 26.94 484.14 2,174.58
Hampton 25.58 39.28 107.37 362.01 24.93 1,784.99 2,344.16
Horry 7.90 1,060.67 3,809.01 4,875.56 160.18 39,394.86 49,308.18
Jasper 40.99 66.94 127.41 108.77 21.66 1.31 367.08
Kershaw 14.76 81.24 302.03 704.43 75.60 17,473.10 18,651.16
Lancaster 11.41 110.82 383.54 589.48 4.15 3,488.40 4,587.80
Laurens 0.00 185.32 321.09 426.28 31.99 1.00 965.68
Lee 0.00 28.63 98.36 171.60 12.46 2,245.99 2,557.04
Lexington 1,246.60 372.65 1,477.24 1,646.07 258.12 17,017.35 22,018.03
Marion 0.00 19.58 194.24 568.46 9.53 0.00 791.81
Marlboro 0.00 11.57 137.14 205.86 6.03 2.61 363.21
McCormick 12.15 35.17 47.38 57.12 8.19 0.00 160.01
Newberry 0.00 108.75 182.04 261.07 28.50 3,101.85 3,682.21
Oconee 460.08 2.50 576.67 688.80 55.68 2,814.32 4,598.05
Orangeburg 15.00 182.30 480.83 703.78 47.70 0.00 1,429.61
Pickens 1,462.60 408.89 582.29 972.87 118.62 7,362.45 10,907.72
Richland 564.95 2,314.51 2,332.42 2,335.47 95.90 7,796.26 15,439.51
Saluda 22.40 63.04 96.36 188.16 26.05 0.00 396.01
Spartanburg 620.00 663.56 1,564.39 2,113.11 148.93 122.81 5,232.80
Sumter 3,628.40 165.31 523.49 893.64 54.10 955.81 6,220.75
Union 0.00 60.45 136.88 137.87 13.22 0.00 348.42
Williamsburg 0.00 92.62 162.88 728.52 40.93 0.00 1,024.95
York 4,000.05 834.99 1,673.41 1,931.92 182.86 21,137.58 29,760.81
STATE TOTAL 19,892.36 11,559.92 28,882.17 48,940.00 2,900.94 265,688.56 377,863.96
About
28% of all MSW
recycled was banned items.
About
8% more yard trimmings
were recycled in FY13 than in FY12.
Recycling of banned items
increased
15% from FY12 to FY13.
On average, nearly
160 pounds of
banned items were recycled per South
Carolinian.

28 South Carolina Solid Waste Management Annual Report for Fiscal Year 2013
TABLE 5.8: Miscellaneous Items Recycled by County in Tons
COUNTY ANTIFREEZE COOKING OIL/GREASE
FLUORESCENT BULBS
FOOD SCRAPS HHM INKJET/TONER
CARTRIDGES MATTRESSES PAINT
Abbeville 0.00 0.00 1.35 0.00 0.00 0.00 0.00 0.00
Aiken 9.33 0.20 16.04 0.00 2.99 0.53 0.00 7.77
Allendale 0.00 0.00 0.00 0.00 0.00 0.00 0.00 0.00
Anderson 0.22 0.00 9.90 1,060.73 0.00 1.22 0.00 86.90
Bamberg 0.00 0.00 0.00 0.00 0.00 0.00 0.00 0.00
Barnwell 0.44 0.00 0.00 0.00 0.00 0.00 0.00 0.00
Beaufort 10.98 1,430.44 9.31 0.00 0.00 1.90 164.10 53.00
Berkeley 6.81 38.80 7.28 408.76 0.00 0.80 0.00 0.30
Calhoun 0.00 0.00 1.65 0.00 0.00 0.00 0.00 0.00
Charleston 50.26 70.74 24.54 1,841.41 53.90 16.72 0.00 150.19
Cherokee 0.85 0.00 4.61 0.00 0.00 0.09 0.00 0.00
Chester 0.25 1.27 0.09 0.00 0.00 0.05 0.00 0.02
Chesterfield 0.00 0.00 0.79 0.00 0.00 0.00 0.00 0.00
Clarendon 0.00 0.00 0.00 0.00 0.00 0.00 0.00 0.00
Colleton 0.00 23.11 0.00 0.00 0.00 14.36 0.00 0.00
Darlington 0.50 4.43 0.60 0.00 0.00 0.25 0.00 0.00
Dillon 0.00 0.00 0.25 0.00 0.00 0.00 0.00 0.00
Dorchester 9.00 0.97 0.63 0.00 0.00 0.32 0.00 0.00
Edgefield 0.00 0.00 0.00 0.00 0.00 0.00 0.00 0.00
Fairfield 0.00 4.31 0.31 0.00 0.00 0.00 0.00 0.00
Florence 0.10 2.58 0.00 0.00 0.00 0.00 0.00 0.00
Georgetown 0.52 1.35 0.00 0.00 0.00 0.00 0.00 0.17
Greenville 66.67 57.68 44.56 474.07 0.00 11.01 0.00 3.38
Greenwood 1.68 1.00 2.76 0.00 0.00 0.11 0.00 0.00
Hampton 0.00 0.00 0.03 0.00 0.00 0.00 0.00 0.00
Horry 79.06 786.16 4.73 880.52 1100.12 6.62 67.45 64.05
Jasper 0.00 2.05 0.00 0.00 0.00 0.00 0.00 0.00
Kershaw 0.19 0.13 0.08 0.00 0.00 0.01 0.00 0.00
Lancaster 0.00 0.78 0.23 0.00 1.88 0.89 0.00 3.40
Laurens 0.00 7.49 1.15 7.70 0.00 0.00 0.00 0.00
Lee 0.00 0.00 2.00 0.00 0.00 0.00 0.00 0.00
Lexington 12.68 1,701.54 29.36 3,649.00 0.00 9.97 94.02 0.50
Marion 2.16 0.00 0.00 0.00 0.00 0.00 0.00 0.00
Marlboro 0.00 0.00 0.10 0.00 0.00 0.10 0.00 0.00
McCormick 0.00 0.00 0.00 0.00 0.00 0.00 0.00 0.00
Newberry 0.00 0.33 0.15 0.00 0.00 0.00 0.00 0.00
Oconee 16.57 1,786.92 3.86 0.00 0.00 0.15 0.00 81.97
Orangeburg 0.00 372.62 2.79 583.66 0.00 0.26 0.00 5.45
Pickens 6.42 132.46 13.28 0.00 0.00 7.52 0.00 22.14
Richland 15.58 21.99 15.15 0.40 2,161.00 20.10 37.10 6.50
Saluda 0.00 0.00 0.00 0.00 0.00 0.00 0.00 0.00
Spartanburg 12.10 0.09 11.01 0.00 12.15 0.60 0.00 40.53
Sumter 2.40 6.16 3.49 0.00 0.00 0.83 0.00 0.00
Union 0.00 1.11 0.00 0.00 0.00 0.00 0.00 0.00
Williamsburg 0.00 0.00 0.00 0.00 0.00 6.67 0.00 0.00
York 16.98 27.06 675.58 0.00 17.31 67.59 0.00 50.20
STATE TOTAL 321.74 6,483.75 888.63 8,906.25 3,349.35 168.65 362.67 576.46
S.C. HHM Collection ProgramsBelow is the list of hazardous household material (HHM) programs – including paint – recycled by residental sources in FY13.*
l Beaufort County Single-day collection events and permanent paint collection sites (53 tons)
l Charleston County Permanent collection site (174.8 tons)
l City of North Augusta Single-day collection events (9.51 tons)
l Georgetown County Permanent collection site (340 pounds)
l Horry County Permanent collection site (1,163.67 tons)
l Orangeburg County Single-day collection event (5.45 tons)
l Pickens County Single-day collection event (22.14 tons)
l Richland County Single-day collection event (2,161 tons)
l Spartanburg County Single-day collection event (20.96 tons)
l Town of Surfside Beach Single-day collection events (3.02 tons)
l York County Single-day collection events and a permanent collection site (63.43 tons)
* List may not be complete.
Continued on the following page

South Carolina Solid Waste Management Annual Report for Fiscal Year 2013 29
Paint recycling increased
420% from FY12 to
FY13.
TABLE 5.8: Miscellaneous Items Recycled by County in Tons (continued)
COUNTY RECHARGEABLE BATTERIES TEXTILES USED OIL
FILTERSWOOD
PACKAGING OTHER ITEMS TOTAL
Abbeville 0.12 3.00 1.57 457.07 9.53 472.64
Aiken 2.34 0.00 11.09 165.92 103.91 320.10
Allendale 0.00 0.00 0.00 0.00 0.00 0.00
Anderson 0.10 0.00 1.00 902.09 0.66 2,062.82
Bamberg 0.00 0.00 0.00 0.00 0.00 0.00
Barnwell 0.00 0.00 0.79 0.00 0.00 1.23
Beaufort 2.27 235.7 11.07 417.99 55.45 2,392.21
Berkeley 2.44 1.00 57.28 607.55 71.14 1,202.14
Calhoun 0.33 0.00 0.80 23.13 15.60 41.51
Charleston 7.29 0.25 112.58 1,154.16 71.61 3,553.65
Cherokee 0.47 0.00 1.64 740.50 0.00 748.15
Chester 0.04 25.20 0.56 26.18 0.09 53.75
Chesterfield 0.00 2,824.75 0.75 0.00 0.00 2,826.29
Clarendon 0.00 0.00 4.53 0.00 0.00 4.53
Colleton 0.00 0.00 6.23 0.00 0.00 43.70
Darlington 0.00 0.00 4.50 84.00 0.00 94.28
Dillon 0.00 0.00 0.00 702.00 0.00 702.25
Dorchester 0.00 0.00 22.00 321.00 0.25 354.18
Edgefield 0.00 0.00 0.00 0.00 0.00 0.00
Fairfield 0.15 0.00 3.05 0.00 0.00 7.81
Florence 1.00 0.00 4.95 9.00 0.14 18.77
Georgetown 0.00 20.90 1.48 0.00 0.00 24.42
Greenville 5.68 70.00 150.98 3,318.59 864.94 5,067.56
Greenwood 0.11 0.00 0.51 3.70 3.00 12.87
Hampton 0.00 0.00 1.63 5.27 0.00 6.93
Horry 7.47 32.42 218.77 219.95 236.59 3,703.91
Jasper 0.00 0.00 0.00 0.21 0.00 2.26
Kershaw 0.00 0.00 0.69 30.13 0.00 31.22
Lancaster 0.00 0.00 4.05 1,960.3 0.00 1,971.52
Laurens 0.00 0.00 0.00 33.30 94.92 144.56
Lee 0.00 0.00 3.90 0.00 0.00 5.90
Lexington 0.48 71.86 98.74 2,452.06 305.34 8,425.54
Marion 0.00 0.00 5.00 0.00 0.00 7.16
Marlboro 0.00 116.00 1.50 31.30 15.50 164.50
McCormick 0.00 0.00 0.00 0.00 0.00 0.00
Newberry 0.00 0.00 0.00 48.00 0.00 48.48
Oconee 1.26 131.00 18.41 1,294.99 271.80 3,606.93
Orangeburg 0.45 0.00 4.63 1,071.45 1.00 2,042.31
Pickens 0.26 146.85 9.24 175.85 5.44 519.45
Richland 3.28 60.37 39.87 943.61 76.84 3,401.77
Saluda 0.00 0.00 0.00 0.00 0.00 0.00
Spartanburg 2.80 0.00 8.22 7,233.12 2,566.22 9,886.83
Sumter 0.00 0.00 12.34 48.16 0.61 73.99
Union 0.08 0.00 1.10 0.00 36.00 38.29
Williamsburg 0.01 0.00 3.56 66.43 0.00 76.67
York 7.20 95.84 22.07 1,944.57 54.00 2,978.4
STATE TOTAL 45.60 3,835.14 851.07 26,491.56 4,860.58 57,141.48
Spartanburg County recycled about
10,000 tons of
miscellaneous items – more than any other county.
More than
24 pounds of
miscellaneous items were
recycled per South Carolinian.
Wood packaging made up
46% of all miscellaneous
items recycled.

30 South Carolina Solid Waste Management Annual Report for Fiscal Year 2013
Commingled CollectionMore and more programs nationwide are moving to commingled collection programs – that is one cart or container for all recyclables. Also known as single-stream, South Carolina is no exception to this trend. There is at least one single-stream collection program in 23 of the state’s 46 counties and other programs are considering making the change.
Commingled collection programs have several key benefits. For residents, it is easy to understand and convenient (one container for everything) and often leads to increased participation and more material collected. The largest drawback to commingled collection is an increase in contamination of the collected material that is sent to processors and end markets. The contamination – unwanted material – reduces the market value of the material or may result in the collected material being disposed of instead of recycled. At the very least, this contamination results in a lower quality of material being sent to processors, that, in turn, must remove the contaminants and pay for their disposal. This results in lower prices being paid to local governments and others for the material.
Commingled collection also makes it difficult, if not impossible, to track recycled material by commodity (e.g., glass, metal, paper, plastic). Commingled material, however, is counted as MSW and included in the state’s MSW recycling rate.
In FY13, 92,550 tons of commingled material were recycled. This accounts for 6.7 percent of all MSW that was recycled and is a 13 percent increase from the 81,810 tons of commingled material that were recycled in FY12. Given this, it is important to note that when looking at statewide or county-by-county numbers and/or trends of individual commodities, the amount of material reported for each individual commodity does not include commingled material.
In addition to increased commingled collection programs, local governments also are exploring the benefits of switching from smaller curbside bins to larger roll carts to collect recyclables. This switch provides local governments with the opportunity to accept additional commodities for recycling and may lead to more material being collected. This, in turn, may bring about increased revenue from the sale of the material. Local governments that use roll carts for recycling often change collection schedules from once a week to once every two weeks – which helps with increased collection efficiency and lower collection costs.
TABLE 5.7: Commingled Items Recycled by County
COUNTY TONS
Abbeville 7.97
Aiken 6,958.24
Allendale 0.00
Anderson 2,648.82
Bamberg 0.00
Barnwell 0.00
Beaufort 4,441.01
Berkeley 1,364.12
Calhoun 142.10
Charleston 20,384.93
Cherokee 7.65
Chester 0.00
Chesterfield 280.26
Clarendon 0.00
Colleton 0.00
Darlington 1,149.10
Dillon 80.21
Dorchester 1,344.15
Edgefield 48.85
Fairfield 0.00
Florence 1,433.01
Georgetown 0.00
Greenville 14,611.55
Greenwood 2,019.00
Hampton 0.00
Horry 300.54
Jasper 0.00
Kershaw 321.40
Lancaster 601.40
Laurens 15.07
Lee 0.00
Lexington 6,025.57
Marion 7.70
Marlboro 233.00
McCormick 0.00
Newberry 0.00
Oconee 0.00
Orangeburg 2,433.00
Pickens 1,964.07
Richland 12,062.78
Saluda 33.62
Spartanburg 7,457.60
Sumter 0.05
Union 0.00
Williamsburg 0.00
York 4,173.65
STATE TOTAL 92,550.41
Charleston County collected
more than
20,000 tons of
commingled material in FY13.
Commingled recyclables
accounted for
15.5%
of MSW recycled from residential sources in FY13.
About
35 pounds of
commingled material were
recycled per South Carolinian.

South Carolina Solid Waste Management Annual Report for Fiscal Year 2013 31
CHART 6.1: DIY Used Motor Oil Recycling by FY in Gallons
0
200,000
400,000
600,000
800,000
1,000,000
1,200,000
FY13FY12FY11FY10FY09
960,398 963,7141,001,714
932,725
828,838
SECTION
6Used Motor Oil Recycling The S.C. Solid Waste Policy and Management Act of 1991 (Act) – S.C. Code of Laws § 44-96-160 – requires the S.C. Department of Health and Environmental Control (DHEC) to annually compile a report on the state’s used motor oil recycling program for do-it-yourself oil changers (DIYers). According to the Act, the report must include:
l the amount of used motor oil collected in each county;
l the number of used motor oil collection sites available in each county; and
l a summary of local government programs receiving grant funding from DHEC.
The Act requires that transporters of used motor oil report to DHEC the amount hauled each calendar year (CY). Grant funding and the solid waste data in this publication are reported by fiscal year (FY). For purposes of this report, however, the amount of used motor oil collected is presented in two ways: 1) by CY12; and 2) by FY13
(July 1, 2012 to June 30, 2013). In South Carolina, only used motor oil generated and recycled by DIYers is counted as part of the state’s MSW recycling rate.
In CY12, DIYers recycled 705,141 gallons of used motor oil at 921 collection sites. The sites are
provided by local governments, retailers, quick lubes and auto parts stores. In FY13, DIYers
recycled 828,838 gallons (which equates to 2,901 tons) of used motor oil. Chart 6.1 illustrates the success of
the used motor oil collection program by FY. Table 6.2 lists by county the
number of sites and gallons collected as well as grant awards to the county or
municipalities within that county.
Annual collection data for DIY used motor oil recycling seems to indicate a substantial
decrease from the previous CY. This may be attributed to several factors including: 1)
the number of DIYers may be decreasing; 2) some local governments may use DIY used motor oil in waste oil heaters and do not track or report that volume; and 3) the frequency of DIY oil changes may be decreasing due to the economy, use of synthetic motor oil and new manufacturer recommendations.
There is a fee of two cents per quart of motor oil collected at the wholesale level. Part of this funding is used to provide grants for local governments focusing on DIY used motor oil collection and recycling. In FY13, $676,748 was awarded to local government programs. The amount of individual grant awards for FY13 is provided in Table 6.2. Grant funds are used primarily for the purchase of equipment and supplies associated with used motor oil collection sites. Funds also are used to cover costs for used motor oil
In FY13, $676,748 was
awarded to local government programs to
support motor oil collection and
recycling.
Motor oil recycling may
have declined in FY13 due to a decrease in the
number of DIYers and the economy.

32 South Carolina Solid Waste Management Annual Report for Fiscal Year 2013
TABLE 6.2: Number of DIY Used Motor Oil Collection Sites, FY13 Grants Awarded, Gallons Collected and Tonnage Equivalent by County
GRANTEE NUMBER OF SITES GRANT AMOUNT FY13 GALLONS TONS
Abbeville 13 $10,520.00 5,683 19.89
Aiken 32 $0.00 36,088 126.31
Akien, City of t $6,620.00 t t
North Augusta, City of t $2,100.00 t t
Allendale 6 $7,225.00 1,476 5.16
Anderson 33 $16,855.00 35,500 124.25
Bamberg 10 $6,650.00 3,714 13
Barnwell 14 $6,200.00 5,954 20.84
Beaufort 20 $8,510.00 28,440 99.54
Berkeley 31 $14,763.00 35,029 122.6
Calhoun 10 $5,475.00 4,757 16.65
Charleston 30 $12,468.00 50,514 176.8
Cherokee 18 $11,200.00 6,789 23.76
Chester 15 $4,050.00 6,623 23.18
Chesterfield 13 $19,818.00 7,940 27.79
Clarendon 20 $5,500.00 7,914 27.7
Colleton 19 $5,738.00 9,158 32.05
Darlington 19 $10,020.00 7,391 25.87
Dillon 18 $4,800.00 4,686 16.4
Dorchester 21 $21,250.00 29,303 102.56
Edgefield 9 $23,420.00 10,834 37.92
Fairfield 13 $21,272.00 8,925 31.2
Florence 30 $6,538.00 22,171 77.6
Georgetown 22 $43,800.00 19,340 67.69
filter recycling, public education and professional development of local government recycling coordinators and others.
In addition to used motor oil, most county and some municipal recycling programs also collect used motor oil filters and bottles from DIYers. The amount of used motor oil filters and motor oil bottles recycled are not always available as many counties collect and market filters with other metals and bottles with other HDPE plastic bottles and jugs. The data presented in Table 5.7 does not reflect the full extent of used motor oil filter recycling in the state.
Overall, there are few barriers to recycling used motor oil, used
motor oil filters and motor oil bottles. Markets are not an issue.
The S.C. Budget and Control Board has developed a state-term contract that provides vendors for the recycling of used motor oil and used motor oil
filters. In fact, the state-term contract vendor for used motor oil collection and recycling pays contract users 65 cents per gallon of used motor oil collected. Other markets – including Santee Cooper – are available as well.
Bottles, if properly drained, can be recycled with other plastic. In addition to the state-term contract, scrap dealers and steel mills accept drained/crushed used oil filters for recycling.
There are few barriers to
recycling used motor oil, bottles
and filters in South Carolina.
Continued on the following page

South Carolina Solid Waste Management Annual Report for Fiscal Year 2013 33
1. The Three Rivers Solid Waste Authority (SWA) provides solid waste management services to local governments in Aiken, Allendale, Bamberg, Barnwell, Calhoun, Edgefield, McCormick, Orangeburg and Saluda counties.
2. The Tri-County SWA provides solid waste management services to local governments in Edgefield, McCormick and Saluda counties.
tGrant funding awarded to municipalities and regional authorities primarily is used to promote used motor oil recycling. Collection sites operated and/or used motor oil collected by a municipality are included in the county’s total.
NOTES: The majority of sites listed above are provided by local governments, but the total number (921) includes retailers, quick lubes and auto parts stores. Gallons are converted to weight (1 gallon = 7 pounds).
TABLE 6.2: Number of DIY Used Motor Oil Collection Sites, FY13 Grants Awarded, Gallons Collected and Tonnage Equivalent by County (continued)
GRANTEE NUMBER OF SITES FY13 BUDGET FY13 GALLONS TONS
Greenville 40 $9,663.00 65,677 229.87
Greenville, City of t $1,500.00 t t
Simpsonville, City of t $2,317.00 t t
Greenwood 14 $15,542.00 7,697 26.94
Hampton 13 $7,775.00 7,123 24.93
Horry 45 $21,290.00 45,766 160.18
Jasper 7 $2,750.00 6,189 21.66
Kershaw 17 $5,750.00 21,600 75.6
Lancaster 16 $8,850.00 1,186 4.15
Laurens 13 $3,750.00 9,140 31.99
Lee 10 $5,230.00 3,560 12.46
Lexington 34 $59,939.00 73,749 258.12
Marion 9 $3,885.00 2,723 9.53
Marlboro 17 $17,005.00 1,723 6.03
McCormick 4 $3,000.00 2,340 8.19
Newberry 15 $7,155.00 8,143 28.5
Oconee 21 $9,750.00 15,909 55.68
Orangeburg 30 $11,440.00 13,629 47.7
Pickens 19 $6,560.00 33,891 118.62
Liberty, City of t $6,450.00 t t
Richland 31 $13,666.00 27,400 95.9
Columbia, City of t $5,750.00 t t
Saluda 9 $18,315.00 7,443 26.05
Spartanburg 43 $8,150.00 42,551 148.93
Spartanburg, City of t $3,750.00 t t
Sumter 22 $24,694.00 15,457 54.1
Sumter, City of t $7,550.00 t t
Union 10 $62,260.00 3,777 13.22
Williamsburg 25 $16,720.00 11,694 40.93
York 41 $24,500.00 52,246 182.86
Rock Hill, City of t $5,110.00 t t
Three Rivers SWA1 t $750.00 t t
Tri-County SWA2 t $1,140.00 t t
TOTAL 921 $676,748.00 828,838 2,901.00

34 South Carolina Solid Waste Management Annual Report for Fiscal Year 2013
DHEC’s Office of Solid Waste Reduction and Recycling is responsible for compiling and reviewing the data submitted by state agencies and state-supported colleges/universities and publishing the “State Agencies & Colleges/Universities Recycling & Buying Recycled Annual Report.”
This section is a condensed version of the report and provides information for fiscal year (FY) 2013
The S.C. Solid Waste Policy and Management Act of 1991 (Act) – S.C. Code of Laws § 44-96-140 – requires state agencies and state-supported colleges/universities to:
l establish recycling programs for the collection of selected material including, but not limited to, aluminum, cardboard, glass, lead-acid batteries, paper, plastic, tires and used motor oil;
l evaluate and make necessary modifications to their programs to ensure material is recycled to the maximum extent possible; and
l establish waste reduction programs for material used in the course of operations to achieve the maximum feasible reduction.
In addition, the Act requires state agencies and state-supported colleges/universities to submit to the S.C. Department of Health and Environmental Control (DHEC) by September 15 of each year the following information:
l reports detailing their recycling programs; and
l lists of products purchased that contain recycled material.
The Act requires DHEC to summarize this data and submit a report to the Governor and General Assembly by November 1 of each year. As part of the report, DHEC is required to determine the percentage of state purchases that contain recycled material. Since no statewide system is in place to track the purchase of recycled-content products, this percentage cannot be reported.
SECTION
7Recycling:
State Agencies & Colleges/Universities
CHART 7.1: Percentage of Recyclables Collected by State Agencies
PAPER 23%
BANNED ITEMS
26%MISCELLANEOUS
ITEMS
17%
COMMINGLEDRECYCLABLES
2%
GLASS
<1%
METAL
31%
PLASTIC 1%
NOTE: The total amount exceeds 100 percent due to rounding.
47 state agencies (of the 75 that provided data)
reported buying recycled-content
materials.
State agencies collected
an additional
760 tons of recyclables in FY13 than in FY12.
Metal was the top commodity recycled
with more than
3,300 tons collected.
Nearly
11,000 tons of recyclables
were collected by state agencies.
NOTE: While C&D debris is included in the “State Agencies & Colleges/Universities Recycling & Buying Recycled Annual Report,” it is not included in the state’s MSW recycling rate.

South Carolina Solid Waste Management Annual Report for Fiscal Year 2013 35
recycled in FY12. This data was compiled from the information reported by 75 state agencies and other
governmental bodies as well as 36 colleges/universities.
Overall, state agencies reported recycling 10,979 tons of material in FY13 – about a 7 percent increase from the 10,218 tons of material recycled the previous FY. Metal (e.g., aluminum, ferrous metals, steel
cans) was the most recycled commodity followed by Banned Items (e.g., appliances, electronics, lead-acid batteries, tires, used motor oil, yard trimmings).
Colleges/universities reported recycling about 14,074 tons of material – a 54 percent increase from the 9,117 tons of material recycled the previous FY. Miscellaneous Items (mostly construction and demolition debris) were the most recycled commodity followed by Paper. It is important to note that while construction and demolition (C&D) debris is counted as part of the overall recycling totals of state agencies and colleges/universities, it is not included in South Carolina’s definition of municipal solid waste (MSW) and therefore not included in the state’s MSW recycling rate.
The recycled-content products purchased most frequently by state agencies and colleges/universities were office paper and inkjet/toner cartridges.
reflecting recycling and buying recycled activities from July 1, 2012 to June 30, 2013. (To see the complete report, visit www.scdhec.gov/recycle.)
Data regarding the amount of material recycled was received either directly from the state agency or college/university that completed the survey provided by DHEC or from vendors providing recycling services. Both public and private colleges/universities are included in this report although only state-supported colleges/universities are required to provide information.
In FY13, about 25,053 tons of material was recycled by state agencies and colleges/universities – an increase of about 30 percent from the 19,335 tons
In FY13, state agencies and colleges/universities
recycled 25,053 tons of material – about 30 percent more than FY12.
More than
14,000 tons of recyclables were collected by
colleges/universities.
25 colleges/
universities (of the 36 that provided data) reported buying recycled-content
materials.
Colleges/universities collected
an additional
4,956 tons of recyclables in FY13 than in FY12.
Nearly
4,000 tons of paper were recycled
by college/universities.
CHART 7.2: Percentage of Recyclables Collected by Colleges/Universities
METAL
9%PAPER 28%
BANNED ITEMS
25%
MISCELLANEOUS ITEMS
32%
COMMINGLED RECYCLABLES 5%
PLASTIC <1%
GLASS <1%
NOTE: The total amount exceeds 100 percent due to rounding.
Colleges/universities
reported recycling about 14,074
tons of material – a 54 percent
increase from the previous FY.

36 South Carolina Solid Waste Management Annual Report for Fiscal Year 2013
TABLE 7.3: Commodities Recycled in Tons by State Agencies
COMMODITIES RECYCLED TONS
BANNED ITEMS Appliances 38.94Electronics 1,706.90Lead-acid batteries 48.75Tires 146.20Used motor oil 868.47Yard trimmings 8.26
TOTAL BANNED ITEMS 2,817.52COMMINGLED RECYCLABLES
May include: aluminum cans; cardboard; paper; and/or plastic
191.95
TOTAL COMMINGLED RECYCLABLES 191.95GLASS (Containers & Packaging)
Brown 0.94Clear 1.68Green 0.25Other/mixed glass 93.78
TOTAL GLASS 96.65METAL Aluminium (cans, foil) 225.65
Ferrous metals 2,360.10Steel cans 161.18Other/mixed metal 612.11
TOTAL METAL 3,359.04PAPER Books 57.06
Cardboard 691.22Magazines 11.40Newspapers and inserts 7.20Office paper 1,411.74Paperboard 0.91Phone books 11.87Other/mixed paper 323.18
TOTAL PAPER 2,514.58PLASTIC HDPE 67.51
LDPE 0.16PET 1.77Vinyl 0.60Other/mixed plastic 64.78
TOTAL PLASTIC 134.82MISCELLANEOUS ITEMS
1. Wood includes furniture, cabinets and pallets.
2. Other includes ballasts, car parts, fishing line, oily rags and parts washer waste.
Antifreeze 15.51Carpet 0.85Clothing/textiles 60.03Construction & demolition debris
834.88
Cooking oil 7.47
Fluorescent bulbs 13.30
Food scraps 2.43Inkjet/toner cartridges 15.06Paint (oil or latex) 2.43Rechargeable batteries 3.66Used oil filters 43.66Wood1 803.71Other2 61.22
TOTAL MISCELLANEOUS ITEMS 1,864.21TOTAL FOR ALL 10,978.77
TABLE 7.4: Commodities Recycled in Tons by Colleges and Universities
COMMODITIES RECYCLED TONSBANNED ITEMS Appliances 628.91
Electronics 344.11Lead-acid batteries 9.95Tires 47.75Used motor oil 34.05Yard trimmings 2,511.26
TOTAL BANNED ITEMS 3,576.03COMMINGLED RECYCLABLES
May include: aluminum cans; cardboard; glass; paper; and/or plastic
750.95
TOTAL COMMINGLED RECYCLABLES 750.95GLASS (Containers & Packaging)
Brown 0.05Clear 4.16Green 0.00Other/mixed glass 20.21
TOTAL GLASS 24.42METAL Aluminium (cans, foil) 11.45
Ferrous metals 351.44Steel cans 35.79Other/mixed metal 824.55
TOTAL METAL 1,223.23PAPER Books 46.08
Cardboard 2,127.16Magazines 8.16Newspapers and inserts 4.54Office paper 1,081.97Paperboard 1.20Phone books 2.06Other/mixed paper 631.83
TOTAL PAPER 3,903.00PLASTIC HDPE 3.51
LDPE 2.40PET 23.46Vinyl 0.00Other/mixed plastic 70.61
TOTAL PLASTIC 99.98MISCELLANEOUS ITEMS
1. Wood includes furniture, cabinets and pallets.
2. Other includes ballasts, books, hangers, mattresses, medical products, radiology film, x-ray film and xylene.
Antifreeze 6.48Carpet 46.70Clothing/textiles 0.39Construction & demolition debris
3,902.86
Cooking oil 56.05Fluorescent bulbs 24.27Food scraps 218.95Inkjet/toner cartridges 15.76Paint (oil or latex) 5.32Rechargeable batteries 1.48Used oil filters 0.98Wood1 180.63
Other2 36.49
TOTAL MISCELLANEOUS ITEMS 4,496.36TOTAL FOR ALL 14,073.97

South Carolina Solid Waste Management Annual Report for Fiscal Year 2013 37
Recycling is a natural fit at South Carolina’s State Parks.
S.C. State Parks recycled more than 423 tons of material in FY13 according to the S.C. Department of Parks, Recreation and Tourism (PRT). This is an increase of 605 percent from the previous FY.
This recycling success is in part due to the Recycling at the Parks Partnership. This public-private partnership – formed in 2010 – helped South Carolina become the first state in the nation to offer recycling at each of its 47 state parks and historic sites. The parks have more than 7 million annual visitors.
The partnership – which includes PRT, DHEC, the S.C. Department of Transportation, PalmettoPride and Sonoco Recycling – provided containers, signage and other assistance to make recycling work at the parks.
State Agencies Reporting for FY13
l Administrative Law Court
l Arts Commission
l Attorney General
l Budget and Control Board
l Commission for the Blind
l Commission for Minority Affairs
l Commission on Higher Education
l Commission on Indigent Defense
l Commission on Prosecution Coordination
l Comptroller General
l Court Administration
l Criminal Justice Academy
l Department of Agriculture
l Department of Alcohol and Other Drug Abuse Services
l Department of Archives and History
l Department of Commerce
l Department of Consumer Affairs
l Department of Corrections
l Department of Disabilities and Special Needs
l Department of Education
l Department of Employment and Workforce
l Department of Health and Environmental Control
l Department of Health and Human Services
l Department of Insurance
l Department of Juvenile Justice
l Department of Labor, Licensing and Regulation
l Department of Mental Health
l Department of Motor Vehicles
l Department of Natural Resources
l Department of Parks, Recreation and Tourism
l Department of Probation, Parole and Pardon Services
l Department of Public Safety
l Department of Revenue
l Department of Social Services
l Department of Transportation
l Education Lottery Commission
l Educational Television Network
l Emergency Management Division
l Ethics Commission
l Forestry Commission
l Governor’s Mansion
l Governor’s School for the Arts and Humanities
l Governor’s School for Science and Mathematics
Continued on the following page

38 South Carolina Solid Waste Management Annual Report for Fiscal Year 2013
More Waste Reduction Efforts on CampusMany college/university campuses have begun programs to encourage the reuse of unwanted material, especially at the end of the semester when students are moving out of campus housing.
These programs give students an opportunity to donate various items including: clothing; food; furniture; appliances; books; hangers; and electronics.
In some cases, the items are held until the start of the next semester when students can use the items again. In other cases, the items are moved more quickly. The University of South Carolina holds a yard sale a few weeks after graduation to sell reusable items donated by students.
In FY13, about 1,730 tons were reported as being reused. This is a decrease of 18 percent from the 2,043 tons reported as being reused in FY12.
State Agencies Reporting for FY13 (continued)
l Higher Education Tuition Grants Commission
l House of Representatives
l Human Affairs Commission
l Jobs-Economic Development Authority
l Legislative Audit Council
l Legislative Council
l Legislative Printing, Information and Technology Systems
l Military Department
l Office of the Governor
l Office of the Lt. Governor
l Office of Regulatory Staff
l Office of the State Auditor
l Office of the State Treasurer
l Patients’ Compensation Fund
l Patriots Point Development Authority
l Public Employee Benefit Authority
l Public Service Commission
l Santee Cooper
l School for the Deaf and Blind
l Sea Grant Consortium
l Secretary of State
l Senate
l State Accident Fund
l State Housing Finance and Development Authority
l State Law Enforcement Division
l State Library
l State Museum
l State Ports Authority
l Technical College System
l Vocational Rehabilitation Department
l Wil Lou Gray Opportunity School
l Workers’ Compensation Commission
Colleges/Universities Reporting for FY13l Aiken Technical
College
l Bob Jones University
l Central Carolina Technical College
l Charleston Southern University
l The Citadel
l Claflin University
l Clemson University
l Coastal Carolina University
l Coker College
l College of Charleston
l Converse College
l Denmark Technical College
l Erskine College and Seminary
l Florence-Darlington Technical College
l Francis Marion University
l Furman University
l Greenville Technical College
l Horry-Georgetown Technical College
l Lander University
l Medical University of South Carolina
l Midlands Technical College
l Northeastern Technical College
l Orangeburg-Calhoun Technical College
l Piedmont Technical College
l Presbyterian College
l Spartanburg Community College
l Technical College of the Lowcountry
l Trident Technical College
l University of South Carolina (USC)
l USC – Aiken
l USC – Lancaster
l USC – Sumter
l USC – Upstate
l Williamsburg Technical College
l Winthrop University
l York Technical College

South Carolina Solid Waste Management Annual Report for Fiscal Year 2013 39
The S.C. Solid Waste Policy and Management Act of 1991 – S.C. Code of Laws § 44-96-80 – requires counties or regions to annually report municipal solid waste (MSW) recycling data by commodity and amount to the S.C. Department of Health and Environmental Control. The commodities reported are: glass; metal; paper; plastic; banned items; miscellaneous items; and commingled recyclables. The latter three commodities are defined in Section 5.
Recycling data also was collected from other sources including waste tire processors, electronics recycling vendors, used motor oil collectors, state agencies and colleges/universities as well as businesses and industries. The data reported by these sources was attributed to counties based on population or source.
Once collected, the data is placed into one of three categories based on the source of the material: residential; commercial/institutional; and industrial (office/packaging). Previously, commercial and institutional categories have been reported separately. The categories have been combined to simplify and improve the accuracy of the information. See Section 2 for types and examples of material from each of these sources.
Businesses and industries are not required to report their recycling activities. Unfortunately, the voluntary reporting by these two sources is inconsistent and harms the state’s ability to accurately measure its recycling efforts. Residential recycling tonnages have accounted for no more than 40 percent of the state’s total MSW recycled in each of the past five FYs. See Table 8.1. This means that commercial/institutional and industrial (office/packaging) sectors constitute a majority of the reported MSW recycling and is subject to significant fluctuations.
South Carolina’s MSW recycling rate increased to 31.5 percent in fiscal year (FY) 2013 (July 1, 2012 to June 30, 2013) from 29.5 percent in FY12. In South Carolina, only MSW is used to measure the state’s
TABLE 8.1: S.C. Residential Recycling as a Percent of Total MSW Recycled
FY09 FY10 FY11 FY12 FY1330% 40% 35% 37% 35%
recycling efforts. See the definition in Section 2. Overall, the amount of MSW recycled increased more than 11 percent from 1,229,100 tons in FY12 to 1,371,960 tons in FY13. For MSW recycling since FY09, see Table 8.2 for total MSW and residential only.
The state’s goal is to recycle at least 40 percent of its MSW and reduce MSW disposal to 3.25 pounds (or less) per person per day (p/p/d) by 2020. In FY13, three counties – Horry, Kershaw and Oconee – had a recycling rate greater than 40 percent. Thirty-one counties had disposal of 3.25 p/p/d or less. The counties are Abbeville, Aiken, Allendale, Anderson, Bamberg, Berkeley, Calhoun, Chester, Chesterfield, Clarendon, Colleton, Darlington, Dillon, Dorchester, Edgefield, Hampton, Jasper, Kershaw, Lancaster, Laurens, Lee, Lexington, Marion, Marlboro, McCormick, Oconee, Orangeburg, Pickens, Saluda, Sumter and Williamsburg.
See Table 9.10 on page 97 for a county-by-county comparison of MSW recycling and disposal data.
TABLE 8.2: S.C. MSW Recycling Tonnages
TONS +/– IN TONS FROM PREVIOUS FY
CHANGE FROM PREVIOUS FY
FY09All MSW 912,961 –171,965 –16%Residential Only 269,511 –75,229 –22%
FY10All MSW 1,063,521 +150,560 +16%Residential Only 421,640 +152,129 +56%
FY11All MSW 1,172,768 +109,247 +10%Residential Only 413,652 –7,988 –2%
FY12All MSW 1,229,100 +56,332 +5%Residential Only 460,588 +46,936 +11%
FY13All MSW 1,371,960 +142,860 +11.6%Residential Only 478,426 +17,838 +3.8%
SECTION
8Recycling:
The State & Counties at a Glance
Horry, Kershaw and Oconee
counties exceeded the state’s MSW
recycling goal of 40 percent.

40 South Carolina Solid Waste Management Annual Report for Fiscal Year 2013
SOUTH CAROLINA
TABLE 8.3: South Carolina MSW Summary
POPULATION DROP-OFF CENTERS
CURBSIDE PROGRAMS
RECYCLING RATE (PERCENT)
RECYCLED (P/P/D)
RECYCLED (TONS)
DISPOSED (P/P/D)
DISPOSED (TONS)
4,723,723 642 93 31.5 1.59 1,371,960 3.5 2,985,852
TABLE 8.4: South Carolina MSW Recycling Data in Tons
COMMODITY RESIDENTIAL COMMERCIAL/INSTITUTIONAL
INDUSTRIAL(OFFICE/PACKAGING) TOTAL
GLASSContainers and Packaging – Brown 3,836.26 170.43 554.64 4,561.33Containers and Packaging – Clear 893.06 2.44 326.61 1,222.11Containers and Packaging – Green 1,617.12 8.54 2.68 1,628.34Containers and Packaging – Mixed 1,147.09 0.25 623.9 1,771.24TOTAL GLASS 7,493.53 181.66 1,507.83 9,183.02
METALAluminum Cans 756.60 2,779.68 245.55 3,781.83Ferrous, Magnetic 1,920.41 231,127.49 30,789.56 263,837.46Non-ferrous, Non-magnetic 13,392.67 20,242.80 21,504.80 55,140.26Steel Cans 10.25 6,061.55 4,512.62 10,584.42Mixed Scrap Metal 520.05 6,281.22 478.04 7,279.31TOTAL METAL 16,599.98 266,492.74 57,530.57 340,623.29
PAPERCardboard 36,101.07 317,963.29 23,656.18 377,720.54Magazines 798.37 141.82 6.66 946.85Newspapers and Inserts 21,470.1 23,199.81 17,239.63 61,909.54Office Paper 11,470.33 2,852.18 18.02 14,340.53Paperboard 1,016.28 16,683.24 2,050.16 19,749.68Telephone Books 0.00 8.68 13.80 22.48Mixed Paper 2.02 89.99 2.69 94.70TOTAL PAPER 70,858.17 360,939.01 42,987.13 474,784.31
PLASTICHDPE 1,081.8 668.21 435.29 2,185.31LDPE 0.00 227.44 193.42 420.86PET 1,190.31 191.62 650.28 2,032.21PP 0.00 14.88 0.00 14.88PS 0.00 0.00 0.00 0.00Vinyl 0.00 2.11 143.34 145.45Commingled PET & HDPE 1,498.6 212.94 41.69 1,753.23Mixed Plastic (if not listed above) 541.9 4,618.94 8,101.08 13,261.92TOTAL PLASTIC 4,312.62 5,936.14 9,565.1 19,813.86
BANNED ITEMSAppliances 11,218.01 4,672.35 4,002.01 19,892.36Electronics 7,784.92 3,410.74 364.26 11,559.92Lead-acid Batteries (automobiles, trucks, motorcycles – small sealed lead-acid batteries) 11,815.33 16,446.36 620.47 28,882.17
Tires (car, truck) 38,571.72 8,289.68 2,078.60 48,940.00Used Motor Oil (automobiles, trucks, motorcycles) 2,900.94 –– –– 2,900.94
Yard Trimmings 224,687.57 40,951.00 50.00 265,688.57TOTAL BANNED ITEMS 296,978.49 73,770.13 7,115.34 377,863.96
MISCELLANEOUS ITEMSAntifreeze 49.56 256.78 15.41 321.74Cooking Oil 287.63 4,490.34 1,705.79 6,483.75Fluorescent Bulbs 701.65 110.67 76.32 888.63Food Scraps 1,544.07 3,603.73 3,758.46 8,906.26Hazardous Materials 3,349.35 0.00 0.00 3,349.35Inkjet and Toner Cartridges 84.10 67.26 17.30 168.65Mattresses 396.74 1,491.16 2,972.68 4,860.58Paint 198.57 164.10 0.00 362.67Rechargeable Batteries 330.36 14.14 231.97 576.46Textiles 15.25 18.95 11.40 45.60Used Motor Oil Filters 512.65 447.74 2,874.75 3,835.14Wood Packaging 193.54 530.36 127.17 851.07Other Items 215.47 4,503.89 21,772.20 26,491.56TOTAL MISCELLANEOUS ITEMS 7,878.94 15,699.12 33,563.45 57,141.51
COMMINGLED RECYCLABLESTOTAL COMMINGLED RECYCLABLES 74,304.71 11,161.67 7,084.03 92,550.41TOTAL FOR ALL 478,426.43 734,180.47 159,353.45 1,371,960.30

South Carolina Solid Waste Management Annual Report for Fiscal Year 2013 41
ABBEVILLE COUNTY
TABLE 8.5: Abbeville County MSW Summary
POPULATION DROP-OFF CENTERS
CURBSIDE PROGRAMS
RECYCLING RATE (PERCENT)
RECYCLED (P/P/D)
RECYCLED (TONS)
DISPOSED (P/P/D)
DISPOSED (TONS)
25,101 10 1 19.9 0.69 3,163.72 2.8 12,755
TABLE 8.6: Abbeville County MSW Recycling Data in Tons
COMMODITY RESIDENTIAL COMMERCIAL/INSTITUTIONAL
INDUSTRIAL(OFFICE/PACKAGING) TOTAL
GLASSContainers & Packaging - Brown 0.00 0.00 0.00 0.00Containers & Packaging - Clear 0.00 0.00 0.00 0.00Containers & Packaging - Green 0.00 0.00 0.00 0.00Containers & Packaging - Mixed 0.29 0.00 0.00 0.29TOTAL GLASS 0.29 0 0 0.29
METALAluminum Cans 3.42 1.00 0.00 4.42Ferrous, Magnetic 0.00 0.00 95.00 95.00Non-Ferrous, Non-magnetic 0.00 0.00 1.60 1.60Steel Cans 0.00 0.10 0.00 0.10Mixed Scrap Metal 252.14 0.50 293.99 546.63TOTAL METAL 255.56 1.60 390.59 647.75
PAPERCardboard 424.87 278.59 307.92 1,011.38Magazines 0.00 0.00 0.00 0.00Newspaper and Inserts 0.00 0.00 0.00 0.00Office Paper 0.00 3.22 3.91 7.13Paperboard 0.00 0.00 0.00 0.00Phone Books 0.00 0.00 0.00 0.00Mixed Paper 82.46 2.20 20.72 105.38TOTAL PAPER 507.33 284.01 332.55 1,123.89
PLASTICHDPE 23.42 0.00 0.00 23.42LDPE 0.00 0.00 25.25 25.25PET 26.38 0.00 0.00 26.38PP 0.00 0.00 0.00 0.00PS 0.00 0.00 0.00 0.00Vinyl 0.00 0.00 140.84 140.84Commingled PET and HDPE 0.00 0.00 0.00 0.00Mixed Plastic 0.00 2.00 63.28 65.28TOTAL PLASTIC 49.80 2.00 229.37 281.17
BANNED ITEMSAppliances 0.00 1.38 0.00 1.38Electronics 102.13 2.64 1.58 106.34Lead-acid Batteries (automobiles, trucks, motorcycles – small sealed lead-acid batteries) 61.42 164.80 0.17 226.40
Tires (automobiles, trucks, motorcycles) 275.99 0.00 0.00 275.99Used Motor Oil (automobiles, trucks, motorcycles) 19.89 –– –– 19.89
Yard Trimmings 0.00 0.00 0.00 0.00TOTAL BANNED ITEMS 459.43 168.82 1.75 630.00
MISCELLANEOUS ITEMSAntifreeze 0.00 0.00 0.00 0.00Cooking Oil/Grease 0.00 0.00 0.00 0.00Fluorescent Bulbs 0.00 0.10 1.25 1.35Food Scraps 0.00 0.00 0.00 0.00Household Hazardous Materials 0.00 0.00 0.00 0.00Inkjet/Toner Cartridges 0.00 0.00 0.00 0.00Mattresses 0.00 0.00 0.00 0.00Paint 0.00 0.00 0.00 0.00Rechargeable Batteries 0.00 0.05 0.07 0.12Textiles (recycled – not donated for reuse) 0.00 3.00 0.00 3.00Used Motor Oil Filters 1.18 0.39 0.00 1.57Wood Packaging (pallets, crates, barrels) 0.00 0.00 457.07 457.07Other Items 0.39 0.00 9.14 9.53TOTAL MISCELLANEOUS ITEMS 1.57 3.54 467.53 472.64
COMMINGLED RECYCLABLESTOTAL COMMINGLED RECYCLABLES 3.37 4.60 0.00 7.97TOTAL FOR ALL 1,277.35 464.58 1,421.79 3,163.72

42 South Carolina Solid Waste Management Annual Report for Fiscal Year 2013
AIKEN COUNTY
TABLE 8.7: Aiken County MSW Summary
POPULATION DROP-OFF CENTERS
CURBSIDE PROGRAMS
RECYCLING RATE (PERCENT)
RECYCLED (P/P/D)
RECYCLED (TONS)
DISPOSED (P/P/D)
DISPOSED (TONS)
162,812 12 3 19.2 0.72 21,259.65 3.0 89,343
TABLE 8.8: Aiken County MSW Recycling Data in Tons
COMMODITY RESIDENTIAL COMMERCIAL/INSTITUTIONAL
INDUSTRIAL(OFFICE/PACKAGING) TOTAL
GLASSContainers & Packaging - Brown 0.00 0.00 0.38 0.38Containers & Packaging - Clear 0.00 0.00 0.00 0.00Containers & Packaging - Green 0.00 0.00 0.00 0.00Containers & Packaging - Mixed 217.94 0.00 0.00 217.94TOTAL GLASS 217.94 0.00 0.38 218.32
METALAluminum Cans 25.54 1.00 12.23 38.77Ferrous, Magnetic 0.00 0.00 200.00 200.00Non-Ferrous, Non-magnetic 0.00 0.00 0.00 0.00Steel Cans 0.00 0.00 0.00 0.00Mixed Scrap Metal 127.60 0.00 481.35 608.95TOTAL METAL 153.14 1.00 693.58 847.72
PAPERCardboard 1,576.89 7.03 3,414.23 4,998.15Magazines 0.00 0.00 0.00 0.00Newspaper and Inserts 1,413.99 0.00 0.00 1,413.99Office Paper 148.54 0.00 0.66 149.20Paperboard 0.00 0.00 0.00 0.00Phone Books 0.00 0.00 0.00 0.00Mixed Paper 264.70 0.00 2,323.65 2,588.35TOTAL PAPER 3,404.12 7.03 5,738.54 9,149.69
PLASTICHDPE 69.98 0.00 3.00 72.98LDPE 0.00 0.00 0.00 0.00PET 128.30 0.00 0.00 128.30PP 0.00 0.00 0.00 0.00PS 0.00 0.00 0.00 0.00Vinyl 0.00 0.00 0.00 0.00Commingled PET and HDPE 0.00 0.00 0.00 0.00Mixed Plastic 16.05 1.00 800.10 817.15TOTAL PLASTIC 214.33 1.00 803.10 1,018.43
BANNED ITEMSAppliances 0.00 0.00 0.55 0.55Electronics 373.08 59.78 79.39 512.25Lead-acid Batteries (automobiles, trucks, motorcycles – small sealed lead-acid batteries) 398.30 392.14 24.26 814.70
Tires (automobiles, trucks, motorcycles) 1,293.35 0.00 0.00 1,293.35Used Motor Oil (automobiles, trucks, motorcycles) 126.31 –– –– 126.31
Yard Trimmings 0.00 0.00 0.00 0.00TOTAL BANNED ITEMS 2,191.04 451.91 104.20 2,747.15
MISCELLANEOUS ITEMSAntifreeze 0.00 3.88 5.45 9.33Cooking Oil/Grease 0.00 0.20 0.00 0.20Fluorescent Bulbs 0.00 4.55 11.48 16.04Food Scraps 0.00 0.00 0.00 0.00Household Hazardous Materials 2.99 0.00 0.00 2.99Inkjet/Toner Cartridges 0.00 0.50 0.03 0.53Mattresses 0.00 0.00 0.00 0.00Paint 6.52 1.25 0.00 7.77Rechargeable Batteries 0.00 0.73 1.61 2.34Textiles (recycled – not donated for reuse) 0.00 0.00 0.00 0.00Used Motor Oil Filters 0.21 10.88 0.00 11.09Wood Packaging (pallets, crates, barrels) 0.07 3.00 162.85 165.92Other Items 0.00 0.13 103.77 103.91TOTAL MISCELLANEOUS ITEMS 9.79 25.12 285.19 320.10
COMMINGLED RECYCLABLESTOTAL COMMINGLED RECYCLABLES 6,946.24 0.00 12.00 6,958.24TOTAL FOR ALL 13,136.60 486.06 7,636.99 21,259.65

South Carolina Solid Waste Management Annual Report for Fiscal Year 2013 43
ALLENDALE COUNTY
TABLE 8.9: Allendale County MSW Summary
POPULATION DROP-OFF CENTERS
CURBSIDE PROGRAMS
RECYCLING RATE (PERCENT)
RECYCLED (P/P/D)
RECYCLED (TONS)
DISPOSED (P/P/D)
DISPOSED (TONS)
9,988 5 0 4.8 0.08 149.53 1.6 2,974
TABLE 8.10: Allendale County MSW Recycling Data in Tons
COMMODITY RESIDENTIAL COMMERCIAL/INSTITUTIONAL
INDUSTRIAL(OFFICE/PACKAGING) TOTAL
GLASSContainers & Packaging - Brown 0.00 0.00 0.00 0.00Containers & Packaging - Clear 0.00 0.00 0.00 0.00Containers & Packaging - Green 0.00 0.00 0.00 0.00Containers & Packaging - Mixed 0.00 0.00 0.00 0.00TOTAL GLASS 0.00 0.00 0.00 0.00
METALAluminum Cans 0.00 0.00 0.00 0.00Ferrous, Magnetic 0.00 0.00 0.00 0.00Non-Ferrous, Non-magnetic 0.00 0.00 0.00 0.00Steel Cans 0.00 0.00 0.00 0.00Mixed Scrap Metal 18.28 0.00 0.00 18.28TOTAL METAL 18.28 0.00 0.00 18.28
PAPERCardboard 2.69 0.00 0.00 2.69Magazines 0.00 0.00 0.00 0.00Newspaper and Inserts 8.08 0.00 0.00 8.08Office Paper 0.00 0.00 0.00 0.00Paperboard 0.00 0.00 0.00 0.00Phone Books 0.00 0.00 0.00 0.00Mixed Paper 0.00 0.00 0.00 0.00TOTAL PAPER 10.77 0.00 0.00 10.77
PLASTICHDPE 2.30 0.00 0.00 2.30LDPE 0.00 0.00 0.00 0.00PET 0.00 0.00 0.00 0.00PP 0.00 0.00 0.00 0.00PS 0.00 0.00 0.00 0.00Vinyl 0.00 0.00 0.00 0.00Commingled PET and HDPE 0.55 0.00 0.00 0.55Mixed Plastic 0.00 0.00 0.00 0.00TOTAL PLASTIC 2.85 0.00 0.00 2.85
BANNED ITEMSAppliances 0.00 0.00 0.00 0.00Electronics 25.64 0.00 0.00 25.64Lead-acid Batteries (automobiles, trucks, motorcycles – small sealed lead-acid batteries) 24.19 24.19 0.00 48.38
Tires (automobiles, trucks, motorcycles) 38.45 0.00 0.00 38.45Used Motor Oil (automobiles, trucks, motorcycles) 5.16 –– –– 5.16
Yard Trimmings 0.00 0.00 0.00 0.00TOTAL BANNED ITEMS 93.44 24.19 0.00 117.63
MISCELLANEOUS ITEMSAntifreeze 0.00 0.00 0.00 0.00Cooking Oil/Grease 0.00 0.00 0.00 0.00Fluorescent Bulbs 0.00 0.00 0.00 0.00Food Scraps 0.00 0.00 0.00 0.00Household Hazardous Materials 0.00 0.00 0.00 0.00Inkjet/Toner Cartridges 0.00 0.00 0.00 0.00Mattresses 0.00 0.00 0.00 0.00Paint 0.00 0.00 0.00 0.00Rechargeable Batteries 0.00 0.00 0.00 0.00Textiles (recycled – not donated for reuse) 0.00 0.00 0.00 0.00Used Motor Oil Filters 0.00 0.00 0.00 0.00Wood Packaging (pallets, crates, barrels) 0.00 0.00 0.00 0.00Other Items 0.00 0.00 0.00 0.00TOTAL MISCELLANEOUS ITEMS 0.00 0.00 0.00 0.00
COMMINGLED RECYCLABLESTOTAL COMMINGLED RECYCLABLES 0.00 0.00 0.00 0.00TOTAL FOR ALL 125.34 24.19 0.00 149.53

44 South Carolina Solid Waste Management Annual Report for Fiscal Year 2013
ANDERSON COUNTY
TABLE 8.11: Anderson County MSW Summary
POPULATION DROP-OFF CENTERS
CURBSIDE PROGRAMS
RECYCLING RATE (PERCENT)
RECYCLED (P/P/D)
RECYCLED (TONS)
DISPOSED (P/P/D)
DISPOSED (TONS)
189,355 20 2 29.2 1.01 34,794.04 2.4 84,306
TABLE 8.12: Anderson County MSW Recycling Data in Tons
COMMODITY RESIDENTIAL COMMERCIAL/INSTITUTIONAL
INDUSTRIAL(OFFICE/PACKAGING) TOTAL
GLASSContainers & Packaging - Brown 111.58 0.00 0.00 111.58Containers & Packaging - Clear 111.58 0.00 0.00 111.58Containers & Packaging - Green 111.60 0.00 623.90 735.50Containers & Packaging - Mixed 0.00 0.00 0.25 0.25TOTAL GLASS 334.76 0.00 624.15 958.91
METALAluminum Cans 31.54 0.76 2.48 34.78Ferrous, Magnetic 0.00 12,616.60 96.80 12,713.40Non-Ferrous, Non-magnetic 0.00 1,219.00 0.00 1,219.00Steel Cans 0.00 0.00 1.94 1.94Mixed Scrap Metal 894.24 135.00 568.10 1,597.34TOTAL METAL 925.78 13,971.36 669.33 15,566.47
PAPERCardboard 524.60 3,392.21 1,409.35 5,326.16Magazines 0.00 0.37 0.00 0.37Newspaper and Inserts 0.00 1.33 0.25 1.58Office Paper 0.00 26.41 43.78 70.19Paperboard 0.00 0.00 0.00 0.00Phone Books 0.00 0.00 0.55 0.55Mixed Paper 1,052.46 1,223.25 189.81 2,465.52TOTAL PAPER 1,577.06 4,643.57 1,643.74 7,864.36
PLASTICHDPE 0.00 10.01 2.90 12.91LDPE 0.00 0.00 38.39 38.39PET 0.00 0.00 12.80 12.80PP 0.00 0.00 0.00 0.00PS 0.00 0.00 0.00 0.00Vinyl 0.00 0.00 2.50 2.50Commingled PET and HDPE 0.00 0.00 0.00 0.00Mixed Plastic 32.80 23.75 23.80 80.35TOTAL PLASTIC 32.80 33.76 80.39 146.95
BANNED ITEMSAppliances 0.00 0.00 0.00 0.00Electronics 292.22 28.29 0.00 320.50Lead-acid Batteries (automobiles, trucks, motorcycles – small sealed lead-acid batteries) 458.80 1,250.80 0.10 1,709.70
Tires (automobiles, trucks, motorcycles) 1,259.25 2,132.00 0.00 3,391.25Used Motor Oil (automobiles, trucks, motorcycles) 124.25 –– –– 124.25
Yard Trimmings 0.00 0.00 0.00 0.00TOTAL BANNED ITEMS 2,134.52 3,411.09 0.10 5,545.70
MISCELLANEOUS ITEMSAntifreeze 0.00 0.22 0.00 0.22Cooking Oil/Grease 0.00 0.00 0.00 0.00Fluorescent Bulbs 0.00 0.02 9.89 9.90Food Scraps 0.00 1,047.23 13.50 1,060.73Household Hazardous Materials 0.00 0.00 0.00 0.00Inkjet/Toner Cartridges 1.00 0.12 0.10 1.22Mattresses 0.00 0.00 0.00 0.00Paint 0.00 0.40 86.50 86.90Rechargeable Batteries 0.00 0.10 0.00 0.10Textiles (recycled – not donated for reuse) 0.00 0.00 0.00 0.00Used Motor Oil Filters 1.00 0.00 0.00 1.00Wood Packaging (pallets, crates, barrels) 0.00 6.90 895.19 902.09Other Items 0.00 0.66 0.00 0.66TOTAL MISCELLANEOUS ITEMS 2.00 1,055.65 1,005.18 2,063.82
COMMINGLED RECYCLABLESTOTAL COMMINGLED RECYCLABLES 1,406.57 990.50 251.75 2,648.82TOTAL FOR ALL 6,413.49 24,105.92 4,274.63 34,794.04

South Carolina Solid Waste Management Annual Report for Fiscal Year 2013 45
BAMBERG COUNTY
TABLE 8.13: Bamberg County MSW Summary
POPULATION DROP-OFF CENTERS
CURBSIDE PROGRAMS
RECYCLING RATE (PERCENT)
RECYCLED (P/P/D)
RECYCLED (TONS)
DISPOSED (P/P/D)
DISPOSED (TONS)
15,763 8 0 11.6 0.38 1,105.68 2.9 8,413
TABLE 8.14: Bamberg County MSW Recycling Data in Tons
COMMODITY RESIDENTIAL COMMERCIAL/INSTITUTIONAL
INDUSTRIAL(OFFICE/PACKAGING) TOTAL
GLASSContainers & Packaging - Brown 0.00 0.00 0.00 0.00Containers & Packaging - Clear 0.00 0.00 0.00 0.00Containers & Packaging - Green 0.00 0.00 0.00 0.00Containers & Packaging - Mixed 0.00 0.00 0.00 0.00TOTAL GLASS 0.00 0.00 0.00 0.00
METALAluminum Cans 0.00 0.00 0.00 0.00Ferrous, Magnetic 0.00 0.00 0.00 0.00Non-Ferrous, Non-magnetic 0.00 0.00 0.00 0.00Steel Cans 0.00 0.00 0.00 0.00Mixed Scrap Metal 30.27 0.00 0.00 30.27TOTAL METAL 30.27 0.00 0.00 30.27
PAPERCardboard 79.15 0.00 0.00 79.15Magazines 0.00 0.00 0.00 0.00Newspaper and Inserts 0.00 0.00 0.00 0.00Office Paper 0.00 0.00 0.00 0.00Paperboard 0.00 0.00 0.00 0.00Phone Books 0.00 0.00 0.00 0.00Mixed Paper 0.00 0.00 0.00 0.00TOTAL PAPER 79.15 0.00 0.00 79.15
PLASTICHDPE 0.00 0.00 0.00 0.00LDPE 0.00 0.00 0.00 0.00PET 0.00 0.00 0.00 0.00PP 0.00 0.00 0.00 0.00PS 0.00 0.00 0.00 0.00Vinyl 0.00 0.00 0.00 0.00Commingled PET and HDPE 0.00 0.00 0.00 0.00Mixed Plastic 1.72 0.00 0.00 1.72TOTAL PLASTIC 1.72 0.00 0.00 1.72
BANNED ITEMSAppliances 0.00 0.00 0.00 0.00Electronics 28.55 2.79 0.00 31.34Lead-acid Batteries (automobiles, trucks, motorcycles – small sealed lead-acid batteries) 38.18 38.18 0.00 76.36
Tires (automobiles, trucks, motorcycles) 182.34 0.00 0.00 182.34Used Motor Oil (automobiles, trucks, motorcycles) 13.00 –– –– 13.00
Yard Trimmings 691.50 0.00 0.00 691.50TOTAL BANNED ITEMS 953.57 40.97 0.00 994.54
MISCELLANEOUS ITEMSAntifreeze 0.00 0.00 0.00 0.00Cooking Oil/Grease 0.00 0.00 0.00 0.00Fluorescent Bulbs 0.00 0.00 0.00 0.00Food Scraps 0.00 0.00 0.00 0.00Household Hazardous Materials 0.00 0.00 0.00 0.00Inkjet/Toner Cartridges 0.00 0.00 0.00 0.00Mattresses 0.00 0.00 0.00 0.00Paint 0.00 0.00 0.00 0.00Rechargeable Batteries 0.00 0.00 0.00 0.00Textiles (recycled – not donated for reuse) 0.00 0.00 0.00 0.00Used Motor Oil Filters 0.00 0.00 0.00 0.00Wood Packaging (pallets, crates, barrels) 0.00 0.00 0.00 0.00Other Items 0.00 0.00 .00 0.00TOTAL MISCELLANEOUS ITEMS 0.00 0.00 0.00 0.00
COMMINGLED RECYCLABLESTOTAL COMMINGLED RECYCLABLES 0.00 0.00 0.00 0.00TOTAL FOR ALL 1,064.71 40.97 0.00 1,105.68

46 South Carolina Solid Waste Management Annual Report for Fiscal Year 2013
BARNWELL COUNTY
TABLE 8.15: Barnwell County MSW Summary
POPULATION DROP-OFF CENTERS
CURBSIDE PROGRAMS
RECYCLING RATE (PERCENT)
RECYCLED (P/P/D)
RECYCLED (TONS)
DISPOSED (P/P/D)
DISPOSED (TONS)
22,212 9 0 7 0.25 1,033.14 3.4 13,633
TABLE 8.16: Barnwell County MSW Recycling Data in Tons
COMMODITY RESIDENTIAL COMMERCIAL/INSTITUTIONAL
INDUSTRIAL(OFFICE/PACKAGING) TOTAL
GLASSContainers & Packaging - Brown 0.00 0.00 0.00 0.00Containers & Packaging - Clear 0.00 0.00 0.00 0.00Containers & Packaging - Green 0.00 0.00 0.00 0.00Containers & Packaging - Mixed 19.84 0.00 0.00 19.84TOTAL GLASS 19.84 0.00 0.00 19.84
METALAluminum Cans 0.73 0.00 0.00 0.73Ferrous, Magnetic 0.00 0.00 0.00 0.00Non-Ferrous, Non-magnetic 0.00 0.00 0.00 0.00Steel Cans 0.00 0.00 0.00 0.00Mixed Scrap Metal 112.00 0.00 0.00 112.00TOTAL METAL 112.73 0.00 0.00 112.73
PAPERCardboard 192.00 0.00 0.00 192.00Magazines 0.00 0.00 0.00 0.00Newspaper and Inserts 0.00 0.00 0.00 0.00Office Paper 0.00 0.00 0.00 0.00Paperboard 0.00 0.00 0.00 0.00Phone Books 0.00 0.00 0.00 0.00Mixed Paper 64.00 0.00 0.00 64.00TOTAL PAPER 256.00 0.00 0.00 256.00
PLASTICHDPE 0.00 0.00 0.00 0.00LDPE 0.00 0.00 0.00 0.00PET 0.00 0.00 0.00 0.00PP 0.00 0.00 0.00 0.00PS 0.00 0.00 0.00 0.00Vinyl 0.00 0.00 0.00 0.00Commingled PET and HDPE 16.14 0.00 0.00 16.14Mixed Plastic 0.00 0.00 0.00 0.00TOTAL PLASTIC 16.14 0.00 0.00 16.14
BANNED ITEMSAppliances 0.80 0.00 0.00 0.80Electronics 27.18 0.00 0.00 27.18Lead-acid Batteries (automobiles, trucks, motorcycles – small sealed lead-acid batteries) 53.88 53.72 0.00 107.60
Tires (automobiles, trucks, motorcycles) 470.78 0.00 0.00 470.78Used Motor Oil (automobiles, trucks, motorcycles) 20.84 –– –– 20.84
Yard Trimmings 0.00 0.00 0.00 0.00TOTAL BANNED ITEMS 573.48 53.72 0.00 627.20
MISCELLANEOUS ITEMSAntifreeze 0.44 0.00 0.00 0.44Cooking Oil/Grease 0.00 0.00 0.00 0.00Fluorescent Bulbs 0.00 0.00 0.00 0.00Food Scraps 0.00 0.00 0.00 0.00Household Hazardous Materials 0.00 0.00 0.00 0.00Inkjet/Toner Cartridges 0.00 0.00 0.00 0.00Mattresses 0.00 0.00 0.00 0.00Paint 0.00 0.00 0.00 0.00Rechargeable Batteries 0.00 0.00 0.00 0.00Textiles (recycled – not donated for reuse) 0.00 0.00 0.00 0.00Used Motor Oil Filters 0.79 0.00 0.00 0.79Wood Packaging (pallets, crates, barrels) 0.00 0.00 0.00 0.00Other Items 0.00 0.00 0.00 0.00TOTAL MISCELLANEOUS ITEMS 1.23 0.00 0.00 1.23
COMMINGLED RECYCLABLESTOTAL COMMINGLED RECYCLABLES 0.00 0.00 0.00 0.00TOTAL FOR ALL 979.42 53.72 0.00 1,033.14
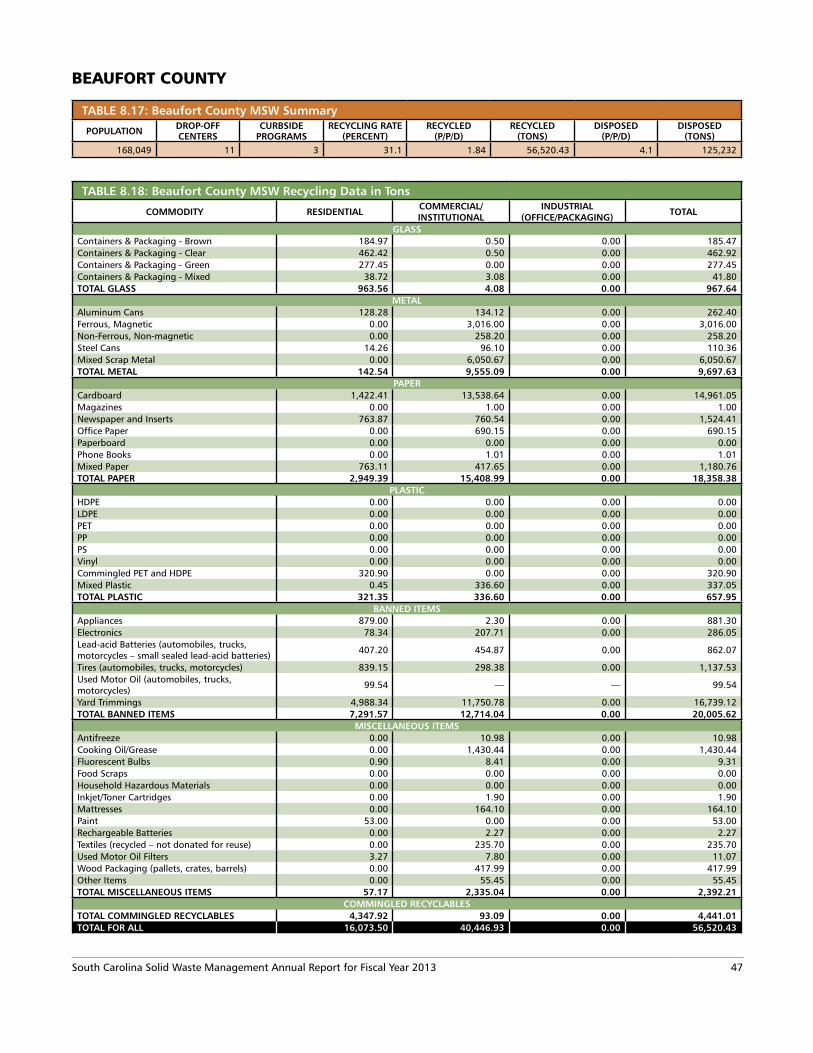
South Carolina Solid Waste Management Annual Report for Fiscal Year 2013 47
BEAUFORT COUNTY
TABLE 8.17: Beaufort County MSW Summary
POPULATION DROP-OFF CENTERS
CURBSIDE PROGRAMS
RECYCLING RATE (PERCENT)
RECYCLED (P/P/D)
RECYCLED (TONS)
DISPOSED (P/P/D)
DISPOSED (TONS)
168,049 11 3 31.1 1.84 56,520.43 4.1 125,232
TABLE 8.18: Beaufort County MSW Recycling Data in Tons
COMMODITY RESIDENTIAL COMMERCIAL/INSTITUTIONAL
INDUSTRIAL(OFFICE/PACKAGING) TOTAL
GLASSContainers & Packaging - Brown 184.97 0.50 0.00 185.47Containers & Packaging - Clear 462.42 0.50 0.00 462.92Containers & Packaging - Green 277.45 0.00 0.00 277.45Containers & Packaging - Mixed 38.72 3.08 0.00 41.80TOTAL GLASS 963.56 4.08 0.00 967.64
METALAluminum Cans 128.28 134.12 0.00 262.40Ferrous, Magnetic 0.00 3,016.00 0.00 3,016.00Non-Ferrous, Non-magnetic 0.00 258.20 0.00 258.20Steel Cans 14.26 96.10 0.00 110.36Mixed Scrap Metal 0.00 6,050.67 0.00 6,050.67TOTAL METAL 142.54 9,555.09 0.00 9,697.63
PAPERCardboard 1,422.41 13,538.64 0.00 14,961.05Magazines 0.00 1.00 0.00 1.00Newspaper and Inserts 763.87 760.54 0.00 1,524.41Office Paper 0.00 690.15 0.00 690.15Paperboard 0.00 0.00 0.00 0.00Phone Books 0.00 1.01 0.00 1.01Mixed Paper 763.11 417.65 0.00 1,180.76TOTAL PAPER 2,949.39 15,408.99 0.00 18,358.38
PLASTICHDPE 0.00 0.00 0.00 0.00LDPE 0.00 0.00 0.00 0.00PET 0.00 0.00 0.00 0.00PP 0.00 0.00 0.00 0.00PS 0.00 0.00 0.00 0.00Vinyl 0.00 0.00 0.00 0.00Commingled PET and HDPE 320.90 0.00 0.00 320.90Mixed Plastic 0.45 336.60 0.00 337.05TOTAL PLASTIC 321.35 336.60 0.00 657.95
BANNED ITEMSAppliances 879.00 2.30 0.00 881.30Electronics 78.34 207.71 0.00 286.05Lead-acid Batteries (automobiles, trucks, motorcycles – small sealed lead-acid batteries) 407.20 454.87 0.00 862.07
Tires (automobiles, trucks, motorcycles) 839.15 298.38 0.00 1,137.53Used Motor Oil (automobiles, trucks, motorcycles) 99.54 –– –– 99.54
Yard Trimmings 4,988.34 11,750.78 0.00 16,739.12TOTAL BANNED ITEMS 7,291.57 12,714.04 0.00 20,005.62
MISCELLANEOUS ITEMSAntifreeze 0.00 10.98 0.00 10.98Cooking Oil/Grease 0.00 1,430.44 0.00 1,430.44Fluorescent Bulbs 0.90 8.41 0.00 9.31Food Scraps 0.00 0.00 0.00 0.00Household Hazardous Materials 0.00 0.00 0.00 0.00Inkjet/Toner Cartridges 0.00 1.90 0.00 1.90Mattresses 0.00 164.10 0.00 164.10Paint 53.00 0.00 0.00 53.00Rechargeable Batteries 0.00 2.27 0.00 2.27Textiles (recycled – not donated for reuse) 0.00 235.70 0.00 235.70Used Motor Oil Filters 3.27 7.80 0.00 11.07Wood Packaging (pallets, crates, barrels) 0.00 417.99 0.00 417.99Other Items 0.00 55.45 0.00 55.45TOTAL MISCELLANEOUS ITEMS 57.17 2,335.04 0.00 2,392.21
COMMINGLED RECYCLABLESTOTAL COMMINGLED RECYCLABLES 4,347.92 93.09 0.00 4,441.01TOTAL FOR ALL 16,073.50 40,446.93 0.00 56,520.43

48 South Carolina Solid Waste Management Annual Report for Fiscal Year 2013
BERKELEY COUNTY
TABLE 8.19: Berkeley County MSW Summary
POPULATION DROP-OFF CENTERS
CURBSIDE PROGRAMS
RECYCLING RATE (PERCENT)
RECYCLED (P/P/D)
RECYCLED (TONS)
DISPOSED (P/P/D)
DISPOSED (TONS)
189,781 22 6 37.8 1.46 50,491.57 2.4 82,935
TABLE 8.20: Berkeley County MSW Recycling Data in Tons
COMMODITY RESIDENTIAL COMMERCIAL/INSTITUTIONAL
INDUSTRIAL(OFFICE/PACKAGING) TOTAL
GLASSContainers & Packaging - Brown 0.00 0.00 0.00 0.00Containers & Packaging - Clear 0.00 0.00 0.00 0.00Containers & Packaging - Green 0.00 0.00 0.00 0.00Containers & Packaging - Mixed 0.00 2.00 0.00 2.00TOTAL GLASS 0.00 2.00 0.00 2.00
METALAluminum Cans 0.00 230.44 40.87 271.31Ferrous, Magnetic 0.00 20,001.00 2,874.80 22,875.80Non-Ferrous, Non-magnetic 0.00 0.00 0.00 0.00Steel Cans 0.00 0.00 24.43 24.43Mixed Scrap Metal 0.00 772.55 166.44 938.99TOTAL METAL 0.00 21,003.99 3,106.54 24,110.53
PAPERCardboard 429.74 4,403.80 314.47 5,148.01Magazines 0.00 0.25 0.52 0.77Newspaper and Inserts 0.00 0.50 0.01 0.51Office Paper 0.00 8.44 16.54 24.98Paperboard 0.00 0.00 0.00 0.00Phone Books 0.00 0.20 0.01 0.21Mixed Paper 379.44 19.24 0.00 398.68TOTAL PAPER 809.18 4,432.43 331.55 5,573.16
PLASTICHDPE 0.00 2.62 11.63 14.25LDPE 0.00 6.24 20.09 26.33PET 0.00 0.60 2.03 2.63PP 0.00 0.00 0.00 0.00PS 0.00 0.00 0.00 0.00Vinyl 0.00 0.00 0.00 0.00Commingled PET and HDPE 0.00 0.00 0.00 0.00Mixed Plastic 0.00 119.69 70.00 189.69TOTAL PLASTIC 0.00 129.15 103.75 232.90
BANNED ITEMSAppliances 0.00 1,800.00 1.20 1,801.20Electronics 346.41 9.42 20.99 376.82Lead-acid Batteries (automobiles, trucks, motorcycles – small sealed lead-acid batteries) 459.74 651.93 20.68 1,132.35
Tires (automobiles, trucks, motorcycles) 730.72 183.89 3.35 917.96Used Motor Oil (automobiles, trucks, motorcycles) 122.60 –– –– 122.60
Yard Trimmings 10,403.80 3,252.00 0.00 13,655.80TOTAL BANNED ITEMS 12,063.27 5,897.24 46.21 18,006.72
MISCELLANEOUS ITEMSAntifreeze 0.00 6.26 0.55 6.81Cooking Oil/Grease 0.00 34.80 4.00 38.80Fluorescent Bulbs 0.00 2.20 5.08 7.28Food Scraps 0.00 408.76 0.00 408.76Household Hazardous Materials 0.00 0.00 0.00 0.00Inkjet/Toner Cartridges 0.00 0.10 0.70 0.80Mattresses 0.00 0.00 0.00 0.00Paint 0.00 0.00 0.30 0.30Rechargeable Batteries 0.00 0.21 2.23 2.44Textiles (recycled – not donated for reuse) 0.00 0.00 1.00 1.00Used Motor Oil Filters 0.00 53.45 3.83 57.28Wood Packaging (pallets, crates, barrels) 0.00 27.09 580.46 607.55Other Items 0.00 68.39 2.75 71.14TOTAL MISCELLANEOUS ITEMS 0.00 601.26 600.88 1,202.14
COMMINGLED RECYCLABLESTOTAL COMMINGLED RECYCLABLES 1,204.31 24.02 135.79 1,364.12TOTAL FOR ALL 14,076.76 32,090.09 4,324.72 50,491.57

South Carolina Solid Waste Management Annual Report for Fiscal Year 2013 49
CALHOUN COUNTY
TABLE 8.21: Calhoun County MSW Summary
POPULATION DROP-OFF CENTERS
CURBSIDE PROGRAMS
RECYCLING RATE (PERCENT)
RECYCLED (P/P/D)
RECYCLED (TONS)
DISPOSED (P/P/D)
DISPOSED (TONS)
14,910 10 0 12.2 0.44 1,205.12 3.2 8,656
TABLE 8.22: Calhoun County MSW Recycling Data in Tons
COMMODITY RESIDENTIAL COMMERCIAL/INSTITUTIONAL
INDUSTRIAL(OFFICE/PACKAGING) TOTAL
GLASSContainers & Packaging - Brown 0.00 0.00 0.00 0.00Containers & Packaging - Clear 0.00 0.00 0.00 0.00Containers & Packaging - Green 0.00 0.00 0.00 0.00Containers & Packaging - Mixed 0.00 0.00 0.00 0.00TOTAL GLASS 0.00 0.00 0.00 0.00
METALAluminum Cans 0.50 0.00 0.00 0.50Ferrous, Magnetic 0.00 0.00 0.00 0.00Non-Ferrous, Non-magnetic 0.00 0.00 0.00 0.00Steel Cans 0.00 0.00 0.00 0.00Mixed Scrap Metal 34.42 0.00 360.10 394.52TOTAL METAL 34.92 0.00 360.10 395.02
PAPERCardboard 81.58 79.00 134.79 295.37Magazines 0.00 0.00 0.00 0.00Newspaper and Inserts 0.00 0.00 0.00 0.00Office Paper 0.00 0.00 9.96 9.96Paperboard 0.00 0.00 0.00 0.00Phone Books 0.00 0.00 0.00 0.00Mixed Paper 0.00 0.00 0.00 0.00TOTAL PAPER 81.58 79.00 144.75 305.33
PLASTICHDPE 3.50 0.00 23.29 26.79LDPE 0.00 0.00 0.00 0.00PET 0.00 0.00 0.00 0.00PP 0.00 0.00 0.00 0.00PS 0.00 0.00 0.00 0.00Vinyl 0.00 0.00 0.00 0.00Commingled PET and HDPE 0.00 0.00 0.00 0.00Mixed Plastic 0.00 0.00 6.28 6.28TOTAL PLASTIC 3.50 0.00 29.57 33.07
BANNED ITEMSAppliances 20.00 0.00 0.00 20.00Electronics 20.40 3.37 2.28 26.05Lead-acid Batteries (automobiles, trucks, motorcycles – small sealed lead-acid batteries) 36.75 35.45 1.49 73.69
Tires (automobiles, trucks, motorcycles) 148.93 0.00 2.77 151.70Used Motor Oil (automobiles, trucks, motorcycles) 16.65 –– –– 16.65
Yard Trimmings 0.00 0.00 0.00 0.00TOTAL BANNED ITEMS 242.73 38.82 6.54 288.09
MISCELLANEOUS ITEMSAntifreeze 0.00 0.00 0.00 0.00Cooking Oil/Grease 0.00 0.00 0.00 0.00Fluorescent Bulbs 0.00 0.00 1.65 1.65Food Scraps 0.00 0.00 0.00 0.00Household Hazardous Materials 0.00 0.00 0.00 0.00Inkjet/Toner Cartridges 0.00 0.00 0.00 0.00Mattresses 0.00 0.00 0.00 0.00Paint 0.00 0.00 0.00 0.00Rechargeable Batteries 0.00 0.00 0.33 0.33Textiles (recycled – not donated for reuse) 0.00 0.00 0.00 0.00Used Motor Oil Filters 0.80 0.00 0.00 0.80Wood Packaging (pallets, crates, barrels) 0.00 0.00 23.13 23.13Other Items 0.00 0.00 15.60 15.60TOTAL MISCELLANEOUS ITEMS 0.80 0.00 40.71 41.51
COMMINGLED RECYCLABLESTOTAL COMMINGLED RECYCLABLES 0.00 0.00 142.10 142.10TOTAL FOR ALL 363.53 117.82 723.77 1,205.12

50 South Carolina Solid Waste Management Annual Report for Fiscal Year 2013
CHARLESTON COUNTY
TABLE 8.23: Charleston County MSW Summary
POPULATION DROP-OFF CENTERS
CURBSIDE PROGRAMS
RECYCLING RATE (PERCENT)
RECYCLED (P/P/D)
RECYCLED (TONS)
DISPOSED (P/P/D)
DISPOSED (TONS)
365,162 51 2 34.6 2.35 156,910.72 4.5 297,121
TABLE 8.24: Charleston County MSW Recycling Data in Tons
COMMODITY RESIDENTIAL COMMERCIAL/INSTITUTIONAL
INDUSTRIAL(OFFICE/PACKAGING) TOTAL
GLASSContainers & Packaging - Brown 0.00 0.00 0.00 0.00Containers & Packaging - Clear 0.00 0.00 0.00 0.00Containers & Packaging - Green 0.00 0.00 0.00 0.00Containers & Packaging - Mixed 10.73 0.95 13.25 24.93TOTAL GLASS 10.73 0.95 13.25 24.93
METALAluminum Cans 0.00 704.53 39.75 744.29Ferrous, Magnetic 0.00 48,909.00 1,533.71 50,442.71Non-Ferrous, Non-magnetic 0.00 55.00 4.00 59.00Steel Cans 0.00 0.00 43.89 43.89Mixed Scrap Metal 0.00 1,119.76 907.10 2,026.86TOTAL METAL 0.00 50,788.29 2,528.45 53,316.75
PAPERCardboard 7,124.56 2,568.47 292.64 9,985.67Magazines 0.00 3.89 0.00 3.89Newspaper and Inserts 0.00 0.00 0.00 0.00Office Paper 0.00 745.96 362.97 1,108.93Paperboard 0.00 0.95 13.25 14.20Phone Books 0.00 1.30 0.00 1.30Mixed Paper 5,756.43 437.63 5.28 6,199.33TOTAL PAPER 12,880.99 3,758.19 674.13 17,313.32
PLASTICHDPE 0.00 0.00 9.38 9.38LDPE 0.00 0.00 0.00 0.00PET 0.00 0.00 0.00 0.00PP 0.00 0.00 0.00 0.00PS 0.00 0.00 0.00 0.00Vinyl 0.00 0.00 0.00 0.00Commingled PET and HDPE 0.00 5.00 0.00 5.00Mixed Plastic 0.00 74.95 188.05 263.00TOTAL PLASTIC 0.00 79.95 197.43 277.38
BANNED ITEMSAppliances 508.19 1,677.00 0.00 2,185.19Electronics 372.20 98.59 1.48 472.27Lead-acid Batteries (automobiles, trucks, motorcycles – small sealed lead-acid batteries) 894.50 1,183.02 7.26 2,084.78
Tires (automobiles, trucks, motorcycles) 3,137.02 256.52 0.10 3,393.64Used Motor Oil (automobiles, trucks, motorcycles) 176.80 –– –– 176.80
Yard Trimmings 52,807.19 919.92 0.00 53,727.11TOTAL BANNED ITEMS 57,895.90 4,135.04 8.84 62,039.78
MISCELLANEOUS ITEMSAntifreeze 2.40 47.04 0.82 50.26Cooking Oil/Grease 0.00 70.74 0.00 70.74Fluorescent Bulbs 5.90 17.36 1.28 24.54Food Scraps 1,544.07 199.38 97.96 1,841.41Household Hazardous Materials 53.90 0.00 0.00 53.90Inkjet/Toner Cartridges 0.00 14.69 2.03 16.72Mattresses 0.00 0.00 0.00 0.00Paint 120.90 2.58 26.71 150.19Rechargeable Batteries 1.50 5.57 0.22 7.29Textiles (recycled – not donated for reuse) 0.00 0.25 0.00 0.25Used Motor Oil Filters 6.60 105.98 0.00 112.58Wood Packaging (pallets, crates, barrels) 0.00 159.91 994.25 1,154.16Other Items 0.00 11.61 60.00 71.61TOTAL MISCELLANEOUS ITEMS 1,735.27 635.11 1,183.27 3,553.65
COMMINGLED RECYCLABLESTOTAL COMMINGLED RECYCLABLES 20,143.62 241.31 0.00 20,384.93TOTAL FOR ALL 92,666.51 59,638.84 4,605.37 156,910.72

South Carolina Solid Waste Management Annual Report for Fiscal Year 2013 51
CHEROKEE COUNTY
TABLE 8.25: Cherokee County MSW Summary
POPULATION DROP-OFF CENTERS
CURBSIDE PROGRAMS
RECYCLING RATE (PERCENT)
RECYCLED (P/P/D)
RECYCLED (TONS)
DISPOSED (P/P/D)
DISPOSED (TONS)
55,662 9 7 11.3 0.64 6,502.90 5.0 50,975
TABLE 8.26: Cherokee County MSW Recycling Data in Tons
COMMODITY RESIDENTIAL COMMERCIAL/INSTITUTIONAL
INDUSTRIAL(OFFICE/PACKAGING) TOTAL
GLASSContainers & Packaging - Brown 6.20 0.00 0.15 6.35Containers & Packaging - Clear 9.20 0.00 0.15 9.35Containers & Packaging - Green 4.60 0.00 0.00 4.60Containers & Packaging - Mixed 0.00 0.00 0.00 0.00TOTAL GLASS 20.00 0.00 0.30 20.30
METALAluminum Cans 1.60 0.07 3.00 4.67Ferrous, Magnetic 0.00 0.00 1.64 1.64Non-Ferrous, Non-magnetic 0.00 0.00 0.00 0.00Steel Cans 6.40 0.00 0.51 6.91Mixed Scrap Metal 48.00 0.00 228.51 276.51TOTAL METAL 56.00 0.07 233.65 289.73
PAPERCardboard 86.20 2,433.76 506.44 3,026.40Magazines 0.00 0.00 0.00 0.00Newspaper and Inserts 0.00 0.00 0.00 0.00Office Paper 0.00 0.07 13.56 13.63Paperboard 0.00 0.00 0.00 0.00Phone Books 0.00 0.00 0.00 0.00Mixed Paper 169.00 11.22 28.49 208.71TOTAL PAPER 255.20 2,445.05 548.48 3,248.73
PLASTICHDPE 0.00 0.21 0.00 0.21LDPE 0.00 0.00 0.00 0.00PET 0.00 0.06 0.00 0.06PP 0.00 0.00 0.00 0.00PS 0.00 0.00 0.00 0.00Vinyl 0.00 0.00 0.00 0.00Commingled PET and HDPE 22.80 0.00 0.00 22.80Mixed Plastic 0.00 13.62 186.90 200.52TOTAL PLASTIC 22.80 13.90 186.90 223.59
BANNED ITEMSAppliances 48.00 0.00 0.00 48.00Electronics 29.20 0.00 0.26 29.46Lead-acid Batteries (automobiles, trucks, motorcycles – small sealed lead-acid batteries) 135.74 133.94 12.91 282.59
Tires (automobiles, trucks, motorcycles) 785.10 0.00 0.00 785.10Used Motor Oil (automobiles, trucks, motorcycles) 23.76 –– –– 23.76
Yard Trimmings 795.84 0.00 0.00 795.84TOTAL BANNED ITEMS 1,817.64 133.94 13.17 1,964.75
MISCELLANEOUS ITEMSAntifreeze 0.00 0.00 0.85 0.85Cooking Oil/Grease 0.00 0.00 0.00 0.00Fluorescent Bulbs 0.00 0.00 4.61 4.61Food Scraps 0.00 0.00 0.00 0.00Household Hazardous Materials 0.00 0.00 0.00 0.00Inkjet/Toner Cartridges 0.00 0.00 0.09 0.09Mattresses 0.00 0.00 0.00 0.00Paint 0.00 0.00 0.00 0.00Rechargeable Batteries 0.00 0.00 0.47 0.47Textiles (recycled – not donated for reuse) 0.00 0.00 0.00 0.00Used Motor Oil Filters 1.50 0.00 0.14 1.64Wood Packaging (pallets, crates, barrels) 1.60 32.30 706.60 740.50Other Items 0.00 0.00 0.00 0.00TOTAL MISCELLANEOUS ITEMS 3.10 32.30 712.75 748.15
COMMINGLED RECYCLABLESTOTAL COMMINGLED RECYCLABLES 0.00 0.00 7.65 7.65TOTAL FOR ALL 2,174.74 2,625.26 1,702.90 6,502.90

52 South Carolina Solid Waste Management Annual Report for Fiscal Year 2013
CHESTER COUNTY
TABLE 8.27: Chester County MSW Summary
POPULATION DROP-OFF CENTERS
CURBSIDE PROGRAMS
RECYCLING RATE (PERCENT)
RECYCLED (P/P/D)
RECYCLED (TONS)
DISPOSED (P/P/D)
DISPOSED (TONS)
32,546 12 1 7.3 0.21 1,258.58 2.7 15,871
TABLE 8.28: Chester County MSW Recycling Data in Tons
COMMODITY RESIDENTIAL COMMERCIAL/INSTITUTIONAL
INDUSTRIAL(OFFICE/PACKAGING) TOTAL
GLASSContainers & Packaging - Brown 0.00 0.00 0.00 0.00Containers & Packaging - Clear 0.00 0.00 0.00 0.00Containers & Packaging - Green 0.00 0.00 0.00 0.00Containers & Packaging - Mixed 61.71 0.00 0.00 61.71TOTAL GLASS 61.71 0.00 0.00 61.71
METALAluminum Cans 4.81 0.00 0.07 4.88Ferrous, Magnetic 0.00 0.00 50.09 50.09Non-Ferrous, Non-magnetic 0.00 0.00 0.00 0.00Steel Cans 2.66 0.00 18.69 21.35Mixed Scrap Metal 84.80 0.00 0.04 84.84TOTAL METAL 92.27 0.00 68.89 161.16
PAPERCardboard 254.09 0.00 0.75 254.84Magazines 0.00 0.00 0.08 0.08Newspaper and Inserts 176.07 0.00 0.20 176.27Office Paper 2.50 0.00 0.63 3.13Paperboard 0.00 0.00 0.00 0.00Phone Books 0.00 0.00 0.08 0.08Mixed Paper 0.00 0.00 0.10 0.10TOTAL PAPER 432.66 0.00 1.84 434.50
PLASTICHDPE 0.00 0.00 0.00 0.00LDPE 0.00 0.00 0.00 0.00PET 0.00 0.00 0.00 0.00PP 0.00 0.00 0.00 0.00PS 0.00 0.00 0.00 0.00Vinyl 0.00 0.00 0.00 0.00Commingled PET and HDPE 0.00 0.00 0.00 0.00Mixed Plastic 64.11 0.00 29.04 93.15TOTAL PLASTIC 64.11 0.00 29.04 93.15
BANNED ITEMSAppliances 0.00 0.00 0.05 0.05Electronics 21.60 23.65 0.13 45.38Lead-acid Batteries (automobiles, trucks, motorcycles – small sealed lead-acid batteries) 79.16 78.52 0.16 157.84
Tires (automobiles, trucks, motorcycles) 227.64 0.00 0.23 227.87Used Motor Oil (automobiles, trucks, motorcycles) 23.18 –– –– 23.18
Yard Trimmings 0.00 0.00 0.00 0.00TOTAL BANNED ITEMS 351.58 102.17 0.57 454.31
MISCELLANEOUS ITEMSAntifreeze 0.00 0.00 0.25 0.25Cooking Oil/Grease 1.27 0.00 0.00 1.27Fluorescent Bulbs 0.00 0.00 0.09 0.09Food Scraps 0.00 0.00 0.00 0.00Household Hazardous Materials 0.00 0.00 0.00 0.00Inkjet/Toner Cartridges 0.00 0.00 0.05 0.05Mattresses 0.00 0.00 0.00 0.00Paint 0.00 0.00 0.02 0.02Rechargeable Batteries 0.03 0.00 0.02 0.04Textiles (recycled – not donated for reuse) 25.20 0.00 0.00 25.20Used Motor Oil Filters 0.49 0.00 0.07 0.56Wood Packaging (pallets, crates, barrels) 0.00 0.00 26.18 26.18Other Items 0.00 0.00 0.09 0.09TOTAL MISCELLANEOUS ITEMS 26.98 0.00 26.77 53.75
COMMINGLED RECYCLABLESTOTAL COMMINGLED RECYCLABLES 0.00 0.00 0.00 0.00TOTAL FOR ALL 1,029.31 102.17 127.10 1,258.58

South Carolina Solid Waste Management Annual Report for Fiscal Year 2013 53
CHESTERFIELD COUNTY
TABLE 8.29: Chesterfield County MSW Summary
POPULATION DROP-OFF CENTERS
CURBSIDE PROGRAMS
RECYCLING RATE (PERCENT)
RECYCLED (P/P/D)
RECYCLED (TONS)
DISPOSED (P/P/D)
DISPOSED (TONS)
46,103 7 1 26.8 0.56 4,672.63 1.5 12,783
TABLE 8.30: Chesterfield County MSW Recycling Data in Tons
COMMODITY RESIDENTIAL COMMERCIAL/INSTITUTIONAL
INDUSTRIAL(OFFICE/PACKAGING) TOTAL
GLASSContainers & Packaging - Brown 0.00 0.00 0.00 0.00Containers & Packaging - Clear 0.00 0.00 0.00 0.00Containers & Packaging - Green 0.00 0.00 0.00 0.00Containers & Packaging - Mixed 0.00 0.00 0.00 0.00TOTAL GLASS 0.00 0.00 0.00 0.00
METALAluminum Cans 0.00 0.01 1.50 1.51Ferrous, Magnetic 0.00 0.00 62.88 62.88Non-Ferrous, Non-magnetic 0.00 0.00 0.00 0.00Steel Cans 0.00 0.00 0.00 0.00Mixed Scrap Metal 86.94 0.00 0.00 86.94TOTAL METAL 86.94 0.01 64.38 151.33
PAPERCardboard 0.00 1.03 544.62 545.65Magazines 0.00 0.92 0.00 0.92Newspaper and Inserts 0.00 1.30 0.00 1.30Office Paper 0.00 4.08 0.00 4.08Paperboard 0.00 0.00 0.00 0.00Phone Books 0.00 0.00 0.00 0.00Mixed Paper 0.00 0.00 0.00 0.00TOTAL PAPER 0.00 7.33 544.62 551.95
PLASTICHDPE 0.00 0.00 3.10 3.10LDPE 0.00 0.00 58.80 58.80PET 0.00 0.00 0.69 0.69PP 0.00 0.00 0.00 0.00PS 0.00 0.00 0.00 0.00Vinyl 0.00 0.00 0.00 0.00Commingled PET and HDPE 0.00 0.00 0.00 0.00Mixed Plastic 0.00 0.10 1.77 1.87TOTAL PLASTIC 0.00 0.10 64.36 64.46
BANNED ITEMSAppliances 0.00 0.00 0.00 0.00Electronics 69.08 41.44 0.00 110.51Lead-acid Batteries (automobiles, trucks, motorcycles – small sealed lead-acid batteries) 112.43 110.93 0.15 223.51
Tires (automobiles, trucks, motorcycles) 436.54 0.00 0.00 436.54Used Motor Oil (automobiles, trucks, motorcycles) 27.79 –– –– 27.79
Yard Trimmings 0.00 0.00 0.00 0.00TOTAL BANNED ITEMS 645.83 152.37 0.15 798.35
MISCELLANEOUS ITEMSAntifreeze 0.00 0.00 0.00 0.00Cooking Oil/Grease 0.00 0.00 0.00 0.00Fluorescent Bulbs 0.00 0.45 0.34 0.79Food Scraps 0.00 0.00 0.00 0.00Household Hazardous Materials 0.00 0.00 0.00 0.00Inkjet/Toner Cartridges 0.00 0.00 0.00 0.00Mattresses 0.00 0.00 0.00 0.00Paint 0.00 0.00 0.00 0.00Rechargeable Batteries 0.00 0.00 0.00 0.00Textiles (recycled – not donated for reuse) 0.00 0.00 2,824.75 2,824.75Used Motor Oil Filters 0.75 0.00 0.00 0.75Wood Packaging (pallets, crates, barrels) 0.00 0.00 0.00 0.00Other Items 0.00 0.00 0.00 0.00TOTAL MISCELLANEOUS ITEMS 0.75 0.45 2,825.09 2,826.29
COMMINGLED RECYCLABLESTOTAL COMMINGLED RECYCLABLES 280.26 0.00 0.00 280.26TOTAL FOR ALL 1,013.78 160.25 3,498.60 4,672.63

54 South Carolina Solid Waste Management Annual Report for Fiscal Year 2013
CLARENDON COUNTY
TABLE 8.31: Clarendon County MSW Summary
POPULATION DROP-OFF CENTERS
CURBSIDE PROGRAMS
RECYCLING RATE (PERCENT)
RECYCLED (P/P/D)
RECYCLED (TONS)
DISPOSED (P/P/D)
DISPOSED (TONS)
34,357 12 0 6 0.14 859.27 2.1 13,402
TABLE 8.32: Clarendon County MSW Recycling Data in Tons
COMMODITY RESIDENTIAL COMMERCIAL/INSTITUTIONAL
INDUSTRIAL(OFFICE/PACKAGING) TOTAL
GLASSContainers & Packaging - Brown 0.00 0.00 0.00 0.00Containers & Packaging - Clear 0.00 0.00 0.00 0.00Containers & Packaging - Green 64.41 0.00 0.00 64.41Containers & Packaging - Mixed 0.00 0.00 0.00 0.00TOTAL GLASS 64.41 0.00 0.00 64.41
METALAluminum Cans 3.33 0.00 0.00 3.33Ferrous, Magnetic 0.00 0.00 0.00 0.00Non-Ferrous, Non-magnetic 0.00 0.00 0.00 0.00Steel Cans 5.35 0.00 0.00 5.35Mixed Scrap Metal 142.30 0.00 0.00 142.30TOTAL METAL 150.98 0.00 0.00 150.98
PAPERCardboard 109.66 0.00 0.00 109.66Magazines 0.00 0.00 0.00 0.00Newspaper and Inserts 0.00 0.00 0.00 0.00Office Paper 0.00 0.00 0.00 0.00Paperboard 0.00 0.00 0.00 0.00Phone Books 0.00 0.00 0.00 0.00Mixed Paper 91.73 0.00 0.00 91.73TOTAL PAPER 201.39 0.00 0.00 201.39
PLASTICHDPE 0.00 0.00 0.00 0.00LDPE 0.00 0.00 0.00 0.00PET 0.00 0.00 0.00 0.00PP 0.00 0.00 0.00 0.00PS 0.00 0.00 0.00 0.00Vinyl 0.00 0.00 0.00 0.00Commingled PET and HDPE 0.00 0.00 0.00 0.00Mixed Plastic 42.79 0.00 0.00 42.79TOTAL PLASTIC 42.79 0.00 0.00 42.79
BANNED ITEMSAppliances 0.00 0.00 0.00 0.00Electronics 62.64 6.10 0.00 68.73Lead-acid Batteries (automobiles, trucks, motorcycles – small sealed lead-acid batteries) 84.01 82.44 0.00 166.45
Tires (automobiles, trucks, motorcycles) 132.28 0.00 0.00 132.28Used Motor Oil (automobiles, trucks, motorcycles) 27.70 –– –– 27.70
Yard Trimmings 0.00 0.00 0.00 0.00TOTAL BANNED ITEMS 306.63 88.54 0.00 395.17
MISCELLANEOUS ITEMSAntifreeze 0.00 0.00 0.00 0.00Cooking Oil/Grease 0.00 0.00 0.00 0.00Fluorescent Bulbs 0.00 0.00 0.00 0.00Food Scraps 0.00 0.00 0.00 0.00Household Hazardous Materials 0.00 0.00 0.00 0.00Inkjet/Toner Cartridges 0.00 0.00 0.00 0.00Mattresses 0.00 0.00 0.00 0.00Paint 0.00 0.00 0.00 0.00Rechargeable Batteries 0.00 0.00 0.00 0.00Textiles (recycled – not donated for reuse) 0.00 0.00 0.00 0.00Used Motor Oil Filters 4.53 0.00 0.00 4.53Wood Packaging (pallets, crates, barrels) 0.00 0.00 0.00 0.00Other Items 0.00 0.00 0.00 0.00TOTAL MISCELLANEOUS ITEMS 4.53 0.00 0.00 4.53
COMMINGLED RECYCLABLESTOTAL COMMINGLED RECYCLABLES 0.00 0.00 0.00 0.00TOTAL FOR ALL 770.73 88.54 0.00 859.27

South Carolina Solid Waste Management Annual Report for Fiscal Year 2013 55
COLLETON COUNTY
TABLE 8.33: Colleton County MSW Summary
POPULATION DROP-OFF CENTERS
CURBSIDE PROGRAMS
RECYCLING RATE (PERCENT)
RECYCLED (P/P/D)
RECYCLED (TONS)
DISPOSED (P/P/D)
DISPOSED (TONS)
38,153 15 1 15.6 0.46 3,176.87 2.5 17,209
TABLE 8.34: Colleton County MSW Recycling Data in Tons
COMMODITY RESIDENTIAL COMMERCIAL/INSTITUTIONAL
INDUSTRIAL(OFFICE/PACKAGING) TOTAL
GLASSContainers & Packaging - Brown 0.00 0.00 0.00 0.00Containers & Packaging - Clear 0.00 0.00 0.00 0.00Containers & Packaging - Green 0.00 0.00 0.00 0.00Containers & Packaging - Mixed 0.00 0.00 0.00 0.00TOTAL GLASS 0.00 0.00 0.00 0.00
METALAluminum Cans 18.64 330.30 0.00 348.94Ferrous, Magnetic 0.00 0.00 0.00 0.00Non-Ferrous, Non-magnetic 0.00 0.00 0.00 0.00Steel Cans 0.00 408.00 0.00 408.00Mixed Scrap Metal 466.06 690.30 0.00 1,156.36TOTAL METAL 484.70 1,428.60 0.00 1,913.30
PAPERCardboard 0.00 285.40 0.00 285.40Magazines 0.00 0.00 0.00 0.00Newspaper and Inserts 0.00 0.00 0.00 0.00Office Paper 0.00 0.00 0.00 0.00Paperboard 0.00 0.00 0.00 0.00Phone Books 0.00 0.00 0.00 0.00Mixed Paper 0.00 0.00 0.00 0.00TOTAL PAPER 0.00 285.40 0.00 285.40
PLASTICHDPE 0.00 0.00 0.00 0.00LDPE 0.00 0.00 0.00 0.00PET 0.00 0.00 0.00 0.00PP 0.00 0.00 0.00 0.00PS 0.00 0.00 0.00 0.00Vinyl 0.00 0.00 0.00 0.00Commingled PET and HDPE 0.00 0.00 0.00 0.00Mixed Plastic 39.33 40.68 0.00 80.01TOTAL PLASTIC 39.33 40.68 0.00 80.01
BANNED ITEMSAppliances 7.30 0.00 0.00 7.30Electronics 103.18 0.00 0.00 103.18Lead-acid Batteries (automobiles, trucks, motorcycles – small sealed lead-acid batteries) 98.28 108.16 0.00 206.44
Tires (automobiles, trucks, motorcycles) 486.19 19.30 0.00 505.49Used Motor Oil (automobiles, trucks, motorcycles) 32.05 –– –– 32.05
Yard Trimmings 0.00 0.00 0.00 0.00TOTAL BANNED ITEMS 727.00 127.46 0.00 854.46
MISCELLANEOUS ITEMSAntifreeze 0.00 0.00 0.00 0.00Cooking Oil/Grease 0.00 23.11 0.00 23.11Fluorescent Bulbs 0.00 0.00 0.00 0.00Food Scraps 0.00 0.00 0.00 0.00Household Hazardous Materials 0.00 0.00 0.00 0.00Inkjet/Toner Cartridges 14.36 0.00 0.00 14.36Mattresses 0.00 0.00 0.00 0.00Paint 0.00 0.00 0.00 0.00Rechargeable Batteries 0.00 0.00 0.00 0.00Textiles (recycled – not donated for reuse) 0.00 0.00 0.00 0.00Used Motor Oil Filters 4.28 1.95 0.00 6.23Wood Packaging (pallets, crates, barrels) 0.00 0.00 0.00 0.00Other Items 0.00 0.00 0.00 0.00TOTAL MISCELLANEOUS ITEMS 18.64 25.06 0.00 43.70
COMMINGLED RECYCLABLESTOTAL COMMINGLED RECYCLABLES 0.00 0.00 0.00 0.00TOTAL FOR ALL 1,269.67 1,907.20 0.00 3,176.87
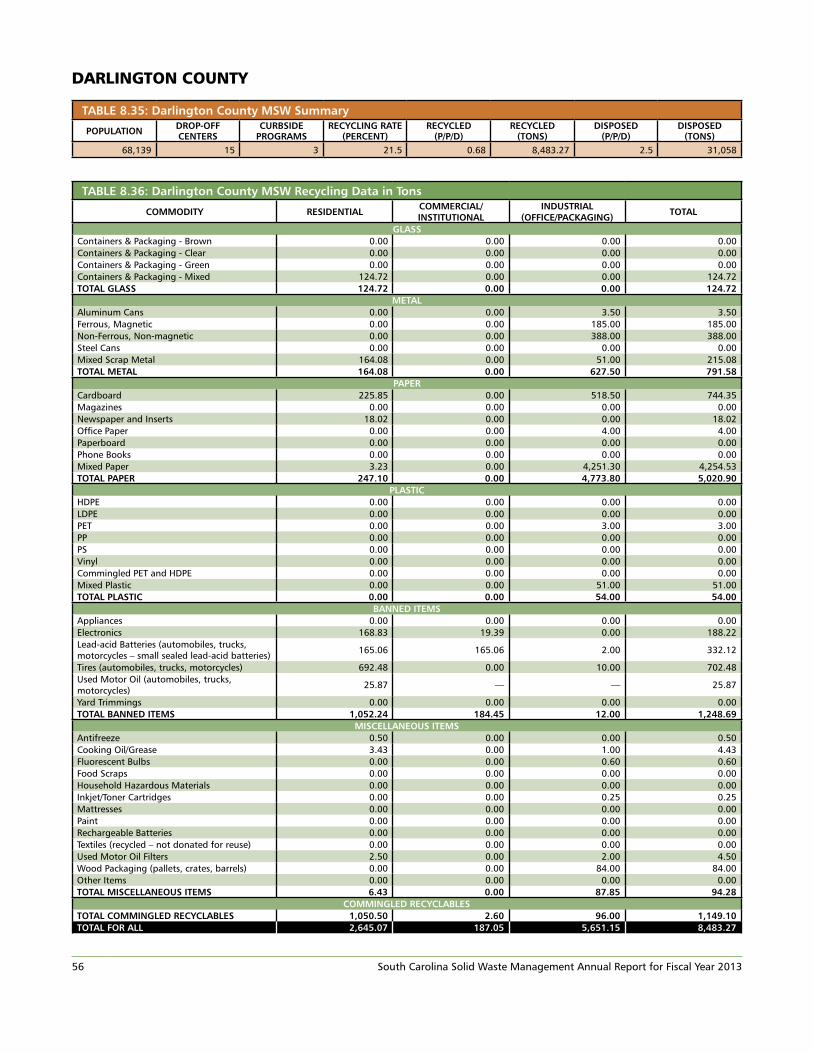
56 South Carolina Solid Waste Management Annual Report for Fiscal Year 2013
DARLINGTON COUNTY
TABLE 8.35: Darlington County MSW Summary
POPULATION DROP-OFF CENTERS
CURBSIDE PROGRAMS
RECYCLING RATE (PERCENT)
RECYCLED (P/P/D)
RECYCLED (TONS)
DISPOSED (P/P/D)
DISPOSED (TONS)
68,139 15 3 21.5 0.68 8,483.27 2.5 31,058
TABLE 8.36: Darlington County MSW Recycling Data in Tons
COMMODITY RESIDENTIAL COMMERCIAL/INSTITUTIONAL
INDUSTRIAL(OFFICE/PACKAGING) TOTAL
GLASSContainers & Packaging - Brown 0.00 0.00 0.00 0.00Containers & Packaging - Clear 0.00 0.00 0.00 0.00Containers & Packaging - Green 0.00 0.00 0.00 0.00Containers & Packaging - Mixed 124.72 0.00 0.00 124.72TOTAL GLASS 124.72 0.00 0.00 124.72
METALAluminum Cans 0.00 0.00 3.50 3.50Ferrous, Magnetic 0.00 0.00 185.00 185.00Non-Ferrous, Non-magnetic 0.00 0.00 388.00 388.00Steel Cans 0.00 0.00 0.00 0.00Mixed Scrap Metal 164.08 0.00 51.00 215.08TOTAL METAL 164.08 0.00 627.50 791.58
PAPERCardboard 225.85 0.00 518.50 744.35Magazines 0.00 0.00 0.00 0.00Newspaper and Inserts 18.02 0.00 0.00 18.02Office Paper 0.00 0.00 4.00 4.00Paperboard 0.00 0.00 0.00 0.00Phone Books 0.00 0.00 0.00 0.00Mixed Paper 3.23 0.00 4,251.30 4,254.53TOTAL PAPER 247.10 0.00 4,773.80 5,020.90
PLASTICHDPE 0.00 0.00 0.00 0.00LDPE 0.00 0.00 0.00 0.00PET 0.00 0.00 3.00 3.00PP 0.00 0.00 0.00 0.00PS 0.00 0.00 0.00 0.00Vinyl 0.00 0.00 0.00 0.00Commingled PET and HDPE 0.00 0.00 0.00 0.00Mixed Plastic 0.00 0.00 51.00 51.00TOTAL PLASTIC 0.00 0.00 54.00 54.00
BANNED ITEMSAppliances 0.00 0.00 0.00 0.00Electronics 168.83 19.39 0.00 188.22Lead-acid Batteries (automobiles, trucks, motorcycles – small sealed lead-acid batteries) 165.06 165.06 2.00 332.12
Tires (automobiles, trucks, motorcycles) 692.48 0.00 10.00 702.48Used Motor Oil (automobiles, trucks, motorcycles) 25.87 –– –– 25.87
Yard Trimmings 0.00 0.00 0.00 0.00TOTAL BANNED ITEMS 1,052.24 184.45 12.00 1,248.69
MISCELLANEOUS ITEMSAntifreeze 0.50 0.00 0.00 0.50Cooking Oil/Grease 3.43 0.00 1.00 4.43Fluorescent Bulbs 0.00 0.00 0.60 0.60Food Scraps 0.00 0.00 0.00 0.00Household Hazardous Materials 0.00 0.00 0.00 0.00Inkjet/Toner Cartridges 0.00 0.00 0.25 0.25Mattresses 0.00 0.00 0.00 0.00Paint 0.00 0.00 0.00 0.00Rechargeable Batteries 0.00 0.00 0.00 0.00Textiles (recycled – not donated for reuse) 0.00 0.00 0.00 0.00Used Motor Oil Filters 2.50 0.00 2.00 4.50Wood Packaging (pallets, crates, barrels) 0.00 0.00 84.00 84.00Other Items 0.00 0.00 0.00 0.00TOTAL MISCELLANEOUS ITEMS 6.43 0.00 87.85 94.28
COMMINGLED RECYCLABLESTOTAL COMMINGLED RECYCLABLES 1,050.50 2.60 96.00 1,149.10TOTAL FOR ALL 2,645.07 187.05 5,651.15 8,483.27

South Carolina Solid Waste Management Annual Report for Fiscal Year 2013 57
DILLON COUNTY
TABLE 8.37: Dillon County MSW Summary
POPULATION DROP-OFF CENTERS
CURBSIDE PROGRAMS
RECYCLING RATE (PERCENT)
RECYCLED (P/P/D)
RECYCLED (TONS)
DISPOSED (P/P/D)
DISPOSED (TONS)
31,446 15 1 8.9 0.32 1,810.03 3.2 18,490
TABLE 8.38: Dillon County MSW Recycling Data in Tons
COMMODITY RESIDENTIAL COMMERCIAL/INSTITUTIONAL
INDUSTRIAL(OFFICE/PACKAGING) TOTAL
GLASSContainers & Packaging - Brown 0.00 0.00 0.00 0.00Containers & Packaging - Clear 0.00 0.00 0.00 0.00Containers & Packaging - Green 0.00 0.00 0.00 0.00Containers & Packaging - Mixed 4.67 0.00 0.00 4.67TOTAL GLASS 4.67 0.00 0.00 4.67
METALAluminum Cans 0.00 0.00 0.00 0.00Ferrous, Magnetic 0.00 0.00 0.00 0.00Non-Ferrous, Non-magnetic 0.00 0.00 0.00 0.00Steel Cans 0.00 0.00 0.00 0.00Mixed Scrap Metal 78.14 0.00 0.40 78.54TOTAL METAL 78.14 0.00 0.40 78.54
PAPERCardboard 19.47 0.00 279.47 298.94Magazines 0.00 0.00 0.00 0.00Newspaper and Inserts 31.32 0.00 0.00 31.32Office Paper 0.00 0.00 0.00 0.00Paperboard 0.00 0.00 0.00 0.00Phone Books 0.00 0.00 0.00 0.00Mixed Paper 0.00 0.00 0.50 0.50TOTAL PAPER 50.79 0.00 279.97 330.76
PLASTICHDPE 0.00 0.00 0.00 0.00LDPE 0.00 0.00 0.00 0.00PET 0.00 0.00 0.00 0.00PP 0.00 0.00 0.00 0.00PS 0.00 0.00 0.00 0.00Vinyl 0.00 0.00 0.00 0.00Commingled PET and HDPE 0.00 0.00 0.00 0.00Mixed Plastic 0.00 0.00 0.00 0.00TOTAL PLASTIC 0.00 0.00 0.00 0.00
BANNED ITEMSAppliances 0.00 0.00 0.00 0.00Electronics 86.91 0.56 0.00 87.47Lead-acid Batteries (automobiles, trucks, motorcycles – small sealed lead-acid batteries) 76.17 76.17 0.00 152.34
Tires (automobiles, trucks, motorcycles) 149.23 208.16 0.00 357.39Used Motor Oil (automobiles, trucks, motorcycles) 16.40 –– –– 16.40
Yard Trimmings 0.00 0.00 0.00 0.00TOTAL BANNED ITEMS 328.71 284.89 0.00 613.60
MISCELLANEOUS ITEMSAntifreeze 0.00 0.00 0.00 0.00Cooking Oil/Grease 0.00 0.00 0.00 0.00Fluorescent Bulbs 0.00 0.00 0.25 0.25Food Scraps 0.00 0.00 0.00 0.00Household Hazardous Materials 0.00 0.00 0.00 0.00Inkjet/Toner Cartridges 0.00 0.00 0.00 0.00Mattresses 0.00 0.00 0.00 0.00Paint 0.00 0.00 0.00 0.00Rechargeable Batteries 0.00 0.00 0.00 0.00Textiles (recycled – not donated for reuse) 0.00 0.00 0.00 0.00Used Motor Oil Filters 0.00 0.00 0.00 0.00Wood Packaging (pallets, crates, barrels) 0.00 0.00 702.00 702.00Other Items 0.00 0.00 0.00 0.00TOTAL MISCELLANEOUS ITEMS 0.00 0.00 702.25 702.25
COMMINGLED RECYCLABLESTOTAL COMMINGLED RECYCLABLES 80.21 0.00 0.00 80.21TOTAL FOR ALL 542.52 284.89 982.62 1,810.03

58 South Carolina Solid Waste Management Annual Report for Fiscal Year 2013
DORCHESTER COUNTY
TABLE 8.39: Dorchester County MSW Summary
POPULATION DROP-OFF CENTERS
CURBSIDE PROGRAMS
RECYCLING RATE (PERCENT)
RECYCLED (P/P/D)
RECYCLED (TONS)
DISPOSED (P/P/D)
DISPOSED (TONS)
142,496 12 2 37.1 1.15 29,896.20 2.0 50,751
TABLE 8.40: Dorchester County MSW Recycling Data in Tons
COMMODITY RESIDENTIAL COMMERCIAL/INSTITUTIONAL
INDUSTRIAL(OFFICE/PACKAGING) TOTAL
GLASSContainers & Packaging - Brown 0.00 0.00 0.00 0.00Containers & Packaging - Clear 0.00 0.00 0.00 0.00Containers & Packaging - Green 0.00 0.00 0.00 0.00Containers & Packaging - Mixed 0.00 0.00 0.00 0.00TOTAL GLASS 0.00 0.00 0.00 0.00
METALAluminum Cans 0.00 5.61 2.01 7.61Ferrous, Magnetic 0.00 7,354.00 553.00 7,907.00Non-Ferrous, Non-magnetic 0.00 21.00 2.00 23.00Steel Cans 0.00 0.00 15.50 15.50Mixed Scrap Metal 5.00 0.00 2.00 7.00TOTAL METAL 5.00 7,380.61 574.51 7,960.11
PAPERCardboard 387.50 39.24 107.60 534.34Magazines 0.00 0.00 0.50 0.50Newspaper and Inserts 0.00 0.00 0.00 0.00Office Paper 2.60 62.40 37.00 102.00Paperboard 0.00 0.00 0.00 0.00Phone Books 0.00 0.00 0.00 0.00Mixed Paper 822.97 0.00 0.00 822.97TOTAL PAPER 1,213.07 101.64 145.10 1,459.81
PLASTICHDPE 0.00 0.00 0.00 0.00LDPE 0.00 0.00 0.00 0.00PET 0.00 0.00 0.00 0.00PP 0.00 0.00 0.00 0.00PS 0.00 0.00 0.00 0.00Vinyl 0.00 0.00 0.00 0.00Commingled PET and HDPE 0.00 0.00 0.00 0.00Mixed Plastic 1.24 11.21 129.70 142.15TOTAL PLASTIC 1.24 11.21 129.70 142.15
BANNED ITEMSAppliances 435.55 0.00 0.00 435.55Electronics 122.42 122.42 52.00 296.84Lead-acid Batteries (automobiles, trucks, motorcycles – small sealed lead-acid batteries) 345.20 345.19 0.00 690.39
Tires (automobiles, trucks, motorcycles) 729.27 0.00 0.00 729.27Used Motor Oil (automobiles, trucks, motorcycles) 102.56 –– –– 102.56
Yard Trimmings 16,381.18 0.00 0.00 16,381.18TOTAL BANNED ITEMS 18,116.19 467.61 52.00 18,635.80
MISCELLANEOUS ITEMSAntifreeze 9.00 0.00 0.00 9.00Cooking Oil/Grease 0.97 0.00 0.00 0.97Fluorescent Bulbs 0.01 0.00 0.62 0.63Food Scraps 0.00 0.00 0.00 0.00Household Hazardous Materials 0.00 0.00 0.00 0.00Inkjet/Toner Cartridges 0.02 0.00 0.30 0.32Mattresses 0.00 0.00 0.00 0.00Paint 0.00 0.00 0.00 0.00Rechargeable Batteries 0.00 0.00 0.00 0.00Textiles (recycled – not donated for reuse) 0.00 0.00 0.00 0.00Used Motor Oil Filters 22.00 0.00 0.00 22.00Wood Packaging (pallets, crates, barrels) 0.00 0.00 321.00 321.00Other Items 0.00 0.00 0.25 0.25TOTAL MISCELLANEOUS ITEMS 32.01 0.00 322.17 354.18
COMMINGLED RECYCLABLESTOTAL COMMINGLED RECYCLABLES 944.15 0.00 400.00 1,344.15TOTAL FOR ALL 20,311.65 7,961.07 1,623.48 29,896.20

South Carolina Solid Waste Management Annual Report for Fiscal Year 2013 59
EDGEFIELD COUNTY
TABLE 8.41: Edgefield County MSW Summary
POPULATION DROP-OFF CENTERS
CURBSIDE PROGRAMS
RECYCLING RATE (PERCENT)
RECYCLED (P/P/D)
RECYCLED (TONS)
DISPOSED (P/P/D)
DISPOSED (TONS)
26,347 8 2 7.2 0.20 958.19 2.6 12,378
TABLE 8.42: Edgefield County MSW Recycling Data in Tons
COMMODITY RESIDENTIAL COMMERCIAL/INSTITUTIONAL
INDUSTRIAL(OFFICE/PACKAGING) TOTAL
GLASSContainers & Packaging - Brown 0.00 0.00 0.00 0.00Containers & Packaging - Clear 0.00 0.00 0.00 0.00Containers & Packaging - Green 0.00 0.00 0.00 0.00Containers & Packaging - Mixed 0.00 0.00 0.00 0.00TOTAL GLASS 0.00 0.00 0.00 0.00
METALAluminum Cans 3.83 0.00 0.00 3.83Ferrous, Magnetic 0.00 0.00 0.00 0.00Non-Ferrous, Non-magnetic 0.00 0.00 0.00 0.00Steel Cans 0.00 0.00 0.00 0.00Mixed Scrap Metal 134.54 0.00 0.00 134.54TOTAL METAL 138.37 0.00 0.00 138.37
PAPERCardboard 116.81 0.00 0.00 116.81Magazines 0.00 0.00 0.00 0.00Newspaper and Inserts 125.29 0.00 0.00 125.29Office Paper 0.00 0.00 0.00 0.00Paperboard 0.00 0.00 0.00 0.00Phone Books 0.00 0.00 0.00 0.00Mixed Paper 36.24 0.00 0.00 36.24TOTAL PAPER 278.34 0.00 0.00 278.34
PLASTICHDPE 0.00 0.00 0.00 0.00LDPE 0.00 0.00 0.00 0.00PET 0.00 0.00 0.00 0.00PP 0.00 0.00 0.00 0.00PS 0.00 0.00 0.00 0.00Vinyl 0.00 0.00 0.00 0.00Commingled PET and HDPE 23.79 0.00 0.00 23.79Mixed Plastic 0.00 0.00 0.00 0.00TOTAL PLASTIC 23.79 0.00 0.00 23.79
BANNED ITEMSAppliances 33.36 0.00 0.00 33.36Electronics 67.09 5.97 0.00 73.06Lead-acid Batteries (automobiles, trucks, motorcycles – small sealed lead-acid batteries) 64.41 63.24 0.00 127.65
Tires (automobiles, trucks, motorcycles) 196.85 0.00 0.00 196.85Used Motor Oil (automobiles, trucks, motorcycles) 37.92 –– –– 37.92
Yard Trimmings 0.00 0.00 0.00 0.00TOTAL BANNED ITEMS 399.63 69.21 0.00 468.84
MISCELLANEOUS ITEMSAntifreeze 0.00 0.00 0.00 0.00Cooking Oil/Grease 0.00 0.00 0.00 0.00Fluorescent Bulbs 0.00 0.00 0.00 0.00Food Scraps 0.00 0.00 0.00 0.00Household Hazardous Materials 0.00 0.00 0.00 0.00Inkjet/Toner Cartridges 0.00 0.00 0.00 0.00Mattresses 0.00 0.00 0.00 0.00Paint 0.00 0.00 0.00 0.00Rechargeable Batteries 0.00 0.00 0.00 0.00Textiles (recycled – not donated for reuse) 0.00 0.00 0.00 0.00Used Motor Oil Filters 0.00 0.00 0.00 0.00Wood Packaging (pallets, crates, barrels) 0.00 0.00 0.00 0.00Other Items 0.00 0.00 0.00 0.00TOTAL MISCELLANEOUS ITEMS 0.00 0.00 0.00 0.00
COMMINGLED RECYCLABLESTOTAL COMMINGLED RECYCLABLES 48.85 0.00 0.00 48.85TOTAL FOR ALL 888.98 69.21 0.00 958.19

60 South Carolina Solid Waste Management Annual Report for Fiscal Year 2013
FAIRFIELD COUNTY
TABLE 8.43: Fairfield County MSW Summary
POPULATION DROP-OFF CENTERS
CURBSIDE PROGRAMS
RECYCLING RATE (PERCENT)
RECYCLED (P/P/D)
RECYCLED (TONS)
DISPOSED (P/P/D)
DISPOSED (TONS)
23,363 11 0 12.2 0.61 2,579.74 4.3 18,524
TABLE 8.44: Fairfield County MSW Recycling Data in Tons
COMMODITY RESIDENTIAL COMMERCIAL/INSTITUTIONAL
INDUSTRIAL(OFFICE/PACKAGING) TOTAL
GLASSContainers & Packaging - Brown 0.00 0.00 0.00 0.00Containers & Packaging - Clear 0.00 0.00 0.00 0.00Containers & Packaging - Green 2.30 0.00 0.00 2.30Containers & Packaging - Mixed 48.83 0.00 0.00 48.83TOTAL GLASS 51.13 0.00 0.00 51.13
METALAluminum Cans 1.63 0.00 0.90 2.53Ferrous, Magnetic 0.00 0.00 0.00 0.00Non-Ferrous, Non-magnetic 0.00 0.00 0.00 0.00Steel Cans 0.00 0.00 0.00 0.00Mixed Scrap Metal 213.76 0.00 16.00 229.76TOTAL METAL 215.39 0.00 16.90 232.29
PAPERCardboard 100.00 0.00 94.67 194.67Magazines 0.00 0.00 0.00 0.00Newspaper and Inserts 0.00 0.00 0.00 0.00Office Paper 0.00 0.00 128.00 128.00Paperboard 0.00 0.00 0.00 0.00Phone Books 0.00 0.00 0.05 0.05Mixed Paper 173.60 0.00 0.00 173.60TOTAL PAPER 273.60 0.00 222.72 496.32
PLASTICHDPE 50.99 0.00 0.00 50.99LDPE 0.00 0.00 0.00 0.00PET 0.00 0.00 0.00 0.00PP 0.00 0.00 0.00 0.00PS 0.00 0.00 0.00 0.00Vinyl 0.00 0.00 0.00 0.00Commingled PET and HDPE 4.14 0.00 0.00 4.14Mixed Plastic 0.00 0.00 0.00 0.00TOTAL PLASTIC 55.13 0.00 0.00 55.13
BANNED ITEMSAppliances 0.00 0.00 0.00 0.00Electronics 99.03 0.00 0.00 99.03Lead-acid Batteries (automobiles, trucks, motorcycles – small sealed lead-acid batteries) 60.29 59.79 5.00 125.08
Tires (automobiles, trucks, motorcycles) 581.70 0.00 0.00 581.70Used Motor Oil (automobiles, trucks, motorcycles) 31.24 –– –– 31.24
Yard Trimmings 900.00 0.00 0.00 900.00TOTAL BANNED ITEMS 1,672.27 59.79 5.00 1,737.06
MISCELLANEOUS ITEMSAntifreeze 0.00 0.00 0.00 0.00Cooking Oil/Grease 4.31 0.00 0.00 4.31Fluorescent Bulbs 0.00 0.00 0.31 0.31Food Scraps 0.00 0.00 0.00 0.00Household Hazardous Materials 0.00 0.00 0.00 0.00Inkjet/Toner Cartridges 0.00 0.00 0.00 0.00Mattresses 0.00 0.00 0.00 0.00Paint 0.00 0.00 0.00 0.00Rechargeable Batteries 0.00 0.00 0.15 0.15Textiles (recycled – not donated for reuse) 0.00 0.00 0.00 0.00Used Motor Oil Filters 3.05 0.00 0.00 3.05Wood Packaging (pallets, crates, barrels) 0.00 0.00 0.00 0.00Other Items 0.00 0.00 0.00 0.00TOTAL MISCELLANEOUS ITEMS 7.36 0.00 0.46 7.81
COMMINGLED RECYCLABLESTOTAL COMMINGLED RECYCLABLES 0.00 0.00 0.00 0.00TOTAL FOR ALL 2,274.87 59.79 245.08 2,579.74

South Carolina Solid Waste Management Annual Report for Fiscal Year 2013 61
FLORENCE COUNTY
TABLE 8.45: Florence County MSW Summary
POPULATION DROP-OFF CENTERS
CURBSIDE PROGRAMS
RECYCLING RATE (PERCENT)
RECYCLED (P/P/D)
RECYCLED (TONS)
DISPOSED (P/P/D)
DISPOSED (TONS)
137,948 15 2 17 0.83 20,841.52 4.0 101,603
TABLE 8.46: Florence County MSW Recycling Data in Tons
COMMODITY RESIDENTIAL COMMERCIAL/INSTITUTIONAL
INDUSTRIAL(OFFICE/PACKAGING) TOTAL
GLASSContainers & Packaging - Brown 0.00 0.00 0.00 0.00Containers & Packaging - Clear 0.00 2.00 0.00 2.00Containers & Packaging - Green 0.00 0.00 0.00 0.00Containers & Packaging - Mixed 0.00 0.00 0.00 0.00TOTAL GLASS 0.00 2.00 0.00 2.00
METALAluminum Cans 7.01 0.00 1.09 8.10Ferrous, Magnetic 0.00 7,424.34 553.00 7,977.34Non-Ferrous, Non-magnetic 0.00 21.00 2.00 23.00Steel Cans 5.84 0.00 0.00 5.84Mixed Scrap Metal 0.00 3.00 225.34 228.34TOTAL METAL 12.85 7,448.34 781.43 8,242.62
PAPERCardboard 0.00 1.90 46.85 48.75Magazines 0.00 0.00 1.00 1.00Newspaper and Inserts 177.48 0.00 0.00 177.48Office Paper 0.00 32.50 4.00 36.50Paperboard 0.00 0.00 0.00 0.00Phone Books 0.00 0.10 1.00 1.10Mixed Paper 18.68 0.00 0.65 19.33TOTAL PAPER 196.16 34.50 53.50 284.16
PLASTICHDPE 8.17 0.00 1.00 9.17LDPE 0.00 0.00 0.00 0.00PET 16.35 1.00 0.00 17.35PP 0.00 0.00 0.00 0.00PS 0.00 0.00 0.00 0.00Vinyl 0.00 0.00 0.00 0.00Commingled PET and HDPE 0.00 0.00 0.00 0.00Mixed Plastic 0.00 0.00 25.86 25.86TOTAL PLASTIC 24.52 1.00 26.86 52.38
BANNED ITEMSAppliances 1,087.00 0.00 0.00 1,087.00Electronics 270.17 18.76 0.00 288.93Lead-acid Batteries (automobiles, trucks, motorcycles – small sealed lead-acid batteries) 334.17 334.17 0.00 668.34
Tires (automobiles, trucks, motorcycles) 1,163.55 0.00 1.66 1,165.21Used Motor Oil (automobiles, trucks, motorcycles) 77.60 –– –– 77.60
Yard Trimmings 7,521.50 0.00 0.00 7,521.50TOTAL BANNED ITEMS 10,453.99 352.93 1.66 10,808.58
MISCELLANEOUS ITEMSAntifreeze 0.00 0.10 0.00 0.10Cooking Oil/Grease 1.58 0.00 1.00 2.58Fluorescent Bulbs 0.00 0.00 1.00 1.00Food Scraps 0.00 0.00 0.00 0.00Household Hazardous Materials 0.00 0.00 0.00 0.00Inkjet/Toner Cartridges 0.00 0.00 0.00 0.00Mattresses 0.00 0.00 0.00 0.00Paint 0.00 0.00 0.00 0.00Rechargeable Batteries 0.00 0.00 1.00 1.00Textiles (recycled – not donated for reuse) 0.00 0.00 0.00 0.00Used Motor Oil Filters 3.60 0.10 1.25 4.95Wood Packaging (pallets, crates, barrels) 0.00 0.00 9.00 9.00Other Items 0.14 0.00 0.00 0.14TOTAL MISCELLANEOUS ITEMS 5.32 0.20 13.25 18.77
COMMINGLED RECYCLABLESTOTAL COMMINGLED RECYCLABLES 1,403.01 30.00 0.00 1,433.01TOTAL FOR ALL 12,095.85 7,868.97 876.70 20,841.52

62 South Carolina Solid Waste Management Annual Report for Fiscal Year 2013
GEORGETOWN COUNTY
TABLE 8.47: Georgetown County MSW Summary
POPULATION DROP-OFF CENTERS
CURBSIDE PROGRAMS
RECYCLING RATE (PERCENT)
RECYCLED (P/P/D)
RECYCLED (TONS)
DISPOSED (P/P/D)
DISPOSED (TONS)
60,189 14 1 24.6 7.18 12,989.49 3.6 39,910
TABLE 8.48: Georgetown County MSW Recycling Data in Tons
COMMODITY RESIDENTIAL COMMERCIAL/INSTITUTIONAL
INDUSTRIAL(OFFICE/PACKAGING) TOTAL
GLASSContainers & Packaging - Brown 0.00 0.00 0.00 0.00Containers & Packaging - Clear 94.89 0.00 0.00 94.89Containers & Packaging - Green 96.23 0.00 0.00 96.23Containers & Packaging - Mixed 47.79 0.00 0.00 47.79TOTAL GLASS 238.91 0.00 0.00 238.91
METALAluminum Cans 10.83 0.00 0.00 10.83Ferrous, Magnetic 0.00 0.00 0.00 0.00Non-Ferrous, Non-magnetic 0.00 0.00 0.00 0.00Steel Cans 0.00 0.00 0.00 0.00Mixed Scrap Metal 336.01 5,550.29 0.00 5,886.30TOTAL METAL 346.84 5,550.29 0.00 5,897.13
PAPERCardboard 332.55 383.27 0.00 715.82Magazines 0.00 0.00 0.00 0.00Newspaper and Inserts 343.78 85.12 0.00 428.90Office Paper 14.81 0.00 0.00 14.81Paperboard 0.00 0.00 0.00 0.00Phone Books 0.00 0.00 0.00 0.00Mixed Paper 0.60 0.00 0.00 0.60TOTAL PAPER 691.74 468.39 0.00 1,160.13
PLASTICHDPE 48.63 0.00 0.00 48.63LDPE 0.00 0.00 0.00 0.00PET 78.19 0.00 0.00 78.19PP 0.00 0.00 0.00 0.00PS 0.00 0.00 0.00 0.00Vinyl 0.00 0.00 0.00 0.00Commingled PET and HDPE 0.00 0.00 0.00 0.00Mixed Plastic 14.06 0.00 0.00 14.06TOTAL PLASTIC 140.88 0.00 0.00 140.88
BANNED ITEMSAppliances 0.00 0.00 0.00 0.00Electronics 158.36 17.60 0.00 175.96Lead-acid Batteries (automobiles, trucks, motorcycles – small sealed lead-acid batteries) 146.80 144.81 0.00 291.61
Tires (automobiles, trucks, motorcycles) 799.89 0.00 0.00 799.89Used Motor Oil (automobiles, trucks, motorcycles) 67.69 –– –– 67.69
Yard Trimmings 3,323.87 869.00 0.00 4,192.87TOTAL BANNED ITEMS 4,496.61 1,031.41 0.00 5,528.02
MISCELLANEOUS ITEMSAntifreeze 0.52 0.00 0.00 0.52Cooking Oil/Grease 1.35 0.00 0.00 1.35Fluorescent Bulbs 0.00 0.00 0.00 0.00Food Scraps 0.00 0.00 0.00 0.00Household Hazardous Materials 0.00 0.00 0.00 0.00Inkjet/Toner Cartridges 0.00 0.00 0.00 0.00Mattresses 0.00 0.00 0.00 0.00Paint 0.17 0.00 0.00 0.17Rechargeable Batteries 0.00 0.00 0.00 0.00Textiles (recycled – not donated for reuse) 20.90 0.00 0.00 20.90Used Motor Oil Filters 1.48 0.00 0.00 1.48Wood Packaging (pallets, crates, barrels) 0.00 0.00 0.00 0.00Other Items 0.00 0.00 0.00 0.00TOTAL MISCELLANEOUS ITEMS 24.42 0.00 0.00 24.42
COMMINGLED RECYCLABLESTOTAL COMMINGLED RECYCLABLES 0.00 0.00 0.00 0.00TOTAL FOR ALL 5,939.40 7,121.38 0.00 12,989.49

South Carolina Solid Waste Management Annual Report for Fiscal Year 2013 63
GREENVILLE COUNTY
TABLE 8.49: Greenville County MSW Summary
POPULATION DROP-OFF CENTERS
CURBSIDE PROGRAMS
RECYCLING RATE (PERCENT)
RECYCLED (P/P/D)
RECYCLED (TONS)
DISPOSED (P/P/D)
DISPOSED (TONS)
467,605 25 6 33.6 2.28 194,820.18 4.5 384,998
TABLE 8.50: Greenville County MSW Recycling Data in Tons
COMMODITY RESIDENTIAL COMMERCIAL/INSTITUTIONAL
INDUSTRIAL(OFFICE/PACKAGING) TOTAL
GLASSContainers & Packaging - Brown 0.00 0.00 0.00 0.00Containers & Packaging - Clear 0.00 0.00 0.00 0.00Containers & Packaging - Green 0.00 0.00 0.00 0.00Containers & Packaging - Mixed 312.00 0.40 1.00 313.40TOTAL GLASS 312.00 0.40 1.00 313.40
METALAluminum Cans 0.00 67.33 2.48 69.82Ferrous, Magnetic 0.00 28,630.22 2,192.75 30,822.97Non-Ferrous, Non-magnetic 0.00 326.11 5.00 331.11Steel Cans 0.00 0.27 0.00 0.27Mixed Scrap Metal 3.00 586.91 1,190.01 1,779.92TOTAL METAL 3.00 29,610.84 3,390.24 33,004.09
PAPERCardboard 700.36 82,597.50 2,260.38 85,558.24Magazines 0.00 0.03 0.01 0.04Newspaper and Inserts 0.00 22.50 0.20 22.70Office Paper 0.00 5,093.42 614.27 5,707.69Paperboard 0.00 0.00 0.00 0.00Phone Books 0.00 0.20 0.22 0.42Mixed Paper 4,137.33 2,989.94 36.47 7,163.75TOTAL PAPER 4,837.69 90,703.59 2,911.56 98,452.84
PLASTICHDPE 0.00 7.43 0.00 7.43LDPE 0.00 3.40 5.20 8.60PET 0.71 12.46 1.21 14.38PP 0.00 0.00 0.00 0.00PS 0.00 0.00 0.00 0.00Vinyl 0.00 0.00 0.00 0.00Commingled PET and HDPE 27.00 0.00 0.00 27.00Mixed Plastic 0.00 353.16 2,935.86 3,289.02TOTAL PLASTIC 27.71 376.45 2,942.27 3,346.43
BANNED ITEMSAppliances 1,247.00 8.83 0.00 1,255.83Electronics 424.30 226.80 119.41 770.51Lead-acid Batteries (automobiles, trucks, motorcycles – small sealed lead-acid batteries) 1,141.27 1,513.63 10.86 2,665.76
Tires (automobiles, trucks, motorcycles) 4,536.91 2,952.57 1,714.08 9,203.55Used Motor Oil (automobiles, trucks, motorcycles) 229.87 –– –– 229.87
Yard Trimmings 18,582.13 7,316.68 0.00 25,898.81TOTAL BANNED ITEMS 26,161.48 12,018.49 1,844.35 40,024.32
MISCELLANEOUS ITEMSAntifreeze 10.00 56.67 0.00 66.67Cooking Oil/Grease 11.00 41.88 4.80 57.68Fluorescent Bulbs 24.00 8.77 11.79 44.56Food Scraps 0.00 474.07 0.00 474.07Household Hazardous Materials 0.00 0.00 0.00 0.00Inkjet/Toner Cartridges 4.10 5.15 1.76 11.01Mattresses 0.00 0.00 0.00 0.00Paint 0.40 1.88 1.10 3.38Rechargeable Batteries 4.80 0.12 0.76 5.68Textiles (recycled – not donated for reuse) 70.00 0.00 0.00 70.00Used Motor Oil Filters 3.35 62.73 84.90 150.98Wood Packaging (pallets, crates, barrels) 8.32 1,113.20 2,197.07 3,318.59Other Items 18.50 771.19 75.26 864.94TOTAL MISCELLANEOUS ITEMS 154.47 2,535.65 2,377.43 5,067.56
COMMINGLED RECYCLABLESTOTAL COMMINGLED RECYCLABLES 9,083.73 5,480.62 47.20 14,611.55TOTAL FOR ALL 40,580.08 140,726.05 13,514.05 194,820.18

64 South Carolina Solid Waste Management Annual Report for Fiscal Year 2013
GREENWOOD COUNTY
TABLE 8.51: Greenwood County MSW Summary
POPULATION DROP-OFF CENTERS
CURBSIDE PROGRAMS
RECYCLING RATE (PERCENT)
RECYCLED (P/P/D)
RECYCLED (TONS)
DISPOSED (P/P/D)
DISPOSED (TONS)
69,756 9 4 26.1 1.72 21,871.23 4.9 61,960
TABLE 8.52: Greenwood County MSW Recycling Data in Tons
COMMODITY RESIDENTIAL COMMERCIAL/INSTITUTIONAL
INDUSTRIAL(OFFICE/PACKAGING) TOTAL
GLASSContainers & Packaging - Brown 0.00 0.00 0.00 0.00Containers & Packaging - Clear 0.00 2.00 0.00 2.00Containers & Packaging - Green 0.00 0.00 0.00 0.00Containers & Packaging - Mixed 0.00 0.00 438.00 438.00TOTAL GLASS 0.00 2.00 438.00 440.00
METALAluminum Cans 5.00 2.35 1.00 8.35Ferrous, Magnetic 0.00 3,231.77 237.00 3,468.77Non-Ferrous, Non-magnetic 0.00 9.00 2,988.02 2,997.02Steel Cans 10.52 14.13 97.00 121.65Mixed Scrap Metal 151.00 213.11 327.57 691.68TOTAL METAL 166.52 3,470.36 3,650.59 7,287.48
PAPERCardboard 550.00 3,144.52 1,553.30 5,247.82Magazines 0.00 0.00 0.25 0.25Newspaper and Inserts 0.00 0.00 8.25 8.25Office Paper 104.00 67.09 5.00 176.09Paperboard 0.00 0.00 0.00 0.00Phone Books 0.00 0.00 0.00 0.00Mixed Paper 247.00 298.60 3,527.00 4,072.60TOTAL PAPER 901.00 3,510.21 5,093.80 9,505.01
PLASTICHDPE 6.07 2.66 32.00 40.73LDPE 0.00 0.30 0.00 0.30PET 52.40 2.01 0.00 54.41PP 0.00 0.00 0.00 0.00PS 0.00 0.00 0.00 0.00Vinyl 0.00 0.00 0.00 0.00Commingled PET and HDPE 44.12 0.00 0.00 44.12Mixed Plastic 0.09 2.64 290.00 292.73TOTAL PLASTIC 102.68 7.61 322.00 432.29
BANNED ITEMSAppliances 2.00 0.00 0.00 2.00Electronics 112.40 16.08 0.90 129.38Lead-acid Batteries (automobiles, trucks, motorcycles – small sealed lead-acid batteries) 169.98 168.52 1.06 339.57
Tires (automobiles, trucks, motorcycles) 1,184.58 7.97 0.00 1,192.55Used Motor Oil (automobiles, trucks, motorcycles) 26.94 –– –– 26.94
Yard Trimmings 0.00 484.14 0.00 484.14TOTAL BANNED ITEMS 1,495.91 676.72 1.96 2,174.58
MISCELLANEOUS ITEMSAntifreeze 0.88 0.80 0.00 1.68Cooking Oil/Grease 1.00 0.00 0.00 1.00Fluorescent Bulbs 0.00 1.32 1.44 2.76Food Scraps 0.00 0.00 0.00 0.00Household Hazardous Materials 0.00 0.00 0.00 0.00Inkjet/Toner Cartridges 0.03 0.08 0.01 0.11Mattresses 0.00 0.00 0.00 0.00Paint 0.00 0.00 0.00 0.00Rechargeable Batteries 0.00 0.11 0.00 0.11Textiles (recycled – not donated for reuse) 0.00 0.00 0.00 0.00Used Motor Oil Filters 0.49 0.01 0.00 0.51Wood Packaging (pallets, crates, barrels) 0.00 2.20 1.50 3.70Other Items 0.00 0.00 3.00 3.00TOTAL MISCELLANEOUS ITEMS 2.40 4.52 5.96 12.87
COMMINGLED RECYCLABLESTOTAL COMMINGLED RECYCLABLES 2,019.00 0.00 0.00 2,019.00TOTAL FOR ALL 4,687.51 7,671.41 9,512.31 21,871.23

South Carolina Solid Waste Management Annual Report for Fiscal Year 2013 65
HAMPTON COUNTY
TABLE 8.53: Hampton County MSW Summary
POPULATION DROP-OFF CENTERS
CURBSIDE PROGRAMS
RECYCLING RATE (PERCENT)
RECYCLED (P/P/D)
RECYCLED (TONS)
DISPOSED (P/P/D)
DISPOSED (TONS)
20,726 11 0 19 0.69 2,620.13 3.0 11,198
TABLE 8.54: Hampton County MSW Recycling Data in Tons
COMMODITY RESIDENTIAL COMMERCIAL/INSTITUTIONAL
INDUSTRIAL(OFFICE/PACKAGING) TOTAL
GLASSContainers & Packaging - Brown 0.00 0.00 0.00 0.00Containers & Packaging - Clear 0.00 0.00 0.00 0.00Containers & Packaging - Green 0.00 0.00 0.00 0.00Containers & Packaging - Mixed 0.00 0.00 0.00 0.00TOTAL GLASS 0.00 0.00 0.00 0.00
METALAluminum Cans 0.00 24.00 0.00 24.00Ferrous, Magnetic 0.00 0.00 0.00 0.00Non-Ferrous, Non-magnetic 0.00 0.00 0.00 0.00Steel Cans 0.00 0.00 0.00 0.00Mixed Scrap Metal 71.42 50.00 0.00 121.42TOTAL METAL 71.42 74.00 0.00 145.42
PAPERCardboard 41.73 25.00 0.00 66.73Magazines 14.63 0.00 0.00 14.63Newspaper and Inserts 27.16 0.00 0.00 27.16Office Paper 1.78 0.00 0.00 1.78Paperboard 0.00 0.00 0.00 0.00Phone Books 0.00 0.00 0.00 0.00Mixed Paper 0.00 0.00 0.00 0.00TOTAL PAPER 85.30 25.00 0.00 110.30
PLASTICHDPE 12.15 0.00 0.00 12.15LDPE 0.00 0.00 0.00 0.00PET 0.00 0.00 0.00 0.00PP 0.00 0.00 0.00 0.00PS 0.00 0.00 0.00 0.00Vinyl 0.00 0.00 0.00 0.00Commingled PET and HDPE 1.17 0.00 0.00 1.17Mixed Plastic 0.00 0.00 0.00 0.00TOTAL PLASTIC 13.32 0.00 0.00 13.32
BANNED ITEMSAppliances 25.58 0.00 0.00 25.58Electronics 39.28 0.00 0.00 39.28Lead-acid Batteries (automobiles, trucks, motorcycles – small sealed lead-acid batteries) 52.13 55.24 0.00 107.37
Tires (automobiles, trucks, motorcycles) 337.33 24.68 0.00 362.01Used Motor Oil (automobiles, trucks, motorcycles) 24.93 –– –– 24.93
Yard Trimmings 1,784.99 0.00 0.00 1,784.99TOTAL BANNED ITEMS 2,264.24 79.92 0.00 2,344.16
MISCELLANEOUS ITEMSAntifreeze 0.00 0.00 0.00 0.00Cooking Oil/Grease 0.00 0.00 0.00 0.00Fluorescent Bulbs 0.00 0.00 0.03 0.03Food Scraps 0.00 0.00 0.00 0.00Household Hazardous Materials 0.00 0.00 0.00 0.00Inkjet/Toner Cartridges 0.00 0.00 0.00 0.00Mattresses 0.00 0.00 0.00 0.00Paint 0.00 0.00 0.00 0.00Rechargeable Batteries 0.00 0.00 0.00 0.00Textiles (recycled – not donated for reuse) 0.00 0.00 0.00 0.00Used Motor Oil Filters 1.63 0.00 0.00 1.63Wood Packaging (pallets, crates, barrels) 5.27 0.00 0.00 5.27Other Items 0.00 0.00 0.00 0.00TOTAL MISCELLANEOUS ITEMS 6.90 0.00 0.03 6.93
COMMINGLED RECYCLABLESTOTAL COMMINGLED RECYCLABLES 0.00 0.00 0.00 0.00TOTAL FOR ALL 2,441.18 178.92 0.03 2,620.13

66 South Carolina Solid Waste Management Annual Report for Fiscal Year 2013
HORRY COUNTY
TABLE 8.55: Horry County MSW Summary
POPULATION DROP-OFF CENTERS
CURBSIDE PROGRAMS
RECYCLING RATE (PERCENT)
RECYCLED (P/P/D)
RECYCLED (TONS)
DISPOSED (P/P/D)
DISPOSED (TONS)
282,285 30 6 50.4 4.44 228,885.00 4.4 225,593
TABLE 8.56: Horry County MSW Recycling Data in Tons
COMMODITY RESIDENTIAL COMMERCIAL/INSTITUTIONAL
INDUSTRIAL(OFFICE/PACKAGING) TOTAL
GLASSContainers & Packaging - Brown 0.00 0.00 0.00 0.00Containers & Packaging - Clear 0.00 0.00 0.00 0.00Containers & Packaging - Green 0.00 0.00 0.00 0.00Containers & Packaging - Mixed 2,056.58 0.00 0.00 2,056.58TOTAL GLASS 2,056.58 0.00 0.00 2,056.58
METALAluminum Cans 182.24 383.62 1.09 566.95Ferrous, Magnetic 0.00 12,785.92 5,354.23 18,140.15Non-Ferrous, Non-magnetic 0.00 879.70 233.00 1,112.70Steel Cans 407.40 21.00 0.00 428.40Mixed Scrap Metal 2,699.90 2,929.77 4.73 5,634.40TOTAL METAL 3,289.54 17,000.01 5,593.05 25,882.60
PAPERCardboard 9,576.10 127,282.96 451.71 137,310.77Magazines 0.00 28.87 0.45 29.32Newspaper and Inserts 5,143.18 441.72 0.00 5,584.90Office Paper 507.17 2,146.01 46.45 2,699.63Paperboard 0.00 1.72 0.00 1.72Phone Books 0.00 70.72 0.18 70.90Mixed Paper 0.00 262.00 0.00 262.00TOTAL PAPER 15,226.45 130,234.00 498.79 145,959.24
PLASTICHDPE 410.63 5.47 0.00 416.10LDPE 0.00 0.50 0.00 0.50PET 704.96 2.53 0.00 707.49PP 0.00 0.00 0.00 0.00PS 0.00 0.00 0.00 0.00Vinyl 0.00 0.36 0.00 0.36Commingled PET and HDPE 309.11 49.40 38.69 397.20Mixed Plastic 0.00 152.30 0.00 152.30TOTAL PLASTIC 1,424.70 210.56 38.69 1,673.95
BANNED ITEMSAppliances 0.00 7.90 0.00 7.90Electronics 910.45 149.11 1.11 1,060.67Lead-acid Batteries (automobiles, trucks, motorcycles – small sealed lead-acid batteries) 685.51 3,123.50 0.00 3,809.01
Tires (automobiles, trucks, motorcycles) 3,371.23 1,472.67 31.66 4,875.56Used Motor Oil (automobiles, trucks, motorcycles) 160.18 –– –– 160.18
Yard Trimmings 38,278.00 1,116.86 0.00 39,394.86TOTAL BANNED ITEMS 43,405.37 5,870.04 32.77 49,308.18
MISCELLANEOUS ITEMSAntifreeze 1.60 77.46 0.00 79.06Cooking Oil/Grease 101.78 684.38 0.00 786.16Fluorescent Bulbs 0.15 2.59 1.99 4.73Food Scraps 0.00 880.52 0.00 880.52Household Hazardous Materials 1,100.12 0.00 0.00 1,100.12Inkjet/Toner Cartridges 0.00 6.56 0.07 6.62Mattresses 67.45 0.00 0.00 67.45Paint 63.55 0.00 0.50 64.05Rechargeable Batteries 4.80 2.49 0.18 7.47Textiles (recycled – not donated for reuse) 0.00 32.42 0.00 32.42Used Motor Oil Filters 0.00 195.77 23.00 218.77Wood Packaging (pallets, crates, barrels) 51.16 162.07 6.72 219.95Other Items 0.00 230.86 5.73 236.59TOTAL MISCELLANEOUS ITEMS 1,390.61 2,275.12 38.19 3,703.91
COMMINGLED RECYCLABLESTOTAL COMMINGLED RECYCLABLES 0.00 300.54 0.00 300.54TOTAL FOR ALL 66,793.25 155,890.27 6,201.48 228,885.00

South Carolina Solid Waste Management Annual Report for Fiscal Year 2013 67
JASPER COUNTY
TABLE 8.57: Jasper County MSW Summary
POPULATION DROP-OFF CENTERS
CURBSIDE PROGRAMS
RECYCLING RATE (PERCENT)
RECYCLED (P/P/D)
RECYCLED (TONS)
DISPOSED (P/P/D)
DISPOSED (TONS)
25,833 6 2 7 0.17 822.59 2.3 10,993
TABLE 8.58: Jasper County MSW Recycling Data in Tons
COMMODITY RESIDENTIAL COMMERCIAL/INSTITUTIONAL
INDUSTRIAL(OFFICE/PACKAGING) TOTAL
GLASSContainers & Packaging - Brown 0.00 0.00 0.00 0.00Containers & Packaging - Clear 0.00 0.00 0.00 0.00Containers & Packaging - Green 0.00 0.00 0.00 0.00Containers & Packaging - Mixed 75.62 0.00 0.00 75.62TOTAL GLASS 75.62 0.00 0.00 75.62
METALAluminum Cans 0.67 0.00 0.00 0.67Ferrous, Magnetic 0.00 84.04 0.00 84.04Non-Ferrous, Non-magnetic 0.00 1.00 0.00 1.00Steel Cans 0.00 0.00 0.00 0.00Mixed Scrap Metal 63.63 0.33 0.00 63.96TOTAL METAL 64.30 85.37 0.00 149.67
PAPERCardboard 131.24 4.56 0.00 135.80Magazines 0.00 0.00 0.00 0.00Newspaper and Inserts 62.32 0.00 0.00 62.32Office Paper 0.00 0.25 0.00 0.25Paperboard 0.00 2.00 0.00 2.00Phone Books 0.00 0.00 0.00 0.00Mixed Paper 0.00 1.78 0.00 1.78TOTAL PAPER 193.56 8.59 0.00 202.15
PLASTICHDPE 0.00 0.00 0.00 0.00LDPE 0.00 0.00 0.00 0.00PET 0.00 0.00 0.00 0.00PP 0.00 0.00 0.00 0.00PS 0.00 0.00 0.00 0.00Vinyl 0.00 0.00 0.00 0.00Commingled PET and HDPE 0.00 0.00 0.00 0.00Mixed Plastic 25.48 0.33 0.00 25.81TOTAL PLASTIC 25.48 0.33 0.00 25.81
BANNED ITEMSAppliances 40.99 0.00 0.00 40.99Electronics 66.94 0.00 0.00 66.94Lead-acid Batteries (automobiles, trucks, motorcycles – small sealed lead-acid batteries) 64.42 62.99 0.00 127.41
Tires (automobiles, trucks, motorcycles) 99.47 9.30 0.00 108.77Used Motor Oil (automobiles, trucks, motorcycles) 21.66 –– –– 21.66
Yard Trimmings 0.00 1.31 0.00 1.31TOTAL BANNED ITEMS 293.48 73.60 0.00 367.08
MISCELLANEOUS ITEMSAntifreeze 0.00 0.00 0.00 0.00Cooking Oil/Grease 0.00 2.05 0.00 2.05Fluorescent Bulbs 0.00 0.00 0.00 0.00Food Scraps 0.00 0.00 0.00 0.00Household Hazardous Materials 0.00 0.00 0.00 0.00Inkjet/Toner Cartridges 0.00 0.00 0.00 0.00Mattresses 0.00 0.00 0.00 0.00Paint 0.00 0.00 0.00 0.00Rechargeable Batteries 0.00 0.00 0.00 0.00Textiles (recycled – not donated for reuse) 0.00 0.00 0.00 0.00Used Motor Oil Filters 0.00 0.00 0.00 0.00Wood Packaging (pallets, crates, barrels) 0.00 0.21 0.00 0.21Other Items 0.00 0.00 0.00 0.00TOTAL MISCELLANEOUS ITEMS 0.00 2.26 0.00 2.26
COMMINGLED RECYCLABLESTOTAL COMMINGLED RECYCLABLES 0.00 0.00 0.00 0.00TOTAL FOR ALL 652.44 170.15 0.00 822.59

68 South Carolina Solid Waste Management Annual Report for Fiscal Year 2013
KERSHAW COUNTY
TABLE 8.59: Kershaw County MSW Summary
POPULATION DROP-OFF CENTERS
CURBSIDE PROGRAMS
RECYCLING RATE (PERCENT)
RECYCLED (P/P/D)
RECYCLED (TONS)
DISPOSED (P/P/D)
DISPOSED (TONS)
62,343 10 1 45.1 2.03 23,066.41 2.5 28,033
TABLE 8.60: Kershaw County MSW Recycling Data in Tons
COMMODITY RESIDENTIAL COMMERCIAL/INSTITUTIONAL
INDUSTRIAL(OFFICE/PACKAGING) TOTAL
GLASSContainers & Packaging - Brown 0.00 0.00 0.00 0.00Containers & Packaging - Clear 0.00 0.00 0.00 0.00Containers & Packaging - Green 6.52 0.00 0.00 6.52Containers & Packaging - Mixed 0.00 0.00 0.00 0.00TOTAL GLASS 6.52 0.00 0.00 6.52
METALAluminum Cans 22.52 0.79 0.06 23.37Ferrous, Magnetic 0.00 27.00 29.56 56.56Non-Ferrous, Non-magnetic 0.00 2.60 0.00 2.60Steel Cans 0.00 0.00 0.00 0.00Mixed Scrap Metal 0.00 1.86 3.29 5.15TOTAL METAL 22.52 32.25 32.91 87.68
PAPERCardboard 214.51 2,904.19 17.28 3,135.98Magazines 0.00 0.00 0.00 0.00Newspaper and Inserts 318.34 0.00 0.00 318.34Office Paper 78.89 5.05 0.55 84.49Paperboard 0.00 0.00 0.00 0.00Phone Books 0.00 0.00 0.00 0.00Mixed Paper 1.71 0.00 0.00 1.71TOTAL PAPER 613.45 2,909.24 17.82 3,540.51
PLASTICHDPE 132.34 286.07 0.00 418.41LDPE 0.00 0.00 0.00 0.00PET 0.55 0.00 0.12 0.67PP 0.00 0.00 0.00 0.00PS 0.00 0.00 0.00 0.00Vinyl 0.00 0.00 0.00 0.00Commingled PET and HDPE 7.54 0.00 0.00 7.54Mixed Plastic 0.00 0.00 1.31 1.31TOTAL PLASTIC 140.43 286.07 1.42 427.92
BANNED ITEMSAppliances 14.76 0.00 0.00 14.76Electronics 66.53 14.71 0.00 81.24Lead-acid Batteries (automobiles, trucks, motorcycles – small sealed lead-acid batteries) 151.12 150.91 0.00 302.03
Tires (automobiles, trucks, motorcycles) 704.43 0.00 0.00 704.43Used Motor Oil (automobiles, trucks, motorcycles) 75.60 –– –– 75.60
Yard Trimmings 17,473.10 0.00 0.00 17,473.10TOTAL BANNED ITEMS 18,485.53 165.62 0.00 18,651.15
MISCELLANEOUS ITEMSAntifreeze 0.19 0.00 0.00 0.19Cooking Oil/Grease 0.13 0.00 0.00 0.13Fluorescent Bulbs 0.00 0.00 0.08 0.08Food Scraps 0.00 0.00 0.00 0.00Household Hazardous Materials 0.00 0.00 0.00 0.00Inkjet/Toner Cartridges 0.00 0.00 0.01 0.01Mattresses 0.00 0.00 0.00 0.00Paint 0.00 0.00 0.00 0.00Rechargeable Batteries 0.00 0.00 0.00 0.00Textiles (recycled – not donated for reuse) 0.00 0.00 0.00 0.00Used Motor Oil Filters 0.69 0.00 0.00 0.69Wood Packaging (pallets, crates, barrels) 0.00 0.00 30.13 30.13Other Items 0.00 0.00 0.00 0.00TOTAL MISCELLANEOUS ITEMS 1.01 0.00 30.22 31.22
COMMINGLED RECYCLABLESTOTAL COMMINGLED RECYCLABLES 321.40 0.00 0.00 321.40TOTAL FOR ALL 19,590.86 3,393.18 82.37 23,066.41

South Carolina Solid Waste Management Annual Report for Fiscal Year 2013 69
LANCASTER COUNTY
TABLE 8.61: Lancaster County MSW Summary
POPULATION DROP-OFF CENTERS
CURBSIDE PROGRAMS
RECYCLING RATE (PERCENT)
RECYCLED (P/P/D)
RECYCLED (TONS)
DISPOSED (P/P/D)
DISPOSED (TONS)
79,089 12 1 28.8 0.75 10,872.90 1.9 26,838
TABLE 8.62: Lancaster County MSW Recycling Data in Tons
COMMODITY RESIDENTIAL COMMERCIAL/INSTITUTIONAL
INDUSTRIAL(OFFICE/PACKAGING) TOTAL
GLASSContainers & Packaging - Brown 4.20 0.00 0.00 4.20Containers & Packaging - Clear 5.12 0.00 0.00 5.12Containers & Packaging - Green 0.00 0.00 0.00 0.00Containers & Packaging - Mixed 0.00 0.00 0.00 0.00TOTAL GLASS 9.32 0.00 0.00 9.32
METALAluminum Cans 0.61 0.00 6.56 7.17Ferrous, Magnetic 0.00 0.00 293.45 293.45Non-Ferrous, Non-magnetic 0.00 0.00 0.00 0.00Steel Cans 0.00 0.00 0.00 0.00Mixed Scrap Metal 55.62 0.00 214.63 270.25TOTAL METAL 56.23 0.00 514.64 570.87
PAPERCardboard 96.84 0.00 2,170.00 2,266.84Magazines 2.10 0.00 0.00 2.10Newspaper and Inserts 30.56 0.00 0.00 30.56Office Paper 6.70 0.00 160.82 167.52Paperboard 0.00 0.00 0.00 0.00Phone Books 2.00 0.00 0.00 2.00Mixed Paper 0.00 0.00 19.90 19.90TOTAL PAPER 138.20 0.00 2,350.72 2,488.92
PLASTICHDPE 0.00 0.00 0.00 0.00LDPE 0.00 0.00 0.00 0.00PET 15.64 0.00 343.38 359.02PP 0.00 0.00 0.00 0.00PS 0.00 0.00 0.00 0.00Vinyl 0.00 0.00 0.00 0.00Commingled PET and HDPE 0.00 0.00 0.00 0.00Mixed Plastic 0.00 0.00 284.07 284.07TOTAL PLASTIC 15.64 0.00 627.44 643.08
BANNED ITEMSAppliances 11.41 0.00 0.00 11.41Electronics 93.35 17.47 0.00 110.82Lead-acid Batteries (automobiles, trucks, motorcycles – small sealed lead-acid batteries) 191.61 191.57 0.36 383.54
Tires (automobiles, trucks, motorcycles) 589.48 0.00 0.00 589.48Used Motor Oil (automobiles, trucks, motorcycles) 4.15 –– –– 4.15
Yard Trimmings 3,488.40 0.00 0.00 3,488.40TOTAL BANNED ITEMS 4,378.39 209.04 0.36 4,587.79
MISCELLANEOUS ITEMSAntifreeze 0.00 0.00 0.00 0.00Cooking Oil/Grease 0.78 0.00 0.00 0.78Fluorescent Bulbs 0.03 0.00 0.20 0.23Food Scraps 0.00 0.00 0.00 0.00Household Hazardous Materials 1.88 0.00 0.00 1.88Inkjet/Toner Cartridges 0.00 0.00 0.89 0.89Mattresses 0.00 0.00 0.00 0.00Paint 3.30 0.00 0.10 3.40Rechargeable Batteries 0.00 0.00 0.00 0.00Textiles (recycled – not donated for reuse) 0.00 0.00 0.00 0.00Used Motor Oil Filters 4.05 0.00 0.00 4.05Wood Packaging (pallets, crates, barrels) 0.00 0.00 1,960.30 1,960.30Other Items 0.00 0.00 0.00 0.00TOTAL MISCELLANEOUS ITEMS 10.04 0.00 1,961.48 1,971.52
COMMINGLED RECYCLABLESTOTAL COMMINGLED RECYCLABLES 588.72 12.68 0.00 601.40TOTAL FOR ALL 5,196.54 221.72 5,454.64 10,872.90

70 South Carolina Solid Waste Management Annual Report for Fiscal Year 2013
LAURENS COUNTY
TABLE 8.63: Laurens County MSW Summary
POPULATION DROP-OFF CENTERS
CURBSIDE PROGRAMS
RECYCLING RATE (PERCENT)
RECYCLED (P/P/D)
RECYCLED (TONS)
DISPOSED (P/P/D)
DISPOSED (TONS)
66,223 13 0 36.8 1.31 15,854.99 2.3 27,206
TABLE 8.64: Laurens County MSW Recycling Data in Tons
COMMODITY RESIDENTIAL COMMERCIAL/INSTITUTIONAL
INDUSTRIAL(OFFICE/PACKAGING) TOTAL
GLASSContainers & Packaging - Brown 14.15 0.00 0.00 14.15Containers & Packaging - Clear 10.92 0.00 0.00 10.92Containers & Packaging - Green 0.00 0.00 0.00 0.00Containers & Packaging - Mixed 0.00 0.00 0.00 0.00TOTAL GLASS 25.07 0.00 0.00 25.07
METALAluminum Cans 2.56 5.55 0.00 8.11Ferrous, Magnetic 0.00 3,152.50 237.00 3,389.50Non-Ferrous, Non-magnetic 0.00 14.00 1.00 15.00Steel Cans 0.00 0.00 0.00 0.00Mixed Scrap Metal 45.95 336.10 0.00 382.05TOTAL METAL 48.51 3,508.15 238.00 3,794.66
PAPERCardboard 262.44 9,185.37 0.00 9,447.81Magazines 0.00 0.00 0.00 0.00Newspaper and Inserts 126.23 61.00 0.00 187.23Office Paper 2.00 101.82 0.00 103.82Paperboard 0.00 0.00 0.00 0.00Phone Books 0.00 0.00 0.00 0.00Mixed Paper 40.81 94.40 0.00 135.21TOTAL PAPER 431.48 9,442.59 0.00 9,874.07
PLASTICHDPE 0.00 0.34 0.00 0.34LDPE 0.00 0.00 0.00 0.00PET 0.00 0.30 0.00 0.30PP 0.00 0.00 0.00 0.00PS 0.00 0.00 0.00 0.00Vinyl 0.00 0.00 0.00 0.00Commingled PET and HDPE 5.92 0.35 0.00 6.27Mixed Plastic 14.50 1,014.47 0.00 1,028.97TOTAL PLASTIC 20.42 1,015.46 0.00 1,035.88
BANNED ITEMSAppliances 0.00 0.00 0.00 0.00Electronics 170.97 14.35 0.00 185.32Lead-acid Batteries (automobiles, trucks, motorcycles – small sealed lead-acid batteries) 162.76 158.33 0.00 321.09
Tires (automobiles, trucks, motorcycles) 426.08 0.20 0.00 426.28Used Motor Oil (automobiles, trucks, motorcycles) 31.99 –– –– 31.99
Yard Trimmings 0.00 1.00 0.00 1.00TOTAL BANNED ITEMS 791.80 173.88 0.00 965.68
MISCELLANEOUS ITEMSAntifreeze 0.00 0.00 0.00 0.00Cooking Oil/Grease 0.00 7.49 0.00 7.49Fluorescent Bulbs 0.00 1.15 0.00 1.15Food Scraps 0.00 7.70 0.00 7.70Household Hazardous Materials 0.00 0.00 0.00 0.00Inkjet/Toner Cartridges 0.00 0.00 0.00 0.00Mattresses 0.00 0.00 0.00 0.00Paint 0.00 0.00 0.00 0.00Rechargeable Batteries 0.00 0.00 0.00 0.00Textiles (recycled – not donated for reuse) 0.00 0.00 0.00 0.00Used Motor Oil Filters 0.00 0.00 0.00 0.00Wood Packaging (pallets, crates, barrels) 0.00 33.30 0.00 33.30Other Items 0.00 94.92 0.00 94.92TOTAL MISCELLANEOUS ITEMS 0.00 144.56 0.00 144.56
COMMINGLED RECYCLABLESTOTAL COMMINGLED RECYCLABLES 0.00 15.07 0.00 15.07TOTAL FOR ALL 1,317.28 14,299.71 238.00 15,855.00

South Carolina Solid Waste Management Annual Report for Fiscal Year 2013 71
LEE COUNTY
TABLE 8.65: Lee County MSW Summary
POPULATION DROP-OFF CENTERS
CURBSIDE PROGRAMS
RECYCLING RATE (PERCENT)
RECYCLED (P/P/D)
RECYCLED (TONS)
DISPOSED (P/P/D)
DISPOSED (TONS)
18,654 9 0 24.8 0.82 2,790.24 2.5 8,449
TABLE 8.66: Lee County MSW Recycling Data in Tons
COMMODITY RESIDENTIAL COMMERCIAL/INSTITUTIONAL
INDUSTRIAL(OFFICE/PACKAGING) TOTAL
GLASSContainers & Packaging - Brown 0.00 0.00 0.00 0.00Containers & Packaging - Clear 0.00 0.00 0.00 0.00Containers & Packaging - Green 0.00 0.00 0.00 0.00Containers & Packaging - Mixed 0.00 0.00 0.00 0.00TOTAL GLASS 0.00 0.00 0.00 0.00
METALAluminum Cans 3.30 0.00 0.00 3.30Ferrous, Magnetic 0.00 0.00 0.00 0.00Non-Ferrous, Non-magnetic 0.00 0.00 0.00 0.00Steel Cans 4.90 0.00 0.00 4.90Mixed Scrap Metal 188.70 0.00 0.00 188.70TOTAL METAL 196.90 0.00 0.00 196.90
PAPERCardboard 0.00 0.00 0.00 0.00Magazines 0.00 0.00 0.00 0.00Newspaper and Inserts 0.00 0.00 0.00 0.00Office Paper 0.00 0.00 0.00 0.00Paperboard 0.00 0.00 0.00 0.00Phone Books 0.00 0.00 0.00 0.00Mixed Paper 18.40 0.00 0.00 18.40TOTAL PAPER 18.40 0.00 0.00 18.40
PLASTICHDPE 0.00 0.00 0.00 0.00LDPE 0.00 0.00 0.00 0.00PET 0.00 0.00 0.00 0.00PP 0.00 0.00 0.00 0.00PS 0.00 0.00 0.00 0.00Vinyl 0.00 0.00 0.00 0.00Commingled PET and HDPE 0.00 0.00 0.00 0.00Mixed Plastic 12.00 0.00 0.00 12.00TOTAL PLASTIC 12.00 0.00 0.00 12.00
BANNED ITEMSAppliances 0.00 0.00 0.00 0.00Electronics 28.63 0.00 0.00 28.63Lead-acid Batteries (automobiles, trucks, motorcycles – small sealed lead-acid batteries) 49.18 49.18 0.00 98.36
Tires (automobiles, trucks, motorcycles) 171.60 0.00 0.00 171.60Used Motor Oil (automobiles, trucks, motorcycles) 12.46 –– –– 12.46
Yard Trimmings 2,245.99 0.00 0.00 2,245.99TOTAL BANNED ITEMS 2,507.86 49.18 0.00 2,557.04
MISCELLANEOUS ITEMSAntifreeze 0.00 0.00 0.00 0.00Cooking Oil/Grease 0.00 0.00 0.00 0.00Fluorescent Bulbs 0.00 0.00 2.00 2.00Food Scraps 0.00 0.00 0.00 0.00Household Hazardous Materials 0.00 0.00 0.00 0.00Inkjet/Toner Cartridges 0.00 0.00 0.00 0.00Mattresses 0.00 0.00 0.00 0.00Paint 0.00 0.00 0.00 0.00Rechargeable Batteries 0.00 0.00 0.00 0.00Textiles (recycled – not donated for reuse) 0.00 0.00 0.00 0.00Used Motor Oil Filters 3.90 0.00 0.00 3.90Wood Packaging (pallets, crates, barrels) 0.00 0.00 0.00 0.00Other Items 0.00 0.00 0.00 0.00TOTAL MISCELLANEOUS ITEMS 3.90 0.00 2.00 5.90
COMMINGLED RECYCLABLESTOTAL COMMINGLED RECYCLABLES 0.00 0.00 0.00 0.00TOTAL FOR ALL 2,739.06 49.18 2.00 2,790.24

72 South Carolina Solid Waste Management Annual Report for Fiscal Year 2013
LEXINGTON COUNTY
TABLE 8.67: Lexington County MSW Summary
POPULATION DROP-OFF CENTERS
CURBSIDE PROGRAMS
RECYCLING RATE (PERCENT)
RECYCLED (P/P/D)
RECYCLED (TONS)
DISPOSED (P/P/D)
DISPOSED (TONS)
270,406 11 7 38.9 1.81 89,298.50 2.8 140,151
TABLE 8.68: Lexington County MSW Recycling Data in Tons
COMMODITY RESIDENTIAL COMMERCIAL/INSTITUTIONAL
INDUSTRIAL(OFFICE/PACKAGING) TOTAL
GLASSContainers & Packaging - Brown 134.08 0.00 0.00 134.08Containers & Packaging - Clear 199.22 0.00 0.00 199.22Containers & Packaging - Green 97.48 0.00 0.00 97.48Containers & Packaging - Mixed 101.87 0.12 0.00 101.99TOTAL GLASS 532.65 0.12 0.00 532.77
METALAluminum Cans 36.83 153.37 1.62 191.82Ferrous, Magnetic 0.00 28,302.14 90.41 28,392.55Non-Ferrous, Non-magnetic 0.00 1,870.00 0.00 1,870.00Steel Cans 6.02 61.68 0.00 67.70Mixed Scrap Metal 534.17 2,242.77 572.86 3,349.80TOTAL METAL 577.02 32,629.95 664.89 33,871.86
PAPERCardboard 779.44 10,323.86 1,843.52 12,946.82Magazines 0.00 53.01 0.20 53.21Newspaper and Inserts 929.56 7.06 4.00 940.62Office Paper 78.23 2,635.22 214.19 2,927.64Paperboard 0.00 0.26 0.05 0.31Phone Books 0.00 0.53 0.00 0.53Mixed Paper 0.00 238.54 760.73 999.27TOTAL PAPER 1,787.23 13,258.48 2,822.69 17,868.40
PLASTICHDPE 38.01 36.58 0.00 74.59LDPE 0.00 0.00 0.00 0.00PET 0.00 1.27 0.00 1.27PP 0.00 14.88 0.00 14.88PS 0.00 0.00 0.00 0.00Vinyl 0.00 0.10 0.00 0.10Commingled PET and HDPE 218.41 9.89 0.00 228.30Mixed Plastic 7.23 55.88 174.08 237.19TOTAL PLASTIC 263.65 118.60 174.08 556.33
BANNED ITEMSAppliances 1,246.45 0.15 0.00 1,246.60Electronics 305.77 58.86 8.02 372.65Lead-acid Batteries (automobiles, trucks, motorcycles – small sealed lead-acid batteries) 669.31 802.20 5.73 1,477.24
Tires (automobiles, trucks, motorcycles) 1,543.37 95.81 6.89 1,646.07Used Motor Oil (automobiles, trucks, motorcycles) 258.12 –– –– 258.12
Yard Trimmings 4,909.35 12,108.00 0.00 17,017.35TOTAL BANNED ITEMS 8,932.37 13,065.01 20.64 22,018.02
MISCELLANEOUS ITEMSAntifreeze 0.00 11.68 1.00 12.68Cooking Oil/Grease 0.00 7.54 1,694.00 1,701.54Fluorescent Bulbs 0.00 28.97 0.39 29.36Food Scraps 0.00 2.00 3,647.00 3,649.00Household Hazardous Materials 0.00 0.00 0.00 0.00Inkjet/Toner Cartridges 0.00 7.51 2.46 9.97Mattresses 94.02 0.00 0.00 94.02Paint 0.00 0.50 0.00 0.50Rechargeable Batteries 0.00 0.48 0.00 0.48Textiles (recycled – not donated for reuse) 37.86 0.00 34.00 71.86Used Motor Oil Filters 56.20 41.04 1.50 98.74Wood Packaging (pallets, crates, barrels) 0.00 199.86 2,252.20 2,452.06Other Items 104.76 178.56 22.02 305.34TOTAL MISCELLANEOUS ITEMS 292.84 478.13 7,654.57 8,425.54
COMMINGLED RECYCLABLESTOTAL COMMINGLED RECYCLABLES 5,429.48 596.09 0.00 6,025.57TOTAL FOR ALL 17,815.24 60,146.39 11,336.87 89,298.50

South Carolina Solid Waste Management Annual Report for Fiscal Year 2013 73
MARION COUNTY
TABLE 8.69: Marion County MSW Summary
POPULATION DROP-OFF CENTERS
CURBSIDE PROGRAMS
RECYCLING RATE (PERCENT)
RECYCLED (P/P/D)
RECYCLED (TONS)
DISPOSED (P/P/D)
DISPOSED (TONS)
32,457 4 0 23.3 0.81 4,813.04 2.7 15,834
TABLE 8.70: Marion County MSW Recycling Data in Tons
COMMODITY RESIDENTIAL COMMERCIAL/INSTITUTIONAL
INDUSTRIAL(OFFICE/PACKAGING) TOTAL
GLASSContainers & Packaging - Brown 0.00 0.00 0.00 0.00Containers & Packaging - Clear 0.00 0.00 0.00 0.00Containers & Packaging - Green 0.00 0.00 0.00 0.00Containers & Packaging - Mixed 0.00 0.00 0.00 0.00TOTAL GLASS 0.00 0.00 0.00 0.00
METALAluminum Cans 0.00 0.00 0.00 0.00Ferrous, Magnetic 0.00 2,494.45 0.00 2,494.45Non-Ferrous, Non-magnetic 0.00 300.05 0.00 300.05Steel Cans 0.00 0.00 0.00 0.00Mixed Scrap Metal 30.02 0.00 0.00 30.02TOTAL METAL 30.02 2,794.50 0.00 2,824.52
PAPERCardboard 21.60 418.19 714.71 1,154.50Magazines 0.00 0.00 0.00 0.00Newspaper and Inserts 0.00 0.00 0.00 0.00Office Paper 0.00 0.00 0.00 0.00Paperboard 0.00 0.00 0.00 0.00Phone Books 0.00 0.00 0.00 0.00Mixed Paper 0.00 0.00 0.00 0.00TOTAL PAPER 21.60 418.19 714.71 1,154.50
PLASTICHDPE 0.00 0.00 0.00 0.00LDPE 0.00 0.00 0.00 0.00PET 0.00 0.00 0.00 0.00PP 0.00 0.00 0.00 0.00PS 0.00 0.00 0.00 0.00Vinyl 0.00 0.00 0.00 0.00Commingled PET and HDPE 0.00 0.00 0.00 0.00Mixed Plastic 0.00 0.00 27.34 27.34TOTAL PLASTIC 0.00 0.00 27.34 27.34
BANNED ITEMSAppliances 0.00 0.00 0.00 0.00Electronics 13.99 5.60 0.00 19.58Lead-acid Batteries (automobiles, trucks, motorcycles – small sealed lead-acid batteries) 78.62 115.62 0.00 194.24
Tires (automobiles, trucks, motorcycles) 303.79 264.67 0.00 568.46Used Motor Oil (automobiles, trucks, motorcycles) 9.53 –– –– 9.53
Yard Trimmings 0.00 0.00 0.00 0.00TOTAL BANNED ITEMS 405.93 385.89 0.00 791.82
MISCELLANEOUS ITEMSAntifreeze 0.00 2.16 0.00 2.16Cooking Oil/Grease 0.00 0.00 0.00 0.00Fluorescent Bulbs 0.00 0.00 0.00 0.00Food Scraps 0.00 0.00 0.00 0.00Household Hazardous Materials 0.00 0.00 0.00 0.00Inkjet/Toner Cartridges 0.00 0.00 0.00 0.00Mattresses 0.00 0.00 0.00 0.00Paint 0.00 0.00 0.00 0.00Rechargeable Batteries 0.00 0.00 0.00 0.00Textiles (recycled – not donated for reuse) 0.00 0.00 0.00 0.00Used Motor Oil Filters 0.25 4.75 0.00 5.00Wood Packaging (pallets, crates, barrels) 0.00 0.00 0.00 0.00Other Items 0.00 0.00 0.00 0.00TOTAL MISCELLANEOUS ITEMS 0.25 6.91 0.00 7.16
COMMINGLED RECYCLABLESTOTAL COMMINGLED RECYCLABLES 7.70 0.00 0.00 7.70TOTAL FOR ALL 465.50 3,605.49 742.05 4,813.04
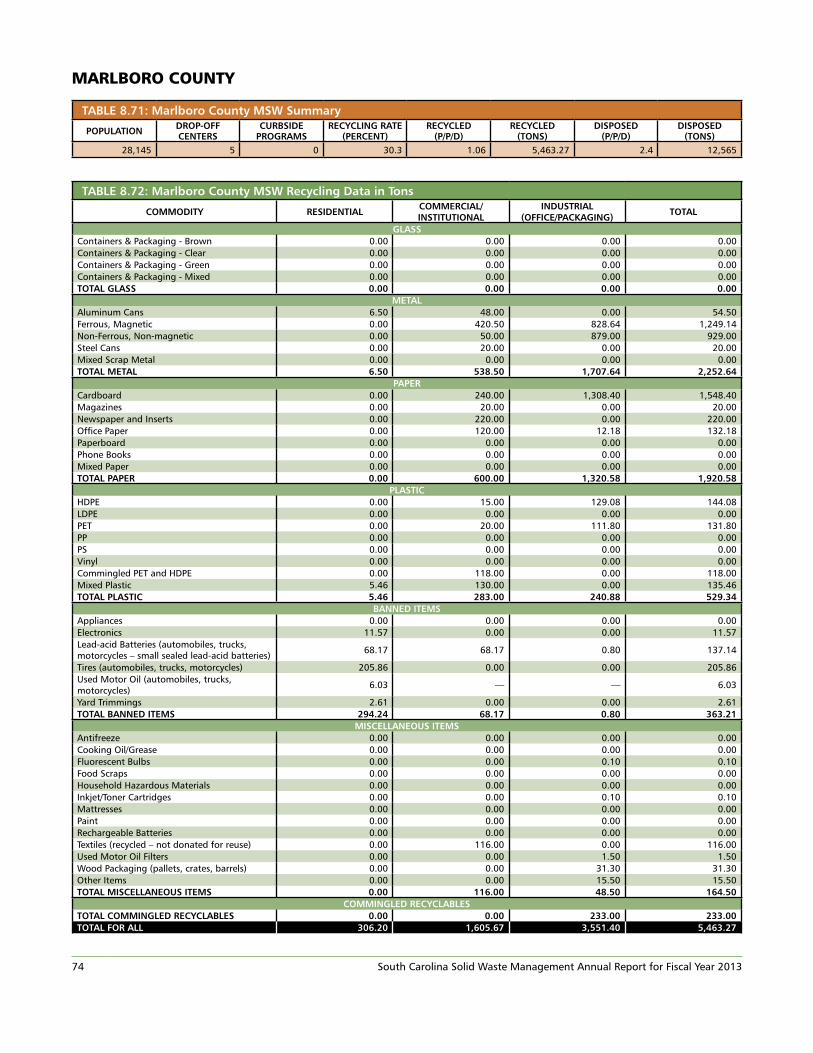
74 South Carolina Solid Waste Management Annual Report for Fiscal Year 2013
MARLBORO COUNTY
TABLE 8.71: Marlboro County MSW Summary
POPULATION DROP-OFF CENTERS
CURBSIDE PROGRAMS
RECYCLING RATE (PERCENT)
RECYCLED (P/P/D)
RECYCLED (TONS)
DISPOSED (P/P/D)
DISPOSED (TONS)
28,145 5 0 30.3 1.06 5,463.27 2.4 12,565
TABLE 8.72: Marlboro County MSW Recycling Data in Tons
COMMODITY RESIDENTIAL COMMERCIAL/INSTITUTIONAL
INDUSTRIAL(OFFICE/PACKAGING) TOTAL
GLASSContainers & Packaging - Brown 0.00 0.00 0.00 0.00Containers & Packaging - Clear 0.00 0.00 0.00 0.00Containers & Packaging - Green 0.00 0.00 0.00 0.00Containers & Packaging - Mixed 0.00 0.00 0.00 0.00TOTAL GLASS 0.00 0.00 0.00 0.00
METALAluminum Cans 6.50 48.00 0.00 54.50Ferrous, Magnetic 0.00 420.50 828.64 1,249.14Non-Ferrous, Non-magnetic 0.00 50.00 879.00 929.00Steel Cans 0.00 20.00 0.00 20.00Mixed Scrap Metal 0.00 0.00 0.00 0.00TOTAL METAL 6.50 538.50 1,707.64 2,252.64
PAPERCardboard 0.00 240.00 1,308.40 1,548.40Magazines 0.00 20.00 0.00 20.00Newspaper and Inserts 0.00 220.00 0.00 220.00Office Paper 0.00 120.00 12.18 132.18Paperboard 0.00 0.00 0.00 0.00Phone Books 0.00 0.00 0.00 0.00Mixed Paper 0.00 0.00 0.00 0.00TOTAL PAPER 0.00 600.00 1,320.58 1,920.58
PLASTICHDPE 0.00 15.00 129.08 144.08LDPE 0.00 0.00 0.00 0.00PET 0.00 20.00 111.80 131.80PP 0.00 0.00 0.00 0.00PS 0.00 0.00 0.00 0.00Vinyl 0.00 0.00 0.00 0.00Commingled PET and HDPE 0.00 118.00 0.00 118.00Mixed Plastic 5.46 130.00 0.00 135.46TOTAL PLASTIC 5.46 283.00 240.88 529.34
BANNED ITEMSAppliances 0.00 0.00 0.00 0.00Electronics 11.57 0.00 0.00 11.57Lead-acid Batteries (automobiles, trucks, motorcycles – small sealed lead-acid batteries) 68.17 68.17 0.80 137.14
Tires (automobiles, trucks, motorcycles) 205.86 0.00 0.00 205.86Used Motor Oil (automobiles, trucks, motorcycles) 6.03 –– –– 6.03
Yard Trimmings 2.61 0.00 0.00 2.61TOTAL BANNED ITEMS 294.24 68.17 0.80 363.21
MISCELLANEOUS ITEMSAntifreeze 0.00 0.00 0.00 0.00Cooking Oil/Grease 0.00 0.00 0.00 0.00Fluorescent Bulbs 0.00 0.00 0.10 0.10Food Scraps 0.00 0.00 0.00 0.00Household Hazardous Materials 0.00 0.00 0.00 0.00Inkjet/Toner Cartridges 0.00 0.00 0.10 0.10Mattresses 0.00 0.00 0.00 0.00Paint 0.00 0.00 0.00 0.00Rechargeable Batteries 0.00 0.00 0.00 0.00Textiles (recycled – not donated for reuse) 0.00 116.00 0.00 116.00Used Motor Oil Filters 0.00 0.00 1.50 1.50Wood Packaging (pallets, crates, barrels) 0.00 0.00 31.30 31.30Other Items 0.00 0.00 15.50 15.50TOTAL MISCELLANEOUS ITEMS 0.00 116.00 48.50 164.50
COMMINGLED RECYCLABLESTOTAL COMMINGLED RECYCLABLES 0.00 0.00 233.00 233.00TOTAL FOR ALL 306.20 1,605.67 3,551.40 5,463.27

South Carolina Solid Waste Management Annual Report for Fiscal Year 2013 75
McCORMICK COUNTY
TABLE 8.73: McCormick County MSW Summary
POPULATION DROP-OFF CENTERS
CURBSIDE PROGRAMS
RECYCLING RATE (PERCENT)
RECYCLED (P/P/D)
RECYCLED (TONS)
DISPOSED (P/P/D)
DISPOSED (TONS)
9,943 4 0 7.9 0.18 324.59 2.1 3,772
TABLE 8.74: McCormick County MSW Recycling Data in Tons
COMMODITY RESIDENTIAL COMMERCIAL/INSTITUTIONAL
INDUSTRIAL(OFFICE/PACKAGING) TOTAL
GLASSContainers & Packaging - Brown 0.00 0.00 0.00 0.00Containers & Packaging - Clear 0.00 0.00 0.00 0.00Containers & Packaging - Green 0.00 0.00 0.00 0.00Containers & Packaging - Mixed 0.00 0.00 0.00 0.00TOTAL GLASS 0.00 0.00 0.00 0.00
METALAluminum Cans 1.79 0.00 0.00 1.79Ferrous, Magnetic 0.00 0.00 0.00 0.00Non-Ferrous, Non-magnetic 0.00 0.00 0.00 0.00Steel Cans 0.00 0.00 0.00 0.00Mixed Scrap Metal 48.62 0.00 0.00 48.62TOTAL METAL 50.41 0.00 0.00 50.41
PAPERCardboard 47.43 0.00 0.00 47.43Magazines 0.00 0.00 0.00 0.00Newspaper and Inserts 23.99 0.00 0.00 23.99Office Paper 0.00 0.00 0.00 0.00Paperboard 0.00 0.00 0.00 0.00Phone Books 0.00 0.00 0.00 0.00Mixed Paper 38.30 0.00 0.00 38.30TOTAL PAPER 109.72 0.00 0.00 109.72
PLASTICHDPE 0.00 0.00 0.00 0.00LDPE 0.00 0.00 0.00 0.00PET 0.00 0.00 0.00 0.00PP 0.00 0.00 0.00 0.00PS 0.00 0.00 0.00 0.00Vinyl 0.00 0.00 0.00 0.00Commingled PET and HDPE 0.00 0.00 0.00 0.00Mixed Plastic 4.45 0.00 0.00 4.45TOTAL PLASTIC 4.45 0.00 0.00 4.45
BANNED ITEMSAppliances 12.15 0.00 0.00 12.15Electronics 34.92 0.25 0.00 35.17Lead-acid Batteries (automobiles, trucks, motorcycles – small sealed lead-acid batteries) 24.38 23.00 0.00 47.38
Tires (automobiles, trucks, motorcycles) 57.12 0.00 0.00 57.12Used Motor Oil (automobiles, trucks, motorcycles) 8.19 –– –– 8.19
Yard Trimmings 0.00 0.00 0.00 0.00TOTAL BANNED ITEMS 136.76 23.25 0.00 160.01
MISCELLANEOUS ITEMSAntifreeze 0.00 0.00 0.00 0.00Cooking Oil/Grease 0.00 0.00 0.00 0.00Fluorescent Bulbs 0.00 0.00 0.00 0.00Food Scraps 0.00 0.00 0.00 0.00Household Hazardous Materials 0.00 0.00 0.00 0.00Inkjet/Toner Cartridges 0.00 0.00 0.00 0.00Mattresses 0.00 0.00 0.00 0.00Paint 0.00 0.00 0.00 0.00Rechargeable Batteries 0.00 0.00 0.00 0.00Textiles (recycled – not donated for reuse) 0.00 0.00 0.00 0.00Used Motor Oil Filters 0.00 0.00 0.00 0.00Wood Packaging (pallets, crates, barrels) 0.00 0.00 0.00 0.00Other Items 0.00 0.00 0.00 0.00TOTAL MISCELLANEOUS ITEMS 0.00 0.00 0.00 0.00
COMMINGLED RECYCLABLESTOTAL COMMINGLED RECYCLABLES 0.00 0.00 0.00 0.00TOTAL FOR ALL 301.34 23.25 0.00 324.59
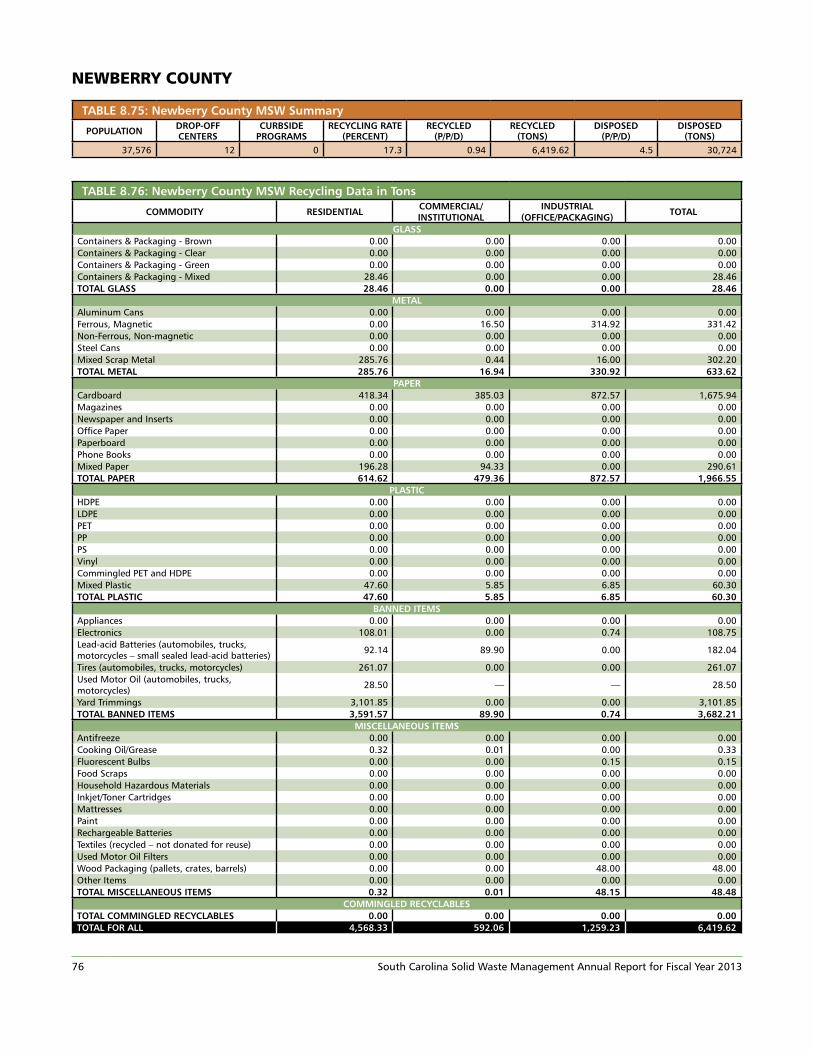
76 South Carolina Solid Waste Management Annual Report for Fiscal Year 2013
NEWBERRY COUNTY
TABLE 8.75: Newberry County MSW Summary
POPULATION DROP-OFF CENTERS
CURBSIDE PROGRAMS
RECYCLING RATE (PERCENT)
RECYCLED (P/P/D)
RECYCLED (TONS)
DISPOSED (P/P/D)
DISPOSED (TONS)
37,576 12 0 17.3 0.94 6,419.62 4.5 30,724
TABLE 8.76: Newberry County MSW Recycling Data in Tons
COMMODITY RESIDENTIAL COMMERCIAL/INSTITUTIONAL
INDUSTRIAL(OFFICE/PACKAGING) TOTAL
GLASSContainers & Packaging - Brown 0.00 0.00 0.00 0.00Containers & Packaging - Clear 0.00 0.00 0.00 0.00Containers & Packaging - Green 0.00 0.00 0.00 0.00Containers & Packaging - Mixed 28.46 0.00 0.00 28.46TOTAL GLASS 28.46 0.00 0.00 28.46
METALAluminum Cans 0.00 0.00 0.00 0.00Ferrous, Magnetic 0.00 16.50 314.92 331.42Non-Ferrous, Non-magnetic 0.00 0.00 0.00 0.00Steel Cans 0.00 0.00 0.00 0.00Mixed Scrap Metal 285.76 0.44 16.00 302.20TOTAL METAL 285.76 16.94 330.92 633.62
PAPERCardboard 418.34 385.03 872.57 1,675.94Magazines 0.00 0.00 0.00 0.00Newspaper and Inserts 0.00 0.00 0.00 0.00Office Paper 0.00 0.00 0.00 0.00Paperboard 0.00 0.00 0.00 0.00Phone Books 0.00 0.00 0.00 0.00Mixed Paper 196.28 94.33 0.00 290.61TOTAL PAPER 614.62 479.36 872.57 1,966.55
PLASTICHDPE 0.00 0.00 0.00 0.00LDPE 0.00 0.00 0.00 0.00PET 0.00 0.00 0.00 0.00PP 0.00 0.00 0.00 0.00PS 0.00 0.00 0.00 0.00Vinyl 0.00 0.00 0.00 0.00Commingled PET and HDPE 0.00 0.00 0.00 0.00Mixed Plastic 47.60 5.85 6.85 60.30TOTAL PLASTIC 47.60 5.85 6.85 60.30
BANNED ITEMSAppliances 0.00 0.00 0.00 0.00Electronics 108.01 0.00 0.74 108.75Lead-acid Batteries (automobiles, trucks, motorcycles – small sealed lead-acid batteries) 92.14 89.90 0.00 182.04
Tires (automobiles, trucks, motorcycles) 261.07 0.00 0.00 261.07Used Motor Oil (automobiles, trucks, motorcycles) 28.50 –– –– 28.50
Yard Trimmings 3,101.85 0.00 0.00 3,101.85TOTAL BANNED ITEMS 3,591.57 89.90 0.74 3,682.21
MISCELLANEOUS ITEMSAntifreeze 0.00 0.00 0.00 0.00Cooking Oil/Grease 0.32 0.01 0.00 0.33Fluorescent Bulbs 0.00 0.00 0.15 0.15Food Scraps 0.00 0.00 0.00 0.00Household Hazardous Materials 0.00 0.00 0.00 0.00Inkjet/Toner Cartridges 0.00 0.00 0.00 0.00Mattresses 0.00 0.00 0.00 0.00Paint 0.00 0.00 0.00 0.00Rechargeable Batteries 0.00 0.00 0.00 0.00Textiles (recycled – not donated for reuse) 0.00 0.00 0.00 0.00Used Motor Oil Filters 0.00 0.00 0.00 0.00Wood Packaging (pallets, crates, barrels) 0.00 0.00 48.00 48.00Other Items 0.00 0.00 0.00 0.00TOTAL MISCELLANEOUS ITEMS 0.32 0.01 48.15 48.48
COMMINGLED RECYCLABLESTOTAL COMMINGLED RECYCLABLES 0.00 0.00 0.00 0.00TOTAL FOR ALL 4,568.33 592.06 1,259.23 6,419.62

South Carolina Solid Waste Management Annual Report for Fiscal Year 2013 77
OCONEE COUNTY
TABLE 8.77: Oconee County MSW Summary
POPULATION DROP-OFF CENTERS
CURBSIDE PROGRAMS
RECYCLING RATE (PERCENT)
RECYCLED (P/P/D)
RECYCLED (TONS)
DISPOSED (P/P/D)
DISPOSED (TONS)
74,627 17 3 40.2 1.98 26,928.10 2.9 40,128
TABLE 8.78: Oconee County MSW Recycling Data in Tons
COMMODITY RESIDENTIAL COMMERCIAL/INSTITUTIONAL
INDUSTRIAL(OFFICE/PACKAGING) TOTAL
GLASSContainers & Packaging - Brown 75.25 1.00 0.00 76.25Containers & Packaging - Clear 142.59 0.50 0.00 143.09Containers & Packaging - Green 121.08 0.00 0.00 121.08Containers & Packaging - Mixed 0.00 0.00 0.00 0.00TOTAL GLASS 338.92 1.50 0.00 340.42
METALAluminum Cans 17.00 0.25 1.65 18.90Ferrous, Magnetic 0.00 0.00 248.79 248.79Non-Ferrous, Non-magnetic 0.00 0.00 0.00 0.00Steel Cans 0.50 0.00 11.38 11.88Mixed Scrap Metal 63.20 0.00 13,150.31 13,213.51TOTAL METAL 80.70 0.25 13,412.13 13,493.08
PAPERCardboard 1,101.90 2,014.24 711.81 3,827.95Magazines 0.00 0.25 0.50 0.75Newspaper and Inserts 178.54 0.25 1.10 179.89Office Paper 0.00 33.77 137.56 171.33Paperboard 0.00 0.00 0.00 0.00Phone Books 0.00 0.00 0.00 0.00Mixed Paper 549.38 0.00 22.14 571.52TOTAL PAPER 1,829.82 2,048.51 873.12 4,751.45
PLASTICHDPE 0.00 2.00 0.26 2.26LDPE 0.00 0.00 13.19 13.19PET 0.00 0.00 19.40 19.40PP 0.00 0.00 0.00 0.00PS 0.00 0.00 0.00 0.00Vinyl 0.00 0.00 0.00 0.00Commingled PET and HDPE 92.22 0.00 0.00 92.22Mixed Plastic 1.60 0.25 9.25 11.10TOTAL PLASTIC 93.82 2.25 42.10 138.17
BANNED ITEMSAppliances 460.08 0.00 0.00 460.08Electronics 0.00 0.00 2.50 2.50Lead-acid Batteries (automobiles, trucks, motorcycles – small sealed lead-acid batteries) 217.75 353.23 5.69 576.67
Tires (automobiles, trucks, motorcycles) 649.30 39.50 0.00 688.80Used Motor Oil (automobiles, trucks, motorcycles) 55.68 –– –– 55.68
Yard Trimmings 2,814.32 0.00 0.00 2,814.32TOTAL BANNED ITEMS 4,197.13 392.73 8.19 4,598.05
MISCELLANEOUS ITEMSAntifreeze 0.00 14.00 2.57 16.57Cooking Oil/Grease 3.42 1,783.50 0.00 1,786.92Fluorescent Bulbs 0.00 0.00 3.86 3.86Food Scraps 0.00 0.00 0.00 0.00Household Hazardous Materials 0.00 0.00 0.00 0.00Inkjet/Toner Cartridges 0.00 0.00 0.15 0.15Mattresses 0.00 0.00 0.00 0.00Paint 0.00 0.00 81.97 81.97Rechargeable Batteries 0.70 0.00 0.56 1.26Textiles (recycled – not donated for reuse) 131.00 0.00 0.00 131.00Used Motor Oil Filters 14.73 2.00 1.68 18.41Wood Packaging (pallets, crates, barrels) 0.00 0.00 1,294.99 1,294.99Other Items 236.60 15.00 20.20 271.80TOTAL MISCELLANEOUS ITEMS 386.45 1,814.50 1,405.98 3,606.93
COMMINGLED RECYCLABLESTOTAL COMMINGLED RECYCLABLES 0.00 0.00 0.00 0.00TOTAL FOR ALL 6,926.84 4,259.74 15,741.52 26,928.10

78 South Carolina Solid Waste Management Annual Report for Fiscal Year 2013
ORANGEBURG COUNTY
TABLE 8.79: Orangeburg County MSW Summary
POPULATION DROP-OFF CENTERS
CURBSIDE PROGRAMS
RECYCLING RATE (PERCENT)
RECYCLED (P/P/D)
RECYCLED (TONS)
DISPOSED (P/P/D)
DISPOSED (TONS)
91,476 21 1 33.7 1.62 27,125.59 3.2 53,328
TABLE 8.80: Orangeburg County MSW Recycling Data in Tons
COMMODITY RESIDENTIAL COMMERCIAL/INSTITUTIONAL
INDUSTRIAL(OFFICE/PACKAGING) TOTAL
GLASSContainers & Packaging - Brown 3.76 0.00 0.00 3.76Containers & Packaging - Clear 6.03 0.00 0.00 6.03Containers & Packaging - Green 3.59 0.00 0.00 3.59Containers & Packaging - Mixed 16.92 0.00 0.00 16.92TOTAL GLASS 30.30 0.00 0.00 30.30
METALAluminum Cans 3.04 243.25 1.26 247.55Ferrous, Magnetic 0.00 15,314.10 546.52 15,860.62Non-Ferrous, Non-magnetic 0.00 15.00 1.00 16.00Steel Cans 1.18 0.00 0.00 1.18Mixed Scrap Metal 290.61 1,267.50 93.74 1,651.85TOTAL METAL 294.83 16,839.85 642.52 17,777.20
PAPERCardboard 323.13 895.09 1,920.09 3,138.31Magazines 0.00 0.00 0.01 0.01Newspaper and Inserts 128.67 0.00 0.11 128.78Office Paper 3.72 56.05 29.80 89.57Paperboard 0.00 1.00 0.00 1.00Phone Books 0.00 0.00 0.01 0.01Mixed Paper 0.00 0.00 0.20 0.20TOTAL PAPER 455.52 952.14 1,950.22 3,357.88
PLASTICHDPE 34.85 0.00 0.00 34.85LDPE 0.00 0.00 0.00 0.00PET 0.00 0.00 0.00 0.00PP 0.00 0.00 0.00 0.00PS 0.00 0.00 0.00 0.00Vinyl 0.00 0.00 0.00 0.00Commingled PET and HDPE 0.49 0.00 0.00 0.49Mixed Plastic 0.00 10.00 9.95 19.95TOTAL PLASTIC 35.34 10.00 9.95 55.29
BANNED ITEMSAppliances 0.00 15.00 0.00 15.00Electronics 152.32 24.11 5.87 182.30Lead-acid Batteries (automobiles, trucks, motorcycles – small sealed lead-acid batteries) 222.19 250.84 7.80 480.83
Tires (automobiles, trucks, motorcycles) 663.52 40.26 0.00 703.78Used Motor Oil (automobiles, trucks, motorcycles) 47.70 –– –– 47.70
Yard Trimmings 0.00 0.00 0.00 0.00TOTAL BANNED ITEMS 1,085.73 330.21 13.67 1,429.61
MISCELLANEOUS ITEMSAntifreeze 0.00 0.00 0.00 0.00Cooking Oil/Grease 18.57 354.05 0.00 372.62Fluorescent Bulbs 0.00 0.04 2.75 2.79Food Scraps 0.00 583.66 0.00 583.66Household Hazardous Materials 0.00 0.00 0.00 0.00Inkjet/Toner Cartridges 0.00 0.00 0.26 0.26Mattresses 0.00 0.00 0.00 0.00Paint 5.45 0.00 0.00 5.45Rechargeable Batteries 0.00 0.00 0.45 0.45Textiles (recycled – not donated for reuse) 0.00 0.00 0.00 0.00Used Motor Oil Filters 3.05 1.58 0.00 4.63Wood Packaging (pallets, crates, barrels) 5.71 678.24 387.50 1,071.45Other Items 0.00 0.00 1.00 1.00TOTAL MISCELLANEOUS ITEMS 32.78 1,617.57 391.96 2,042.31
COMMINGLED RECYCLABLESTOTAL COMMINGLED RECYCLABLES 0.00 0.00 2,433.00 2,433.00TOTAL FOR ALL 1,934.50 19,749.77 5,441.32 27,125.59

South Carolina Solid Waste Management Annual Report for Fiscal Year 2013 79
PICKENS COUNTY
TABLE 8.81: Pickens County MSW Summary
POPULATION DROP-OFF CENTERS
CURBSIDE PROGRAMS
RECYCLING RATE (PERCENT)
RECYCLED (P/P/D)
RECYCLED (TONS)
DISPOSED (P/P/D)
DISPOSED (TONS)
119,670 37 8 37.2 1.15 25,220.80 2.0 42,606
TABLE 8.82: Pickens County MSW Recycling Data in Tons
COMMODITY RESIDENTIAL COMMERCIAL/INSTITUTIONAL
INDUSTRIAL(OFFICE/PACKAGING) TOTAL
GLASSContainers & Packaging - Brown 144.44 0.00 0.00 144.44Containers & Packaging - Clear 238.72 0.00 0.00 238.72Containers & Packaging - Green 106.28 0.00 0.00 106.28Containers & Packaging - Mixed 0.00 42.10 0.00 42.10TOTAL GLASS 489.44 42.10 0.00 531.54
METALAluminum Cans 119.54 10.30 2.55 132.39Ferrous, Magnetic 0.00 157.36 6.50 163.86Non-Ferrous, Non-magnetic 0.00 33.00 0.00 33.00Steel Cans 0.00 3.13 0.00 3.13Mixed Scrap Metal 36.27 149.98 567.00 753.25TOTAL METAL 155.81 353.77 576.05 1,085.63
PAPERCardboard 2,096.31 4,569.01 68.01 6,733.33Magazines 4.80 0.50 0.00 5.30Newspaper and Inserts 0.00 0.50 0.00 0.50Office Paper 27.16 748.48 12.25 787.89Paperboard 0.00 0.50 0.00 0.50Phone Books 0.00 0.00 0.00 0.00Mixed Paper 1,862.48 462.24 21.00 2,345.72TOTAL PAPER 3,990.75 5,781.23 101.26 9,873.24
PLASTICHDPE 61.28 2.00 0.90 64.18LDPE 0.00 0.00 0.00 0.00PET 43.80 2.00 0.00 45.80PP 0.00 0.00 0.00 0.00PS 0.00 0.00 0.00 0.00Vinyl 0.00 1.00 0.00 1.00Commingled PET and HDPE 0.00 0.00 0.00 0.00Mixed Plastic 62.74 164.64 0.80 228.18TOTAL PLASTIC 167.82 169.64 1.70 339.16
BANNED ITEMSAppliances 1,462.60 0.00 0.00 1,462.60Electronics 361.46 47.43 0.00 408.89Lead-acid Batteries (automobiles, trucks, motorcycles – small sealed lead-acid batteries) 306.07 275.97 0.25 582.29
Tires (automobiles, trucks, motorcycles) 970.87 0.00 2.00 972.87Used Motor Oil (automobiles, trucks, motorcycles) 118.62 –– –– 118.62
Yard Trimmings 6,855.97 506.48 0.00 7,362.45TOTAL BANNED ITEMS 10,075.59 829.88 2.25 10,907.72
MISCELLANEOUS ITEMSAntifreeze 6.42 0.00 0.00 6.42Cooking Oil/Grease 108.45 24.01 0.00 132.46Fluorescent Bulbs 0.25 12.78 0.25 13.28Food Scraps 0.00 0.00 0.00 0.00Household Hazardous Materials 0.00 0.00 0.00 0.00Inkjet/Toner Cartridges 0.25 7.27 0.00 7.52Mattresses 0.00 0.00 0.00 0.00Paint 22.14 0.00 0.00 22.14Rechargeable Batteries 0.25 0.01 0.00 0.26Textiles (recycled – not donated for reuse) 146.85 0.00 0.00 146.85Used Motor Oil Filters 9.24 0.00 0.00 9.24Wood Packaging (pallets, crates, barrels) 129.42 39.93 6.50 175.85Other Items 0.00 5.44 0.00 5.44TOTAL MISCELLANEOUS ITEMS 423.27 89.43 6.75 519.45
COMMINGLED RECYCLABLESTOTAL COMMINGLED RECYCLABLES 312.17 1,651.90 0.00 1,964.07TOTAL FOR ALL 15,614.85 8,917.94 688.01 25,220.80

80 South Carolina Solid Waste Management Annual Report for Fiscal Year 2013
RICHLAND COUNTY
TABLE 8.83: Richland County MSW Summary
POPULATION DROP-OFF CENTERS
CURBSIDE PROGRAMS
RECYCLING RATE (PERCENT)
RECYCLED (P/P/D)
RECYCLED (TONS)
DISPOSED (P/P/D)
DISPOSED (TONS)
393,830 10 5 22.5 1.06 76,466.61 3.7 263,456
TABLE 8.84: Richland County MSW Recycling Data in Tons
COMMODITY RESIDENTIAL COMMERCIAL/INSTITUTIONAL
INDUSTRIAL(OFFICE/PACKAGING) TOTAL
GLASSContainers & Packaging - Brown 24.00 0.94 0.00 24.94Containers & Packaging - Clear 62.00 1.68 0.00 63.68Containers & Packaging - Green 104.00 0.25 0.00 104.25Containers & Packaging - Mixed 154.00 121.78 0.00 275.78TOTAL GLASS 344.00 124.65 0.00 468.65
METALAluminum Cans 56.00 422.75 9.22 487.97Ferrous, Magnetic 0.00 21,243.82 2,692.94 23,936.76Non-Ferrous, Non-magnetic 0.00 368.00 5.00 373.00Steel Cans 0.00 160.55 60.37 220.92Mixed Scrap Metal 251.00 647.44 37.66 936.10TOTAL METAL 307.00 22,842.55 2,805.19 25,954.74
PAPERCardboard 837.00 10,616.56 111.48 11,565.04Magazines 0.00 27.57 0.37 27.94Newspaper and Inserts 475.00 1,245.29 1.29 1,721.58Office Paper 9.00 3,582.75 24.13 3,615.88Paperboard 0.00 2.00 0.00 2.00Phone Books 0.00 11.35 0.05 11.40Mixed Paper 98.00 922.56 0.00 1,020.56TOTAL PAPER 1,419.00 16,408.07 137.32 17,964.39
PLASTICHDPE 94.00 286.30 0.00 380.30LDPE 0.00 0.16 32.50 32.66PET 0.00 128.69 0.00 128.69PP 0.00 0.00 0.00 0.00PS 0.00 0.00 0.00 0.00Vinyl 0.00 0.60 0.00 0.60Commingled PET and HDPE 255.00 30.30 0.00 285.30Mixed Plastic 33.00 314.54 0.10 347.64TOTAL PLASTIC 382.00 760.58 32.60 1,175.18
BANNED ITEMSAppliances 25.00 539.79 0.16 564.95Electronics 324.00 1,988.66 1.85 2,314.51Lead-acid Batteries (automobiles, trucks, motorcycles – small sealed lead-acid batteries) 1,134.05 1,197.37 1.00 2,332.42
Tires (automobiles, trucks, motorcycles) 2,157.38 176.43 1.66 2,335.47Used Motor Oil (automobiles, trucks, motorcycles) 95.90 –– –– 95.90
Yard Trimmings 6,500.00 1,296.26 0.00 7,796.26TOTAL BANNED ITEMS 10,236.33 5,198.50 4.67 15,439.50
MISCELLANEOUS ITEMSAntifreeze 0.00 15.58 0.00 15.58Cooking Oil/Grease 0.00 21.99 0.00 21.99Fluorescent Bulbs 0.00 13.93 1.22 15.15Food Scraps 0.00 0.40 0.00 0.40Household Hazardous Materials 2,161.00 0.00 0.00 2,161.00Inkjet/Toner Cartridges 2.00 17.10 1.01 20.10Mattresses 37.10 0.00 0.00 37.10Paint 0.00 6.43 0.07 6.50Rechargeable Batteries 0.00 3.23 0.05 3.28Textiles (recycled – not donated for reuse) 0.00 60.37 0.00 60.37Used Motor Oil Filters 2.00 31.67 6.20 39.87Wood Packaging (pallets, crates, barrels) 3.00 303.11 637.50 943.61Other Items 0.00 52.84 24.00 76.84TOTAL MISCELLANEOUS ITEMS 2,205.10 526.23 670.04 3,401.37
COMMINGLED RECYCLABLESTOTAL COMMINGLED RECYCLABLES 11,934.00 128.78 0.00 12,062.78TOTAL FOR ALL 26,827.43 45,989.36 3,649.82 76,466.61

South Carolina Solid Waste Management Annual Report for Fiscal Year 2013 81
SALUDA COUNTY
TABLE 8.85: Saluda County MSW Summary
POPULATION DROP-OFF CENTERS
CURBSIDE PROGRAMS
RECYCLING RATE (PERCENT)
RECYCLED (P/P/D)
RECYCLED (TONS)
DISPOSED (P/P/D)
DISPOSED (TONS)
19,893 7 1 8.6 0.20 731.45 2.1 7,737
TABLE 8.86: Saluda County MSW Recycling Data in Tons
COMMODITY RESIDENTIAL COMMERCIAL/INSTITUTIONAL
INDUSTRIAL(OFFICE/PACKAGING) TOTAL
GLASSContainers & Packaging - Brown 0.00 0.00 0.00 0.00Containers & Packaging - Clear 0.00 0.00 0.00 0.00Containers & Packaging - Green 0.00 0.00 0.00 0.00Containers & Packaging - Mixed 0.00 0.00 0.00 0.00TOTAL GLASS 0.00 0.00 0.00 0.00
METALAluminum Cans 2.75 0.00 0.00 2.75Ferrous, Magnetic 0.00 0.00 0.00 0.00Non-Ferrous, Non-magnetic 0.00 0.00 0.00 0.00Steel Cans 0.00 0.00 0.00 0.00Mixed Scrap Metal 89.60 0.00 0.00 89.60TOTAL METAL 92.35 0.00 0.00 92.35
PAPERCardboard 56.29 0.00 0.00 56.29Magazines 0.00 0.00 0.00 0.00Newspaper and Inserts 63.20 0.00 0.00 63.20Office Paper 0.00 0.00 0.00 0.00Paperboard 0.00 0.00 0.00 0.00Phone Books 0.00 0.00 0.00 0.00Mixed Paper 73.01 0.00 0.00 73.01TOTAL PAPER 192.50 0.00 0.00 192.50
PLASTICHDPE 0.00 0.00 0.00 0.00LDPE 0.00 0.00 0.00 0.00PET 0.00 0.00 0.00 0.00PP 0.00 0.00 0.00 0.00PS 0.00 0.00 0.00 0.00Vinyl 0.00 0.00 0.00 0.00Commingled PET and HDPE 16.97 0.00 0.00 16.97Mixed Plastic 0.00 0.00 0.00 0.00TOTAL PLASTIC 16.97 0.00 0.00 16.97
BANNED ITEMSAppliances 22.40 0.00 0.00 22.40Electronics 58.68 4.36 0.00 63.04Lead-acid Batteries (automobiles, trucks, motorcycles – small sealed lead-acid batteries) 48.47 47.89 0.00 96.36
Tires (automobiles, trucks, motorcycles) 188.16 0.00 0.00 188.16Used Motor Oil (automobiles, trucks, motorcycles) 26.05 –– –– 26.05
Yard Trimmings 0.00 0.00 0.00 0.00TOTAL BANNED ITEMS 343.76 52.25 0.00 396.01
MISCELLANEOUS ITEMSAntifreeze 0.00 0.00 0.00 0.00Cooking Oil/Grease 0.00 0.00 0.00 0.00Fluorescent Bulbs 0.00 0.00 0.00 0.00Food Scraps 0.00 0.00 0.00 0.00Household Hazardous Materials 0.00 0.00 0.00 0.00Inkjet/Toner Cartridges 0.00 0.00 0.00 0.00Mattresses 0.00 0.00 0.00 0.00Paint 0.00 0.00 0.00 0.00Rechargeable Batteries 0.00 0.00 0.00 0.00Textiles (recycled – not donated for reuse) 0.00 0.00 0.00 0.00Used Motor Oil Filters 0.00 0.00 0.00 0.00Wood Packaging (pallets, crates, barrels) 0.00 0.00 0.00 0.00Other Items 0.00 0.00 0.00 0.00TOTAL MISCELLANEOUS ITEMS 0.00 0.00 0.00 0.00
COMMINGLED RECYCLABLESTOTAL COMMINGLED RECYCLABLES 33.62 0.00 0.00 33.62TOTAL FOR ALL 679.20 52.25 0.00 731.45

82 South Carolina Solid Waste Management Annual Report for Fiscal Year 2013
SPARTANBURG COUNTY
TABLE 8.87: Spartanburg County MSW Summary
POPULATION DROP-OFF CENTERS
CURBSIDE PROGRAMS
RECYCLING RATE (PERCENT)
RECYCLED (P/P/D)
RECYCLED (TONS)
DISPOSED (P/P/D)
DISPOSED (TONS)
288,745 22 2 31.7 1.69 89,299.90 3.7 192,507
TABLE 8.88: Spartanburg County MSW Recycling Data in Tons
COMMODITY RESIDENTIAL COMMERCIAL/INSTITUTIONAL
INDUSTRIAL(OFFICE/PACKAGING) TOTAL
GLASSContainers & Packaging - Brown 0.00 0.00 1.08 1.08Containers & Packaging - Clear 0.00 1.86 2.53 4.39Containers & Packaging - Green 0.00 0.00 0.00 0.00Containers & Packaging - Mixed 0.00 0.00 102.14 102.14TOTAL GLASS 0.00 1.86 105.75 107.61
METALAluminum Cans 0.00 6.35 0.43 6.78Ferrous, Magnetic 0.00 15,907.00 1,415.85 17,322.85Non-Ferrous, Non-magnetic 0.00 618.39 3.00 621.39Steel Cans 0.00 17.27 0.00 17.27Mixed Scrap Metal 841.17 2,828.18 20.84 3,690.19TOTAL METAL 841.17 19,377.19 1,440.12 21,658.48
PAPERCardboard 271.59 15,670.84 325.57 16,268.00Magazines 0.00 1.00 1.50 2.50Newspaper and Inserts 0.00 2.24 0.02 2.26Office Paper 0.00 288.94 26.05 314.99Paperboard 0.00 0.25 0.00 0.25Phone Books 0.00 0.26 0.06 0.31Mixed Paper 2,641.90 15,539.17 6,008.22 24,189.29TOTAL PAPER 2,913.49 31,502.69 6,361.41 40,777.59
PLASTICHDPE 0.00 11.51 0.00 11.51LDPE 0.00 216.84 0.00 216.84PET 0.00 20.40 0.43 20.83PP 0.00 0.00 0.00 0.00PS 0.00 0.00 0.00 0.00Vinyl 0.00 0.05 0.00 0.05Commingled PET and HDPE 0.00 0.00 0.00 0.00Mixed Plastic 0.00 1,538.21 2,391.55 3,929.76TOTAL PLASTIC 0.00 1,787.01 2,391.98 4,178.99
BANNED ITEMSAppliances 0.00 620.00 0.00 620.00Electronics 519.31 88.06 56.20 663.56Lead-acid Batteries (automobiles, trucks, motorcycles – small sealed lead-acid batteries) 711.46 840.56 12.37 1,564.39
Tires (automobiles, trucks, motorcycles) 2,113.06 0.05 0.00 2,113.11Used Motor Oil (automobiles, trucks, motorcycles) 148.93 –– –– 148.93
Yard Trimmings 4.25 78.56 40.00 122.81TOTAL BANNED ITEMS 3,497.01 1,627.22 108.57 5,232.80
MISCELLANEOUS ITEMSAntifreeze 10.12 0.29 1.69 12.10Cooking Oil/Grease 0.00 0.09 0.00 0.09Fluorescent Bulbs 0.40 4.52 6.09 11.01Food Scraps 0.00 0.00 0.00 0.00Household Hazardous Materials 12.15 0.00 0.00 12.15Inkjet/Toner Cartridges 0.00 0.26 0.34 0.60Mattresses 0.00 0.00 0.00 0.00Paint 8.81 0.02 31.70 40.53Rechargeable Batteries 0.00 1.49 1.31 2.80Textiles (recycled – not donated for reuse) 0.00 0.00 0.00 0.00Used Motor Oil Filters 8.22 0.00 0.00 8.22Wood Packaging (pallets, crates, barrels) 0.00 1,302.94 5,930.18 7,233.12Other Items 0.35 2.00 2,563.87 2,566.22TOTAL MISCELLANEOUS ITEMS 40.05 1,311.61 8,535.17 9,886.83
COMMINGLED RECYCLABLESTOTAL COMMINGLED RECYCLABLES 2,585.41 1,554.41 3,317.78 7,457.60TOTAL FOR ALL 9,877.13 57,161.99 22,260.78 89,299.90

South Carolina Solid Waste Management Annual Report for Fiscal Year 2013 83
SUMTER COUNTY
TABLE 8.89: Sumter County MSW Summary
POPULATION DROP-OFF CENTERS
CURBSIDE PROGRAMS
RECYCLING RATE (PERCENT)
RECYCLED (P/P/D)
RECYCLED (TONS)
DISPOSED (P/P/D)
DISPOSED (TONS)
108,052 9 1 20.5 0.72 14,277.24 2.8 55,220
TABLE 8.90: Sumter County MSW Recycling Data in Tons
COMMODITY RESIDENTIAL COMMERCIAL/INSTITUTIONAL
INDUSTRIAL(OFFICE/PACKAGING) TOTAL
GLASSContainers & Packaging - Brown 0.00 0.00 0.00 0.00Containers & Packaging - Clear 0.00 0.00 0.00 0.00Containers & Packaging - Green 0.00 0.00 0.00 0.00Containers & Packaging - Mixed 498.70 0.00 0.00 498.70TOTAL GLASS 498.70 0.00 0.00 498.70
METALAluminum Cans 12.10 0.30 0.30 12.70Ferrous, Magnetic 11.63 0.05 0.00 11.68Non-Ferrous, Non-magnetic 0.00 0.00 0.00 0.00Steel Cans 39.26 0.00 0.00 39.26Mixed Scrap Metal 4,165.30 0.20 0.00 4,165.50TOTAL METAL 4,228.29 0.55 0.30 4,229.14
PAPERCardboard 1,768.67 1.00 3.50 1,773.17Magazines 0.00 0.75 0.00 0.75Newspaper and Inserts 0.00 0.50 0.00 0.50Office Paper 0.00 0.85 64.17 65.02Paperboard 0.00 0.00 0.00 0.00Phone Books 0.02 0.05 0.00 0.07Mixed Paper 1,262.14 0.00 0.00 1,262.14TOTAL PAPER 3,030.83 3.15 67.67 3,101.65
PLASTICHDPE 29.54 0.00 0.00 29.54LDPE 0.00 0.00 0.00 0.00PET 0.00 0.30 0.00 0.30PP 0.00 0.00 0.00 0.00PS 0.00 0.00 0.00 0.00Vinyl 0.00 0.00 0.00 0.00Commingled PET and HDPE 9.34 0.00 0.00 9.34Mixed Plastic 113.69 0.10 0.00 113.79TOTAL PLASTIC 152.57 0.40 0.00 152.97
BANNED ITEMSAppliances 3,628.40 0.00 0.00 3,628.40Electronics 163.21 2.10 0.00 165.31Lead-acid Batteries (automobiles, trucks, motorcycles – small sealed lead-acid batteries) 312.92 210.57 0.00 523.49
Tires (automobiles, trucks, motorcycles) 893.64 0.00 0.00 893.64Used Motor Oil (automobiles, trucks, motorcycles) 54.10 –– –– 54.10
Yard Trimmings 955.81 0.00 0.00 955.81TOTAL BANNED ITEMS 6,008.08 212.67 0.00 6,220.75
MISCELLANEOUS ITEMSAntifreeze 2.40 0.00 0.00 2.40Cooking Oil/Grease 6.16 0.00 0.00 6.16Fluorescent Bulbs 2.99 0.50 0.00 3.49Food Scraps 0.00 0.00 0.00 0.00Household Hazardous Materials 0.00 0.00 0.00 0.00Inkjet/Toner Cartridges 0.78 0.05 0.00 0.83Mattresses 0.00 0.00 0.00 0.00Paint 0.00 0.00 0.00 0.00Rechargeable Batteries 0.00 0.00 0.00 0.00Textiles (recycled – not donated for reuse) 0.00 0.00 0.00 0.00Used Motor Oil Filters 12.34 0.00 0.00 12.34Wood Packaging (pallets, crates, barrels) 1.25 0.55 46.36 48.16Other Items 0.00 0.00 0.61 0.61TOTAL MISCELLANEOUS ITEMS 25.92 1.10 46.97 73.99
COMMINGLED RECYCLABLESTOTAL COMMINGLED RECYCLABLES 0.00 0.05 0.00 0.05TOTAL FOR ALL 13,944.39 217.92 114.93 14,277.24

84 South Carolina Solid Waste Management Annual Report for Fiscal Year 2013
UNION COUNTY
TABLE 8.91: Union County MSW Summary
POPULATION DROP-OFF CENTERS
CURBSIDE PROGRAMS
RECYCLING RATE (PERCENT)
RECYCLED (P/P/D)
RECYCLED (TONS)
DISPOSED (P/P/D)
DISPOSED (TONS)
28,252 10 0 29.8 1.40 7,213.56 3.3 16,990
TABLE 8.92: Union County MSW Recycling Data in Tons
COMMODITY RESIDENTIAL COMMERCIAL/INSTITUTIONAL
INDUSTRIAL(OFFICE/PACKAGING) TOTAL
GLASSContainers & Packaging - Brown 0.00 0.00 0.00 0.00Containers & Packaging - Clear 19.65 0.00 0.00 19.65Containers & Packaging - Green 0.00 0.00 0.00 0.00Containers & Packaging - Mixed 16.87 0.00 0.00 16.87TOTAL GLASS 36.52 0.00 0.00 36.52
METALAluminum Cans 0.53 0.00 0.00 0.53Ferrous, Magnetic 0.00 0.00 0.00 0.00Non-Ferrous, Non-magnetic 0.00 0.00 0.00 0.00Steel Cans 0.00 0.00 0.00 0.00Mixed Scrap Metal 126.52 0.00 0.00 126.52TOTAL METAL 127.05 0.00 0.00 127.05
PAPERCardboard 171.21 6,215.80 0.00 6,387.01Magazines 0.00 0.00 0.00 0.00Newspaper and Inserts 0.00 0.00 0.00 0.00Office Paper 0.00 0.00 0.00 0.00Paperboard 0.00 0.00 0.00 0.00Phone Books 0.00 0.00 0.00 0.00Mixed Paper 148.37 107.17 0.00 255.54TOTAL PAPER 319.58 6,322.97 0.00 6,642.55
PLASTICHDPE 9.34 0.00 0.00 9.34LDPE 0.00 0.00 0.00 0.00PET 11.39 0.00 0.00 11.39PP 0.00 0.00 0.00 0.00PS 0.00 0.00 0.00 0.00Vinyl 0.00 0.00 0.00 0.00Commingled PET and HDPE 0.00 0.00 0.00 0.00Mixed Plastic 0.00 0.00 0.00 0.00TOTAL PLASTIC 20.73 0.00 0.00 20.73
BANNED ITEMSAppliances 0.00 0.00 0.00 0.00Electronics 60.45 0.00 0.00 60.45Lead-acid Batteries (automobiles, trucks, motorcycles – small sealed lead-acid batteries) 69.21 67.67 0.00 136.88
Tires (automobiles, trucks, motorcycles) 137.87 0.00 0.00 137.87Used Motor Oil (automobiles, trucks, motorcycles) 13.22 –– –– 13.22
Yard Trimmings 0.00 0.00 0.00 0.00TOTAL BANNED ITEMS 280.75 67.67 0.00 348.42
MISCELLANEOUS ITEMSAntifreeze 0.00 0.00 0.00 0.00Cooking Oil/Grease 1.11 0.00 0.00 1.11Fluorescent Bulbs 0.00 0.00 0.00 0.00Food Scraps 0.00 0.00 0.00 0.00Household Hazardous Materials 0.00 0.00 0.00 0.00Inkjet/Toner Cartridges 0.00 0.00 0.00 0.00Mattresses 0.00 0.00 0.00 0.00Paint 0.00 0.00 0.00 0.00Rechargeable Batteries 0.08 0.00 0.00 0.08Textiles (recycled – not donated for reuse) 0.00 0.00 0.00 0.00Used Motor Oil Filters 1.10 0.00 0.00 1.10Wood Packaging (pallets, crates, barrels) 0.00 0.00 0.00 0.00Other Items 36.00 0.00 0.00 36.00TOTAL MISCELLANEOUS ITEMS 38.29 0.00 0.00 38.29
COMMINGLED RECYCLABLESTOTAL COMMINGLED RECYCLABLES 0.00 0.00 0.00 0.00TOTAL FOR ALL 822.92 6,390.64 0.00 7,213.56

South Carolina Solid Waste Management Annual Report for Fiscal Year 2013 85
WILLIAMSBURG COUNTY
TABLE 8.93: Williamsburg County MSW Summary
POPULATION DROP-OFF CENTERS
CURBSIDE PROGRAMS
RECYCLING RATE (PERCENT)
RECYCLED (P/P/D)
RECYCLED (TONS)
DISPOSED (P/P/D)
DISPOSED (TONS)
33,620 20 1 19.2 0.27 1,655.50 1.1 6,971
TABLE 8.94: Williamsburg County MSW Recycling Data in Tons
COMMODITY RESIDENTIAL COMMERCIAL/INSTITUTIONAL
INDUSTRIAL(OFFICE/PACKAGING) TOTAL
GLASSContainers & Packaging - Brown 0.00 0.00 0.00 0.00Containers & Packaging - Clear 0.00 0.00 0.00 0.00Containers & Packaging - Green 0.00 0.00 0.00 0.00Containers & Packaging - Mixed 0.00 0.00 0.00 0.00TOTAL GLASS 0.00 0.00 0.00 0.00
METALAluminum Cans 0.00 0.50 0.00 0.50Ferrous, Magnetic 0.00 10.00 0.00 10.00Non-Ferrous, Non-magnetic 0.00 0.00 0.00 0.00Steel Cans 0.00 0.00 139.70 139.70Mixed Scrap Metal 54.57 0.00 0.00 54.57TOTAL METAL 54.57 10.50 139.70 204.77
PAPERCardboard 59.40 22.00 17.83 99.23Magazines 0.00 0.00 0.00 0.00Newspaper and Inserts 0.00 0.00 0.00 0.00Office Paper 0.00 10.00 0.00 10.00Paperboard 0.00 0.00 0.00 0.00Phone Books 0.00 1.00 0.00 1.00Mixed Paper 20.89 2.00 0.00 22.89TOTAL PAPER 80.29 35.00 17.83 133.12
PLASTICHDPE 0.00 0.00 210.35 210.35LDPE 0.00 0.00 0.00 0.00PET 5.65 0.00 0.00 5.65PP 0.00 0.00 0.00 0.00PS 0.00 0.00 0.00 0.00Vinyl 0.00 0.00 0.00 0.00Commingled PET and HDPE 0.00 0.00 0.00 0.00Mixed Plastic 0.00 0.00 0.00 0.00TOTAL PLASTIC 5.65 0.00 210.35 216.00
BANNED ITEMSAppliances 0.00 0.00 0.00 0.00Electronics 64.55 27.32 0.75 92.62Lead-acid Batteries (automobiles, trucks, motorcycles – small sealed lead-acid batteries) 81.44 81.44 0.00 162.88
Tires (automobiles, trucks, motorcycles) 728.52 0.00 0.00 728.52Used Motor Oil (automobiles, trucks, motorcycles) 40.93 –– –– 40.93
Yard Trimmings 0.00 0.00 0.00 0.00TOTAL BANNED ITEMS 915.44 108.76 0.75 1,024.95
MISCELLANEOUS ITEMSAntifreeze 0.00 0.00 0.00 0.00Cooking Oil/Grease 0.00 0.00 0.00 0.00Fluorescent Bulbs 0.00 0.00 0.00 0.00Food Scraps 0.00 0.00 0.00 0.00Household Hazardous Materials 0.00 0.00 0.00 0.00Inkjet/Toner Cartridges 6.42 0.25 0.00 6.67Mattresses 0.00 0.00 0.00 0.00Paint 0.00 0.00 0.00 0.00Rechargeable Batteries 0.00 0.00 0.01 0.01Textiles (recycled – not donated for reuse) 0.00 0.00 0.00 0.00Used Motor Oil Filters 3.56 0.00 0.00 3.56Wood Packaging (pallets, crates, barrels) 0.00 0.50 65.93 66.43Other Items 0.00 0.00 0.00 0.00TOTAL MISCELLANEOUS ITEMS 9.98 0.75 65.94 76.67
COMMINGLED RECYCLABLESTOTAL COMMINGLED RECYCLABLES 0.00 0.00 0.00 0.00TOTAL FOR ALL 1,065.93 155.01 434.56 1,655.50

86 South Carolina Solid Waste Management Annual Report for Fiscal Year 2013
YORK COUNTY
TABLE 8.95: York County MSW Summary
POPULATION DROP-OFF CENTERS
CURBSIDE PROGRAMS
RECYCLING RATE (PERCENT)
RECYCLED (P/P/D)
RECYCLED (TONS)
DISPOSED (P/P/D)
DISPOSED (TONS)
234,635 25 6 26.2 1.74 74,456.19 4.9 210,271
TABLE 8.96: York County MSW Recycling Data in Tons
COMMODITY RESIDENTIAL COMMERCIAL/INSTITUTIONAL
INDUSTRIAL(OFFICE/PACKAGING) TOTAL
GLASSContainers & Packaging - Brown 190.43 0.00 325.00 515.43Containers & Packaging - Clear 254.78 0.00 0.00 254.78Containers & Packaging - Green 151.55 0.00 0.00 151.55Containers & Packaging - Mixed 0.00 0.00 0.00 0.00TOTAL GLASS 596.76 0.00 325.00 921.76
METALAluminum Cans 41.93 3.13 109.93 154.99Ferrous, Magnetic 1,908.78 29.19 10,095.08 12,033.05Non-Ferrous, Non-magnetic 10.25 0.50 0.00 10.75Steel Cans 15.76 0.00 64.63 80.39Mixed Scrap Metal 68.06 145.14 2,005.79 2,218.99TOTAL METAL 2,044.78 177.96 12,275.43 14,498.17
PAPERCardboard 3,084.92 14,035.23 1,333.73 18,453.88Magazines 776.84 3.41 1.27 781.52Newspaper and Inserts 905.68 2.33 2.59 910.60Office Paper 29.18 220.32 77.73 327.23Paperboard 0.00 0.00 0.50 0.50Phone Books 0.00 3.28 0.49 3.77Mixed Paper 455.45 75.90 23.48 554.83TOTAL PAPER 5,252.07 14,340.47 1,439.79 21,032.33
PLASTICHDPE 46.61 0.01 8.40 55.02LDPE 0.00 0.00 0.00 0.00PET 105.99 0.01 155.43 261.43PP 0.00 0.00 0.00 0.00PS 0.00 0.00 0.00 0.00Vinyl 0.00 0.00 0.00 0.00Commingled PET and HDPE 122.99 0.00 3.00 125.99Mixed Plastic 1.51 252.97 394.17 648.65TOTAL PLASTIC 277.10 252.99 560.99 1,091.08
BANNED ITEMSAppliances 0.00 0.00 4,000.05 4,000.05Electronics 769.18 57.02 8.80 834.99Lead-acid Batteries (automobiles, trucks, motorcycles – small sealed lead-acid batteries) 576.49 596.54 500.38 1,673.41
Tires (automobiles, trucks, motorcycles) 1,520.38 107.33 304.21 1,931.92Used Motor Oil (automobiles, trucks, motorcycles) 182.86 –– –– 182.86
Yard Trimmings 19,877.58 1,250.00 10.00 21,137.58TOTAL BANNED ITEMS 22,926.49 2,010.89 4,823.44 29,760.81
MISCELLANEOUS ITEMSAntifreeze 5.08 9.67 2.23 16.98Cooking Oil/Grease 22.00 4.07 0.99 27.06Fluorescent Bulbs 667.02 3.00 5.56 675.58Food Scraps 0.00 0.00 0.00 0.00Household Hazardous Materials 17.31 0.00 0.00 17.31Inkjet/Toner Cartridges 55.14 5.74 6.71 67.59Mattresses 0.00 0.00 0.00 0.00Paint 46.12 1.08 3.00 50.20Rechargeable Batteries 3.09 2.10 2.01 7.20Textiles (recycled – not donated for reuse) 80.84 0.00 15.00 95.84Used Motor Oil Filters 10.71 10.25 1.11 22.07Wood Packaging (pallets, crates, barrels) 9.67 20.60 1,914.30 1,944.57Other Items 0.00 4.11 49.89 54.00TOTAL MISCELLANEOUS ITEMS 916.98 60.62 2,000.79 2,978.40
COMMINGLED RECYCLABLESTOTAL COMMINGLED RECYCLABLES 4,130.47 35.42 7.76 4,173.65TOTAL FOR ALL 36,144.65 16,878.34 21,433.20 74,456.19

South Carolina Solid Waste Management Annual Report for Fiscal Year 2013 87
The S.C. Solid Waste Policy and Management Act of 1991 (Act) – S.C. Code of Laws §§ 44-96-10 et seq. – and subsequent regulation (R.61-107.19) require permitted private and public solid waste landfills to report annually the amount and type of solid waste disposed of to the S.C. Department of Health and Environmental Control.
This section focuses on disposal of both municipal solid waste (MSW) and total solid waste (TSW) as defined in Section 2. For the purposes of this report, the terms solid waste and TSW are interchangeable. In addition, as required by the Act, the focus of this report is on MSW.
In fiscal year (FY) 2013 (July 1, 2012 to June 30, 2013) there were 410 solid waste facilities operating under the authority of 15 types of permits in South Carolina. See Section 10 for a complete list of facilities. Of that total,
174 were landfills. There are three types of landfill classifications – each of which accepts specific types of solid waste. See Table 9.1.
The amount of material disposed of in both Class 1 and Class 2 landfills increased in FY13. In Class 1 landfills, 75,003 tons of land-clearing debris were disposed of – an increase of 2,335 tons from FY12. See Table 9.12 for FY13 disposal totals by county.
SECTION
9Disposal
In FY13, there were 410
permitted solid waste facilities in South Carolina.
TABLE 9.1: S.C. Landfill Classifications
TYPE NUMBER OF FACILITIES IN FY13
MATERIAL ACCEPTED
Class 1 56 Land-clearing debris
Class 2 93 Construction and demolition (C&D) debris
Class 3 25 MSW, C&D debris and industrial solid waste

88 South Carolina Solid Waste Management Annual Report for Fiscal Year 2013
Class 2 landfill disposal increased for the first time in the past four years. In FY13, more than 3.2 million tons of C&D debris were disposed of – an increase of about 15 percent from FY12’s total of about 2.7 million tons. See Table 9.13 for a list of Class 2 landfills including permitted annual disposal, FY13 disposal and estimated life.
Of the 25 Class 3 landfills, eight were publicly owned and 17 were privately owned. The 17 privately owned landfills include seven industrial landfills (i.e., non-commercial). See Table 9.6 for a complete list of Class 3 landfills including permitted annual rate of disposal, FY13 disposal and estimated remaining life.
South Carolinians disposed of 2.9 million tons of MSW in FY13 – an increase of nearly 50,000 tons or almost 2 percent from the previous FY’s total. On average, each South Carolinian disposed of about 3.5 pounds of MSW per day – a slight increase from the 3.4 pounds per person per day the previous FY.
TSW disposal in Class 3 landfills decreased about 370,000 tons in FY13 to about 5.1 million tons. Of that amount, the majority (about 4 million tons or 79 percent) was disposed of in the 17 privately owned Class 3 landfills. The remainder (about 1.1 million tons or 21 percent) was disposed of in the state’s eight publicly owned Class 3 landfills.
Lee County Landfill, Oakridge Landfill, Richland Landfill and Upstate Regional Landfill accepted more than half (about 3 million tons or 55 percent) of the TSW disposed of in privately owned Class 3 landfills. Of those four landfills, Richland Landfill accepted nearly one third (more than 944,000 tons). See Tables 9.6 through 9.9 for an overview of disposal data.
Import and Export of Solid Waste
The amount of out-of-state solid waste disposed of in South Carolina in FY13 was 666,582 tons – a
decrease of nearly 3 percent from the previous FY. (See Chart 9.2.) Overall, this represents about 8 percent of the total amount of solid waste disposed of in the state.
In FY13, the vast majority of out-of-state solid waste was disposed of in three Class 3 landfills – Lee County Landfill, Palmetto Landfill and Upstate Regional
CHART 9.2: Solid Waste Imported into South Carolina by FY in Tons
0
300,000
600,000
900,000
1,200,000
1,500,000
FY09 FY10 FY11 FY12 FY13
1,252,697
878,445
664,670 689,514666,582
CHART 9.3: Solid Waste Imported by State as a Percentage of All Solid Waste Imported into South Carolina in FY13
NORTH CAROLINA
60%
NEW YORK
35%
GEORGIA
5%
TIPPING FEES – the amount charged to dispose of solid waste at a landfill – were taken from landfill reports submitted to DHEC. While tipping fee data is incomplete (only a portion of the facilities reported tipping fees), the average Class 3 Landfill tipping fee was $39 per ton in FY13, up $1 from the previous FY. In addition, the average tipping fee for Class 2 disposal was $26 in FY13 – no change from the previous FY. The average tipping fee for Class 1 disposal was $15. Tipping fee data for Class 1 landfills had not been reported in previous years.

South Carolina Solid Waste Management Annual Report for Fiscal Year 2013 89
Landfill. (See Table 9.5.) Georgia, New York and North Carolina exported solid waste to South Carolina in FY13. New York and North Carolina combined for about 95 percent (more than 581,000 tons) of the total amount of solid waste imported to the state. (See Chart 9.3 and Table 9.5.)
South Carolina exported 148,146 tons of solid waste in FY13 – an increase of nearly 75 percent from the previous FY (84,897 tons). This number can vary depending on the number of out-of-state landfills that report.
Nine counties (Anderson, Chester, Chesterfield, Lancaster, Marlboro, Oconee, Pickens, Spartanburg and York) accounted for all of the exported waste, which was sent to Georgia and North Carolina landfills. (See Chart 9.4.)
TABLE 9.5: Solid Waste Imported into South Carolina in Tons in FY13
OR
IGIN
AB
BEV
ILLE
CO
UN
TY
LAN
DFI
LLA
bbev
ille
Cou
nty
HIC
KOR
Y H
ILL
LAN
DFI
LLJa
sper
Cou
nty
LEE
CO
UN
TY L
AN
DFI
LL,
LLC
OA
KR
IDG
E LA
ND
FILL
Dor
ches
ter
Cou
nty
PALM
ETTO
LA
ND
FILL
Spar
tanb
urg
Cou
nty
RIC
HLA
ND
LA
ND
FILL
Rich
land
Cou
nty
THR
EE R
IVER
S SW
A1
LAN
DFI
LLA
iken
Cou
nty
UPS
TATE
REG
ION
AL
LAN
DFI
LLU
nion
Cou
nty
TOTA
L IM
POR
TED
SO
LID
WA
STE
D
ISPO
SED
OF
IN
S.C
. LA
ND
FILL
S
Georgia 175 5,311 0 93 0 1,198 25,259 0 32,036
New York 0 0 212,736 0 0 0 0 0 212,736
North Carolina 0 647 2,099 0 128,732 93,560 0 143,671 368,709
Miscellaneous2 0 0 0 0 0 0 0 0 53,101
TOTAL WASTE FROM OUT OF STATE
175 5,957 214,835 93 128,732 94,758 25,259 143,671 666,582
1. Solid Waste Authority
2. This represents solid waste imported from Georgia (34,713 tons) and North Carolina (18,388 tons) and disposed of in Class 1 and Class 2 landfills or through incineration. Of the solid waste imported from Georgia, 188 tons of land-clearing debris were disposed of through incineration.
NOTE: Some totals may not add up due to rounding.
CHART 9.4: Solid Waste Exported from South Carolina by FY in Tons
0
30,000
60,000
90,000
120,000
150,000
FY09 FY10 FY11 FY13FY12
145,406
127,563
115,780
84,897
148,146
South Carolina exported 148,146
tons of solid waste in FY13 –
an increase of 75 percent from the
previous FY.

90 South Carolina Solid Waste Management Annual Report for Fiscal Year 2013
South Carolina’s
Class 3 Landfillsin FY13
1
3
10
4
2
20
5
15
12
6
14
11
17
16
13
19
21
22 237
8 18
9
1 Abbeville County Landfill
2 Bees Ferry Landfill
3 Berkeley County Landfill
4 Georgetown County Landfill 5 Greenwood County Landfill
6 Horry County SWA Landfill
7 Three Rivers SWA Landfill
8 Twin Chimneys Landfill
9 Wellford Landfill
COMMERCIAL, PUBLICLY OWNED LANDFILLS
NON-COMMERCIAL, PRIVATELY OWNED LANDFILLS1
COMMERCIAL, PRIVATELY OWNED LANDFILLS
23 SCE&G – Cope
24 SCE&G – Wateree Landfill
25 SCE&G – Williams Hwy. 52 Landfill
21 Santee Cooper – Cross
22 Savannah River Site Z-Area Landfill
19 Albemarle Corp. Landfill
20 CMC Landfill
16 Pepperhill Landfill
17 Richland Landfill
18 Upstate Regional Landfill
13 Northeast Landfill, LLC
14 Oakridge Landfill
15 Palmetto Landfill
10 Anderson Regional Landfill
11 Hickory Hill Landfill
12 Lee County Landfill, LLC
1. Non-commercial landfills are defined by regulation as facilities that only manage the solid waste generated in the course of normal operations on property under the same ownership or control as the facility itself (i.e., “on site”). For more information, see Section 10.
24
25

South Carolina Solid Waste Management Annual Report for Fiscal Year 2013 91
TABLE 9.6: Class 3 Remaining Capacity & Disposal in Tons
NA
ME
OF
CLA
SS 3
LA
ND
FILL
CO
UN
TY
LAN
DFI
LL
OW
NER
SHIP
PER
MIT
TED
AN
NU
AL
RA
TE O
F D
ISPO
SAL
FY13
DIS
POSA
L
ESTI
MA
TED
R
EMA
ININ
G C
APA
CIT
Y O
F FA
CIL
ITY
ESTI
MA
TED
R
EMA
ININ
G L
IFE
OF
FAC
ILIT
Y B
ASE
D O
N
PER
MIT
TED
DIS
POSA
L R
ATE
IN Y
EAR
S
ESTI
MA
TED
R
EMA
ININ
G L
IFE
O
F FA
CIL
ITY
BA
SED
ON
C
UR
REN
T D
ISPO
SAL
RA
TE IN
YEA
RS
COMMERCIAL LANDFILLS
Abbeville County Landfill
Abbeville Public 46,000 16,898 938,652 20.4 55.5
Anderson Regional Landfill
Anderson Private 438,000 194,645 5,771,485 13.2 29.7
Bees Ferry Landfill (Charleston)
Charleston Public 316,709 148,320 5,242,519 16.6 35.3
Berkeley County Landfill
Berkeley Public 1,000,000 205,235 5,417,625 5.4 26.4
Georgetown County Landfill
Georgetown Public 79,582 59,860 688,421 8.7 11.5
Greenwood County Landfill
Greenwood Public 150,000 73,833 1,951,240 13.0 26.4
Hickory Hill Landfill
Jasper Private 302,000 179,367 2,229,988 7.4 12.4
Horry County SWA Landfill
Horry Public 300,000 225,602 1,683,636 5.6 7.5
Lee County Landfill, LLC
Lee Private 1,944,939 424,023 23,964,256 12.3 56.5
Northeast Landfill, LLC
Richland Private 529,600 170,299 7,875,829 14.9 46.2
Oakridge Landfill Dorchester Private 1,144,000 564,571 3,606,862 3.2 6.4
Palmetto Landfill Spartanburg Private 1,200,000 272,441 375,120 0.3 1.4
Pepperhill Landfill Dorchester Private 214,500 49 242,269 1.1 4,964.5
Richland Landfill Richland Private 988,209 944,580 30,511,776 30.9 32.3
Three Rivers SWA Landfill
Aiken Public 500,000 236,917 36,660,896 73.3 154.7
Twin Chimneys Landfill
Greenville Private 500,000 260,528 28,670,597 57.3 110.0
Upstate Regional Landfill
Union Private 730,000 712,390 3,984,463 5.5 5.6
Wellford Landfill Spartanburg Public 260,000 112,856 734,281 2.8 6.5
STATE TOTALS –– –– 10,643,539 4,802,413 160,549,915 15.11 33.41
NON-COMMERCIAL PRIVATE LANDFILLS
Albemarle Corp. Orangeburg Private N/A 3,430 320,769 N/A 93.5
CMC Lexington Private 150,000 49,424 1,618,360 10.8 32.7
Santee Cooper – Cross
Berkeley Private N/A N/A N/A N/A N/A
SCE&G-Cope Orangeburg Private N/A N/A N/A N/A N/A
SCE&G-Wateree Richland Private N/A 159,431 N/A N/A N/A
SCE&G-Williams Hwy. 52
Berkeley Private N/A 80,334 N/A N/A N/A
SRS Z-Area Aiken Private 36,000 24,685 N/A N/A N/A
STATE TOTALS –– –– 186,000 292,619 1,939,129 N/A N/A
1. Average

92 South Carolina Solid Waste Management Annual Report for Fiscal Year 2013
TABLE 9.7: Class 3 Landfill Disposal Trends in Tons, FY09 to FY13
CLASS 3 LANDFILL
LANDFILL OWNERSHIP COUNTY FY09 FY10 FY11 FY12 FY13
Abbeville County Landfill
Public Abbeville 15,083 12,936 16,098 17,118 16,898
Albemarle Corp. Landfill
Private Orangeburg –– 25,062 17,540 20,249 3,430
Anderson Regional Landfill
Private Anderson 236,757 166,751 183,298 205,313 194,645
Bees Ferry Landfill Public Charleston 147,479 158,095 149,159 147,544 148,320
Berkeley County Landfill
Public Berkeley 196,573 187,589 169,620 193,151 205,235
CMC Landfill Private Lexington 116,706 82,489 101,381 100,057 49,424
Georgetown County Landfill
Public Georgetown 41,822 45,950 47,192 54,511 59,860
Greenwood County Landfill
Public Greenwood 79,554 84,608 61,898 65,095 73,833
Hickory Hill Landfill
Private Jasper 232,689 194,789 192,371 188,677 179,367
Horry County SWA Landfill
Public Horry 233,958 228,611 227,439 222,341 225,602
Lee County Landfill, LLC
Private Lee 1,141,707 646,908 514,885 475,898 424,023
Northeast Landfill, LLC
Private Richland 117,045 175,504 173,566 187,259 170,299
Oakridge Landfill Private Dorchester 470,784 564,378 643,591 794,144 564,571
Palmetto Landfill Private Spartanburg 474,882 389,940 394,091 291,086 272,441
Pepperhill Landfill Private Dorchester 16,541 109 99 47 49
Richland Landfill Private Richland 823,346 956,061 888,984 895,005 944,580
Santee Cooper – Cross
Private Berkeley –– –– –– –– ––
SCE&G – Cope Private Orangeburg –– –– –– –– ––
SCE&G – Wateree Landfill
Private Richland –– 14,907 110,251 88,783 159,431
SCE&G – Williams Hwy. 52 Landfill
Private Berkeley –– 0 140,677 46,771 80,334
Savannah River Site Z-Area Landfill
Private Aiken 14,600 12,859 20,060 11,633 24,685
Three Rivers SWA Landfill
Public Aiken 262,294 249,744 267,081 267,144 236,917
Twin Chimneys Landfill
Public Greenville 199,473 208,789 214,639 228,793 260,528
Upstate Regional Landfill
Private Union 512,357 669,121 777,941 793,012 712,390
Wellford Landfill Public Spartanburg 121,394 114,830 151,725 110,958 112,856
NOTE: This table only includes Class 3 landfills that were active in FY13.

South Carolina Solid Waste Management Annual Report for Fiscal Year 2013 93
TABLE 9.8: Disposal at Commercial and Non-commercial Class 3 Landfills in Tons*C
OU
NTY
OR
ST
ATE
OF
OR
IGIN
AB
BEV
ILLE
C
OU
NTY
LA
ND
FILL
ALB
EMA
RLE
C
OR
P. L
AN
DFI
LL
AN
DER
SON
R
EGIO
NA
L
LAN
DFI
LL
BER
KEL
EY
CO
UN
TY
LAN
DFI
LL
BEE
S FE
RR
Y LA
ND
FILL
CM
C L
AN
DFI
LL
GEO
RG
ETO
WN
C
OU
NTY
LA
ND
FILL
GR
EEN
WO
OD
C
OU
NTY
LA
ND
FILL
HIC
KOR
Y H
ILL
LAN
DFI
LL
HO
RR
Y C
OU
NTY
SW
A L
AN
DFI
LL
LEE
CO
UN
TY
LAN
DFI
LL, L
LC
NO
RTH
EAST
LA
ND
FILL
, LLC
OA
KR
IDG
E LA
ND
FILL
Abbeville 15,795 0 0 0 0 0 0 0 0 0 0 0 0
Aiken 0 0 0 0 0 0 0 0 0 0 0 0 0
Allendale 0 0 0 0 0 0 0 0 29 0 0 0 0
Anderson 926 0 94,950 0 0 0 0 0 0 0 0 0 0
Bamberg 0 0 0 0 0 0 0 0 0 0 0 0 0
Barnwell 0 0 0 0 0 0 0 0 0 0 0 0 248
Beaufort 0 0 0 13 0 0 0 0 141,763 0 0 0 0
Berkeley 0 0 0 166,926 17 0 0 0 0 0 0 0 154,072
Calhoun 0 0 0 0 0 0 0 0 0 0 0 7,032 0
Charleston 0 0 0 37,965 148,273 0 0 0 0 0 0 4 229,904
Cherokee 0 0 21 0 0 0 0 0 0 0 0 0 0
Chester 0 0 0 0 0 0 0 0 0 0 0 424 0
Chesterfield 0 0 0 0 0 0 0 0 0 0 8,659 0 0
Clarendon 0 0 0 0 0 0 0 0 0 0 541 0 163
Colleton 0 0 0 33 3 0 0 0 143 0 0 0 32,233
Darlington 0 0 0 0 0 0 0 0 0 0 37,211 0 0
Dillon 0 0 0 0 0 0 0 0 0 0 19,829 0 0
Dorchester 0 0 0 285 27 0 0 0 0 0 0 0 79,034
Edgefield 0 0 0 0 0 0 0 0 0 0 0 0 0
Fairfield 0 0 0 0 0 0 0 0 0 0 0 4,342 0
Florence 0 0 0 0 0 0 0 0 0 0 54,720 15 0
Georgetown 0 0 0 0 0 0 59,860 0 130 10 0 0 1,181
Greenville 0 0 77,878 0 0 0 0 0 0 0 0 0 0
Greenwood 1 0 5 0 0 0 0 73,833 0 0 0 0 0
Hampton 0 0 0 0 0 0 0 0 11,639 0 0 25 0
Horry 0 0 0 0 0 0 0 0 0 225,592 98 0 0
Jasper 0 0 0 0 0 0 0 0 19,706 0 0 0 0
Kershaw 0 0 0 0 0 0 0 0 0 0 12,249 4,955 0
Lancaster 0 0 0 0 0 0 0 0 0 0 26,890 26 0
Laurens 0 0 22 0 0 0 0 0 0 0 0 0 0
Lee 0 0 0 0 0 0 0 0 0 0 11,289 0 0
Lexington 0 0 0 0 0 49,424 0 0 0 0 8 71,939 1
Marion 0 0 0 0 0 0 0 0 0 0 9,573 0 0
Marlboro 0 0 0 0 0 0 0 0 0 0 13,840 0 0
McCormick 0 0 0 0 0 0 0 0 0 0 0 0 0
Newberry 0 0 0 0 0 0 0 0 0 0 0 1,166 0
Oconee 0 0 529 0 0 0 0 0 0 0 0 14 0
Orangeburg 0 3,430 0 13 0 0 0 0 0 0 0 2,997 63,537
Pickens 0 0 3,185 0 0 0 0 0 0 0 0 0 0
Richland 0 0 0 0 0 0 0 0 0 0 0 76,506 5
Saluda 0 0 0 0 0 0 0 0 0 0 0 42 0
Spartanburg 0 0 17,044 0 0 0 0 0 0 0 0 0 0
Sumter 0 0 0 0 0 0 0 0 0 0 9,980 0 1
Union 0 0 1,012 0 0 0 0 0 0 0 0 0 0
Williamsburg 0 0 0 0 0 0 0 0 0 0 4,301 0 4,100
York 0 0 0 0 0 0 0 0 0 0 0 814 0
S.C. COUNTIES TOTAL ONLY 16,723 3,430 194,645 205,235 148,320 49,424 59,860 73,833 173,409 225,602 209,188 170,299 564,478
Georgia 175 0 0 0 0 0 0 0 5,311 0 0 0 93
New York 0 0 0 0 0 0 0 0 0 0 212,736 0 0
North Carolina 0 0 0 0 0 0 0 0 647 0 2,099 0 0
OUT-OF-STATE TOTAL ONLY 175 0 0 0 0 0 0 0 5,957 0 214,835 0 93
TOTAL WASTE DISPOSED OF AT FACILITY
16,898 3,430 194,645 205,235 148,320 49,424 59,860 73,833 179,367 225,602 424,023 170,299 564,571
Continued on the following page* This table was amended on July 25, 2014.

94 South Carolina Solid Waste Management Annual Report for Fiscal Year 2013
TABLE 9.8: Disposal at Commercial and Non-commercial Class 3 Landfills in Tons (continued)C
OU
NTY
OR
ST
ATE
OF
OR
IGIN
PALM
ETTO
LA
ND
FILL
PEPP
ERH
ILL
LAN
DFI
LL
RIC
HLA
ND
LA
ND
FILL
SAN
TEE
CO
OPE
R
– C
RO
SS
LAN
DFI
LL
SCE&
G –
CO
PE
LAN
DFI
LL
SCE&
G –
W
ATE
REE
LA
ND
FILL
SCE&
G –
WIL
LIA
MS
H
WY.
52
LAN
DFI
LL
SAV
AN
NA
H
RIV
ER S
ITE
Z-A
REA
LA
ND
FILL
THR
EE R
IVER
S SW
A L
AN
DFI
LL
TWIN
CH
IMN
EYS
LAN
DFI
LL
UPS
TATE
R
EGIO
NA
L LA
ND
FILL
WEL
LFO
RD
LA
ND
FILL
TOTA
L A
MO
UN
T O
F SO
LID
WA
STE
DIS
POSE
D O
F
IN C
LASS
3
LAN
DFI
LLS
S.C
. SO
LID
W
AST
E EX
POR
TED
FO
R
DIS
POSA
L O
UT
O
F ST
ATE
Abbeville 39 0 45 0 0 0 0 0 0 1,034 504 0 17,416 0
Aiken 0 0 42 0 0 0 0 24,685 109,997 0 0 0 134,724 0
Allendale 0 0 5 0 0 0 0 0 5,310 0 0 0 5,344 0
Anderson 135 0 0 0 0 0 0 0 0 830 349 0 97,190 13,805
Bamberg 0 0 0 0 0 0 0 0 8,413 0 1,196 0 9,610 0
Barnwell 0 0 235 0 0 0 0 0 13,700 0 0 0 14,184 0
Beaufort 0 0 9 0 0 0 0 0 0 0 0 0 141,785 0
Berkeley 0 0 0 0 0 0 80,334 0 0 0 0 0 401,350 0
Calhoun 0 0 12,296 0 0 0 0 0 4,598 0 0 0 23,926 0
Charleston 0 49 27 0 0 0 0 0 0 0 0 0 416,222 0
Cherokee 124 0 0 0 0 0 0 0 0 0 86,362 0 86,507 0
Chester 160 0 17,827 0 0 0 0 0 0 0 2,445 0 20,855 90
Chesterfield 0 0 7,343 0 0 0 0 0 0 0 0 0 16,002 0
Clarendon 0 0 12,946 0 0 0 0 0 0 0 0 0 13,649 0
Colleton 10 0 0 0 0 0 0 0 0 0 0 0 32,421 0
Darlington 0 0 3,017 0 0 0 0 0 0 0 0 0 40,227 0
Dillon 0 0 176 0 0 0 0 0 0 0 0 0 20,006 0
Dorchester 2,024 0 0 0 0 0 0 0 0 0 0 0 81,370 0
Edgefield 0 0 36 0 0 0 0 0 11,240 1,138 17 0 12,431 0
Fairfield 0 0 19,996 0 0 0 0 0 0 0 0 0 24,338 0
Florence 0 0 85,817 0 0 0 0 0 0 0 0 0 140,552 0
Georgetown 0 0 3 0 0 0 0 0 0 0 0 0 61,184 0
Greenville 30,493 0 6 0 0 0 0 0 0 197,659 227,102 0 533,138 0
Greenwood 373 0 17 0 0 0 0 0 0 10,667 10,539 0 95,435 0
Hampton 0 0 0 0 0 0 0 0 0 0 0 0 11,664 0
Horry 0 0 53 0 0 0 0 0 0 0 0 0 225,744 0
Jasper 0 0 0 0 0 0 0 0 0 0 0 0 19,706 0
Kershaw 0 0 19,690 0 0 0 0 0 0 0 0 0 36,894 0
Lancaster 0 0 155 0 0 0 0 0 0 0 33 0 27,103 391
Laurens 150 0 10 0 0 0 0 0 0 1,871 28,876 0 30,929 0
Lee 0 0 77,926 0 0 0 0 0 0 0 0 0 89,214 0
Lexington 14 0 134,569 0 0 0 0 0 0 0 1,031 0 256,987 0
Marion 0 0 7,003 0 0 0 0 0 0 0 0 0 16,576 0
Marlboro 0 0 3,196 0 0 0 0 0 0 0 0 0 17,036 46
McCormick 0 0 21 0 0 0 0 0 2,851 846 497 0 4,215 0
Newberry 8 0 493 0 0 0 0 0 0 1,418 37,338 0 40,422 0
Oconee 2,169 0 3 0 0 0 0 0 0 0 915 0 3,629 40,027
Orangeburg 0 0 181 0 0 0 0 0 47,824 0 0 0 117,982 0
Pickens 5,233 0 0 0 0 0 0 0 0 37,049 923 0 46,390 5,548
Richland 0 0 254,300 0 0 159,431 0 0 0 0 0 0 490,241 0
Saluda 0 0 80 0 0 0 0 0 7,725 0 205 0 8,052 0
Spartanburg 102,428 0 4 0 0 0 0 0 0 8,018 149,130 112,856 389,479 3
Sumter 0 0 66,672 0 0 0 0 0 0 0 0 0 76,653 0
Union 2 0 2 0 0 0 0 0 0 0 17,715 0 18,731 0
Williamsburg 0 0 2,775 0 0 0 0 0 0 0 0 0 11,176 0
York 347 0 122,847 0 0 0 0 0 0 0 3,542 0 127,549 88,236
S.C. COUNTIES TOTAL ONLY 143,708 49 849,823 0 0 159,431 80,334 24,685 211,658 260,528 568,718 112,856 4,506,236 148,146
Georgia 0 0 1,198 0 0 0 0 0 25,259 0 0 0 32,036 ––
New York 0 0 0 0 0 0 0 0 0 0 0 0 212,736 ––
North Carolina 128,732 0 93,560 0 0 0 0 0 0 0 143,671 0 368,709 ––
OUT-OF-STATE TOTAL ONLY 128,732 0 94,758 0 0 0 0 0 25,259 0 143,671 0 613,481 ––
TOTAL WASTE DISPOSED OF AT FACILITY
272,441 49 944,580 0 0 159,431 80,334 24,685 236,917 260,528 712,390 112,856 5,119,717 148,146

South Carolina Solid Waste Management Annual Report for Fiscal Year 2013 95
TABLE 9.9: TSW Disposal in Commercial and Non-commercial Class 3 Landfills, Incinerators and Exported by Type of Waste in Tons
CO
UN
TY
MSW
DIS
POSE
D
OF
IN C
LASS
3
LAN
DFI
LLS
&
EXPO
RTE
D F
OR
D
ISPO
SAL
ASH
C&
D D
EBR
IS
(DIS
POSE
D O
F +
IN
CIN
ERA
TED
)
IND
UST
RIA
L PR
OC
ESS
WA
STE
PRO
CES
SED
W
AST
E TI
RES
NA
TUR
AL
D
ISA
STER
DEB
RIS
OTH
ER
TSW
DIS
POSE
D
OF
IN C
LASS
3
LAN
DFI
LLS,
IN
CIN
ERA
TED
&
EXPO
RTE
D F
OR
D
ISPO
SAL
Abbeville 12,755 0 14 4,624 0 0 24 17,416
Aiken 89,343 9,281 0 7,748 0 0 28,352 134,724
Allendale 2,974 0 0 2,363 0 0 7 5,344
Anderson 84,306 0 984 18,929 0 0 6,776 110,994
Bamberg 8,413 0 0 1,196 0 0 0 9,610
Barnwell 13,633 0 0 537 0 0 13 14,184
Beaufort 125,232 0 24,421 0 0 0 12,197 161,850
Berkeley 82,935 80,764 32,713 160,223 0 0 44,714 401,350
Calhoun 8,656 136 823 14,062 0 0 250 23,926
Charleston 297,121 681 61,693 47,863 0 0 8,864 416,222
Cherokee 50,975 0 29 35,500 0 0 3 86,507
Chester 15,871 126 0 4,639 0 0 309 20,945
Chesterfield 12,783 0 0 2,930 0 0 289 16,002
Clarendon 13,402 0 0 11 0 0 237 13,649
Colleton 17,209 0 991 14,144 0 0 78 32,421
Darlington 31,058 12 0 7,825 0 0 1,332 40,227
Dillon 18,490 0 0 1,499 0 0 17 20,006
Dorchester 50,751 0 10,577 14,427 0 0 5,615 81,370
Edgefield 12,378 0 0 17 0 0 36 12,431
Fairfield 18,524 0 113 55 0 0 5,646 24,338
Florence 101,603 25 14 33,567 0 0 5,343 140,552
Georgetown 39,910 178 13,118 1,865 0 0 6,114 61,184
Greenville 384,998 58 6,956 97,658 0 0 43,468 533,138
Greenwood 61,960 0 8,817 1,026 112 0 23,520 95,435
Hampton 11,198 0 20 25 0 0 421 11,664
Horry 225,593 0 0 68 0 0 82 225,744
Jasper 10,993 11 1,635 0 0 0 8,286 20,926
Kershaw 28,033 6 345 7,908 0 0 603 36,894
Lancaster 26,838 0 308 193 0 0 155 27,494
Continued on the following page

96 South Carolina Solid Waste Management Annual Report for Fiscal Year 2013
TABLE 9.9: TSW Disposal in Commercial and Non-commercial Class 3 Landfills, Incinerators and Exported by Type of Waste in Tons (continued)
CO
UN
TY
MSW
DIS
POSE
D
OF
IN C
LASS
3
LAN
DFI
LLS
&
EXPO
RTE
D F
OR
D
ISPO
SAL
ASH
C&
D D
EBR
IS
(DIS
POSE
D O
F +
IN
CIN
ERA
TED
)
IND
UST
RIA
L PR
OC
ESS
WA
STE
PRO
CES
SED
W
AST
E TI
RES
NA
TUR
AL
D
ISA
STER
DEB
RIS
OTH
ER
TSW
DIS
POSE
D
OF
IN C
LASS
3
LA
ND
FILL
S,
INC
INER
ATE
D &
EX
POR
TED
FO
R
DIS
POSA
L
Laurens 27,206 0 730 2,891 0 0 102 30,929
Lee 8,449 0 21 2,875 0 0 77,869 89,214
Lexington 140,151 84 223 69,266 785 0 46,479 256,987
Marion 15,834 0 0 743 0 0 0 16,576
Marlboro 12,565 0 46 2,178 0 0 2,293 17,082
McCormick 3,772 0 0 443 0 0 0 4,215
Newberry 30,724 0 1,293 8,149 0 0 256 40,422
Oconee 40,128 0 19 3,404 0 0 105 43,655
Orangeburg 53,328 141 224 64,028 0 0 262 117,982
Pickens 42,606 0 6,075 8,571 0 0 438 57,690
Richland 263,456 159,470 6,225 41,982 0 0 19,108 490,241
Saluda 7,737 0 0 196 0 0 119 8,052
Spartanburg 192,507 0 17,651 178,771 0 0 554 389,482
Sumter 55,220 0 37 18,120 0 0 3,276 76,653
Union 16,990 0 602 1,115 0 0 24 18,731
Williamsburg 6,971 0 0 4,203 0 0 3 11,176
York 210,271 537 0 3,608 0 0 1,370 215,786
S.C. COUNTIES TOTAL ONLY (MSWLF/TS/EXP/INC)
2,985,852 251,508 196,713 891,440 897 0 355,007 4,681,418
Georgia 3,875 0 213 25,524 0 0 2,612 32,224
North Carolina 302,546 20 33 64,586 0 0 1,525 368,709
New York 212,736 0 0 0 0 0 0 212,736
OUT-OF-STATE TOTAL ONLY (MSWLF)
519,156 20 246 90,110 0 0 4,137 613,669
TOTAL BY WASTE STREAM
3,505,008 251,528 196,959 981,550 897 0 359,145 5,295,087

South Carolina Solid Waste Management Annual Report for Fiscal Year 2013 97
TABLE 9.10: State & County MSW Recycling, Disposal & Generation Rates
COUNTY POPULATION RECYCLING RATE
RECYCLED (P/P/D)
DISPOSED (P/P/D)
GENERATED (P/P/D)
RECYCLED (TONS)
DISPOSED (TONS)
GENERATED (TONS)
Abbeville 25,101 19.87 0.69 2.78 3.5 3,164 12,755 15,919
Aiken 162,812 19.22 0.72 3.01 3.7 21,260 89,343 110,602
Allendale 9,988 4.79 0.08 1.63 1.7 150 2,974 3,124
Anderson 189,355 29.21 1.01 2.44 3.4 34,794 84,306 119,100
Bamberg 15,763 11.62 0.38 2.92 3.3 1,106 8,413 9,519
Barnwell 22,212 7.04 0.25 3.36 3.6 1,033 13,633 14,666
Beaufort 168,049 31.10 1.84 4.08 5.9 56,520 125,232 181,753
Berkeley 189,781 37.84 1.46 2.39 3.9 50,492 82,935 133,427
Calhoun 14,910 12.22 0.44 3.18 3.6 1,205 8,656 9,861
Charleston 365,162 34.56 2.35 4.46 6.8 156,911 297,121 454,032
Cherokee 55,662 11.31 0.64 5.02 5.7 6,503 50,975 57,478
Chester 32,546 7.35 0.21 2.67 2.9 1,259 15,871 17,130
Chesterfield 46,103 26.77 0.56 1.52 2.1 4,673 12,783 17,456
Clarendon 34,357 6.03 0.14 2.14 2.3 859 13,402 14,261
Colleton 38,153 15.58 0.46 2.47 2.9 3,177 17,209 20,386
Darlington 68,139 21.45 0.68 2.50 3.2 8,483 31,058 39,542
Dillon 31,446 8.92 0.32 3.22 3.5 1,810 18,490 20,300
Dorchester 142,496 37.07 1.15 1.95 3.1 29,896 50,751 80,647
Edgefield 26,347 7.19 0.20 2.57 2.8 958 12,378 13,336
Fairfield 23,363 12.22 0.61 4.34 4.9 2,580 18,524 21,104
Florence 137,948 17.02 0.83 4.04 4.9 20,842 101,603 122,445
Georgetown 60,189 24.56 1.18 3.63 4.8 12,989 39,910 52,899
Greenville 467,605 33.60 2.28 4.51 6.8 194,820 384,998 579,818
Greenwood 69,756 26.09 1.72 4.87 6.6 21,871 61,960 83,831
Hampton 20,726 18.96 0.69 2.96 3.7 2,620 11,198 13,818
Horry 282,285 50.36 4.44 4.38 8.8 228,885 225,593 454,478
Jasper 25,833 6.96 0.17 2.33 2.5 823 10,993 11,816
Kershaw 62,343 45.14 2.03 2.46 4.5 23,066 28,033 51,100
Lancaster 79,089 28.83 0.75 1.86 2.6 10,873 26,838 37,711
Laurens 66,223 36.82 1.31 2.25 3.6 15,855 27,206 43,061
Lee 18,654 24.83 0.82 2.48 3.3 2,790 8,449 11,240
Lexington 270,406 38.92 1.81 2.84 4.6 89,299 140,151 229,449
Marion 32,457 23.31 0.81 2.67 3.5 4,813 15,834 20,647
Marlboro 28,145 30.30 1.06 2.45 3.5 5,463 12,565 18,028
McCormick 9,943 7.92 0.18 2.08 2.3 325 3,772 4,097
Newberry 37,576 17.28 0.94 4.48 5.4 6,420 30,724 37,144
Oconee 74,627 40.16 1.98 2.95 4.9 26,928 40,128 67,056
Orangeburg 91,476 33.72 1.62 3.19 4.8 27,126 53,328 80,453
Pickens 119,670 37.18 1.15 1.95 3.1 25,221 42,606 67,827
Richland 393,830 22.50 1.06 3.67 4.7 76,467 263,456 339,923
Saluda 19,893 8.64 0.20 2.13 2.3 731 7,737 8,468
Spartanburg 288,745 31.69 1.69 3.65 5.3 89,300 192,507 281,807
Sumter 108,052 20.54 0.72 2.80 3.5 14,277 55,220 69,498
Union 28,252 29.80 1.40 3.30 4.7 7,214 16,990 24,204
Williamsburg 33,620 19.19 0.27 1.14 1.4 1,656 6,971 8,626
York 234,635 26.15 1.74 4.91 6.6 74,456 210,271 284,727
STATE TOTALS/AVERAGES
4,723,723 31.50 1.6 3.5 5.1 1,371,960 2,985,852 4,357,812

98 South Carolina Solid Waste Management Annual Report for Fiscal Year 2013
TABLE 9.11: State & County TSW Recycling, Disposal and Generation in Tons
CO
UN
TY
POPU
LATI
ON
TSW
DIS
POSE
D
OF
IN C
LASS
3
LAN
DFI
LLS,
SO
LID
W
AST
E (S
W)
INC
INER
ATO
RS
&
EX
POR
TED
TSW
DIS
POSE
D
OF
IN C
LASS
2
LAN
DFI
LLS
TSW
DIS
POSE
D
OF
IN C
LASS
1
LAN
DFI
LLS
TOTA
L A
MO
UN
T O
F A
LL S
W
DIS
POSE
D O
F IN
LA
ND
FILL
S O
R
INC
INER
ATE
D
TOTA
L R
ECYC
LIN
G
EFFO
RTS
TOTA
L A
MO
UN
T O
F SW
G
ENER
ATE
D(R
ECYC
LED
+
DIS
POSE
D)
PER
CEN
T O
F A
LL
SW G
ENER
ATE
D
THA
T W
AS
REC
YCLE
D (
SW
REC
YCLE
D ÷
SW
G
ENER
ATE
D)
Abbeville 25,101 17,416 7,091 0 24,507 21,918 46,425 47.2%
Aiken 162,812 134,724 133,665 11,290 279,679 75,324 355,003 21.2%
Allendale 9,988 5,344 4,060 0 9,405 299 9,704 3.1%
Anderson 189,355 110,994 85,404 18,204 214,603 127,086 341,689 37.2%
Bamberg 15,763 9,610 5,730 0 15,340 2,430 17,770 13.7%
Barnwell 22,212 14,184 27,422 0 41,606 16,097 57,703 27.9%
Beaufort 168,049 161,850 68,058 0 229,908 226,202 456,110 49.6%
Berkeley 189,781 401,350 833,657 4,217 1,239,224 828,221 2,067,445 40.1%
Calhoun 14,910 23,926 4,443 0 28,368 34,472 62,840 54.9%
Charleston 365,162 416,222 341,818 0 758,039 789,639 1,547,678 51.0%
Cherokee 55,662 86,507 15,844 0 102,351 104,566 206,917 50.5%
Chester 32,546 20,945 19,477 0 40,422 115,399 155,821 74.1%
Chesterfield 46,103 16,002 24,320 0 40,322 9,985 50,307 19.8%
Clarendon 34,357 13,649 9,800 0 23,449 1,719 25,168 6.8%
Colleton 38,153 32,421 17,066 0 49,487 7,551 57,038 13.2%
Darlington 68,139 40,227 40,510 0 80,738 164,663 245,401 67.1%
Dillon 31,446 20,006 7,729 0 27,734 11,802 39,536 29.9%
Dorchester 142,496 81,370 38,540 0 119,910 83,675 203,585 41.1%
Edgefield 26,347 12,431 8,693 1,531 22,656 2,162 24,818 8.7%
Fairfield 23,363 24,338 1,103 2 25,443 6,061 31,504 19.2%
Florence 137,948 140,552 138,524 392 279,468 317,901 597,369 53.2%
Georgetown 60,189 61,184 26,483 0 87,667 27,543 115,210 23.9%
Greenville 467,605 533,138 193,100 575 726,812 550,321 1,277,133 43.1%
Greenwood 69,756 95,435 8,843 970 105,247 137,750 242,997 56.7%
Hampton 20,726 11,664 3,408 0 15,072 5,694 20,766 27.4%
Horry 282,285 225,744 90,065 0 315,808 799,056 1,114,864 71.7%
Jasper 25,833 20,926 4,321 252 25,498 6,627 32,125 20.6%
Kershaw 62,343 36,894 41,415 3,487 81,796 46,438 128,234 36.2%
Lancaster 79,089 27,494 55,438 3,488 86,420 21,937 108,357 20.2%
Laurens 66,223 30,929 13,154 0 44,083 31,923 76,006 42.0%
Lee 18,654 89,214 0 0 89,214 15,480 104,694 14.8%
Lexington 270,406 256,987 167,560 3,626 428,174 1,636,019 2,064,193 79.3%
Marion 32,457 16,576 11,712 0 28,288 36,192 64,480 56.1%
Marlboro 28,145 17,082 9,783 0 26,865 152,632 179,497 85.0%
McCormick 9,943 4,215 820 18 5,053 649 5,702 11.4%
Newberry 37,576 40,422 8,675 181 49,278 44,166 93,444 47.3%
Oconee 74,627 43,655 16,109 1,406 61,170 67,706 128,876 52.5%
Orangeburg 91,476 117,982 184,223 0 302,205 109,556 411,761 26.6%
Pickens 119,670 57,690 15,547 983 74,220 64,205 138,425 46.4%
Richland 393,830 490,241 225,910 10,190 726,341 235,158 961,499 24.5%
Saluda 19,893 8,052 818 194 9,064 1,463 10,527 13.9%
Spartanburg 288,745 389,482 95,337 2,051 486,870 265,634 752,504 35.3%
Sumter 108,052 76,653 45,311 0 121,964 31,200 153,164 20.4%
Union 28,252 18,731 2,595 2,786 24,113 64,836 88,949 72.9%
Williamsburg 33,620 11,176 8,028 0 19,204 3,320 22,524 14.7%
York 234,635 215,786 90,121 7,530 313,436 398,299 711,735 56.0%
TOTAL FOR S.C. COUNTIES 4,723,723 4,681,418 3,151,730 73,374 7,906,522 7,700,976 15,607,497 49.3%
TOTAL OUT-OF-STATE 613,669 51,284 1,629 666,582
TOTAL WASTE STREAM 5,295,087 3,203,014 75,003 8,573,103

South Carolina Solid Waste Management Annual Report for Fiscal Year 2013 99
TABLE 9.12: Class 1 Landfill Disposal in Tons
COUNTY OR PLACE OF ORIGIN FY09 FY10 FY11 FY12 FY13
Abbeville 697 0 0 0 0Aiken 13,543 12,906 10,049 10,787 11,290Allendale 0 0 0 0 0Anderson 18,057 23,964 21,911 16,855 18,204Bamberg 0 0 0 0 0Barnwell 0 0 0 0 0Beaufort 0 0 0 0 0Berkeley 0 0 0 0 4,217Calhoun 0 0 0 0 0Charleston 0 0 0 0 0Cherokee 0 0 0 0 0Chester 0 0 120 0 0Chesterfield 0 0 0 0 0Clarendon 0 0 0 0 0Colleton 0 0 0 0 0Darlington 0 0 0 0 0Dillon 0 0 0 0 0Dorchester 0 0 0 0 0Edgefield 1,374 1,400 1,709 2,343 1,531Fairfield 0 0 0 0 2Florence 0 0 0 316 392Georgetown 0 0 0 0 0Greenville 113 286 326 621 575Greenwood 1,245 1,176 1,005 1,491 970Hampton 0 0 0 0 0Horry 0 0 0 0 0Jasper 0 211 305 291 252Kershaw 2,305 2,190 3,005 3,210 3,487Lancaster 380 435 640 3,750 3,488Laurens 446 490 525 400 0Lee 0 0 0 0 0Lexington 16,545 7,329 4,623 5,369 3,626Marion 0 0 0 0 0Marlboro 0 0 0 0 0McCormick 32 0 0 18 18Newberry 63 0 85 66 181Oconee 3,930 1,187 599 1,801 1,406Orangeburg 0 0 0 0 0Pickens 920 175 503 1,566 983Richland 7,682 7,365 9,256 10,868 10,190Saluda 228 512 143 162 194Spartanburg 470 1,214 1,049 1,524 2,051Sumter 0 0 241 423 0Union 2,802 2,220 2,202 1,809 2,786Williamsburg 0 0 0 0 0York 1,652 1,681 4,497 7,710 7,530TOTAL SOUTH CAROLINA 72,484 64,739 62,792 71,380 73,374
TOTAL OUT-OF-STATE 1,008 902 1,893 1,288 1,629
TOTAL AMOUNT DISPOSED OF 73,492 65,641 64,685 72,667 75,003
NOTE: See Table 10.3 for a list of Class 1 Landfills by name and county.

100 South Carolina Solid Waste Management Annual Report for Fiscal Year 2013
COUNTY LANDFILL
PERMITTED ANNUAL RATE OF DISPOSAL
IN TONS
FY13 DISPOSAL IN TONS
ESTIMATED REMAINING LIFE
OF FACILITY IN YEARS
Abbeville Abbeville County 10,000 7,256 262.5Aiken Aiken County (Barden) 80,000 60,870 17.5Aiken Aiken County (Wagener) 134,766 2,227 56.9Aiken G.L. Williams C&D Landfill 57,500 1,138 20.0Aiken Owens Corning Fiberglass n 15,707 13.7Aiken Rainbow Falls Road 103,216 60,965 58.0Aiken Savannah River Site 288-F 30,000 0 8.0Aiken Savannah River Site 488-4D 25,000 4,520 2.5Allendale Appleton 21,000 5,400 32.5Anderson Anderson County (Starr) 43,300 12,905 29.8Anderson Clemson University 25,000 3,290 22.0Anderson Enterprise Material Handling 68,619 51,343 21.8Anderson Greenpointe 57,000 26,970 27.1Anderson Owens Corning Fiberglass n 14,911 49.7Bamberg Bamberg County 44,441 4,663 59.0Barnwell Barnwell County 32,000 7,015 24.0Barnwell Savannah River Site 632-G 120,000 43,754 40.0Beaufort Barnwell Resources, Inc 156,000 20,247 48.0Berkeley Berkeley County 214,703 49,981 2.0Berkeley Kapstone Charleston Kraft n 134,789 53.9Berkeley Santee Cooper (Cross Generating Station)) 1,394,600 790,933 2.5Calhoun Calhoun County 13,500 2,877 7.2Calhoun DAK Americas (Formerly Eastman Chemical) n 1,155 13.2Charleston Charleston County Bees Ferry 200,000 25,000 0.3Charleston Spring Grove Environmental 500,000 107,668 129.8Cherokee Cherokee County 20,000 12,820 l
Cherokee City of Gaffney 8,930 2,988 31.9Chester Bennett Industrial 205,200 31,593 8.8Chester Chester County 4,800 1,364 25.6Chesterfield Furr Facility 32,700 32,269 56.0Clarendon Clarendon County 60,000 9,758 1.0Clarendon Georgia Pacific – Alcolu 0 0 3.0Colleton Colleton County 30,000 16,876 23.0Darlington Darlington County 65,200 14,116 94.0Darlington Sonoco Products Company n 21,422 1.0Dillon Dillon County 11,700 7,982 6.2Dorchester Carolina Landfill LLC 120,120 106,838 33.1Florence Florence County 25,000 50 20.0
Florence Lake City, City of 12,900 2,490 101.7Florence Pee Dee Environmental Services, Inc 892,000 81,098 39.2Florence RockTenn 103,032 43,950 11.2Georgetown Georgetown County 51,000 18,412 5.0Georgetown International Paper 120,000 1,910 4.2Greenville General Electric 3,500 91 l
Greenville Greenville LT (Republic) 200,000 12,185 5.0Greenville Twin Chimneys/Greenville County 87,157 82,968 18.0Greenville WCA Shiloh 128,000 46,420 11.4Greenwood Greenwood County 47,984 7,378 6.0
l Did Not Report n No Permitted Disposal Rate Continued on the following page
TABLE 9.13: Class 2 Landfill Disposal and Estimated Remaining Life

South Carolina Solid Waste Management Annual Report for Fiscal Year 2013 101
COUNTY LANDFILL
PERMITTED ANNUAL RATE OF DISPOSAL
IN TONS
FY13 DISPOSAL IN TONS
ESTIMATED REMAINING LIFE
OF FACILITY IN YEARS
Hampton Hampton County 21,000 3,276 6.0
Horry Horry County SWA 250,000 89,018 5.9
Jasper Oakwood 188,000 52,112 21.6
Jasper Snake Road 113,200 0 l
Kershaw Kershaw County 30,000 29,720 28.0
Kershaw Loveless & Loveless, Inc. 200,000 145,842 197.0
Kershaw Pine Hill 170,000 67,116 101.2
Lancaster Mining Road 200,000 50,564 26.5
Laurens City of Clinton 13,000 81 34.6
Laurens Curry Lake C&D Landfill 241,591 64,706 6.8
Laurens Hwy. 92 154,000 0 l
Lexington Carolina Materials 240,000 78,033 17.9
Lexington Hwy. 378 50,000 0 l
Lexington Lexington County (Edmund) 216,000 54,863 11.0
Lexington S&T Recycling LLC 7,200 4,000 50.0
Lexington SCE&G McMeekin Station n 1,238 5.0
Lexington Southeastern Associates 120,000 37,478 10.7
Marion Hwy. 908 206,540 0 l
Marion Marion County 135,350 9,682 11.3
Marion Sandlands 206,500 25,280 40.0
Marlboro Domtar Paper 12,000 2,417 57.4
Newberry Southeastern Resource Recovery 208,000 27,651 39.8
Oconee Duke Power - Oconee Nuclear Station Landfill 2,000 0 25.4
Oconee Oconee County 37,615 16,024 l
Orangeburg Orangeburg County 81,000 15,994 9.8
Orangeburg SCE&G Cope Station n 166,861 108.3
Orangeburg Roseburg Forest Products n 0 l
Pickens Hwy 93 0 0 l
Pickens Pickens County 20,000 14,367 2.7
Richland Carolina Grading, Inc. 122,400 1 150.2
Richland International Paper 119,000 0 14.9
Richland Intertape Polymer Group 10,000 0 30.0
Richland Richland County C&D and LCD Landfill 200,000 30,751 31.3
Spartanburg Kohler Company n 5,789 97.1
Spartanburg Spartanburg County 80,000 58,378 6.7
Spartanburg Tindall Special Waste n 0 l
Sumter Sumter County 51,332 32,800 6.0
Williamsburg DSM Nutritional Products, LLC 80,000 2,689 1.8
Williamsburg Williamsburg County 4,370 4,774 3,462.3
York Coltharp 70,000 52,680 3.3
York Duke Power - Catawba Nuclear Station n 81 14.3
York Resolute Forest Products n 13,963 8.3
York Rogers 2,400 2,450 10.0
York Vernsdale Road 58,300 0 l
York York County 96,632 31,773 18.5
TOTAL 3,203,014 75.31
NOTE: This information is provided in months and converted to years. 1. Average n No Permitted Disposal Rate l Did Not Report
TABLE 9.13: Class 2 Landfill Disposal and Estimated Remaining Life (continued)

102 South Carolina Solid Waste Management Annual Report for Fiscal Year 2013
The S.C. Solid Waste Policy and Management Act of 1991 – S.C. Code of Laws § 44-96-60 – requires the S.C Department of Health and Environmental Control to provide an inventory of solid waste facilities. In fiscal year (FY) 2013 (July 1, 2012 to June 30, 2013), there were 410 solid waste facilities operating under the authority of 15 types of permits in South Carolina. Some permits apply to multiple facility types. For example, there are six types of solid waste processing facilities as well as three types of landfills and transfer stations. Of the 15 types of solid waste permits, only three are allowed to accept MSW – Class 3 landfills, Class 3 transfer stations and Class 3 processing facilities.
Overall in FY13, there were 174 landfills, 114 composting and wood-grinding facilities, 40 transfer stations, 21 processing facilities, 21 waste tire facilities, 18 used oil facilities, 11 land-application facilities, six incinerators (all Class 1 land-clearing debris) four research, development and demonstration facilities and one soil treatment facility.
Tables 10.2 to 10.9 provide a complete list of the permitted facilities at the close of FY13. The tables include (when available): the facility name; county in which the facility is located; permitted rate of disposal or storage; and the tons received.
TABLE 10.1: Permitted Rate Legend
CYPY Cubic Yards Per Year
GPY Gallons Per Year
TPA Tons Per Acre
TPD Tons Per Day
TPY Tons Per Year
COUNTY FACILITY NAME PERMITTED RATE
TONS RECEIVED
CLASS 1 TRANSFER STATIONS
Greenville Greenville, City of 500 TPD 13,401
CLASS 2 TRANSFER STATIONS
Charleston Mt. Pleasant, Town of 100 TPD 16,732
Colleton Clean Management Container, Inc.
60 TPD 1,078
Dorchester Summerville, Town of 200 TPD 13,584
Greenville MRR 500 TPD 13,950
Spartanburg J&B (Broadcast Drive) 140 TPD 47,117
CLASS 3 TRANSFER STATIONS
Anderson Anderson-Oconee 1,500 TPD 0
Anderson Pendelton 500 TPD 22,398
Bamberg Bamberg County 250 TPD 8,938
Barnwell Barnwell County 200 TPD 13,593
Beaufort Haig Point 15 TPD 204
Beaufort Melrose 15 TPD l
Charleston Carolina Processing and Recycling
2,000 TPD 154,618
Cherokee Cherokee County 800 TPD 50,655
Chester Chester County 200 TPD 14,580
Clarendon Clarendon County 250 TPD 0
Colleton Colleton County 115 TPD 32,887
Darlington Darlington County 95 TPD 17,800
Dillon Dillon County 250 TPD 39,073
COUNTY FACILITY NAME PERMITTED RATE
TONS RECEIVED
Edgefield Tri-County SWA 320 TPD 29,231
Fairfield Fairfield 320 TPD 14,217
Florence Florence 740 TPD 108,932
Greenville Blackberry Valley 150 TPD 4,172
Greenville Greer, City of 110 TPD 0
Horry Myrtle Beach, City of 684 TPD 19,395
Horry North Myrtle Beach, City of 250 TPD 12,754
Lancaster Lancaster, City of 827 TPD 24,666
Laurens Laurens County 800 TPD 30,710
Lexington Lexington County 592 TPD 100,899
Marlboro Bennetsville, City of 50 TPD 5,128
Newberry Newberry County 400 TPD 28,523
Oconee Seneca 300 TPD 36,982
Orangeburg Orangeburg County 300 TPD 55,395
Pickens Pickens County 400 TPD 36,481
Spartanburg Spartanburg, City of 200 TPD 752
Spartanburg Greer 1200 TPD 62,941
Sumter Sumter 400 TPD 59,103
Union Union, City 21 TPD 2,897
York Container Corporation of Carolina
1 TPD 87,747
York York County 800 TPD 122,022
l Did Not Report
TABLE 10.2: Permitted Solid Waste Transfer Stations in FY13
SECTION
10Permitted Solid WasteFacilities

South Carolina Solid Waste Management Annual Report for Fiscal Year 2013 103
COUNTY FACILITY NAME PERMITTED DISPOSAL RATE
TONS DISPOSED
CLASS 1 LANDFILLS
Abbeville HR Garrett (Dobbins) 15,000 TPY 0
Abbeville Ron Hughes 3,000 TPY 450
Aiken Gary Miller 20,000 TPY 4,534
Aiken GL Williams 2,500 TPY 0
Aiken Jack Wood 520 TPY 75
Aiken John Swearinger 1,000 TPY 30
Aiken Mike Williams Construction 15,000 TPY 2,556
Aiken Randy Hill 4,800 TPY 1,224
Anderson Anderson County (Starr) 26,000 TPY 15,234
Anderson Broadway 860 TPY 719
Anderson Belton, City of 3,060 TPY 2,480
Anderson Miller Construction Company 4,500 TPY 36
Berkeley Berkeley County 15,000 TPY 4,217
Edgefield Pioneer Clearing 20,000 TPY 5,994
Florence Timmonsville, Town of 360 TPY 392
Greenville HR Garrett - Moon/Henderson 4,000 TPY 0
Greenville Norris 250 TPY 60
Greenville Trotter n l
Greenwood BHC Trucking 6,500 TPY 520
Jasper Jasper County 120,000 TPY 252
Lancaster Lancaster County 3,500 TPY 3,488
Lancaster Heath Springs, Town of n 0
Laurens HR Garrett (Henderson Road) 20,000 TPY 250
Laurens HR Garrett (Lisbon Road) 15,000 TPY 0
Lexington 378 Recycling 100,000 TPY 1,108
Lexington Sligh Properties 100 TPY 0
Lexington Southeastern Disposal 11,600 TPY 1,557
Lexington Batesburg-Leesville, Town of 2,000 TPY 591
McCormick McCormick, Town of 36 TPY 0
Newberry Metts 3,000 TPY 850
COUNTY FACILITY NAME PERMITTED DISPOSAL RATE
TONS DISPOSED
Oconee Clemson-Seneca 3,000 TPY 1,260
Oconee Northwest Grading Company 600 TPY 5
Oconee Well’s Highway 15,000 TPY 362
Oconee Wood 2,400 TPY 225
Orangeburg Spires LCD LF 90,000 TPY 0
Pickens Pine Grove Church Road 3,000 TPY 534
Pickens Walter Moody 625 TPY 3
Richland L&L Screaming Eagle Road 30,000 TPY 13,162
Richland Sharp’s Construction Company 75 TPY 75
Saluda Goff 40,000 TPY 394
Spartanburg Brown 3,000 TPY 378
Spartanburg Woodruff, City of - Landford Road
488 TPY 75
Spartanburg Cliffsdale Road 150,000 TPY 330
Spartanburg Hawkins Grading 6,000 TPY 44
Spartanburg Howard Grading and Construction
1,000 TPY 75
Spartanburg Jeff Thomas LCD LF 2,600 TPY 0
Spartanburg Par Grading and Hauling 2,600 TPY 240
Spartanburg Roger Owens 900 TPY 0
Spartanburg Skinner 10,000 TPY 10
Spartanburg T. Glen Easler n l
Spartanburg Watson 3,000 TPY 900
Union Union, City of (Eison) 2,500 TPY 2,246
Union Union, City of (Walnut) 3,600 TPY 540
York Clawson 151,200 TPY 405
York Creekside of York County 5,500 TPY 858
York McCall Deer Creek Drive 100,000 TPY 6,267
CLASS 2 LANDFILLS
A list of Class 2 landfills can be found in Table 9.13 (pages 100-101).
CLASS 3 LANDFILLS
A list of Class 3 landfills can be found in Table 9.6 (page 91).
l Did Not Report n Not Operating
TABLE 10.3: Permitted Solid Waste Landfills in FY13
COUNTY FACILITY NAME PERMITTED RATE
TONS RECEIVED
C&D DEBRIS PROCESSING FACILITIES
Anderson Ace Environmental, Inc. 10,400 TPY 7,017
Dillon Nobles Corporation, Inc. 4,368 TPY 0
Greenwood Powell’s Trash Service 124,800 CYPY 15,633
Horry Horry County SWA 72,800 TPY 11,075
CLASS 3 INDUSTRIAL PROCESSING FACILITIES
Calhoun Regulatory Solutions, Inc. 10,000 TPY 7,634
Colleton American Biomass, LLC 9,170 TPY 9,052
Colleton CMEG, Inc. 5,200 TPY 2,404
Dorchester Geocycle LLC 150,000 TPY 24,477
Dorchester Global Environmental Assurance
5,100 TPY l
Greenville VLS - Piedmont LLC 90,000 TPY 68,187
Lexington Crandall Corporation 2,491 TPY 468
Spartanburg JBR Environmental Services
52,000 TPY 15,984
Sumter Giant Resource Recovery 104,000 TPY 14,143
TABLE 10.4: Permitted Solid Waste Processing Facilities in FY13
COUNTY FACILITY NAME PERMITTED RATE
TONS RECEIVED
CLASS 3 MSW PROCESSING FACILITIES
Aiken North Augusta, City of 250 TPD 14,082
Aiken Three Rivers SWA 1,200 TPD1 800 TPD2
1,057
Greenville WCA Shiloh Landfill LLC - Piedmont
374,000 TPY 33,405
Spartanburg 220 Victor Hill 150 TPD 16,619
ORGANIC PROCESSING FACILITIES
Richland Waste 2 Energy LLC 48,000 TPY 0
C&D DEBRIS / CLASS 3 INDUSTRIAL PROCESSING FACILITIES
Lee Lee County 150 TPD3 450 TPD4
62,910
C&D DEBRIS / CLASS 3 MSW PROCESSING FACILITIES
Dorchester Pepperhill 1,200 TPD 103,751
Greenville Greenville TS and Processing
1,200 TPD 173,532
l Did Not Report 1. Class 3 2. Wood Waste 3. C&D Debris 4. Industrial Solid Waste

104 South Carolina Solid Waste Management Annual Report for Fiscal Year 2013
COUNTY FACILITY NAME TONS RECEIVED
Aiken APAC Composting Site 0Aiken APAC 421 Composting Site 823Aiken City of Aiken Public Works 0Aiken City of North Augusta 324Aiken GreenGo Recycling l
Anderson City of Anderson 0Anderson Fowler Corporation Wood Chipping
Facility0
Anderson Town of Honea Path 12Anderson Willimon 's Mulch 628Bamberg Bamberg County 534Beaufort Barnwell Resources, Inc. 2,466Beaufort Community Service Association, Inc./
Sea Pines Plantation19,800
Beaufort Hilton Head Plantation P.O.A. l
Beaufort LCR Construction - Formerly R&D Tree/Tutan Trees
l
Berkeley Berkeley County 13,657Charleston Barr Construction, Inc. 8,989Charleston Burning Acres 0Charleston County of Charleston 53,824Charleston Ladson Wood Recycling 44,213Charleston Moberry LCD Wood Chipping Facility 2,873Charleston Spring Grove LF (owned by Republic
Services of South Carolina)0
Charleston Sunnyside Farms 195Cherokee Cherokee County LF 967Cherokee Kapstone Composting 3,120Chester City of Chester 0Chester Scotts Company 45,000Chester Town of Great Falls 3,900Dillon Nobles Corporation, Inc. 0Dillon Town of Latta 790Dorchester Carolina LF, LLC 2,151Fairfield Fairfield County 900Fairfield Kaiser Enterprises 0Florence City of Florence 7,522Florence Gilbert Dr. l
Florence Rutland Chipping Facility l
Georgetown Frasier Composting 0Georgetown Georgetown County 4,025Georgetown McKenzie Wood Chipping 0Georgetown Miller Wood Processing Facility 346Greenville Dillard Excavating 135Greenville Greater Greenville Sanitation
Commission47,001
Greenville Greater Greenville Sanitation Commission 2
l
Greenville Greenworks Recycling (d.b.a. Mulch in Motion)
0
Greenville Greenworks Recycling (d.b.a. Mulch in Motion)
0
Greenville Greenworks Recycling (d.b.a. Mulch in Motion)
0
Greenville Hensons', Inc. - Greenville Wood Recycling Center
4,088
COUNTY FACILITY NAME TONS RECEIVED
Greenville Schneider Tree Care Wood Chipping Facility
7,050
Greenville SH Carter 6,965Greenville SR Mulch and Grinding
Woodchipping Facility7,264
Greenville Timbertech, Inc. 2,247Greenville Twin Chimneys Wood Grinding
Facility4,194
Hampton Hampton County 1,785Hampton Town of Yemassee l
Horry C. Owens & Son, Inc. - Composting l
Horry Coastal Reclamation l
Horry D&S Recycling, LLC - Wood Grinding 0Horry G&G Mining Company, LLC 817Horry Horry County Solid Waste Authority,
Inc.38,278
Horry Lees Landing Mine 0Horry SB Turf & Mulch, Inc. – Smith Mine l
Jasper Cleland Ridgeland Chipping Facility 3,007Jasper Coastal Debris 0Jasper Evergreen Tree & Turf 16,706
Jasper Greenspace l
Jasper LCR Consturction l
Jasper Oakwood C&D LF 7,475Kershaw Kershaw County Solid Waste 24,853Lancaster Greenway Waste Solutions l
Lancaster Lancaster County/McGill Convenience Site
3,488
Lancaster Piedmont Composting 0Lancaster Pressley Recycling, Inc. 4,736Lancaster Town of Heath Springs l
Laurens Curry Lake l
Laurens Laurens County 506Lee Lee County Composting & Recycling 15,262Lexington 378 Recycle Center l
Lexington Carolina Materials Corp. 8,278Lexington Eagle Recovery Facility 8,135Lexington Lexington County Wood Grinding
& CF5,426
Lexington S&T Grading 4,100Marion City of Marion 750Marion Marion County Woodchipping l
Marlboro Marlboro County 0Marlboro McDuffie & Son Composting Center 0Newberry County of Newberry 3,102Newberry Metts Wood Recycling Center 8,306Newberry Newberry, City of l
Oconee Clemson/Seneca l
Oconee Hutch-N-Son Wood Chipping Facility 313Oconee Oconee County Solid Waste - Seneca
LF Mulching Facility2,085
Oconee Wells Hwy. l
Pickens City of Clemson 6,204Richland City of Columbia 6,502Richland Mitch Hook Composting 1,300
l Did Not Report Continued on the following page
TABLE 10.5: Permitted Composting and Wood-grinding Facilities in FY13

South Carolina Solid Waste Management Annual Report for Fiscal Year 2013 105
TABLE 10.6: Permitted Waste Tire Facilities in FY13
COUNTY FACILITY NAME STORAGE LIMITWASTE TIRE COLLECTORS
Aiken Three Rivers Solid Waste Authority 10,000 tiresBeaufort Beaufort County Public Works 2,900 tiresCharleston Geralds Tires II, Inc. 5,200 tiresCherokee Cherokee County 1,200 tiresFairfield Fairfield County Waste Tire Collection Facility 1 1,800 tiresFairfield Fairfield County Waste Tire Collection Facility 2 n
Greenville Greenville County Public Works 3,600 tiresLancaster Lancaster County Public Works 1,850 tiresLexington Safety Kleen Systems, Inc. 2,500 tiresUnion Union County Public Works 1,200 tires
WASTE TIRE DISPOSAL FACILITY Anderson Anderson Tire WTD Facility u
WASTE TIRE PROCESSORSAiken SC Tire Processing, LLC 437,000 tiresAiken Aiken Carbon Products, LLC X
Anderson Anderson Tire Recycling 500 tiresBerkeley Viva Recycling of South Carolina, LLC 99,000 tiresCharleston Tower Tire Reclamation X
Dorchester Argos Cement, LLC – Harleyville Cement Plant 140,000 tiresEdgefield Ridge Recyclers, Inc. 45,450 tiresMarion Venture Manufacturing Company n
Pickens Pickens County Recycling Department 2,000 tiresSumter Kiln Direct Laboratory 400 tons
X Not Approved to Accept Tires n Site Inactive u No Permitted Limit NOTE: For a list of registered waste tire haulers, contact DHEC at 1-800-768-7348.
TABLE 10.7: Permitted Class 1 Incinerators in FY13
COUNTY FACILITY NAME PROCESS/STORAGE LIMIT TONS RECEIVEDBeaufort Daufuskie Site Preparation, Inc. 3,611 CY 87 Beaufort Ulmer Brothers, Inc. 500 tons 18,758 Horry Lees Landing 60 TPD n Jasper Coastal Debris, LLC 1,000 tons 2,628 Pickens Pickens County 105 TPD 5,751Richland Whitaker n n
n Site Inactive
COUNTY FACILITY NAME TONS RECEIVED
Richland Richland Composting and Wood Chipping Facility
6,000
Saluda SH Wood Waste Management 8,798Spartanburg City of Spartanburg 0Spartanburg Fairforest Wood l
Spartanburg Hensons', Inc - Mulch and More Wood Chipping Facility
2,186
Spartanburg Spartanburg County Environmental Services Wellford LF
10,111
Spartanburg Starr Wood Chipping Facility 1,817Sumter Glasscock Company (formerly SCR
Composting Site)769
COUNTY FACILITY NAME TONS RECEIVED
Sumter Sumter County Public Works 1,858Williamsburg Black River Hardwood 0Williamsburg Town of Hemingway l
York City of Rock Hill 5,620York City of Rock Hill 2 l
York City of Tega Cay WCF 670York City of Tega Cay WCF 2 l
York Deer Creek Composting 0York River Hills Community Association 3,337York Rogers Composting Facility 0York Town of Fort Mill 3,706York York County Wood Chipping Facility 3,935
l Did Not Report
TABLE 10.5: Permitted Composting and Wood-grinding Facilities in FY13 (continued)

106 South Carolina Solid Waste Management Annual Report for Fiscal Year 2013
TABLE 10.9: Other Permitted Solid Waste Facilities in FY13
COUNTY FACILITY NAME PERMITTED RATE TOTAL CAPACITY/STORAGE LIMIT
LAND APPLICATION
Charleston Dimare Johns Island, Inc. u
Charleston Wood Not Waste, LLC 5 TPA
Darlington International Paper Company – Eastover Mill u
Georgetown International Paper Company 10 TPA
Greenville Country Fresh, Inc. 10 TPA
Lancaster Bowers Fibers, Inc. 10 TPA
Laurens Norbord South Carolina, Inc. 10 TPA
Lexington JB Enterprises Resawing, Inc. 500 TPY
Lexington Mungo Company n
Marlboro Domtar Paper Company, LLC 10 TPA
Orangeburg Council Energy, Inc. 10 TPA
RESEARCH, DEVELOPMENT & DEMONSTRATION PROJECT
Anderson Anderson Regional Landfill, LLC u
Laurens Atkins – Refresh Services 36 CY
Lexington Atkins – Refresh Services 36 CY
Williamsburg ARC Technology 14,924 TPY
SOIL TREATMENT
Sumter TK Tank Services, Inc. u
TABLE 10.8: Permitted Used Oil Facilities in FY13
COUNTY FACILITY NAME PERMITTED RATE
USED OIL MARKETERS
Charleston Banks Construction Company n
Dorchester Argos Cement, LLC – Harleyville Cement Plant n
Dorchester Giant Cement Company 5,000,000 GPY
Dorchester Universal Environmental Services, LLC 333,700 GPY
Orangeburg Holcim US, Inc. u
Sumter Giant Resource Recovery u
York Atlantic Industrial Services n
USED OIL PROCESSORS
Charleston Banks Construction Company n
Charleston Delfin Used Oil Processing Facility 60,000,000 GPY
Chester Southeastern Petroleum LLC / R2 Oil, LLC u
Dorchester Universal Environmental Services, LLC 333,700 GPY
Greenville Holston Group, Inc. n
Greenville VLS - Piedmont, LLC 8,320,000 GPY
Richland Dilmar Fluid Services, Inc. Used Oil Processing Facility 125,000 GPY
Spartanburg Taylor Enterprises, Inc. 500,000 GPY
Sumter Giant Resource Recovery u
Sumter Kiln Direct Laboratory 4,000,000 GPY
York Diversified Recycling, Inc. 2,000,000 GPYn Site Inactive u No Permitted Rate
n Site Inactive u No Permitted Rate

South Carolina Solid Waste Management Annual Report for Fiscal Year 2013 107
l an outline of how the county or region expects to meet the state’s recycling and disposal goals; and
l an estimate of the cost of implementing the plan.
DHEC considers local plans when making consistency determinations for solid waste facilities. Because the local government is responsible for providing management of all solid waste, the local plan should address all solid waste streams, applicable facility types and methods of treatment.
DHEC encourages counties and regions to:
l review their solid waste management plan periodically to assess the impact of regulatory changes, new permits, population changes and waste generation trends and update or revise their plan as needed;
l provide opportunities for cities, towns, the public and other affected parties within the county or region to have input in the plan revisions; and
l consult the most recent copy of the “South Carolina Solid Waste Management Annual Report” for updated solid waste data.
COUNTY/REGIONAL SOLID WASTE MANAGEMENT PLANS
The Act – S.C. Code of Laws § 44-96-80 – requires each county to have a comprehensive solid waste management plan to ensure adequate disposal capacity. Counties may create and implement regional solid waste management plans.
These local plans – which also are required to address a 20-year planning period – must be consistent with the State Plan and include:
l the amount and type of solid waste projected to be disposed of within the county or region;
l an estimate of the current capacity within that county or region to manage its solid waste;
l an analysis of existing and new facilities that will be needed to manage the solid waste generated;
l a description of the recycling program including material collected and the type of public education/outreach programs offered;
The S.C. Solid Waste Policy and Management Act of 1991 (Act) – S.C. Code of Laws § 44-96-60 and 44-96-80 – requires the S.C. Department of Health and Environmental Control (DHEC) to develop a state solid waste management plan (State Plan) and for county governments or regions to develop plans that are consistent with the State Plan.
This section outlines the planning and other responsibilities of state and county governments.
The State Plan is required to address a 20-year planning period and include:
l an inventory of the amount and type of solid waste currently being disposed of;
l solid waste disposal projections;
l an analysis of the types of facilities that will be needed to manage solid waste;
SECTION
11Solid Waste Planning
The Act requires each county
to have a comprehensive
solid waste management
plan.
l an estimate of the current capacity in the state to manage solid waste;
l an analysis and evaluation of current practices;
l a description of the way and recommendations on how the state can meet its waste reduction and recycling goals; and
l a description of public education programs developed in partnership with local governments, businesses, industry and other organizations to – among other objectives – promote waste reduction and recycling.
The State Plan was adopted in 1992 and revised in 1999. In 2006, a revision was made to establish limits for facilities that use emerging technologies. This annual report is an update to the State Plan as required by the Act.
Local Planning Responsibilities

108 South Carolina Solid Waste Management Annual Report for Fiscal Year 2013
Beyond the State Plan, DHEC has additional responsibilities including:
l determining consistency with state and local or regional solid waste management plans;
l determining consistency with local zoning and other local land-use ordinances; and
l approving Demonstration of Need (DON) for certain solid waste management facilities.
CONSISTENCY DETERMINATIONS
Before a solid waste management facility can be permitted, it must be determined to be consistent with the State Plan, the local county or regional solid waste management plan as well as local zoning and land-use requirements.
Although a county or region is responsible for developing the local solid waste management plan, zoning ordinances and/or other land-use ordinances, DHEC is responsible for making an independent consistency determination.
DHEC looks at many factors when reviewing the county/regional plan and making its consistency decision. Chiefly, DHEC considers the amount of
waste that the county or region is projected to generate during the 20-year planning period and reviews the county or region’s proposed means of managing that waste through a combination of transfer, disposal, incineration and/or recycling.
DEMONSTRATION OF NEED (DON)
DON refers to the criteria established for the geographical placement and allowable annual disposal rate of new and expanding solid waste management facilities. The original DON regulation was put into effect in June 2000. On June 26, 2009, a revision to Regulation 61-107.17 SWM: Demonstration-of-Need became effective.
The DON regulation addresses commercial Class 3 landfills, commercial Class 2 landfills, commercial solid waste incinerators that incinerate waste other than wood waste or yard trimmings and commercial solid waste processing facilities that process waste destined for disposal at Class 3 landfills. The DON regulation stipulates that where there are at least two commercial solid waste management facilities of the same type within a planning area, no new facility is allowed.
State Planning Responsibilities
DHEC is responsible
for making an independent consistency
determination.
TABLE 11.1: DON Requirements for New Solid Waste Management (SWM) Facilities
COMMERCIAL SWM FACILITY
PLANNING AREA AROUND
FACILITY
NUMBER OF FACILITIES ALLOWED WITHIN PLANNING AREA
THROUGHPUT/ANNUAL TONNAGE CALCULATION FOR NEW FACILITIES
Class 2 Landfills 20 miles 2 100 percent of host county tonnage plus 30 percent of generation from other counties in planning area
Class 3 Landfills 75 miles 2 Total of 100 percent of host county tonnage and 50 percent of tonnage of counties in planning area without a Class 3 landfill; cannot exceed 30 percent of total state generation
Solid Waste Incinerators
75 miles 2 Based on the manufacturer’s design of the incinerator not to exceed 600 tons per day
Solid Waste Processing Facilities
75 miles 2 Total of 100 percent of host county tonnage and 50 percent of tonnage of other counties in planning area
Non-commercial FacilitiesThe regulation defines a facility as being “non-commercial” if it manages only the solid waste generated in the course of normal operations on property under the same ownership or control as the facility itself (i.e., “on site”). Non-commercial facilities are not required to demonstrate need.

South Carolina Solid Waste Management Annual Report for Fiscal Year 2013 109
CLASS 2 LANDFILLS
Class 2 landfills accept land-clearing debris, certain construction and demolition debris, certain household furniture and under certain conditions, animal carcasses. Class 2 landfills have a 20-mile planning radius. (See pages 114-115 for a map detailing Class 2 landfill locations and planning radii.)
To calculate allowable annual disposal at new Class 2 landfills, DHEC uses 100 percent of the host county generation and 30 percent of the generation in other counties within the planning area. Tonnage increases for existing Class 2 facilities are allowed only if the facility is operating within 20 percent of its permitted amount, (i.e., the amount of waste disposed per year is 80 percent or more of the annual permitted capacity).
If a Class 2 landfill qualifies for an increase, it can receive the lesser of the amount that disposal in the planning area has increased since the facility last received a permitted increase or 50,000 tons.
Class 2 landfills operating on the effective date of the regulation are allowed variances from certain DON requirements with respect to replacement facilities, tonnage increases and expansions.
See Table 11.2 on pages 110-111 for Class 2 waste generated for disposal by county for use in DON.
CLASS 3 LANDFILLS
Class 3 landfills accept municipal solid waste (MSW), industrial solid waste, sewage sludge, non-hazardous MSW incinerator ash and other non-hazardous waste. For new commercial Class 3 landfills, allowable tonnage is calculated using 100 percent of the host county generation and 50 percent of other counties’ generation within the planning area (none is counted from other counties that have an existing Class 3 landfill). Class 3 landfills have a 75-mile planning radius. (See pages 116-117 for a map detailing Class 3 landfill locations and planning radii.)
The yearly disposal rate at an existing landfill is allowed to increase only if the facility is within 20 percent of its permitted disposal rate (i.e., the amount of waste disposed per year is 80 percent or more of the annual permitted capacity). If a Class 3 landfill qualifies for an increase, it can receive the lesser of the amount that disposal in South Carolina has increased since the facility last received a permitted increase or 150,000 tons.
In addition, the allowable yearly disposal rate at any Class 3 landfill cannot exceed 30 percent of the total solid waste generated in South Carolina that is destined for disposal in Class 3 landfills. Class 3 landfills operating on the effective date of the regulation are allowed variances from certain DON requirements. See Table 11.3 on pages 112-113 for Class 3 waste generated for disposal by county for use in DON.
SOLID WASTE INCINERATORS
The yearly throughput for a solid waste incinerator is based on the manufacturer’s design of the incinerator, but cannot exceed 600 tons per day. The DON regulation does not apply to air curtain incinerators that receive only wood waste and yard trimmings. The planning area for a solid waste incinerator is 75 miles. There are no permitted MSW incinerators in the state.
SOLID WASTE PROCESSING FACILITIES
The maximum allowable yearly throughput of a solid waste processing facility that processes waste destined for disposal at a Class 3 landfill is equal to:
l 100 percent of the solid waste destined for disposal that is generated in the host county; and
l 50 percent of the waste generated in each county other than the host county, that falls wholly or partially within the 75-mile planning radius.
See pages 118-119 for a map detailing Class 3 Solid Waste Processing Facility locations and planning radii.
The yearly disposal rate of an existing landfill is
allowed to increase only if the facility is with 20 percent of its permitted disposal rate.
Class 2 landfills accept land-clearing
debris as well as certain C&D debris
and household furniture.

110 South Carolina Solid Waste Management Annual Report for Fiscal Year 2013
TAB
LE 1
1.2
: C
lass
2 W
aste
Gen
erat
ed f
or
Dis
po
sal
in T
on
s fo
r U
se i
n D
emo
nst
rati
on
of
Nee
d
CO
UN
TYFY
01FY
02FY
03FY
04FY
05FY
06FY
07FY
08FY
09FY
10FY
11FY
12FY
13
Abb
evill
e89
676
61,
191
13,5
104,
550
6,59
73,
256
2,55
48,
180
7,04
95,
527
6,71
97,
091
Aik
en45
,631
61,5
6588
,655
88,7
1779
,529
90,1
0010
2,92
722
,443
81,5
75
78,3
4876
,801
81,3
8389
,518
Alle
ndal
e96
21,
814
3,53
41,
578
3,12
82,
354
2,17
11,
509
1,58
610
,482
3,44
03,
081
4,06
0
And
erso
n44
,258
64,3
3952
,417
37,3
1635
,817
51,3
1170
,823
63,6
7048
,079
45,2
5664
,807
72,5
0867
,203
Bam
berg
4,34
15,
796
5,78
84,
883
4,81
16,
175
6,38
112
618
,871
5,35
713
,693
5,60
95,
730
Barn
wel
l10
,736
10,6
5112
,749
8,32
910
,411
10,9
2110
,700
11,6
8611
,868
9,
481
6,60
47,
539
7,58
8
Beau
fort
107,
950
91,0
2210
2,28
712
1,46
413
9,91
614
1,75
213
0,39
186
,288
67,5
4160
,050
61,0
8165
,464
68,0
58
Berk
eley
51,0
3472
,948
58,1
3766
,023
73,2
2810
1,41
198
,516
121,
267
54,2
66
33,8
9034
,347
51,0
2542
,724
Cal
houn
7,24
35,
873
4,06
74,
139
3,55
44,
474
3,17
63,
057
3,50
1 3,
932
3,10
92,
369
3,28
8
Cha
rles
ton
199,
464
161,
872
189,
168
296,
129
281,
444
333,
332
341,
113
440,
913
239,
234
208,
667
157,
689
149,
081
207,
029
Che
roke
e8,
695
10,9
168,
586
10,6
5821
,604
16,2
409,
818
10,4
0210
,613
15,5
0923
,385
23,8
5315
,844
Che
ster
5,71
322
,572
27,8
9721
,894
4,37
373
,343
4,51
725
1,97
220
,566
21
,426
30,2
0018
,907
19,4
77
Che
ster
field
3,74
67,
545
15,1
9212
,805
16,1
9414
,738
12,1
810
11,8
5511
,946
11,3
7315
,453
24,3
20
Cla
rend
on6,
019
4,57
44,
605
5,50
09,
296
8,95
110
,288
7,35
210
,194
9,49
110
,086
10,0
869,
800
Col
leto
n14
,846
14,8
4213
,295
13,1
5713
,823
17,4
3920
,900
23,6
6819
,522
21,5
7716
,966
15,5
0117
,066
Dar
lingt
on15
,118
21,2
5219
,662
12,6
1417
,358
16,2
6416
,755
11,7
2116
,100
23
,934
24,6
8120
,946
19,0
88
Dill
on9,
951
11,3
5910
,096
11,4
1240
,344
8,35
210
,549
11,2
3311
,310
8,34
210
,263
9,81
77,
729
Dor
ches
ter
17,7
0616
,069
10,0
440
63,9
1077
,295
82,0
9994
,641
57,6
12
24,1
3033
,078
36,2
4938
,540
Edge
field
3,79
02,
811
3,97
23,
442
3,24
413
,116
12,4
796,
119
9,64
45,
145
2,91
96,
015
8,69
3
Fair
field
040
731
112
620
939
928
478
034
385
91,
510
614
1,10
3
Flor
ence
67,7
2169
,005
68,5
3493
,715
34,1
1427
,002
54,0
6932
3,91
796
,557
12
1,92
870
,964
70,2
7494
,574
Geo
rget
own
27,7
7026
,820
22,1
1433
,680
30,0
8751
,581
34,2
7049
,886
27,7
65
26,5
5822
,886
17,4
3124
,573
Gre
envi
lle13
6,40
613
0,38
114
8,15
287
,157
142,
780
163,
834
161,
738
210,
924
168,
463
145,
991
185,
015
165,
827
193,
009

South Carolina Solid Waste Management Annual Report for Fiscal Year 2013 111
CO
UN
TYFY
01FY
02FY
03FY
04FY
05FY
06FY
07FY
08FY
09FY
10FY
11FY
12FY
13
Gre
enw
ood
2,93
28,
343
12,2
838,
908
14,6
9620
,174
26,7
1421
,063
28,9
0813
,838
29,5
879,
221
8,84
3
Ham
pton
3,34
95,
714
3,22
17,
444
8,59
07,
786
8,99
37,
462
10,4
663,
001
3,90
12,
837
3,40
8
Hor
ry12
1,94
911
6,95
413
5,64
817
0,85
615
5,67
622
6,67
233
2,58
314
1,00
710
9,95
382
,451
80,6
8790
,370
90,0
65
Jasp
er76
86,
868
1,02
881
217
63,
681
4,90
75,
837
3,13
73,
047
3,88
53,
500
4,32
1
Kers
haw
23,2
0831
,193
30,4
5233
,277
41,9
2552
,688
42,3
4641
,652
41,0
2695
,973
38,3
4334
,417
41,4
15
Lanc
aste
r46
,769
24,7
0634
,499
34,0
0931
,067
26,7
9827
,344
65,8
0129
,834
47
,791
46,6
9957
,214
55,4
38
Laur
ens
7,46
48,
875
17,1
5619
,634
6,65
511
,435
16,8
6012
,811
7,35
99,
990
13,9
8218
,761
13,1
54
Lee
00
00
00
00
00
152
810
Lexi
ngto
n22
1,93
422
5,12
226
3,04
123
9,92
424
6,78
523
7,17
821
7,46
522
3,50
315
3,66
5 14
1,97
513
9,90
213
0,36
616
6,32
2
Mar
ion
9,23
87,
055
10,9
8216
,493
29,8
1862
,965
31,2
9919
,419
18,8
7512
,642
14,4
597,
846
11,7
12
Mar
lbor
o54
01,
059
1,03
41,
040
845
1,21
22,
491
010
,486
7,
810
10,2
197,
850
7,36
6
McC
orm
ick
1,08
693
782
095
71,
335
4,40
91,
669
1,00
91,
023
1,61
634
957
282
0
New
berr
y20
551
763
299
71,
098
2,26
31,
219
10,5
777,
024
7,65
77,
430
8,33
98,
675
Oco
nee
27,0
6424
,291
23,5
7729
,279
19,8
6723
,838
26,3
8524
,337
22,5
7720
,181
19,7
5372
16,1
09
Ora
ngeb
urg
23,6
9520
,213
21,5
7924
,097
20,9
1526
,419
27,3
6050
,573
29,9
22
24,5
8120
,653
17,6
9317
,362
Pick
ens
18,4
9620
,097
30,3
2323
,880
34,7
5417
,951
20,8
0721
,867
19,8
0615
,726
17,2
2918
,417
15,5
47
Rich
land
205,
404
190,
545
220,
088
206,
332
216,
945
216,
246
196,
701
198,
115
199,
056
123,
076
217,
915
199,
102
225,
910
Salu
da1,
700
2,02
81,
116
1,17
61,
149
1,96
01,
465
1,61
41,
601
1,52
141
637
681
8
Spar
tanb
urg
91,7
1710
3,90
439
,812
71,5
5371
,917
71,0
4772
,161
80,2
1765
,229
60,4
7991
,667
94,3
5989
,547
Sum
ter
49,0
3948
,489
51,9
6342
,747
38,9
3455
,714
50,6
2550
,656
4,19
346
,213
43,2
2844
,695
45,3
11
Uni
on5,
892
20,1
782,
928
1,01
81,
236
8,42
12
63,
082
3,79
05,
273
7,41
62,
595
Will
iam
sbur
g4,
828
4,10
63,
818
2,58
52,
386
7,22
06,
491
3,28
03,
860
2,78
64,
065
4,59
45,
339
York
78,1
7467
,808
50,7
1899
,277
98,0
2997
,493
125,
969
113,
171
74,2
02
76,6
0381
,573
115,
906
76,0
77
TOTA
L1,
735,
447
1,75
4,20
11,
827,
171
1,98
4,54
32,
078,
522
2,42
0,55
12,
441,
257
2,85
0,10
51,
840,
529
1,70
2,09
51,
761,
791
1,72
9,76
01,
882,
260
NO
TE: T
his
data
is u
sed
for
calc
ulat
ing
annu
al t
onna
ge li
mit
s as
rel
ated
to
R.61
-107
.17
– ef
fect
ive
June
26,
200
9. T
he h
isto
rica
l dat
a re
port
ed h
as b
een
adju
sted
to
refl
ect
chan
ges
in t
he D
ON
reg
ulat
ion.

112 South Carolina Solid Waste Management Annual Report for Fiscal Year 2013
TAB
LE 1
1.3
: C
lass
3 W
aste
Gen
erat
ed f
or
Dis
po
sal
in T
on
s fo
r U
se i
n D
emo
nst
rati
on
of
Nee
d
CO
UN
TYFY
01FY
02FY
03FY
04FY
05FY
06FY
07FY
08FY
09FY
10FY
11FY
12FY
13
Abb
evill
e25
,879
23,7
9225
,909
18,8
1715
,836
17,2
1917
,959
15,6
1113
,987
13
,874
15,8
4415
,874
17,4
16
Aik
en12
1,89
710
1,19
311
1,93
514
9,51
513
1,28
510
1,56
312
5,79
612
7,49
1 1
20,0
5811
4,55
613
1,59
613
3,03
011
0,03
9
Alle
ndal
e6,
297
6,54
96,
540
5,90
36,
990
5,81
310
,990
7,93
27,
209
6,52
26,
268
6,59
35,
344
And
erso
n13
6,77
017
0,38
714
8,23
214
8,84
916
1,61
013
8,78
313
0,50
913
5,79
411
5,66
7 13
0,95
513
1,03
415
6,56
711
0,99
4
Bam
berg
19,6
4417
,911
13,7
6811
,652
11,2
8011
,857
10,6
6510
,799
10,4
57
9,46
19,
505
9,22
19,
610
Barn
wel
l20
,570
71,9
2418
,247
19,3
7320
,128
17,6
8319
,488
17,4
7415
,705
15
,753
14,8
3913
,870
14,1
84
Beau
fort
139,
979
142,
337
151,
624
167,
383
181,
849
199,
029
177,
278
163,
868
177,
291
148,
470
149,
520
140,
405
141,
785
Berk
eley
155,
071
178,
342
309,
398
353,
891
314,
269
379,
387
636,
603
501,
690
339,
890
324,
793
310,
367
329,
172
321,
016
Cal
houn
3,93
810
,183
9,65
98,
660
12,1
4310
,615
11,1
0911
,100
15,3
31
23,0
6219
,165
18,2
9923
,926
Cha
rles
ton
159,
547
166,
317
191,
932
391,
841
285,
117
256,
089
281,
938
270,
676
274,
636
325,
997
497,
192
646,
461
416,
222
Che
roke
e86
,395
78,5
1973
,943
71,3
3271
,145
69,1
0688
,008
52,1
3777
,652
85
,767
143,
803
97,1
2186
,507
Che
ster
31,5
4358
,377
44,4
3537
,070
37,8
4743
,496
33,3
2363
,758
30,1
15
26,2
9723
,799
27,7
8520
,945
Che
ster
field
24,8
4222
,951
24,5
1421
,941
20,2
0617
,543
15,1
6815
,428
13,5
72
18,3
3519
,282
18,6
1516
,002
Cla
rend
on32
,148
14,2
2210
,932
18,4
038,
112
10,6
7116
,377
16,3
6415
,514
15
,644
14,9
8814
,271
13,6
49
Col
leto
n19
,762
53,0
9231
,938
35,0
7138
,826
39,0
1439
,358
44,6
8338
,032
10
0,13
735
,435
32,4
8532
,421
Dar
lingt
on51
,138
45,9
2068
,953
52,0
5751
,823
47,3
3370
,796
88,0
0890
,953
38
,461
37,7
3655
,183
40,2
27
Dill
on38
,571
37,7
9549
,694
26,9
7034
,416
31,4
9238
,616
35,3
1725
,246
24
,321
20,6
9826
,619
20,0
06
Dor
ches
ter
65,1
4371
,509
97,9
3416
3,93
013
9,40
514
9,20
212
1,36
612
5,82
612
3,10
5 98
,774
89,4
2380
,904
81,3
70
Edge
field
14,8
2214
,774
14,8
7013
,969
13,4
0613
,371
14,4
7315
,531
15,1
58
13,1
1912
,096
14,5
3212
,431
Fair
field
21,0
6519
,664
23,0
7622
,546
21,9
8120
,721
22,0
4121
,306
22,9
27
21,2
1420
,804
21,4
3824
,338
Flor
ence
150,
094
148,
367
151,
123
152,
909
154,
874
149,
919
135,
663
139,
811
165,
766
132,
582
237,
630
143,
999
140,
552
Geo
rget
own
59,6
5571
,720
70,5
3149
,736
50,7
0954
,719
51,8
7042
,675
43,0
11
48,4
4658
,651
54,8
0661
,184
Gre
envi
lle52
6,46
748
9,21
661
3,41
758
9,20
467
3,24
967
4,57
468
2,51
160
2,82
5 5
26,4
0245
1,34
443
3,49
043
0,66
653
3,13
8

South Carolina Solid Waste Management Annual Report for Fiscal Year 2013 113
CO
UN
TYFY
01FY
02FY
03FY
04FY
05FY
06FY
07FY
08FY
09FY
10FY
11FY
12FY
13
Gre
enw
ood
105,
728
93,6
9991
,719
109,
407
120,
320
117,
341
112,
858
102,
693
84,8
63
98,9
6379
,053
82,2
0695
,435
Ham
pton
20,2
0320
,656
22,0
3918
,188
22,9
9117
,322
18,6
0918
,266
12,5
61
13,1
7911
,738
11,3
4711
,664
Hor
ry19
9,41
019
3,57
321
2,68
622
7,46
922
2,93
523
7,58
224
6,12
624
8,98
823
5,31
4 22
8,84
322
7,39
522
3,91
522
5,74
4
Jasp
er15
,351
15,4
5717
,692
27,0
3922
,100
22,0
5032
,139
32,9
6630
,904
18
,928
13,5
0819
,992
19,7
06
Kers
haw
37,5
7539
,716
45,5
9740
,162
44,2
3343
,368
41,9
0437
,705
37,2
40
43,6
9133
,342
45,0
4036
,894
Lanc
aste
r30
,175
36,5
6535
,088
35,6
2331
,561
33,8
4230
,489
34,1
1430
,054
28
,506
30,6
1930
,151
27,4
94
Laur
ens
51,1
3350
,477
57,9
4051
,636
73,0
9049
,210
42,4
7539
,671
42,9
78
45,5
8648
,658
39,2
0530
,929
Lee
19,2
4527
,034
14,6
7014
,981
15,4
2514
,737
14,9
4115
,837
14,6
37
71,9
6582
,942
97,2
7289
,214
Lexi
ngto
n12
8,95
117
2,85
622
1,32
325
6,22
617
1,69
219
3,26
819
0,58
318
8,29
517
1,12
4 16
9,82
016
0,94
118
4,18
820
7,56
3
Mar
ion
13,8
3016
,585
4,79
621
,673
14,3
8021
,683
26,1
4130
,454
21,2
41
18,7
3317
,015
8,87
916
,576
Mar
lbor
o10
,401
16,7
6315
,289
21,8
1512
,004
13,2
7612
,332
10,3
1412
,063
14
,913
15,5
4714
,653
17,0
82
McC
orm
ick
5,33
34,
682
11,8
695,
183
4,85
84,
524
4,50
54,
232
4,26
4 5,
120
5,09
94,
611
4,21
5
New
berr
y44
,292
47,6
6247
,893
48,5
9150
,420
49,9
5148
,603
39,3
3040
,574
41
,072
38,6
5737
,991
40,4
22
Oco
nee
50,4
0046
,749
45,2
6045
,533
49,3
6853
,302
56,4
0854
,865
49,3
38
51,2
6949
,056
50,7
6743
,655
Ora
ngeb
urg
85,6
7784
,278
98,3
5092
,969
94,3
8210
0,98
889
,386
79,2
4575
,717
70
,448
72,9
8390
,870
114,
552
Pick
ens
58,5
7256
,669
56,9
3859
,873
54,9
6651
,255
58,1
0452
,715
53,4
94
52,2
5757
,259
55,2
5951
,939
Rich
land
342,
760
323,
740
327,
966
349,
087
341,
907
376,
435
354,
977
353,
135
348,
475
457,
204
376,
749
360,
689
330,
810
Salu
da8,
702
8,61
99,
197
9,68
414
,687
11,8
7011
,116
11,0
259,
680
12,6
7322
,074
42,5
348,
052
Spar
tanb
urg
314,
706
307,
298
418,
942
373,
060
351,
908
381,
084
381,
750
484,
612
412,
680
476,
809
562,
235
452,
484
389,
482
Sum
ter
96,0
2395
,752
119,
698
135,
220
156,
345
163,
056
108,
801
101,
854
94,4
52
86,8
2484
,673
78,3
0476
,653
Uni
on17
,241
15,7
9412
,835
18,9
8828
,309
14,1
7818
,775
19,8
0330
,702
20
,335
20,2
1721
,802
18,7
31
Will
iam
sbur
g36
,385
26,9
6626
,100
25,5
8228
,259
39,0
4545
,506
79,6
9852
,614
34
,282
17,8
429,
620
11,1
76
York
144,
255
139,
609
147,
720
152,
150
166,
059
161,
476
167,
139
160,
675
172,
941
148,
718
141,
161
143,
618
215,
786
TOTA
L3,
747,
585
3,85
6,26
04,
324,
211
4,67
1,16
14,
548,
705
4,63
0,04
24,
865,
572
4,72
6,59
64,
315,
594
4,39
8,02
24,
601,
925
4,59
3,31
04,
337,
078
NO
TE: T
his
data
is u
sed
for
calc
ulat
ing
annu
al t
onna
ge li
mit
s as
rel
ated
to
R.61
-107
.17
– ef
fect
ive
June
26,
200
9. T
he h
isto
rica
l dat
a re
port
ed h
as b
een
adju
sted
to
refl
ect
chan
ges
in t
he D
ON
reg
ulat
ion.

114 South Carolina Solid Waste Management Annual Report for Fiscal Year 2013
LEGEND

South Carolina Solid Waste Management Annual Report for Fiscal Year 2013 115
CLASS 2l Limits waste streams as
specified in Regulation 61-107.19 SWM: Solid Waste Landfills and Structural Fill
l Waste that is characterized as less than 10 times the maximum contaminant level (MCL) and approved by DHEC may be added to the permit for acceptance/disposal
l Operational Criteria:
l Unauthorized waste may be stored at the facility for 30 days; except that putrescible waste must be removed within 72 hours
l An annual survey to determine landfill capacity used and the remaining permitted capacity may be required on a case-by-case basis
l Require scales – but exempts scales for facilities permitted for less than 10,000 tons per year and on-site landfills
l Design Criteria:
l Require settlement calculations on the bottom elevation
l Require DHEC to inspect the landfill prior to waste placement
l Set cap requirements at 2 feet of soil
l Establish certain buffers when “Notice of Intent to File a Permit Application” is published
l Require groundwater monitoring and corrective action
l Set post-closure (20 years)
l Require closure and post-closure financial assurance
SOURCE: www.scdhec.gov/environment/lwm/regs/ R61-107-19.pdf
Demonstration of Need Map
Class 2 Landfills

116 South Carolina Solid Waste Management Annual Report for Fiscal Year 2013
LEGEND
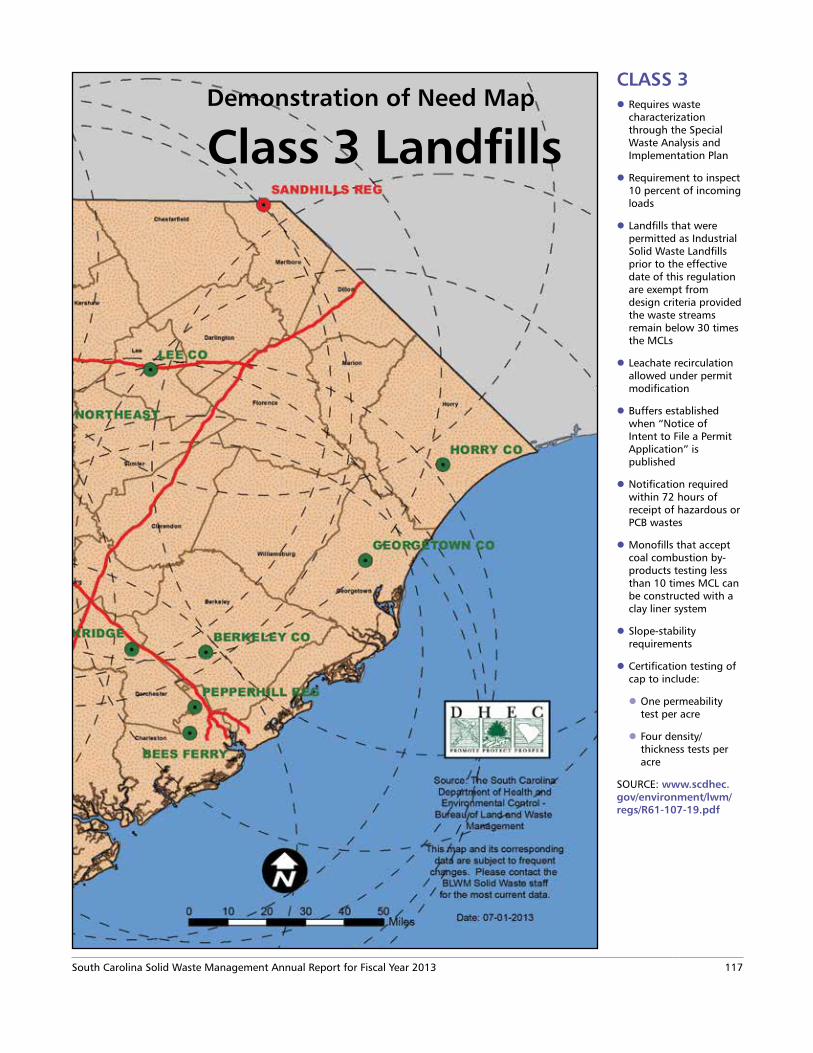
South Carolina Solid Waste Management Annual Report for Fiscal Year 2013 117
CLASS 3l Requires waste
characterization through the Special Waste Analysis and Implementation Plan
l Requirement to inspect 10 percent of incoming loads
l Landfills that were permitted as Industrial Solid Waste Landfills prior to the effective date of this regulation are exempt from design criteria provided the waste streams remain below 30 times the MCLs
l Leachate recirculation allowed under permit modification
l Buffers established when “Notice of Intent to File a Permit Application” is published
l Notification required within 72 hours of receipt of hazardous or PCB wastes
l Monofills that accept coal combustion by-products testing less than 10 times MCL can be constructed with a clay liner system
l Slope-stability requirements
l Certification testing of cap to include:
l One permeability test per acre
l Four density/thickness tests per acre
SOURCE: www.scdhec.gov/environment/lwm/regs/R61-107-19.pdf
Demonstration of Need Map
Class 3 Landfills

118 South Carolina Solid Waste Management Annual Report for Fiscal Year 2013
LEGEND

South Carolina Solid Waste Management Annual Report for Fiscal Year 2013 119
Dem
on
stration
of N
eed M
ap
Class 3 So
lid W
aste Processin
g Facilities

120 South Carolina Solid Waste Management Annual Report for Fiscal Year 2013
Airport RecyclingOne major initiative of DHEC was to provide recycling opportunities at the four busiest airports in South Carolina. Recycling containers were placed at the Columbia Metropolitan Airport in October 2008 followed by Greenville-Spartanburg International, Charleston International and Myrtle Beach International. In all, more than 100 containers were placed at these airports.
Travelers have the opportunity to recycle aluminum cans, plastic bottles and newspapers. This program reaches more than 5 million visitors a year.
Some of South Carolina’s
Curbside Recycling Programs


This report also is available at
www.scdhec.gov/recycle
PRINTED ON RECYCLED-CONTENT PAPER CR-010906 3/14