SOUTH AUSTRALIA SYSTEM STRENGTH ASSESSMENT
43
SOUTH AUSTRALIA SYSTEM STRENGTH ASSESSMENT Published: September 2017
Transcript of SOUTH AUSTRALIA SYSTEM STRENGTH ASSESSMENT
SOUTH AUSTRALIA SYSTEM STRENGTH ASSESSMENT
Published: September 2017
SOUTH AUSTRALIA SYSTEM STRENGTH ASSESSMENT
Australian Energy Market Operator Ltd ABN 94 072 010 327 www.aemo.com.au [email protected]
NEW SOUTH WALES QUEENSLAND SOUTH AUSTRALIA VICTORIA AUSTRALIAN CAPITAL TERRITORY TASMANIA WESTERN AUSTRALIA
IMPORTANT NOTICE
Purpose
AEMO has prepared this document to provide information about the levels of system strength required
to securely operate the South Australian region of the NEM with high levels of non-synchronous
generation, as at the date of publication.
Disclaimer
This document or the information in it may be subsequently updated or amended. This document does
not constitute legal or business advice, and should not be relied on as a substitute for obtaining detailed
advice about the National Electricity Law, the National Electricity Rules, or any other applicable laws,
procedures or policies. AEMO has made every effort to ensure the quality of the information in this
document but cannot guarantee its accuracy or completeness.
Accordingly, to the maximum extent permitted by law, AEMO and its officers, employees and
consultants involved in the preparation of this document:
make no representation or warranty, express or implied, as to the currency, accuracy, reliability or
completeness of the information in this document; and
are not liable (whether by reason of negligence or otherwise) for any statements or representations
in this document, or any omissions from it, or for any use or reliance on the information in it.
© 2017 Australian Energy Market Operator Limited. The material in this publication may be used in
accordance with the copyright permissions on AEMO’s website.

SOUTH AUSTRALIA SYSTEM STRENGTH ASSESSMENT
Australian Energy Market Operator Ltd ABN 94 072 010 327 www.aemo.com.au [email protected]
NEW SOUTH WALES QUEENSLAND SOUTH AUSTRALIA VICTORIA AUSTRALIAN CAPITAL TERRITORY TASMANIA WESTERN AUSTRALIA
ACRONYMS
Acronym Meaning
AC Alternating Current
AEMO Australian Energy Market Operator
AVR Automatic Voltage Regulator
CPU Central Processing Unit
DC Direct Current
EMT Electromagnetic Transient
EMTDC Electromagnetic Transient including Direct Current
FACTS Flexible AC Transmission System
GT Gas Turbine
HV High Voltage
HVDC High Voltage Direct Current
Hz Hertz (cycles per second)
kV Kilo Volt
MHRC Manitoba Hydro Research Centre
ms millisecond
MVA Mega Volt-Ampere
MVAr Mega Volt-Ampere Reactive
MW Megawatt
NEM National Electricity Market
OFGS Over Frequency Generation Shedding
OPDMS Operations and Planning Data Management System
PSCAD Power Systems Computer Aided Design
PSS Power System Stabiliser
PSS®E Power System Simulator for Engineering
pu per unit
PV Photovoltaic
QPS Quarantine Power Station
RMS Root Mean Square
RoCoF Rate of Change of Frequency
RTO Real Time Operations
SA South Australia
SCR Short Circuit Ratio
SVC Static VAr Compensator
ST Steam Turbine
TCP/IP Transmission Control Protocol / Internet Protocol
TIPSA Torrens Island A Power Station
TIPSB Torrens Island B Power Station
VAr Volt-Ampere Reactive

SOUTH AUSTRALIA SYSTEM STRENGTH ASSESSMENT
© AEMO 2017 1
EXECUTIVE SUMMARY
South Australia (SA) currently has 1,700 megawatts (MW) of transmission-connected, non-synchronous
generation registered (currently all wind generation). This installed capacity is above the average
demand for electricity from the grid (operational demand) in SA, and the instantaneous output of wind
generation in SA has exceeded 120% of demand at times1.
Periods of such high penetration of non-synchronous generation present challenges for managing
power system security, particularly in relation to maintaining adequate system strength. The strength of
the power system can be low during these periods, due to reduced levels of online conventional
synchronous generation.
On 12 December 2016, AEMO published the 2016 National Transmission Network Development Plan
(NTNDP)2. The NTNDP assessed whether further Network Support and Control Ancillary Services
(NSCAS) are required in the next five years. In the 2016 NTNDP, AEMO identified an NSCAS gap to
provide system strength in South Australia, and stated that the gap would be confirmed in 2017
following completion of more detailed analysis.
Until other viable solutions for managing system strength are available through regulatory frameworks,
AEMO has established a requirement for a minimum level of synchronous generation to remain online
in SA at all times. The minimum level of synchronous generation required to be online increases with
the output of non-synchronous generation.
Following an initial minimum requirement equivalent to the two largest synchronous machines to remain
online at all times, further detailed power system studies have identified that a more complex
arrangement of synchronous machines must remain online, to maintain sufficient system strength for
various non-synchronous generation dispatch levels. Constraints reflecting these updated requirements
were first invoked on 2 July 2017.
Investigations to date have shown that the relationship between adequate system strength and the
combination of synchronous generation online is complex. These studies do not suggest a simple
metric that will determine if the power system has sufficient system strength.
Table 1 summarises how low system strength can affect different aspects of power system security,
how these issues can be assessed, and how they can be mitigated. These findings are expected to be
expanded and refined as studies continue. Combinations of online synchronous machines that have
been identified as providing sufficient system strength for secure operation of SA are identified in
section 4.1.
Table 1 Low system strength and power system security
Issue Required performance
Assessment method required
Solution identified for inadequate performance
Is short circuit ratio* a useful metric?
Synchronous machine stability
No instability or disconnection of un-faulted synchronous machines for most onerous single credible fault
Full-scale Electromagnetic Transient (EMT)-type analysis
Additional capable synchronous machines online or equivalent capability
No
1 For example 25 April 2017 at 14:20 2 AEMO. 2016 National Transmission Network Development Plan, December 2016. Available at:
http://www.aemo.com.au/Electricity/National-Electricity-Market-NEM/Planning-and-forecasting/National-Transmission-Network- Development-Plan.

SOUTH AUSTRALIA SYSTEM STRENGTH ASSESSMENT
© AEMO 2017 2
Issue Required performance
Assessment method required
Solution identified for inadequate performance
Is short circuit ratio* a useful metric?
Non-synchronous generator stability
No instability or disconnection of un-faulted non-synchronous generation
Full-scale EMT-type analysis
Additional capable synchronous machines online or equivalent capability
Constrain output, or number of online generating units
Increased withstand capability requirements for low system strength
Can be, subject to completion of full-scale EMT-type analysis
Protection system adequacy
Protection systems reliably detect faults and correctly disconnect faulted elements within clearance times specified in the System Standards.
As determined by relevant NSP including:
Fault current calculation studies
Full-scale EMT-type analysis
Additional capable synchronous machines online or equivalent capability in the relevant location on the network
Modify protection system settings
Redesign or replace protection systems
No
* Short circuit ratio is the most widely used metric for assessing system strength. Its definition is in Appendix A.2.
AEMO is currently working to develop faster screening methods to assess aspects of power system
security related to system strength. Pending the development and verification of such screening
methods, the most effective method currently available for AEMO to assess power system security is
detailed power system simulations.
The criteria presented in this report for determining acceptable combinations of online synchronous
generators do not currently include an assessment of protection system adequacy. AEMO is working
separately with ElectraNet to address this issue. This is considered a less critical concern for system
security as transmission system protection philosophy is generally based on duplicate distance and
differential protection, with the latter generally robust to low system strength conditions.
The report is structured as follows:
Section 1: Provides background information on system strength and how it pertains to the South
Australian power system.
Section 2: Discusses the need to complete detailed power system modelling and the approach
adopted to develop an integrated model of the SA power system.
Section 3: Describes success criteria, operating scenarios and degrees of freedom considered in
the simulation case studies conducted.
Section 4: Presents conclusions from the studies completed to date, with representative
simulation graphs.
Section 5: Outlines future work identified by the current suite of studies and priority items relating
to system security.

SOUTH AUSTRALIA SYSTEM STRENGTH ASSESSMENT
© AEMO 2017 3
CONTENTS
ACRONYMS III
EXECUTIVE SUMMARY 1
1. INTRODUCTION 5
1.1 Background 5
2. MODEL DEVELOPMENT 10
2.2 Development methodology 11
2.3 Model benchmarking 11
3. SCENARIO SELECTION 13
3.1 Generation dispatch 13
3.2 Demand 15
3.3 Heywood Interconnector flow 15
3.4 Prior outages 16
3.5 Simulation degrees of freedom 16
3.6 Network disturbance 17
3.7 Success criteria 17
4. RESULTS 18
4.1 Successful scenarios 18
5. FUTURE WORK 31
5.1 Performance of distance protection relays 31
5.2 Effect of prior outages on system stability 31
5.3 Fine tuning of non-synchronous generation thresholds 31
5.4 Effect of Heywood Interconnector flow 31
5.5 Effect of future additional generation 32
5.6 System strength under islanded conditions 32
5.7 Development of fast assessment and monitoring tools 32
5.8 Response of rooftop PV and load during major system disturbances 32
5.9 PSCAD model development for all NEM regions 33
5.10 The role of synchronous condensers in providing system strength 33
APPENDIX A. SYSTEM STRENGTH-RELATED DISCUSSIONS 34
Synchronising torque 34
Short circuit ratio 35
APPENDIX B. DETAILED MODELLING METHODOLOGY 37
APPENDIX C. ACTIVE POWER SENSITIVITY 39
Reverse active power 40
SOUTH AUSTRALIA SYSTEM STRENGTH ASSESSMENT
© AEMO 2017 4
TABLES
Table 1 Low system strength and power system security 1
Table 2 Primary degrees of freedom 16
Table 3 Potential combinations of synchronous machines 16
Table 4 Summary of successful scenarios 18
Table 5 Short circuit ratio and weighted short circuit ratio calculated for all online wind farms 36
FIGURES
Figure 1 Stability variation based on grid strength and non-synchronous generation levels 6
Figure 2 Relative contributions to system strength in the SA region 8
Figure 3 Non-synchronous generation penetration ratios 8
Figure 4 Basic overview of model development 11
Figure 5 Successful 1,200 MW scenario – generator active power 19
Figure 6 Successful 1,200 MW scenario – Heywood Interconnector flow 20
Figure 7 Successful 1,200 MW scenario – key network voltages 20
Figure 8 Successful 1,200 MW scenario – key voltage phase angles 21
Figure 9 Successful 1,200 MW scenario – Heywood impedance locus 21
Figure 10 Successful 1,200 MW scenario – Heywood loss of synchronism logic 22
Figure 11 Successful 1,700 MW scenario – generator active power 23
Figure 12 Successful 1,700 MW scenario – Heywood Interconnector flow 24
Figure 13 Successful 1,700 MW scenario – key network voltages 24
Figure 14 Successful 1,700 MW scenario – key voltage phase angles 25
Figure 15 Successful 1,700 MW scenario – Heywood impedance locus 25
Figure 16 Successful 1,700 MW scenario – Heywood loss of synchronism logic 26
Figure 17 Failed scenario – generator active power 27
Figure 18 Failed scenario – Heywood Interconnector flow 28
Figure 19 Failed scenario – key network voltages 28
Figure 20 Failed scenario – key voltage phase angles 29
Figure 21 Failed scenario – Heywood impedance locus 29
Figure 22 Failed scenario – Heywood loss of synchronism logic 30
Figure 23 Power system response to a typical frequency disturbance 35
Figure 24 Synchronous generators dispatched minimum active power 39
Figure 25 Synchronous generators dispatched near maximum active power 40

SOUTH AUSTRALIA SYSTEM STRENGTH ASSESSMENT
© AEMO 2017 5
1. INTRODUCTION
Generation from non-synchronous sources is growing rapidly in the National Electricity Market (NEM).
South Australia (SA) currently has 1,700 megawatts (MW) of non-synchronous generation registered
(currently all wind generation), which is above SA’s average operational demand.
Following a finding that the power system in SA was insecure for a period on 13 November 2016 while
only one synchronous generating unit was online3, AEMO implemented new arrangements to manage
system strength to maintain power system security4 in SA. These required a combination of
synchronous machines equivalent to at least two Torrens Island B (TIPS B) units to be operational at all
times. This was an interim arrangement until a permanent system strength solution is put in place to
maintain power system security in SA.
AEMO’s studies to determine this initial requirement were based on simple fault current calculations to
ensure the minimum fault current required by non-synchronous generation for their stable operation.
These initial studies did not assess the dynamic response of synchronous and non-synchronous
generation to credible contingencies.
In its report on the 13 November 2016 incident, AEMO committed to conducting further analysis to
determine:
The maximum level of online non-synchronous generation as a function of the number of online
synchronous generating units needed to maintain a secure operating state.
The relative capability of various types of non-synchronous generating units to operate in a low
system strength network as the number of online synchronous generating units declines.
Additionally, in the 2016 NTNDP, AEMO identified an NSCAS gap to provide system strength in South
Australia, and stated that the gap would be confirmed in 2017 after more detailed analysis was
completed.
AEMO has now conducted further power system studies to evaluate the adequacy of system strength
for a range of operating conditions, including various levels of synchronous and non-synchronous
generation, with normal operating conditions in SA.
As a direct result of these studies, from 2 July 2017 AEMO has required an increased number of large
synchronous generating units to remain online, to provide adequate system strength during periods of
high non-synchronous generation.
These measures are expected to remain in place until other longer-term solutions can be developed to
address system strength in SA. It is expected that these solutions will be facilitated through
amendments to the National Electricity Rules currently under consultation by the Australian Energy
Market Commission.5
This report outlines how AEMO determined the current requirements through power system modelling.
1.1 Background
1.1.1 System strength
System strength reflects the sensitivity of power system variables to disturbances. It indicates inherent
local system robustness, with respect to properties other than inertia.
3 AEMO Reviewable Operating Incident Report: Power System not in a Secure Operating State in South Australia on 13 November 2016, available
at: http://aemo.com.au/-/media/Files/Electricity/NEM/Market_Notices_and_Events/Power_System_Incident_Reports/2016/Power-System-Operations-Incident-Report_SA13Nov16.pdf
4 See National Electricity Rules Chapter 4. 5 Rule change consultation information available at http://aemc.gov.au/Rule-Changes/Managing-power-system-fault-levels

SOUTH AUSTRALIA SYSTEM STRENGTH ASSESSMENT
© AEMO 2017 6
System strength affects the stability and dynamics of generating systems’ control systems, and the
ability of the power system to both remain stable under normal conditions, and to return to steady-state
conditions following a disturbance (e.g. a fault).
Large synchronous machines (hydro, gas, coal generators and synchronous condensers) inherently
contribute to system strength. Non-synchronous generators (batteries, wind and solar photovoltaic
(PV)) do not presently provide inherent contribution to system strength.
To date, the conventional metric for system strength has been a measurement of the available fault
current at a given location, or the short circuit ratio (SCR). This has primarily considered reduced
performance of non-synchronous generation as the available fault current declines. However, as further
analysis continues, it is becoming clear that:
The strength and resilience of a system to recover from a disturbance relates to all network
components, including synchronous and non-synchronous generation, as well as network and
generator protection systems.
There is a complex interaction of many electrical and mechanical elements that determines system
stability or otherwise.
Figure 1 indicates how system stability is adversely impacted as a function of increased penetration of
non-synchronous generation in close proximity to each other, and increased electrical distance from
synchronous machines as seen by the non-synchronous generating units. In most cases the two are
largely inter-related whereby higher active power contribution from non-synchronous generation gives
rise to higher source impedance and lower system strength. However, the latter could be independently
impacted, for example as a result of loss of a major transmission lines with substantial fault infeed for
the same amount of non-synchronous generation.
Figure 1 Stability variation based on grid strength and non-synchronous generation levels
SOUTH AUSTRALIA SYSTEM STRENGTH ASSESSMENT
© AEMO 2017 7
1.1.2 Effects of low system strength
Power system operation with a high penetration of non-synchronous generation and low levels of local
synchronous generation can result in low levels of system strength. This can lead to different system
instability problems or adverse interactions compared to those historically experienced in systems with
predominantly synchronous generation.
These instabilities or adverse interactions can range from local connection point instabilities to wider
network issues potentially impacting various power system components including:
Non-synchronous plant:
Disconnections of plant following credible faults, in particular in remote parts of the network.
Adverse interactions with other non-synchronous plant (instabilities/oscillations have been
observed in practice in the NEM).
Failure to provide sufficient active and reactive power support following fault clearance.
Protection systems:
Protection mechanisms having a higher likelihood of mal-operation.
Protection mechanisms failing to operate (uncleared faults) and/or cascaded tripping of
transmission elements due to eventual clearance of the fault by an out-of-zone protection
resulting in excess disconnection of transmission lines and associated generation.
Synchronous plant:
Disconnections of synchronous machines during credible contingencies due to operation of
various protection systems (such as reverse power or out-of-step) as discussed in this report.
Dynamic reactive power support plant:
Have very similar susceptibility mechanisms to those described for non-synchronous plant.
Shunt reactor and capacitor switching:
Violation of steady-state voltage beyond the range defined as continuous uninterrupted
operation.
Increased risk of generator disconnection due to over-voltages.
1.1.3 The South Australian power system
The SA region of the NEM is in many ways unique in the world. Its key features include:
It has only one AC interconnector to the rest of the NEM power system capable of transferring
system security services, such as frequency control and inertia.
Most demand and synchronous generation is concentrated in the Adelaide metropolitan area. The
next closest group of major synchronous generating units likely to be in service is in Victoria’s
Latrobe Valley, over 800 km away.
System strength in the SA region
Being relatively weakly connected to the rest of the NEM, SA has only marginal benefit from the
“strength in numbers” of the synchronous generation along Australia’s east coast.
SA’s power system has a very high ratio of wind generation compared to demand in the state.
Instantaneously, SA is capable of meeting, and historically has met, more than 120% of its demand
from wind generation alone. This presents operational challenges for maintaining the security of the grid
with reduced system strength. Figure 2 shows contributions of various parts of the NEM power system
to system strength in the SA region. This figure indicates that synchronous generators in the metro
region are the key source of system strength.

SOUTH AUSTRALIA SYSTEM STRENGTH ASSESSMENT
© AEMO 2017 8
Figure 2 Relative contributions to system strength in the SA region
International comparisons
Figure 3 shows SA non-synchronous generation penetration ratios compared with the Irish and Texas
grids, two other systems with high levels of non-synchronous generation. From a system strength
perspective these are most similar to the SA power system, having very little interconnection to nearby
power systems that would have otherwise contributed significantly to local system strength.
Figure 3 Non-synchronous generation penetration ratios
There are several key differences between the SA system and other power systems worldwide with
notably high wind energy penetration:
Danish power system – has many interconnections to other countries that have nearby
synchronous machines that inherently provide system strength.

SOUTH AUSTRALIA SYSTEM STRENGTH ASSESSMENT
© AEMO 2017 9
Irish (All Island6) power system – comparable in size, but at present Eirgrid restricts
non-synchronous generation to below 55%7 penetration levels, indirectly constraining some
synchronous machines to remain online to maintain system strength.
50 Hz power system in Germany – highly interconnected with many other countries whose nearby
synchronous generation provides most of the system strength.
Texas power system – has relatively low non-synchronous generation installed capacity compared
to system demand.
Unlike the SA power system, none of these power systems has experienced periods with insufficient
online synchronous generation to maintain system strength. It can therefore be concluded that the
issues experienced in the SA with regard to the minimum quantity of synchronous machines is the first
time occurrence in any major large-scale power system around the world.
6 Comprising both Northern Ireland and the Republic of Ireland. 7 DS3 program update: https://www.gaelectric.ie/ds3-a-summary-update/.

SOUTH AUSTRALIA SYSTEM STRENGTH ASSESSMENT
© AEMO 2017 10
2. MODEL DEVELOPMENT
This chapter discusses the approaches to power system modelling and simulation studies completed in
PSCAD/EMTDC8 to determine the combinations of synchronous generators that must be online to
provide adequate system strength in SA.
2.1.1 The need to perform simulation studies
The full range of interactions between non-synchronous generating systems, synchronous generation,
and the wider power system to which they are connected are more complex and less widely known than
those pertaining to traditional power systems dominated by synchronous generation technologies.
Until a precise metric for system strength can be defined, the most reliable method available to AEMO
to determine how to operate a system in a secure manner is to perform detailed power system
simulation studies. These studies give insight into how the system performs for varying dispatch
scenarios and fault conditions. This is an iterative process but produces accurate results.
2.1.2 Detailed power system studies in PSCAD
Dynamics associated with fast-acting control systems used in wind turbines and solar inverters can
have a dominant impact in determining the response of generating units under such weak operating
conditions, but they cannot be accounted for in Root Mean Square (RMS)-type simulation tools, such as
PSS®E. Therefore, the use of an RMS-type simulation tool would not allow investigating operating
conditions that result in potential system instability due to lack of system strength.
Electromagnetic Transient (EMT) type simulation tools have been increasingly used by equipment
manufacturers for designing and tuning wind turbines and solar inverters’ control systems for
connecting wind and solar farms in areas of the NEM with low system strength.
Power Systems Computer Aided Design (PSCAD) in particular is widely used by a number of major
power system equipment manufacturers, covering equipment such as wind turbines, solar inverters,
and High Voltage Direct Current (HVDC) and Flexible AC Transmission System (FACTS) devices.
EMT-type tools permit a full three-phase representation of transmission, distribution, and generation,
and inclusion of fast acting control systems in power electronic converters used in wind and solar
generation. Key advantages of EMT-type modelling are for the following analyses:
Stability and interaction of fast controls in power electronics.
Complete modelling of response to unbalanced faults.
Transient and temporary over-voltages.
Active and reactive power response of the non-synchronous generation during the fault, and
recovery after the clearance.
System strength.
To allow a more detailed and accurate assessment of the response of the SA power system with a
reduced ratio of synchronous to non-synchronous generation, AEMO developed an EMT-type model of
the entire SA power system. This includes models supplied by equipment manufacturers, and those
developed by AEMO.
Despite superior accuracy, the primary disadvantage of EMT-type simulation tools is the associated
computational burden, which inherently limits the number of studies that can be practically undertaken
8 PSCAD: Power Systems Computer Aided Design, a commercial software tool for power system simulations. EMTDC: Electromagnetic Transient
including Direct Current.

SOUTH AUSTRALIA SYSTEM STRENGTH ASSESSMENT
© AEMO 2017 11
in a reasonable timeframe.9 AEMO therefore selected and assessed a subset of all credible scenarios
through detailed simulation studies, based on the selection criteria outlined in Chapter 3.
2.2 Development methodology
Figure 4 outlines the basic steps AEMO took to produce an EMT model (in PSCAD) of SA capable of
simulating the phenomenon associated with low system strength. A more detailed description of the
development method is provided in Appendix B.
Figure 4 Basic overview of model development
The PSCAD model development uses the network information such as line and transformer
impedances, transformer tap positions, and voltage set points from a PSS®E load flow case. Once this
case was converted into a PSCAD/EMTDC model using the E-TRAN tool, all synchronous and non-
synchronous generator models and loads in the state were substituted with the more detailed PSCAD
models.
2.3 Model benchmarking
Non-synchronous generators
Previous work completed by AEMO in its review of the September 2016 SA black system event
benchmarked generating system models for wind farms that were operational at the time against the
sequence of actual events. This also allowed benchmarking of simulation models for wind farms that
were not operational during the black system event, where an identical wind turbine type was
operational at that time.
Synchronous generators
Torrens Island B models were benchmarked as part of the SA black system event. Torrens Island A,
Pelican Point Gas Turbine (GT) and Steam Turbine (ST), and Quarantine Unit 5 generator responses
were benchmarked against the frequency event associated with SA islanding from the NEM on
1 December 2016.
As will be discussed in later sections, not all synchronous machines were considered in the
system strength studies. Large generating units in the Adelaide metropolitan area were the main
9 A single scenario of the SA PSCAD case, run on a modern high performance machine, takes approximately 4–5 hours of real time to simulate 20
seconds of simulation time.
PSS®E case downloaded from OPDMS and tuned for a given scenario
PSS®E case converted to PSCAD case using E-TRAN tool
All generators replaced with detailed PSCAD dynamic models, and key generator protection relays added
Case modified to run with E-TRAN Plus for PSCAD
Case ready for iterative studies
SOUTH AUSTRALIA SYSTEM STRENGTH ASSESSMENT
© AEMO 2017 12
machines considered, as they provided the most significant contributions to system strength. Further
information is provided in Section 3.1.1.
Remaining units
AEMO has not benchmarked the following PSCAD models for the purposes of these studies, due to a
lack of sufficient measurement data when the units were online:
Wattle Point Wind Farm.
Osborne Cogeneration Plant.
Starfish Hill Wind Farm (not used in studies).

SOUTH AUSTRALIA SYSTEM STRENGTH ASSESSMENT
© AEMO 2017 13
3. SCENARIO SELECTION
A base case developed for any given non-synchronous dispatch level is comprised of thousands of
individual elements. These include, but are not limited to, network asset status, online generators,
interconnector flows, active and reactive power generation, and demand.
This chapter outlines how each major element was taken into consideration, to determine an efficient
subset of simulation scenarios to be studied.
3.1 Generation dispatch
As the variable with the greatest impact on system strength, synchronous generator commitment
patterns are the primary focus of these simulations. The aim is to develop scenarios and identify the
minimum number10 of synchronous generator combinations that still maintain sufficient system strength
to support varying non-synchronous generation dispatch levels. This is to ensure that the system is
secure for a single credible contingency event, and returns to a stable operating point after removal of
the disturbance.
3.1.1 Synchronous generators
During this work, AEMO divided SA generators into two groups, based on preliminary fault current
calculation study results. The categories are based on the system strength the units can provide.
Primary system strength contributors
AEMO determined that the following SA synchronous generators provide primary contribution to system
strength. This is due to both their large size and the short electrical distance between them, which
enhances their collective contribution (concept details are provided in the next section).
The following synchronous generating units have been included in scenario studies:
Torrens Island A Power Station (up to 4 units).
Torrens Island B Power Station (up to 4 units).
Pelican Point Power Station11 (up to 3 units).
Osborne Cogeneration Power Station12 (2 units).
Quarantine Power Station Unit 5 (1 unit).
Where a unit has a power system stabiliser (PSS), it was enabled in the study.
Limited system strength contributors
AEMO determined that the contribution of the remaining synchronous generators in SA to system
strength is limited due to their size and/or their location in the network. This has been corroborated by
performing selected simulation case studies.
Units physically remote from other large synchronous generation provide limited value. This is
because network impedance over long distances becomes significant and reduces the system
strength contributions of the unit. Additionally, large electrical distances between units and the
concentration of other synchronous generation in the metropolitan region can make such units
more susceptible to instability following disturbances.
Generating units embedded in the distribution network are electrically distant from the high voltage
(275kV) transmission network. There is a high impedance between the generator terminals and the
10 The need to find the minimum number of generators is to balance cost and security, in line with the National Electricity Objective (NEO). 11 Where a steam turbine is available as part of a combined cycle plant, it was dispatched at its minimum active power for the number of GTs online. 12 Where a steam turbine is available as part of a combined cycle plant, it was dispatched at its minimum active power for the number of GTs online.

SOUTH AUSTRALIA SYSTEM STRENGTH ASSESSMENT
© AEMO 2017 14
nearest high voltage transmission node due to multiple transformers and high impedance
distribution lines in their path. With this weak coupling to the High Voltage (HV) network, the
system strength an embedded unit can provide is swamped by the network impedance, and hence
is of limited value. This is especially the case if the unit is electrically small (< 30 MVA/unit).
Another critical factor in determining whether a synchronous generating unit would provide a
material contribution to system strength is the generating unit’s inertia. Units with low inertia are
found to be susceptible to out-of-step conditions, whereas high-inertia units with large electrical
distances to the synchronous generating units in the metropolitan region will experience larger
oscillations even for remote faults. This increases the risk of unit disconnection due to reverse
power protection or similar forms of protection systems. Low inertia units outside the metro region
exhibit a higher electrical distance and are therefore more susceptible to the above effect. Units
with average inertia are often more stable than those with too high or too low an inertia. However,
this cannot be generalised as there are a number of other factors including operational
impedances of the generating units that determine overall stability.
Synchronous generation active power levels
During periods of high non-synchronous generation, synchronous machines are more likely to be
dispatched at or near their minimum active power (Pmin) levels. AEMO conducted simulation case
studies at both high and low active power dispatch levels, which demonstrated a positive impact when
dispatching synchronous generators at higher active power levels. Units were less likely to swing into
negative active power and disconnect on reverse active power protection when dispatched at higher
active power levels. This is discussed in Appendix C.
As synchronous generator operation at or around minimum load is both more likely during periods of
high non-synchronous generation, and more onerous from a system strength impact perspective,
results discussed in this report are based on operation of synchronous machines at minimum active
power levels.
Synchronous generation reactive power levels
All synchronous generating units studied are nominally in voltage control mode. In the simulations,
Generator Automatic Voltage Regulators (AVRs) were set to match or be slightly higher than the
nominal network voltage they connect to, so that the generator was slightly in the over-excited region.
Note that the predominant instability mechanism associated with synchronous generators was not
found to be highly related to the traditional pole slip conditions whereby units operating under-excited
(consuming reactive power) are more prone to instability.
3.1.2 Non-synchronous generation
AEMO considered all currently registered non-synchronous generating units in these studies, with the
exception of Starfish Hill Wind Farm, which is small, electrically distant, and had only a generic
model available.
AEMO conducted initial studies with several levels of non-synchronous generation dispatch levels.
These studies indicated the significance of a dispatch level of around 1,200 MW, above which AEMO’s
current requirement for a minimum number of synchronous generators will apply for several of the
scenarios considered in this report. Historical analysis of generation dispatch in SA in 2016 reveals that,
at around 95% of instances, the total wind generation level was less than 1,200 MW.
Limited simulation studies have shown that the total non-synchronous generation would need to be
reduced to around 600 MW for the minimum number of required synchronous generators to be reduced
by one and still have adequate system strength (compared to the number required with a wind
generation level between 600 and 1,200 MW). Note that these selected studies were carried out as
sensitivity analyses and cannot be considered to suggest an interim wind generation level of 600 MW

SOUTH AUSTRALIA SYSTEM STRENGTH ASSESSMENT
© AEMO 2017 15
below which one less synchronous generator is permitted. Several other factors, including the
adequacy of protection systems under conditions with reduced level of synchronous generation, need to
be considered.
Fewer online synchronous generators than determined in this report would cause power system
security concerns. For example, it is likely that credible disconnection of a synchronous unit due to a
fault would lead to disconnection of a nearby unit due to excessive power oscillations. The remaining
one or two units would be unlikely to be sufficient from a protection system adequacy standpoint.
Studies are currently being undertaken to assess this.
For the purpose of this report, all studies reported relate to two non-synchronous generation scenarios:
1,200 MW (described previously), and 1,700 MW (the maximum level of non-synchronous generation
currently installed).
Additional power system studies will be conducted for further fine tuning of the breakpoints, whereby
the requirement for combination of online synchronous generation will change as a function of the
amount of online non-synchronous generation.
Remote wind farms
Wind farms in remote locations with no nearby synchronous generators are more likely to experience
low short circuit ratios and hence low system strength. This is a known issue, and hence for this
analysis, the loss of particularly remote wind farms following a credible contingency was not a criterion
in determining whether or not a scenario was successful. The combined output of remote wind farms
was consistent with ElectraNet’s constraint requirements.
3.2 Demand
SA demand was determined based on generation dispatch and Heywood Interconnector flow. Note that
SA demand is not a direct factor affecting system strength, because any increase or decrease in the
demand level can be compensated by the Heywood Interconnector import or export.
For the studies documented in this report, demand was adjusted such that Heywood Interconnector
flow remained within ± 200 MW, i.e. up to 200 MW flowing in either direction (see section 3.3).
3.2.1 Rooftop PV
Simulation case studies discussed in this report do not include models of embedded rooftop PV for the
following reasons:
Most rooftop PV currently installed in SA is located in the metropolitan region. This contrasts with
large-scale non-synchronous generation, which is largely located in remote areas.
The response of rooftop PV to voltage disturbances is not well known. However, it is expected that
some of these devices may disconnect if the magnitude of voltage disturbance drops below a
certain level (as occurs for a fault in the 275 kilovolt (kV) transmission network in the metro region),
as they do not generally provide the same level fault ride-through capability seen for larger
generation. Although the response of these devices during network faults was not considered in
the current suite of studies from a system strength perspective, it is an important area of future
work considering the overall SA power system security (see section 5.8).
3.3 Heywood Interconnector flow
The Heywood Interconnector flow was maintained within ± 200 MW for all studies, i.e. up to 200 MW
flowing in either direction. This is because AEMO considers that under high interconnector flows,
sufficient generation must be online to meet the current 3 Hertz per second (Hz/s) rate of change of
frequency (RoCoF) constraint. This constraint does not, however, guarantee suitable units will be online
from a dynamic stability perspective.

SOUTH AUSTRALIA SYSTEM STRENGTH ASSESSMENT
© AEMO 2017 16
Based on the non-synchronous and synchronous generators online, AEMO adjusted SA demand to
keep the Heywood interconnector flow within ± 200 MW.
As discussed in Section 5.4, further detailed simulation studies will be conducted to assess any
additional requirements for specific combinations of synchronous generation during periods of high flow
on the Heywood Interconnector.
3.4 Prior outages
The simulation studies conducted primarily correspond to system normal configurations in SA, that is,
with no prior outages. AEMO analysed a limited number of prior outages in the 275 kV transmission
network within SA for a sample of successful operating scenarios, which did not suggest there would be
any difference in the outcome. However, AEMO will conduct a more comprehensive suite of simulation
studies in the future to more systematically identify and evaluate any prior outages that might degrade
system strength in the state.
3.5 Simulation degrees of freedom
With the role of synchronous machines identified as a primary focus, and combination limitations
applied to other elements of the simulation, a finite set of studies can be identified.
The following table indicates the remaining degrees of freedom that are available when considering
scenarios to be studied.
Table 2 Primary degrees of freedom
Item At 1,200 MW non-synchronous dispatch
At 1,700 MW non-synchronous dispatch
Number of Synchronous Generators online
Up to 4 Torrens Island A units
Up to 4 Torrens Island B units
Up to 2 Pelican Point GTs and ST
Osborne GT and ST
Quarantine PS Unit 5
Up to 4 Torrens Island A units
Up to 4 Torrens Island B units
Up to 2 Pelican Point GTs and ST
Osborne GT and ST
Quarantine PS Unit 5
Number of Non-Synchronous Generators
Any combination up to 1200 MW
Each plant dispatch level up to 100%
Any combination up to 1700 MW
100% dispatch level
Heywood Interconnector Flow Within ± 200 MW Within ± 200 MW
With non-synchronous generation maintained at fixed dispatch levels of 1,200 MW or 1,700 MW, the
Heywood Interconnector flow allowed to be in the ± 200 MW range, and no prior network outages, the
combination of 14 synchronous generators is the only variable. Assuming that plants with multiple
machines have very similar responses regardless of the machine in service, this results in 300 potential
combinations of synchronous generators, as shown in Table 3.
Table 3 Potential combinations of synchronous machines
Plant Options Combinations
Torrens Island A 0, 1, 2, 3 or 4 units online 5
Torrens Island B 0, 1, 2, 3 or 4 units online 5
Pelican Point GTs and ST 0, 2, or 3 units online 3
Osborne GT and ST 0 or 2 units online 2
Quarantine Unit 5 0 or 1 unit online 2
Total 5 x 5 x 3 x 2 x 2 = 300
SOUTH AUSTRALIA SYSTEM STRENGTH ASSESSMENT
© AEMO 2017 17
Although not all are feasible, this still represents a large number of combinations13. Studies of these
combinations are ongoing, however AEMO has prioritised the combinations nominated by NEM Real
Time Operations (RTO) based on historical experience of units online and ease of dispatch of units.
3.6 Network disturbance
For each dispatch scenario, it is necessary to assess whether the system is secure and returns to a
secure state following a credible contingency event. Applying a fault and monitoring the response of key
network and generator metrics (such as voltages, active and reactive power flow, and protection
activation) is considered a reliable and deterministic method of assessing the system security.
3.6.1 Fault location
The fault location was chosen to result in the largest disturbance throughout the state network. This was
determined to be at the transformer HV terminals of an online synchronous generator within the 275 kV
Adelaide metro area14.
This had the dual effect of inducing a state-wide voltage disturbance and removing a synchronous
machine (which was providing system strength services) from the network.
The fault applied was a credible double line to ground fault, cleared within primary clearance time. The
generator was disconnected at the instant of fault clearance. The precise location depended on the
synchronous machines that were online, but was chosen to be on the generator with the highest
connecting network voltage, the generator likely to be the largest contributor to system strength, or the
location likely to affect the largest number of other generators.
3.7 Success criteria
A given scenario was deemed to be stable if all of the conditions below were met following a single
credible fault:
Non-synchronous generators remained online, except for those in electrically distant portions of
the network15.
All synchronous generators in the scenarios studies returned to steady-state conditions following
fault clearance16.
The Heywood Interconnector loss of synchronism protection relay did not operate, hence SA
remained connected to the remainder of the NEM.
The transmission network voltages across the state returned to nominal range.
The combination of the above conditions indicate that the system is resilient to a credible fault and can
be considered secure.
13 Even with the high-powered computers available to AEMO, each EMT simulation takes several orders of magnitude more time to complete,
compared to RMS-type studies. This is not including post-analysis. 14 This scenario is very similar to the disturbance experienced in SA on the 3rd of March, 2017. See - https://www.aemo.com.au/-
/media/Files/Electricity/NEM/Market_Notices_and_Events/Power_System_Incident_Reports/2017/Report-SA-on-3-March-2017.pdf. 15 Studies have demonstrated that irrespective of the quantity and combination of synchronous generators, these electrically distant wind farms are
still likely to significantly reduce output or disconnect in response to a credible fault with high non-synchronous generation penetration. This is due to the low short circuit ratio at their connection points. See Appendix A.2 for further details.
16 No generator swung into negative active power beyond that indicated in their reverse power protection settings following a fault clearance, and no other known protection mechanisms operated, e.g. pole slip.

SOUTH AUSTRALIA SYSTEM STRENGTH ASSESSMENT
© AEMO 2017 18
4. RESULTS
4.1 Successful scenarios Of the scenarios studied, a limited number of generator dispatch patterns allow system security to be
maintained following a credible fault and loss of a synchronous generator, without the loss of other
major generators.
Table 4 summarises the combinations of synchronous generators that would provide sufficient system
strength to withstand a credible fault and loss of a synchronous generator, at different non-synchronous
generation levels.
Table 4 Summary of successful scenarios
ID
Torrens Island A Torrens Island B Pelican Point Osborne QPS
Ax Ax Ax Ax Bx Bx Bx Bx GTxx GTxx ST18 GT ST U5
≤1,2
00 M
W n
on
-syn
ch
ron
ou
s
A ✓ ✓ ✓ ✓
B ✓ ✓ ✓ ✓ ✓
C ✓ ✓ ✓ ✓ ✓
D ✓ ✓ ✓ ✓ ✓
E ✓ ✓ ✓ ✓
F ✓ ✓ ✓ ✓ ✓
G ✓ ✓ ✓ ✓ ✓ ✓
≤1,7
00 M
W n
on
-syn
ch
ron
ou
s
H ✓ ✓ ✓ ✓ ✓ ✓
I ✓ ✓ ✓ ✓ ✓ ✓
J ✓ ✓ ✓ ✓ ✓ ✓ ✓
K ✓ ✓ ✓ ✓ ✓ ✓ ✓
L ✓ ✓ ✓ ✓ ✓ ✓ ✓
M ✓ ✓ ✓ ✓ ✓ ✓
N ✓ ✓ ✓ ✓ ✓ ✓
O ✓ ✓ ✓ ✓ ✓ ✓ ✓
4.1.1 Example of a 1,200 MW successful scenario – Scenario F
The following are results for scenario F shown in Table 4, in which:
Two Torrens Island A units, one Pelican Point GT and ST, Quarantine Unit 5, and 1,200 MW of
non-synchronous generation were online.
A double line to ground fault was applied at the Torrens Island A2 transformer HV and the unit
tripped from service.

SOUTH AUSTRALIA SYSTEM STRENGTH ASSESSMENT
© AEMO 2017 19
Outcome
The results in Figure 5 show that, following fault clearance, generators would return to a stable state,
and for synchronous generators, reverse active power protection would not be triggered. The only
generator lost would be the Torrens Island A unit at which the fault was applied.
Using the criteria set out in Section 3.7, this scenario is considered successful.
275 kV transmission voltages
The transmission system voltages shown in Figure 7 indicate that, after the disturbance was cleared,
the voltages rapidly recover to within 0.9 pu to 1.1 pu range. No substantial over-voltages are observed,
and no non-synchronous or synchronous generators disconnected due to temporary over-voltages.
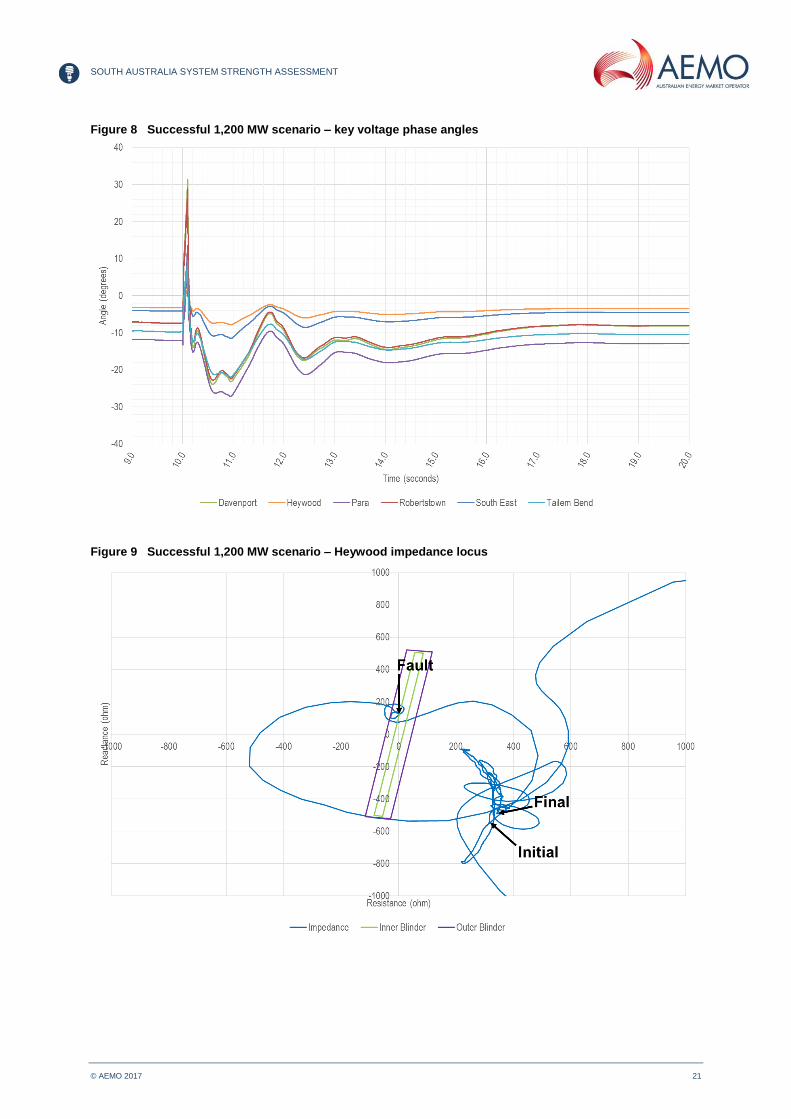
Heywood Interconnector impedance locus
Figure 9 shows that the impedance trajectory seen by the Heywood interconnector’s loss of
synchronism relay. Impedance locus prior to the fault, during the fault, and after achieving new steady-
state conditions upon fault clearance have been highlighted with three arrows.
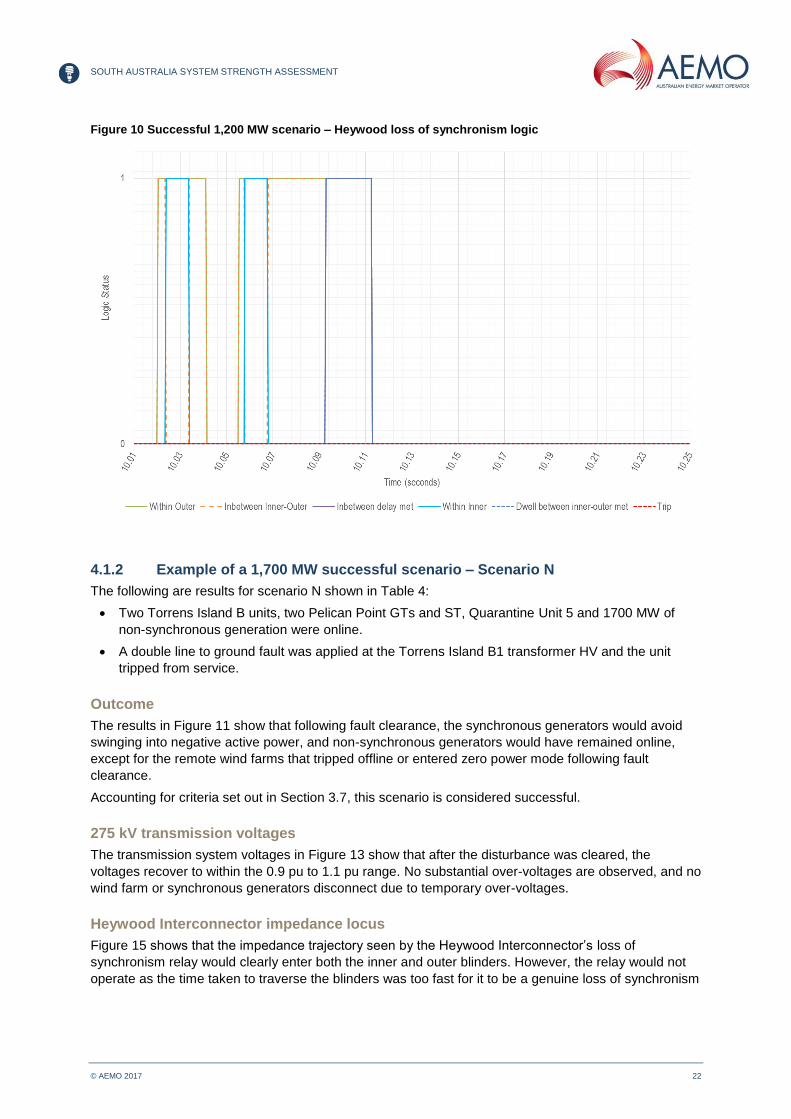
This figure shows that the trajectory clearly entered both the inner and outer blinders. However, the
relay would not have operated, because the time taken to traverse the blinders was too fast for it to be a
genuine loss of synchronism condition. Observing the logic states of the relay in Figure 10 confirms that
the trip condition was not met.
Figure 5 Successful 1,200 MW scenario – generator active power

SOUTH AUSTRALIA SYSTEM STRENGTH ASSESSMENT
© AEMO 2017 20
Figure 6 Successful 1,200 MW scenario – Heywood Interconnector flow
Figure 7 Successful 1,200 MW scenario – key network voltages
SOUTH AUSTRALIA SYSTEM STRENGTH ASSESSMENT
© AEMO 2017 21
Figure 8 Successful 1,200 MW scenario – key voltage phase angles
Figure 9 Successful 1,200 MW scenario – Heywood impedance locus
SOUTH AUSTRALIA SYSTEM STRENGTH ASSESSMENT
© AEMO 2017 22
Figure 10 Successful 1,200 MW scenario – Heywood loss of synchronism logic
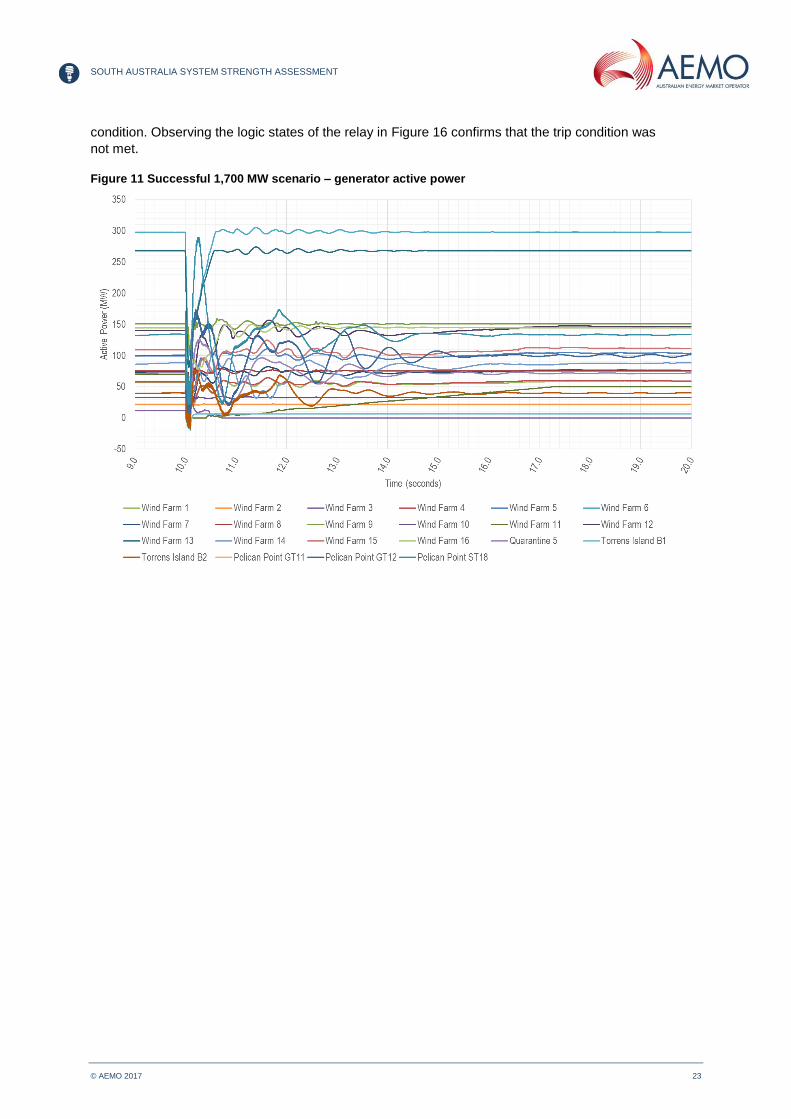
4.1.2 Example of a 1,700 MW successful scenario – Scenario N
The following are results for scenario N shown in Table 4:
Two Torrens Island B units, two Pelican Point GTs and ST, Quarantine Unit 5 and 1700 MW of
non-synchronous generation were online.
A double line to ground fault was applied at the Torrens Island B1 transformer HV and the unit
tripped from service.
Outcome
The results in Figure 11 show that following fault clearance, the synchronous generators would avoid
swinging into negative active power, and non-synchronous generators would have remained online,
except for the remote wind farms that tripped offline or entered zero power mode following fault
clearance.
Accounting for criteria set out in Section 3.7, this scenario is considered successful.
275 kV transmission voltages
The transmission system voltages in Figure 13 show that after the disturbance was cleared, the
voltages recover to within the 0.9 pu to 1.1 pu range. No substantial over-voltages are observed, and no
wind farm or synchronous generators disconnect due to temporary over-voltages.
Heywood Interconnector impedance locus
Figure 15 shows that the impedance trajectory seen by the Heywood Interconnector’s loss of
synchronism relay would clearly enter both the inner and outer blinders. However, the relay would not
operate as the time taken to traverse the blinders was too fast for it to be a genuine loss of synchronism
SOUTH AUSTRALIA SYSTEM STRENGTH ASSESSMENT
© AEMO 2017 23
condition. Observing the logic states of the relay in Figure 16 confirms that the trip condition was
not met.
Figure 11 Successful 1,700 MW scenario – generator active power

SOUTH AUSTRALIA SYSTEM STRENGTH ASSESSMENT
© AEMO 2017 24
Figure 12 Successful 1,700 MW scenario – Heywood Interconnector flow
Figure 13 Successful 1,700 MW scenario – key network voltages

SOUTH AUSTRALIA SYSTEM STRENGTH ASSESSMENT
© AEMO 2017 25
Figure 14 Successful 1,700 MW scenario – key voltage phase angles
Figure 15 Successful 1,700 MW scenario – Heywood impedance locus

SOUTH AUSTRALIA SYSTEM STRENGTH ASSESSMENT
© AEMO 2017 26
Figure 16 Successful 1,700 MW scenario – Heywood loss of synchronism logic
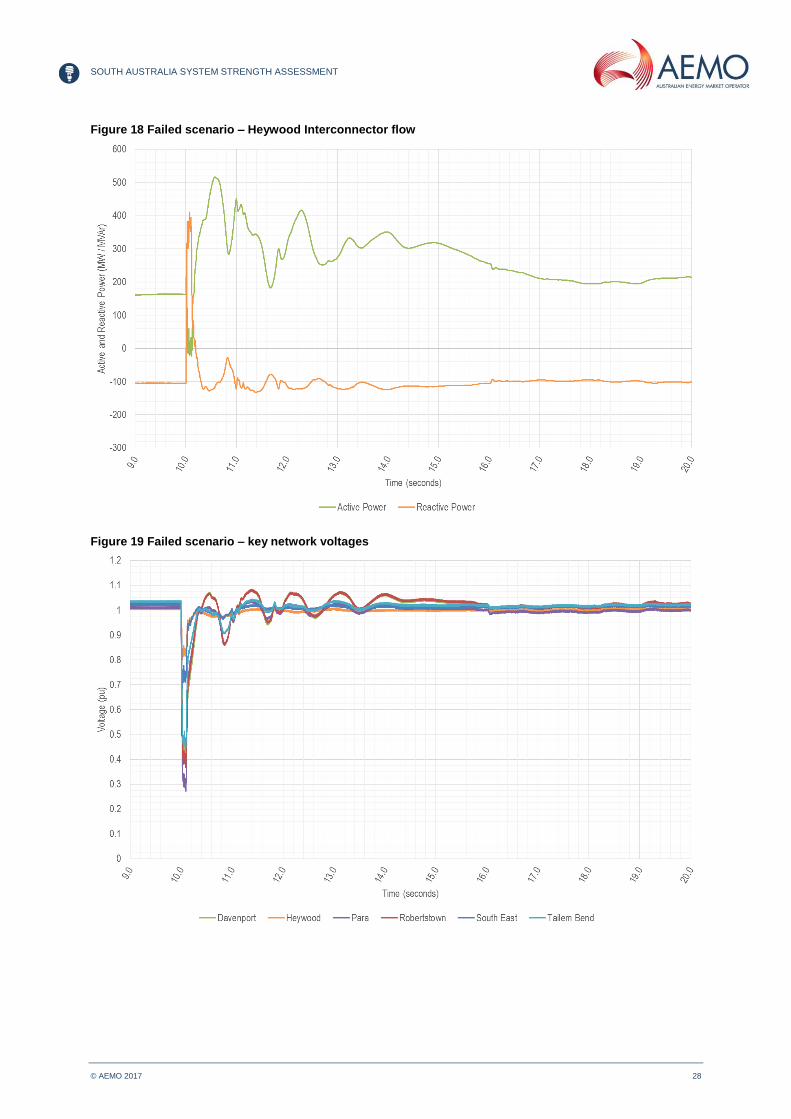
4.1.3 Example of an unsuccessful scenario
The following results are for a 1,700 MW non-synchronous dispatch scenario, where two Torrens Island
B units, the Osborne GT and ST units, and the Quarantine Unit 5 are dispatched at minimum active
power. A double line to ground fault was applied at the Torrens Island B1 transformer HV bus and the
unit tripped from service.
Outcome
The results show that, following fault clearance, the remaining Torrens Island B2 unit would swing into
negative active power, activating its reverse power protection relay and tripping the unit from service.
The SA power system is not therefore in a secure operating state as a credible disconnection of one
unit should not cause another unit to trip.
This would result in only the 66 kV connected generators (Osborne Cogeneration and Quarantine
Unit 5) remaining in service. System strength is not therefore adequate for this operating scenario with
1,700 MW of non-synchronous generation.
This scenario is therefore considered unsuccessful from a system security standpoint.
275 kV transmission voltages
The transmission system voltages in Figure 19 show that, after the disturbance was cleared, the
voltages recover to within 0.9 pu to 1.1 pu range. It is clear, however, that oscillations are more severe
than those of the successful scenario examples shown earlier.

SOUTH AUSTRALIA SYSTEM STRENGTH ASSESSMENT
© AEMO 2017 27
Heywood Interconnector Impedance Locus
Figure 21 shows that the impedance trajectory seen by the Heywood Interconnector’s loss of
synchronism relay would clearly enter both the inner and outer blinders. However, the relay would not
operate, as the time taken to traverse the blinders was too fast for it to be a genuine loss of
synchronism condition. Observing the logic states of the relay in Figure 22 confirms that the trip
condition was not met.
Figure 17 Failed scenario – generator active power
SOUTH AUSTRALIA SYSTEM STRENGTH ASSESSMENT
© AEMO 2017 28
Figure 18 Failed scenario – Heywood Interconnector flow
Figure 19 Failed scenario – key network voltages

SOUTH AUSTRALIA SYSTEM STRENGTH ASSESSMENT
© AEMO 2017 29
Figure 20 Failed scenario – key voltage phase angles
Figure 21 Failed scenario – Heywood impedance locus

SOUTH AUSTRALIA SYSTEM STRENGTH ASSESSMENT
© AEMO 2017 30
Figure 22 Failed scenario – Heywood loss of synchronism logic

SOUTH AUSTRALIA SYSTEM STRENGTH ASSESSMENT
© AEMO 2017 31
5. FUTURE WORK
The focus of this work was to identify conditions that allow the secure operation of the SA power system
under high non-synchronous generation levels currently installed. As new generating systems and
networks support elements are added to the SA system, additional studies will need to be completed.
AEMO plans to further extend this work, and high level details are outlined below. Items 5.1 to 5.5 are
considered as higher priority items and will be addressed before December 2017.
5.1 Performance of distance protection relays
AEMO is currently working with ElectraNet to verify the adequacy of protection systems for key
transmission lines in SA.
Fault currents supplied by the system decrease as system strength decreases. Without sufficient fault
current, network protection relays may be unable to correctly identify an in-zone fault. This can lead to
mal-operation or a failure to operate at all, posing risk to life, assets, and system security.
Work is on-going to include an assessment of these relays under various system operating conditions
identified in this analysis. The focus is on network areas known to have relatively lower system strength.
5.2 Effect of prior outages on system stability
Simulation case studies have been conducted primarily to correspond to system normal configurations,
that is, with no prior outages. A limited number of prior outages were analysed for a limited number of
operating scenarios, which did not suggest any difference in the outcome.
AEMO will undertake a more comprehensive suite of simulation studies to more systematically identify
and evaluate any prior outages that might degrade system strength in the state.
5.3 Fine tuning of non-synchronous generation thresholds
Studies to date have focused on two levels of non-synchronous generation, 1,200 MW and 1,700 MW.
Limited sensitivity studies were conducted for three other levels of total non-synchronous generation
(600 MW, 900 MW and 1,450 MW levels).
As an example, these sensitivity studies indicate that for one less synchronous generating unit online,
the amount of non-synchronous generation may need to be halved from 1,200 MW to 600 MW17 to
maintain system security in SA. Stability of non-synchronous generation is therefore highly sensitive to
the number of synchronous machines online.
AEMO will conduct future work to identify finer thresholds on the level of non-synchronous generation at
which the requirements for quantity and combination of synchronous generators change.
5.4 Effect of Heywood Interconnector flow
As discussed in Section 3.3, in this work the Heywood Interconnector flow was kept between
± 200 MW.
Future work would need to assess the impact of higher Heywood Interconnector flows, both with and
without additional synchronous machines coming online to meet the current RoCoF constraints. This is
to ensure that combination of synchronous machines brought online to achieve a certain level of inertia
in the SA system, is adequate from a system strength perspective.
17 See Section 3.1.2 on why AEMO has not adopted the 600 MW non-synchronous generation level as another threshold for determining the
quantity and combination of synchronous generation required.

SOUTH AUSTRALIA SYSTEM STRENGTH ASSESSMENT
© AEMO 2017 32
5.5 Effect of future additional generation
AEMO’s work to date has focused on currently registered generation in the SA region, and hence is
current advice only. As additional synchronous and non-synchronous generation, network support
mechanisms, and storage come online, AEMO will re-assess the situation and if necessary re-run
studies, accounting for new plant and any new features or control schemes they provide.
5.6 System strength under islanded conditions
Following the loss of the Heywood Interconnector, SA becomes separated from the rest of the NEM
(becomes an electrical “island”)18. With the loss of interconnection to Victoria, the SA system will
experience a decrease in system strength.
Limited simulation case studies conducted by AEMO indicate that following a credible loss of Heywood
Interconnector, i.e. when one circuit is already out, generation in the South East area is most
susceptible to instability. This is caused by a significant reduction in the system strength (including loss
of fault current infeed) that would have otherwise been provided by the Interconnector.
Under these conditions, the dynamic stability of generators throughout the state may be very different,
and acceptable dispatch scenarios identified in this work may no longer be adequate to maintain the
overall SA system security.
However, this cannot be assessed in isolation as a system strength issue only. This is because several
other factors will have an impact on whether or not a viable island can be formed following
disconnection from the rest of the NEM.
Secure operation of the SA power system as an island depends on the following key factors:
Management of supply demand balance through load shedding, generation shedding, and active
power response of synchronous and non-synchronous generation.
Management of temporary over-voltage due to system separation.
The adequacy of system strength under sustained islanding conditions.
Following completion of a comprehensive suite of analysis during islanding conditions, AEMO will
develop further operational strategies for secure operation of the SA system during islanding conditions.
5.7 Development of fast assessment and monitoring tools
Ensuring a sufficient number and combination of synchronous generators as determined by this work is
placing a burden on AEMO’s control room to monitor whether or not these specific combinations are
being maintained and to try to forecast when intervention may be necessary.
AEMO is developing methods to automatically monitor both dispatch and pre-dispatch conditions, and to
issue an alarm when unacceptable combination of synchronous machines are present, or are forecast.
5.8 Response of rooftop PV and load during major system disturbances
The analysis presented in this report has not accounted for fault ride-through capability or lack thereof
for rooftop PV and various types of loads in the SA power system, and in particular in the metro region.
Lessons learned from major loss of generation in the SA power system on 3 March 2017 have
demonstrated that disconnection of loads and rooftop PV, whether expected or unexpected, can have a
material impact on the overall SA system security.19
18 The second SA-VIC interconnector, Murraylink, is a non-synchronous HVDC interconnector that does not contribute to the system strength, nor
keeps SA in synchronism with the rest of the NEM. 19 AEMO. Fault at Torrens Island Switchyard and Loss of Multiple Generating Units on 3 March 2017, March 2017. Available at:
https://www.aemo.com.au/-/media/Files/Electricity/NEM/Market_Notices_and_Events/Power_System_Incident_Reports/2017/Report-SA-on-3-March-2017.pdf.

SOUTH AUSTRALIA SYSTEM STRENGTH ASSESSMENT
© AEMO 2017 33
AEMO will investigate the extent to which the response of rooftop PV and loads can be predicted and
therefore included in simulation models so as to reduce the level of uncertainty associated with the
response of these elements during major system disturbances.
5.9 PSCAD model development for all NEM regions
AEMO intends to develop detailed PSCAD models for all NEM regions, given system strength is likely
to be reduced because of high non-synchronous generation penetration.
As an example, the north-west network of Victoria is experiencing a rapid uptake in new non-
synchronous generation projects. With no significant synchronous machines electrically nearby, system
strength in the area is likely to decline as non-synchronous generation is connected, increasing the
risks of power system instability.
5.10 The role of synchronous condensers in providing system strength
Synchronous condensers can contribute to system strength in the same way as synchronous
generators. Future work will include ElectraNet and AEMO examining the role of synchronous
condensers to increase system strength in SA, including determination of the optimal sizing, electrical
characteristics, placement, and quantity of such devices to provide system strength while ensuring their
resilience and stability to system disturbances.
SOUTH AUSTRALIA SYSTEM STRENGTH ASSESSMENT
© AEMO 2017 34
APPENDIX A. SYSTEM STRENGTH-RELATED
DISCUSSIONS
This appendix presents an introduction to key two attributes and metrics for determining system
strength, related to the stability of synchronous and non-synchronous generation.
Synchronising torque
When synchronous generators rotate to generate electrical power, the generator produces electrical
torque. This electrical torque has two components:
Synchronising torque, which keeps the generator in synchronism with the system.
Damping torque, which reduces the generator’s electromechanical oscillations.
The synchronising torque has an important role in determining synchronous generator behaviour
immediately after a disturbance.
Following a disturbance, the effect of synchronising torque can be observed in angular deviation of
generator rotor and instantaneous change of rotor speed.20 In a grid with multiple generators, the
system will respond across three distinct timeframes following a disturbance:
Electrical distance effect – the transient period immediately following the event.
Inertial response – the period following the initial transient.
Governor response – the time at which the governors start responding.
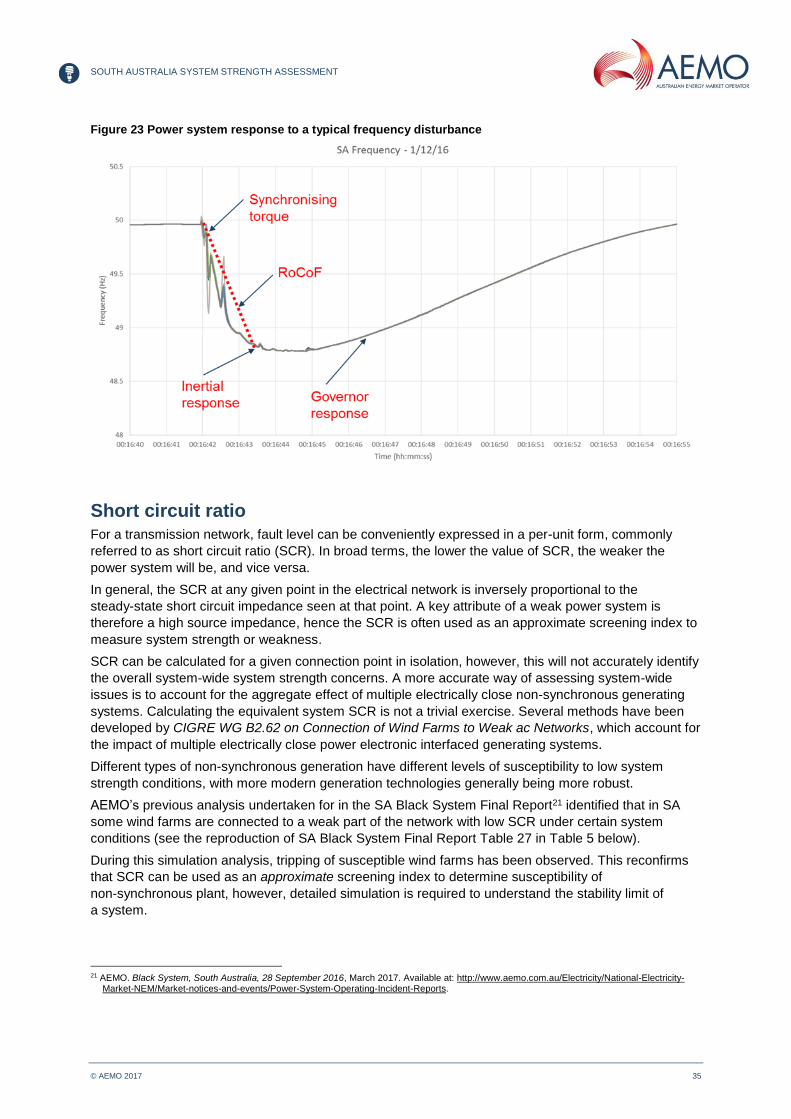
An example of these three aspects are shown in Figure 23, which shows a typical system frequency
following a major disturbance, such as the loss of the Heywood Interconnector as occurred on SA
system separation on 1 December 2016.
The benefits of synchronising torque can only be observed immediately after a disturbance. In a power
system, following a disturbance, injection of active and reactive power will arrest the rate of rotor speed
deviation and the resulting deviation in the rotor angle of the generator.
This electrical response is different from the mechanical response due to system inertia. The change in
synchronising torque coefficient of each machines in the system defines how a machine will respond to
a disturbance.
20 M Bakhtvar et.al, “Synchronizing torque impacts on rotor speed in power systems”, IEEE transaction of power systems, Vol 32, May 2017.
SOUTH AUSTRALIA SYSTEM STRENGTH ASSESSMENT
© AEMO 2017 35
Figure 23 Power system response to a typical frequency disturbance
Short circuit ratio For a transmission network, fault level can be conveniently expressed in a per-unit form, commonly
referred to as short circuit ratio (SCR). In broad terms, the lower the value of SCR, the weaker the
power system will be, and vice versa.
In general, the SCR at any given point in the electrical network is inversely proportional to the
steady-state short circuit impedance seen at that point. A key attribute of a weak power system is
therefore a high source impedance, hence the SCR is often used as an approximate screening index to
measure system strength or weakness.
SCR can be calculated for a given connection point in isolation, however, this will not accurately identify
the overall system-wide system strength concerns. A more accurate way of assessing system-wide
issues is to account for the aggregate effect of multiple electrically close non-synchronous generating
systems. Calculating the equivalent system SCR is not a trivial exercise. Several methods have been
developed by CIGRE WG B2.62 on Connection of Wind Farms to Weak ac Networks, which account for
the impact of multiple electrically close power electronic interfaced generating systems.
Different types of non-synchronous generation have different levels of susceptibility to low system
strength conditions, with more modern generation technologies generally being more robust.
AEMO’s previous analysis undertaken for in the SA Black System Final Report21 identified that in SA
some wind farms are connected to a weak part of the network with low SCR under certain system
conditions (see the reproduction of SA Black System Final Report Table 27 in Table 5 below).
During this simulation analysis, tripping of susceptible wind farms has been observed. This reconfirms
that SCR can be used as an approximate screening index to determine susceptibility of
non-synchronous plant, however, detailed simulation is required to understand the stability limit of
a system.
21 AEMO. Black System, South Australia, 28 September 2016, March 2017. Available at: http://www.aemo.com.au/Electricity/National-Electricity-
Market-NEM/Market-notices-and-events/Power-System-Operating-Incident-Reports.

SOUTH AUSTRALIA SYSTEM STRENGTH ASSESSMENT
© AEMO 2017 36
Table 5 Weighted short circuit ratios calculated for all online wind farms
Wind farm
3 TIPS B + Ladbroke Grove
(SA black system pre-separation)
3 TIPS B + Ladbroke Grove
(SA black system post-separation)
3 TIPS B + Pelican Point CCGT
(pre-separation)
3 TIPS B + Pelican Point CCGT
(post-separation)
Clements Gap 10.9 10.8 10.8 10.8
Snowtown Not online Not online 6.9 6.9
Snowtown 2 4.3 4.2 2.8 2.8
Waterloo 4.3 4.1 3.9 3.9
Cathedral Rocks Not online Not online 1.1 1.1
Mount Millar 2.1 2.1 1.1 1.1
Hornsdale 1 8.5 8.1 5.4 5.4
Hornsdale 2 Not online Not online 5.4 5.4
Hallett 3.7 3.5 2.4 2.3
Hallett Hill 3.4 3.3 2.3 2.3
North Brown Hill 3.5 3.3 2.3 2.3
The Bluff 3.7 3.5 2.4 2.4
Canunda 2.6 2.1 1.9 1.6
Lake Bonney 1,2,3 2.6 1.7 1.6 1.4

SOUTH AUSTRALIA SYSTEM STRENGTH ASSESSMENT
© AEMO 2017 37
APPENDIX B. DETAILED MODELLING
METHODOLOGY
To develop the PSCAD model of SA, AEMO:
1. For a given non-synchronous dispatch level (such as 1,200 MW), identified and downloaded a
recent matching load flow (PSS®E) case from AEMO’s Operations and Planning Data
Management System (OPDMS).
2. Manually modified the PSS®E case to convert it from a snapshot to a system normal case with the
required generator dispatch, including:
Switching reactive plant to ensure all transmission elements were operating at nominal
voltage levels.
Dispatching necessary generation in the Adelaide metro area to meet Heywood flow targets.
Constraint checks to ensure no existing network limits were being violated.
3. Converted the PSS®E model to an equivalent PSCAD model using the Electranix E-TRAN
software and associated libraries.
The Murraylink HVDC interconnector was considered to be out of service, to simplify the model,
and because Murraylink provides no active power response, and only a minor contribution to
fault current during disturbances.
The non-SA network was equivalenced at Moorabool in Victoria, with the 500 kV network from
Moorabool to Heywood represented in PSCAD. This was the only equivalent bus in the case. It
was set to regulate frequency to 50 Hz and maintain a terminal voltage of 1.03 pu.
4. Within this (now) PSCAD case, replaced simplified generating system with full PSCAD models.
Non-synchronous generators were replaced with models provided by the manufacturer/asset
owner, and wind farms with Suzlon S88 turbines were replaced with a S88 model developed by
Manitoba Hydro Research Centre (MHRC) and AEMO based on information from each
installation.
AEMO developed synchronous generating system models with data from OPDMS, R2
validation reports, datasheets, and protection settings provided by generators. These models
were taken from both the SA black system models and the models developed for system restart
ancillary services (SRAS) procurement studies in 2014–15.
Para and South East SVC models were replaced with vendor-specific PSCAD models provided
by ElectraNet. Model responses were verified as part of the SA black system review work.
5. Added the Heywood Interconnector loss of synchronism relay model with current settings to the
PSCAD model. Care was taken with the equivalencing process of the remainder of the NEM to
ensure the behaviour and modelling of the loss of synchronism relay remained realistic.
6. Due to the large processing power and differing timestep requirements and incompatibility between
some models running in the same case, placed generator models in individual PSCAD cases and
linked back to the “top” case using the E-TRAN Plus for PSCAD tool.
This tool allows each PSCAD case to be allocated to its own core within a CPU, and
communicates with the master PSCAD case using TCP/IP. This method isolates each PSCAD
case, avoiding issues relating to two or more incompatible versions of a model being in the
same PSCAD case.
7. Replaced load models within the case with a custom PSCAD load component developed by
MHRC that allows the load to be scaled at runtime while still allowing voltage and frequency
indexes to be applied.

SOUTH AUSTRALIA SYSTEM STRENGTH ASSESSMENT
© AEMO 2017 38
Loads within the SA network were set to a Voltage Index for Real Power (Np) of 1.0 and a
Voltage Index for Reactive Power (Nq) of 3.0. Load relief was set to 1.5%.

SOUTH AUSTRALIA SYSTEM STRENGTH ASSESSMENT
© AEMO 2017 39
APPENDIX C. ACTIVE POWER SENSITIVITY
PSCAD studies have demonstrated that following a fault clearance, synchronous generators that are
dispatched at low active power levels are at a higher risk of experiencing a swing into negative active
power, potentially resulting in the trip of the unit on reverse power protection.
Figure 24 shows a scenario where synchronous generators are dispatched at their registered minimum
active power, and Figure 25 shows the exact same scenario with synchronous generators dispatched
near maximum active power. The risk of swinging into reverse active power and subsequently tripping
offline (N.B. disconnection of generating units due to their reverse power protection is not shown in
these graphs) is clearly far greater when the synchronous machine is dispatched near minimum active
power.
Conversely, synchronous generators dispatched near their maximum active power are more likely to
experience pole-slipping during or immediately following a nearby fault.
To allow an accurate assessment of the most onerous but credible operating conditions, all system
strength studies completed as part of this work had online synchronous generators dispatched at their
registered minimum active power (Pmin).
Figure 24 Synchronous generators dispatched minimum active power

SOUTH AUSTRALIA SYSTEM STRENGTH ASSESSMENT
© AEMO 2017 40
Figure 25 Synchronous generators dispatched near maximum active power
Reverse active power A generator entering reverse active power following a fault clearance is a particular concern for system
security, because it is possible the unit may be tripped offline to prevent unit damage. Having an
additional synchronous generating unit offline will further reduce system strength.
Protection from reverse active power operation for synchronous generators, or ‘motoring’, avoids:
Over-temperature conditions in the turbine blades.
Fuel explosions from unburnt fuel.
Shaft damage.
If a generator operating at high rotational speeds enters into reverse active power following a system
disturbance, it is likely to be tripped offline by a reverse power protection relay or scheme. The
presence of reverse active power protection depends on the type of unit, and is common. The majority
of open cycle gas turbine (OCGT), steam turbines and combined cycle (CCGT) units in SA have this
protection enabled, at varying thresholds.