South African Wine Industry Statistics is published ... · South African Wine Industry Statistics...
44
1 Ook beskikbaar in Afrikaans South African Wine Industry Statistics is published annually during June and is available on request, free of charge, at SAWIS, P O Box 238, Paarl, 7620 or Main Road 312, Paarl This booklet and lots of other information also available on our website at: www.sawis.co.za Contact person: Bonita Floris: (021) 807 5711 Fax: 086 559 0152 E-mail: [email protected] NB: To understand the statistics contained herein, it is important to first read the definitions on page 3.
Transcript of South African Wine Industry Statistics is published ... · South African Wine Industry Statistics...
1
Ook beskikbaar in Afrikaans
South African Wine Industry Statistics is published annually during June and is available on request, free of charge, at SAWIS, P O Box 238,
Paarl, 7620 or Main Road 312, Paarl
This booklet and lots of other information also available on our website at: www.sawis.co.za
Contact person:Bonita Floris: (021) 807 5711 Fax: 086 559 0152 E-mail: [email protected]
NB: To understand the statistics contained herein, it is important to first read the definitions on page 3.
2
1 DEFINITIONS __________________________________________________________________ 4
2 EXTENT OF THE SOUTH AFRICAN WINE INDUSTRY _______________________________ 52.1 Extent of the total wine industry _____________________________________________ 52.2 Extent of the wine industry __________________________________________________ 6
3 WINE INDUSTRY STRUCTURE __________________________________________________ 7
4 WINE CELLARS PER REGION ___________________________________________________ 8
5 VINES AND AREA UNDER VINES ________________________________________________ 85.1 Vine types _______________________________________________________________ 85.2 Geographic distribution of South African wine grape vineyards per wine region _______ 95.3 Total hectares wine grape vineyards planted and uprooted _______________________ 95.4 Wine grape vineyards planted per wine region _________________________________ 105.5 Wine grape vineyards uprooted per wine region _______________________________ 105.6 Area distribution of wine grape varieties ______________________________________ 115.7 Wine grape varieties per wine region ________________________________________ 125.8 Age of vines per wine region _______________________________________________ 14
6 PRODUCTION AND UTILISATION OF CROP ______________________________________ 156.1 Total crop _______________________________________________________________ 166.2 distribution of production between red and white ______________________________ 176.3 Varieties utilised for wine making purposes ___________________________________ 176.4 Grape production for wine making purposes per wine region _____________________ 196.5 certified wine____________________________________________________________ 216.6 certified wine per producer group ___________________________________________ 22
7 PRODUCERS’ SALES, INCOME AND PRICES ____________________________________ 227.1 Producers' sales and income _______________________________________________ 227.2 Particulars of packaged wine sold on the local market _________________________ 24
7.2.1 Type of containers (natural wine only) ___________________________________ 247.2.2 Type of wine sold in 750ml glass containers _____________________________ 26
index
3
8 EXPORTS ____________________________________________________________________ 268.1 Total quantity of wine exported _____________________________________________ 268.2 Types of wine and other liquor products exported ______________________________ 278.3 Packaged and bulk natural wine exports per country ___________________________ 288.4 Packaged natural wine exports per country ___________________________________ 308.5 Bulk natural wine exports per country ________________________________________ 328.6 Natural wine exported in containers _________________________________________ 34
9 IMPORTS ____________________________________________________________________ 369.1 Imports to South Africa – total ______________________________________________ 369.2 Imports to South Africa – packaged and bulk _________________________________ 37
10 LIQUOR CONSUMPTION IN SOUTH AFRICA _____________________________________ 3810.1 Total ___________________________________________________________________ 3810.2 Spirits __________________________________________________________________ 3910.3 Natural wine _____________________________________________________________ 4010.4 Per capita consumption in South Africa ______________________________________ 4010.5 Market share for alcoholic beverages ________________________________________ 41
11 TAXES _______________________________________________________________________ 4111.1 Excise duty _____________________________________________________________ 4111.2 Value added tax (vat)______________________________________________________ 4211.3 Estimated state revenue from wine products __________________________________ 4211.4 State revenue from wine products versus producers' income ____________________ 42
12 INTERNATIONAL COMPARISONS _______________________________________________ 4312.1 Area under vines and wine production ________________________________________ 4312.2 Area under vines (white, red and selected varieties) ____________________________ 4412.3 Per capita consumption ___________________________________________________ 44
4
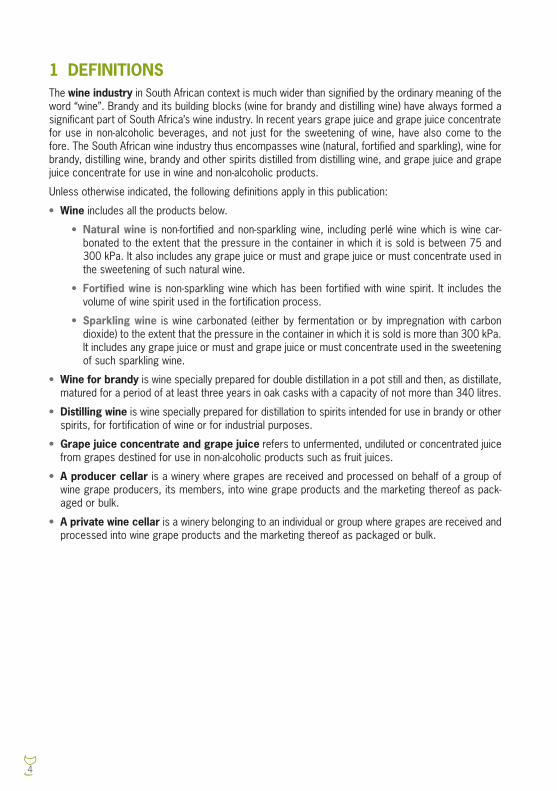
1 DEFINITIONSThe wine industry in South African context is much wider than signified by the ordinary meaning of the word “wine”. Brandy and its building blocks (wine for brandy and distilling wine) have always formed a significant part of South Africa’s wine industry. In recent years grape juice and grape juice concentrate for use in non-alcoholic beverages, and not just for the sweetening of wine, have also come to the fore. The South African wine industry thus encompasses wine (natural, fortified and sparkling), wine for brandy, distilling wine, brandy and other spirits distilled from distilling wine, and grape juice and grape juice concentrate for use in wine and non-alcoholic products.
Unless otherwise indicated, the following definitions apply in this publication:
• Wine includes all the products below.
• Natural wine is non-fortified and non-sparkling wine, including perlé wine which is wine car-bonated to the extent that the pressure in the container in which it is sold is between 75 and 300 kPa. It also includes any grape juice or must and grape juice or must concentrate used in the sweetening of such natural wine.
• Fortified wine is non-sparkling wine which has been fortified with wine spirit. It includes the volume of wine spirit used in the fortification process.
• Sparkling wine is wine carbonated (either by fermentation or by impregnation with carbon dioxide) to the extent that the pressure in the container in which it is sold is more than 300 kPa. It includes any grape juice or must and grape juice or must concentrate used in the sweetening of such sparkling wine.
• Wine for brandy is wine specially prepared for double distillation in a pot still and then, as distillate, matured for a period of at least three years in oak casks with a capacity of not more than 340 litres.
• Distilling wine is wine specially prepared for distillation to spirits intended for use in brandy or other spirits, for fortification of wine or for industrial purposes.
• Grape juice concentrate and grape juice refers to unfermented, undiluted or concentrated juice from grapes destined for use in non-alcoholic products such as fruit juices.
• A producer cellar is a winery where grapes are received and processed on behalf of a group of wine grape producers, its members, into wine grape products and the marketing thereof as pack-aged or bulk.
• A private wine cellar is a winery belonging to an individual or group where grapes are received and processed into wine grape products and the marketing thereof as packaged or bulk.
5
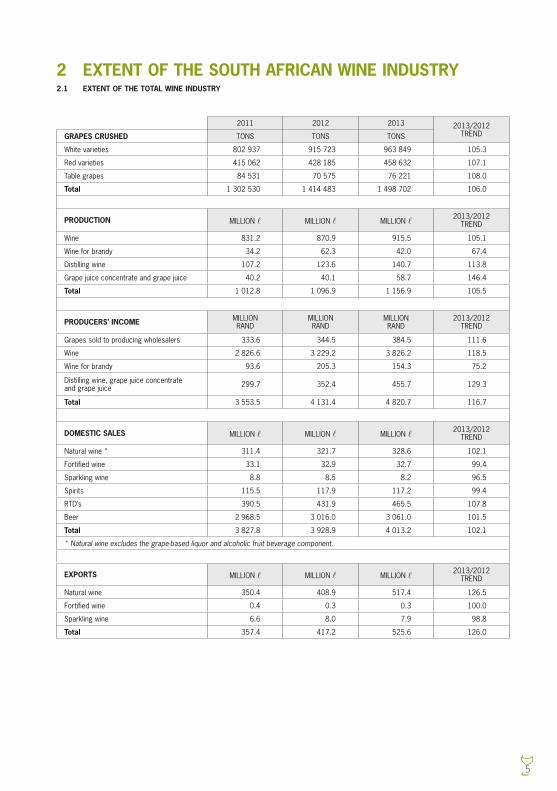
2 EXTENT OF THE SOUTH AFRICAN WINE INDUSTRY2.1 EXTENT OF THE TOTAL WINE INDUSTRY
2011 2012 2013 2013/2012 TRENdGRAPES CRUSHED TONS TONS TONS
White varieties 802 937 915 723 963 849 105.3
Red varieties 415 062 428 185 458 632 107.1
Table grapes 84 531 70 575 76 221 108.0
Total 1 302 530 1 414 483 1 498 702 106.0
PRODUCTION MILLION l MILLION l MILLION l2013/2012
TRENd
Wine 831.2 870.9 915.5 105.1
Wine for brandy 34.2 62.3 42.0 67.4
distilling wine 107.2 123.6 140.7 113.8
Grape juice concentrate and grape juice 40.2 40.1 58.7 146.4
Total 1 012.8 1 096.9 1 156.9 105.5
PRODUCERS’ INCOME MILLION RANd
MILLION RANd
MILLION RANd
2013/2012 TRENd
Grapes sold to producing wholesalers 333.6 344.5 384.5 111.6
Wine 2 826.6 3 229.2 3 826.2 118.5
Wine for brandy 93.6 205.3 154.3 75.2
distilling wine, grape juice concentrate and grape juice 299.7 352.4 455.7 129.3
Total 3 553.5 4 131.4 4 820.7 116.7
DOMESTIC SALES MILLION l MILLION l MILLION l2013/2012
TRENd
Natural wine * 311.4 321.7 328.6 102.1
Fortified wine 33.1 32.9 32.7 99.4
Sparkling wine 8.8 8.5 8.2 96.5
Spirits 115.5 117.9 117.2 99.4
RTd’s 390.5 431.9 465.5 107.8
Beer 2 968.5 3 016.0 3 061.0 101.5
Total 3 827.8 3 928.9 4 013.2 102.1
* Natural wine excludes the grape-based liquor and alcoholic fruit beverage component.
EXPORTS MILLION l MILLION l MILLION l2013/2012
TRENd
Natural wine 350.4 408.9 517.4 126.5
Fortified wine 0.4 0.3 0.3 100.0
Sparkling wine 6.6 8.0 7.9 98.8
Total 357.4 417.2 525.6 126.0
6
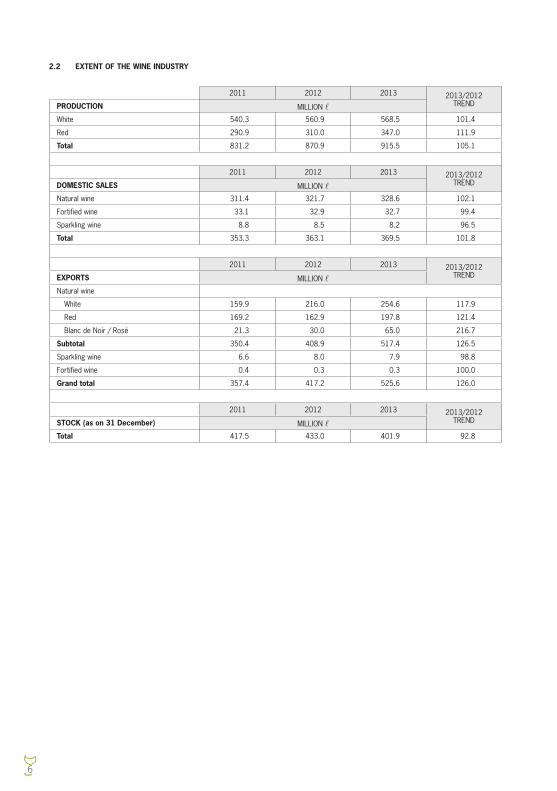
2.2 EXTENT OF THE WINE INDUSTRY
2011 2012 2013 2013/2012 TRENdPRODUCTION MILLION l
White 540.3 560.9 568.5 101.4
Red 290.9 310.0 347.0 111.9
Total 831.2 870.9 915.5 105.1
2011 2012 2013 2013/2012 TRENdDOMESTIC SALES MILLION l
Natural wine 311.4 321.7 328.6 102.1
Fortified wine 33.1 32.9 32.7 99.4
Sparkling wine 8.8 8.5 8.2 96.5
Total 353.3 363.1 369.5 101.8
2011 2012 2013 2013/2012 TRENdEXPORTS MILLION l
Natural wine
White 159.9 216.0 254.6 117.9
Red 169.2 162.9 197.8 121.4
Blanc de Noir / Rosé 21.3 30.0 65.0 216.7
Subtotal 350.4 408.9 517.4 126.5
Sparkling wine 6.6 8.0 7.9 98.8
Fortified wine 0.4 0.3 0.3 100.0
Grand total 357.4 417.2 525.6 126.0
2011 2012 2013 2013/2012 TRENdSTOCK (as on 31 December) MILLION l
Total 417.5 433.0 401.9 92.8

7
NUMBER OF PRIMARY WINE PROdUcERS
3 323
# NUMBER OF WINE cELLARSWHIcH cRUSH GRAPES
564
NUMBER OF BULK WINE BUYERS
103
50
493
21
564
103
PROdUcER cELLARS
PRIVATE WINE cELLARS
PROdUcING WHOLESALERS
WHOLESALERS (Including producing wholesalers)
PER PROdUcTION cATEGORY
NUMBER OF PROdUcERSTONS
1 – 100 > 100 – 500 > 500 – 1000 > 1000 – 5000 > 5000 – 10000
1 249 1 216
429 416 13
3 323
3 WINE INDUSTRY STRUCTURE IN 2013
# NUMBER OF WINE CELLARS PER PRODUCTION CATEGORY
cATEGORIES (TONS OF GRAPES cRUSHEd – 2013)
NUMBER OF WINE cELLARS
TOTAL PRIVATE WINEcELLARS
PROdUcER cELLARS
PROdUcINGWHOLESALERS
1 – 100 240 233 – 7
> 100 – 500 155 150 – 5
> 500 – 1000 58 55 2 1
> 1000 – 5000 55 46 5 4
> 5000 – 10000 17 6 9 2
> 10000 39 3 34 2
Total 564 493 50 21
8
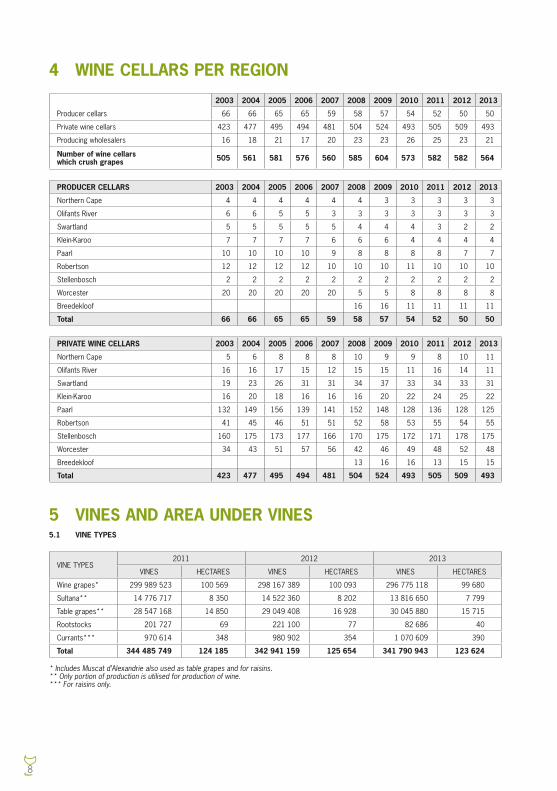
2003 2004 2005 2006 2007 2008 2009 2010 2011 2012 2013
Producer cellars 66 66 65 65 59 58 57 54 52 50 50
Private wine cellars 423 477 495 494 481 504 524 493 505 509 493
Producing wholesalers 16 18 21 17 20 23 23 26 25 23 21
Number of wine cellars which crush grapes 505 561 581 576 560 585 604 573 582 582 564
PRODUCER CELLARS 2003 2004 2005 2006 2007 2008 2009 2010 2011 2012 2013
Northern cape 4 4 4 4 4 4 3 3 3 3 3
Olifants River 6 6 5 5 3 3 3 3 3 3 3
Swartland 5 5 5 5 5 4 4 4 3 2 2
Klein-Karoo 7 7 7 7 6 6 6 4 4 4 4
Paarl 10 10 10 10 9 8 8 8 8 7 7
Robertson 12 12 12 12 10 10 10 11 10 10 10
Stellenbosch 2 2 2 2 2 2 2 2 2 2 2
Worcester 20 20 20 20 20 5 5 8 8 8 8
Breedekloof 16 16 11 11 11 11
Total 66 66 65 65 59 58 57 54 52 50 50
PRIVATE WINE CELLARS 2003 2004 2005 2006 2007 2008 2009 2010 2011 2012 2013
Northern cape 5 6 8 8 8 10 9 9 8 10 11
Olifants River 16 16 17 15 12 15 15 11 16 14 11
Swartland 19 23 26 31 31 34 37 33 34 33 31
Klein-Karoo 16 20 18 16 16 16 20 22 24 25 22
Paarl 132 149 156 139 141 152 148 128 136 128 125
Robertson 41 45 46 51 51 52 58 53 55 54 55
Stellenbosch 160 175 173 177 166 170 175 172 171 178 175
Worcester 34 43 51 57 56 42 46 49 48 52 48
Breedekloof 13 16 16 13 15 15
Total 423 477 495 494 481 504 524 493 505 509 493
4 WINE CELLARS PER REGION
5 VINES AND AREA UNDER VINES5.1 VINE TYPES
VINE TYPES2011 2012 2013
VINES HEcTARES VINES HEcTARES VINES HEcTARES
Wine grapes* 299 989 523 100 569 298 167 389 100 093 296 775 118 99 680
Sultana** 14 776 717 8 350 14 522 360 8 202 13 816 650 7 799
Table grapes** 28 547 168 14 850 29 049 408 16 928 30 045 880 15 715
Rootstocks 201 727 69 221 100 77 82 686 40
currants*** 970 614 348 980 902 354 1 070 609 390
Total 344 485 749 124 185 342 941 159 125 654 341 790 943 123 624
* Includes Muscat d’Alexandrie also used as table grapes and for raisins.** Only portion of production is utilised for production of wine.*** For raisins only.
9
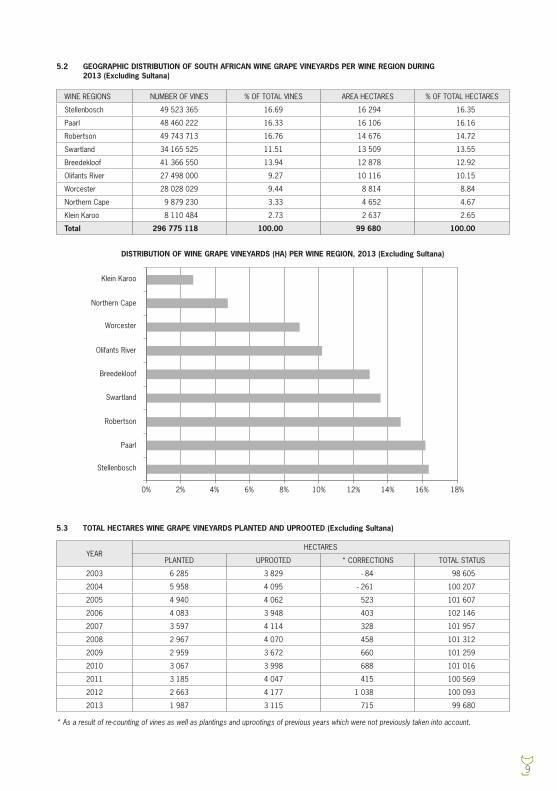
5.3 TOTAL HECTARES WINE GRAPE VINEYARDS PLANTED AND UPROOTED (Excluding Sultana)
YEARHEcTARES
PLANTEd UPROOTEd * cORREcTIONS TOTAL STATUS
2003 6 285 3 829 - 84 98 605
2004 5 958 4 095 - 261 100 207
2005 4 940 4 062 523 101 607
2006 4 083 3 948 403 102 146
2007 3 597 4 114 328 101 957
2008 2 967 4 070 458 101 312
2009 2 959 3 672 660 101 259
2010 3 067 3 998 688 101 016
2011 3 185 4 047 415 100 569
2012 2 663 4 177 1 038 100 093
2013 1 987 3 115 715 99 680
5.2 GEOGRAPHIC DISTRIBUTION OF SOUTH AFRICAN WINE GRAPE VINEYARDS PER WINE REGION DURING 2013 (Excluding Sultana)
WINE REGIONS NUMBER OF VINES % OF TOTAL VINES AREA HEcTARES % OF TOTAL HEcTARES
Stellenbosch 49 523 365 16.69 16 294 16.35
Paarl 48 460 222 16.33 16 106 16.16
Robertson 49 743 713 16.76 14 676 14.72
Swartland 34 165 525 11.51 13 509 13.55
Breedekloof 41 366 550 13.94 12 878 12.92
Olifants River 27 498 000 9.27 10 116 10.15
Worcester 28 028 029 9.44 8 814 8.84
Northern cape 9 879 230 3.33 4 652 4.67
Klein Karoo 8 110 484 2.73 2 637 2.65
Total 296 775 118 100.00 99 680 100.00
* As a result of re-counting of vines as well as plantings and uprootings of previous years which were not previously taken into account.
DISTRIBUTION OF WINE GRAPE VINEYARDS (HA) PER WINE REGION, 2013 (Excluding Sultana)
Klein Karoo
Northern cape
Worcester
Olifants River
Breedekloof
Swartland
Robertson
Paarl
Stellenbosch
0% 2% 4% 6% 8% 10% 12% 14% 16% 18%
10
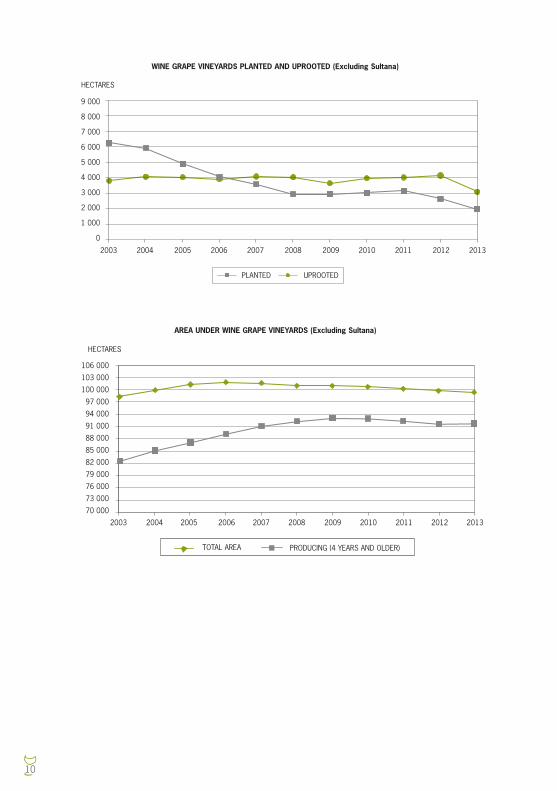
WINE GRAPE VINEYARDS PLANTED AND UPROOTED (Excluding Sultana)
PLANTEd UPROOTEd
HEcTARES
9 000
8 000
7 000
6 000
5 000
4 000
3 000
2 000
1 000
0
2003 2004 2005 2006 2007 2008 2009 2010 2011 2012 2013
AREA UNDER WINE GRAPE VINEYARDS (Excluding Sultana)
TOTAL AREA PROdUcING (4 YEARS ANd OLdER)
HEcTARES
106 000
103 000
100 000
97 000
94 000
91 000
88 000
85 000
82 000
79 000
76 000
73 000
70 000
2003 2004 2005 2006 2007 2008 2009 2010 2011 2012 2013
11
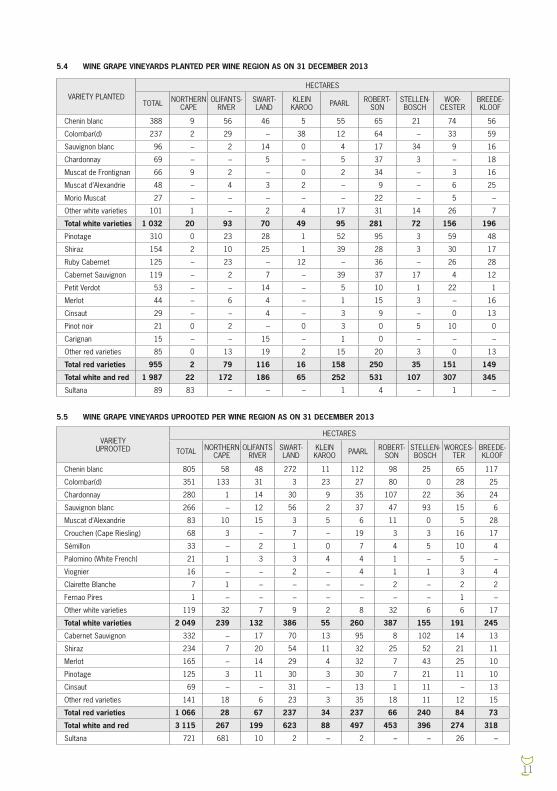
5.4 WINE GRAPE VINEYARDS PLANTED PER WINE REGION AS ON 31 DECEMBER 2013
VARIETY PLANTEdHEcTARES
TOTAL NORTHERN cAPE
OLIFANTS- RIVER
SWART- LANd
KLEIN KAROO PAARL ROBERT-
SONSTELLEN-BOScH
WOR - cESTER
BREEdE-KLOOF
chenin blanc 388 9 56 46 5 55 65 21 74 56
colombar(d) 237 2 29 – 38 12 64 – 33 59
Sauvignon blanc 96 – 2 14 0 4 17 34 9 16
chardonnay 69 – – 5 – 5 37 3 – 18
Muscat de Frontignan 66 9 2 – 0 2 34 – 3 16
Muscat d’Alexandrie 48 – 4 3 2 – 9 – 6 25
Morio Muscat 27 – – – – – 22 – 5 –
Other white varieties 101 1 – 2 4 17 31 14 26 7
Total white varieties 1 032 20 93 70 49 95 281 72 156 196
Pinotage 310 0 23 28 1 52 95 3 59 48
Shiraz 154 2 10 25 1 39 28 3 30 17
Ruby cabernet 125 – 23 – 12 – 36 – 26 28
cabernet Sauvignon 119 – 2 7 – 39 37 17 4 12
Petit Verdot 53 – – 14 – 5 10 1 22 1
Merlot 44 – 6 4 – 1 15 3 – 16
cinsaut 29 – – 4 – 3 9 – 0 13
Pinot noir 21 0 2 – 0 3 0 5 10 0
carignan 15 – – 15 – 1 0 – – –
Other red varieties 85 0 13 19 2 15 20 3 0 13
Total red varieties 955 2 79 116 16 158 250 35 151 149
Total white and red 1 987 22 172 186 65 252 531 107 307 345
Sultana 89 83 – – – 1 4 – 1 –
VARIETY UPROOTEd
HEcTARES
TOTAL NORTHERN cAPE
OLIFANTS RIVER
SWART- LANd
KLEIN KAROO PAARL ROBERT-
SONSTELLEN- BOScH
WORcES- TER
BREEdE- KLOOF
chenin blanc 805 58 48 272 11 112 98 25 65 117
colombar(d) 351 133 31 3 23 27 80 0 28 25
chardonnay 280 1 14 30 9 35 107 22 36 24
Sauvignon blanc 266 – 12 56 2 37 47 93 15 6
Muscat d’Alexandrie 83 10 15 3 5 6 11 0 5 28
crouchen (cape Riesling) 68 3 – 7 – 19 3 3 16 17
Sémillon 33 – 2 1 0 7 4 5 10 4
Palomino (White French) 21 1 3 3 4 4 1 – 5 –
Viognier 16 – – 2 – 4 1 1 3 4
clairette Blanche 7 1 – – – – 2 – 2 2
Fernao Pires 1 – – – – – – – 1 –
Other white varieties 119 32 7 9 2 8 32 6 6 17
Total white varieties 2 049 239 132 386 55 260 387 155 191 245
cabernet Sauvignon 332 – 17 70 13 95 8 102 14 13
Shiraz 234 7 20 54 11 32 25 52 21 11
Merlot 165 – 14 29 4 32 7 43 25 10
Pinotage 125 3 11 30 3 30 7 21 11 10
cinsaut 69 – – 31 – 13 1 11 – 13
Other red varieties 141 18 6 23 3 35 18 11 12 15
Total red varieties 1 066 28 67 237 34 237 66 240 84 73
Total white and red 3 115 267 199 623 88 497 453 396 274 318
Sultana 721 681 10 2 – 2 – – 26 –
5.5 WINE GRAPE VINEYARDS UPROOTED PER WINE REGION AS ON 31 DECEMBER 2013
12
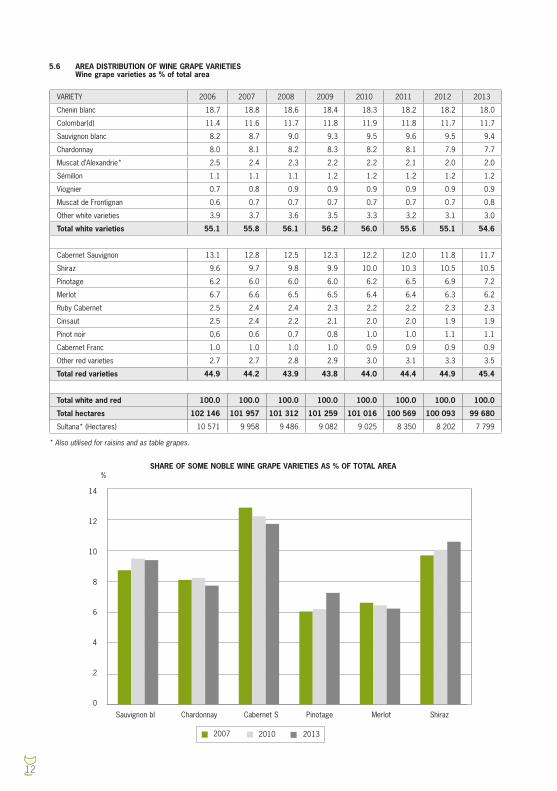
5.6 AREA DISTRIBUTION OF WINE GRAPE VARIETIES Wine grape varieties as % of total area
VARIETY 2006 2007 2008 2009 2010 2011 2012 2013
chenin blanc 18.7 18.8 18.6 18.4 18.3 18.2 18.2 18.0
colombar(d) 11.4 11.6 11.7 11.8 11.9 11.8 11.7 11.7
Sauvignon blanc 8.2 8.7 9.0 9.3 9.5 9.6 9.5 9.4
chardonnay 8.0 8.1 8.2 8.3 8.2 8.1 7.9 7.7
Muscat d’Alexandrie* 2.5 2.4 2.3 2.2 2.2 2.1 2.0 2.0
Sémillon 1.1 1.1 1.1 1.2 1.2 1.2 1.2 1.2
Viognier 0.7 0.8 0.9 0.9 0.9 0.9 0.9 0.9
Muscat de Frontignan 0.6 0.7 0.7 0.7 0.7 0.7 0.7 0.8
Other white varieties 3.9 3.7 3.6 3.5 3.3 3.2 3.1 3.0
Total white varieties 55.1 55.8 56.1 56.2 56.0 55.6 55.1 54.6
cabernet Sauvignon 13.1 12.8 12.5 12.3 12.2 12.0 11.8 11.7
Shiraz 9.6 9.7 9.8 9.9 10.0 10.3 10.5 10.5
Pinotage 6.2 6.0 6.0 6.0 6.2 6.5 6.9 7.2
Merlot 6.7 6.6 6.5 6.5 6.4 6.4 6.3 6.2
Ruby cabernet 2.5 2.4 2.4 2.3 2.2 2.2 2.3 2.3
cinsaut 2.5 2.4 2.2 2.1 2.0 2.0 1.9 1.9
Pinot noir 0.6 0.6 0.7 0.8 1.0 1.0 1.1 1.1
cabernet Franc 1.0 1.0 1.0 1.0 0.9 0.9 0.9 0.9
Other red varieties 2.7 2.7 2.8 2.9 3.0 3.1 3.3 3.5
Total red varieties 44.9 44.2 43.9 43.8 44.0 44.4 44.9 45.4
Total white and red 100.0 100.0 100.0 100.0 100.0 100.0 100.0 100.0
Total hectares 102 146 101 957 101 312 101 259 101 016 100 569 100 093 99 680
Sultana* (Hectares) 10 571 9 958 9 486 9 082 9 025 8 350 8 202 7 799
SHARE OF SOME NOBLE WINE GRAPE VARIETIES AS % OF TOTAL AREA%
Sauvignon bl chardonnay cabernet S Pinotage Merlot Shiraz
2007 2010 2013
14
12
10
8
6
4
2
0
* Also utilised for raisins and as table grapes.
13
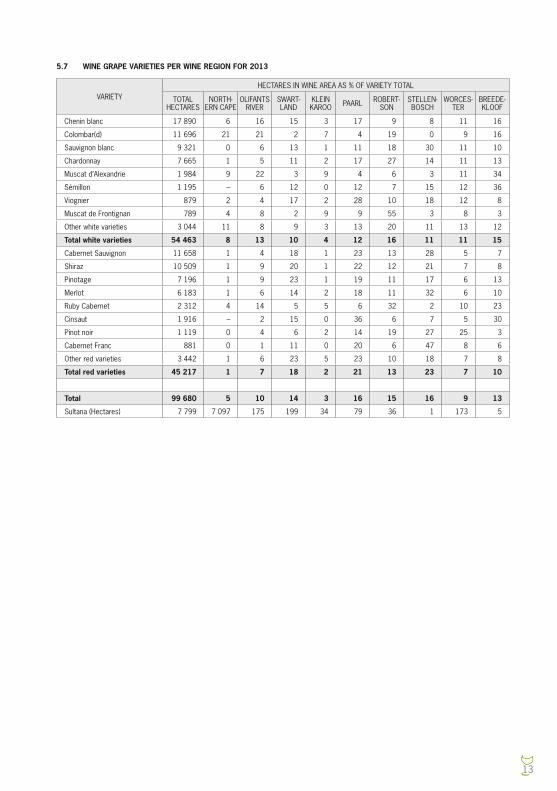
5.7 WINE GRAPE VARIETIES PER WINE REGION FOR 2013
VARIETYHEcTARES IN WINE AREA AS % OF VARIETY TOTAL
TOTAL HEcTARES
NORTH-ERN cAPE
OLIFANTS RIVER
SWART- LANd
KLEIN KAROO PAARL ROBERT-
SONSTELLEN- BOScH
WORcES- TER
BREEdE- KLOOF
chenin blanc 17 890 6 16 15 3 17 9 8 11 16
colombar(d) 11 696 21 21 2 7 4 19 0 9 16
Sauvignon blanc 9 321 0 6 13 1 11 18 30 11 10
chardonnay 7 665 1 5 11 2 17 27 14 11 13
Muscat d’Alexandrie 1 984 9 22 3 9 4 6 3 11 34
Sémillon 1 195 – 6 12 0 12 7 15 12 36
Viognier 879 2 4 17 2 28 10 18 12 8
Muscat de Frontignan 789 4 8 2 9 9 55 3 8 3
Other white varieties 3 044 11 8 9 3 13 20 11 13 12
Total white varieties 54 463 8 13 10 4 12 16 11 11 15
cabernet Sauvignon 11 658 1 4 18 1 23 13 28 5 7
Shiraz 10 509 1 9 20 1 22 12 21 7 8
Pinotage 7 196 1 9 23 1 19 11 17 6 13
Merlot 6 183 1 6 14 2 18 11 32 6 10
Ruby cabernet 2 312 4 14 5 5 6 32 2 10 23
cinsaut 1 916 – 2 15 0 36 6 7 5 30
Pinot noir 1 119 0 4 6 2 14 19 27 25 3
cabernet Franc 881 0 1 11 0 20 6 47 8 6
Other red varieties 3 442 1 6 23 5 23 10 18 7 8
Total red varieties 45 217 1 7 18 2 21 13 23 7 10
Total 99 680 5 10 14 3 16 15 16 9 13
Sultana (Hectares) 7 799 7 097 175 199 34 79 36 1 173 5
14
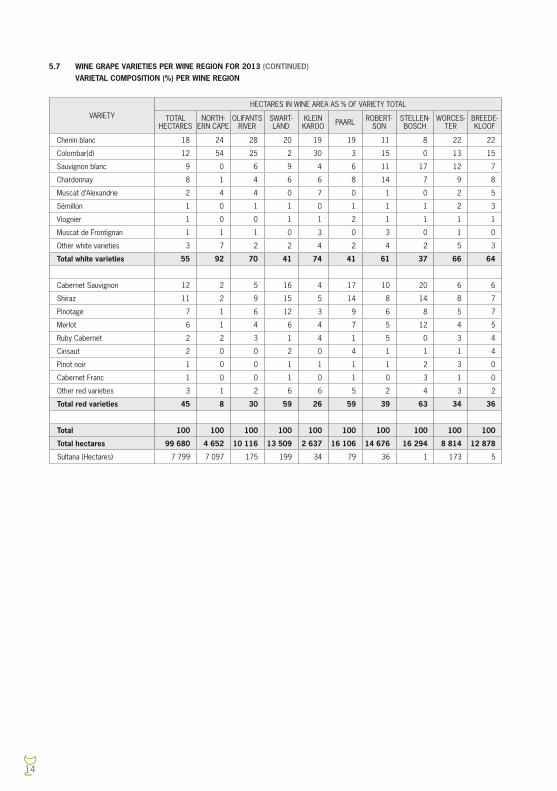
5.7 WINE GRAPE VARIETIES PER WINE REGION FOR 2013 (CONTINUED) VARIETAL COMPOSITION (%) PER WINE REGION
VARIETYHEcTARES IN WINE AREA AS % OF VARIETY TOTAL
TOTAL HEcTARES
NORTH-ERN cAPE
OLIFANTS RIVER
SWART- LANd
KLEIN KAROO PAARL ROBERT-
SONSTELLEN- BOScH
WORcES- TER
BREEdE- KLOOF
chenin blanc 18 24 28 20 19 19 11 8 22 22
colombar(d) 12 54 25 2 30 3 15 0 13 15
Sauvignon blanc 9 0 6 9 4 6 11 17 12 7
chardonnay 8 1 4 6 6 8 14 7 9 8
Muscat d’Alexandrie 2 4 4 0 7 0 1 0 2 5
Sémillon 1 0 1 1 0 1 1 1 2 3
Viognier 1 0 0 1 1 2 1 1 1 1
Muscat de Frontignan 1 1 1 0 3 0 3 0 1 0
Other white varieties 3 7 2 2 4 2 4 2 5 3
Total white varieties 55 92 70 41 74 41 61 37 66 64
cabernet Sauvignon 12 2 5 16 4 17 10 20 6 6
Shiraz 11 2 9 15 5 14 8 14 8 7
Pinotage 7 1 6 12 3 9 6 8 5 7
Merlot 6 1 4 6 4 7 5 12 4 5
Ruby cabernet 2 2 3 1 4 1 5 0 3 4
cinsaut 2 0 0 2 0 4 1 1 1 4
Pinot noir 1 0 0 1 1 1 1 2 3 0
cabernet Franc 1 0 0 1 0 1 0 3 1 0
Other red varieties 3 1 2 6 6 5 2 4 3 2
Total red varieties 45 8 30 59 26 59 39 63 34 36
Total 100 100 100 100 100 100 100 100 100 100
Total hectares 99 680 4 652 10 116 13 509 2 637 16 106 14 676 16 294 8 814 12 878
Sultana (Hectares) 7 799 7 097 175 199 34 79 36 1 173 5
15
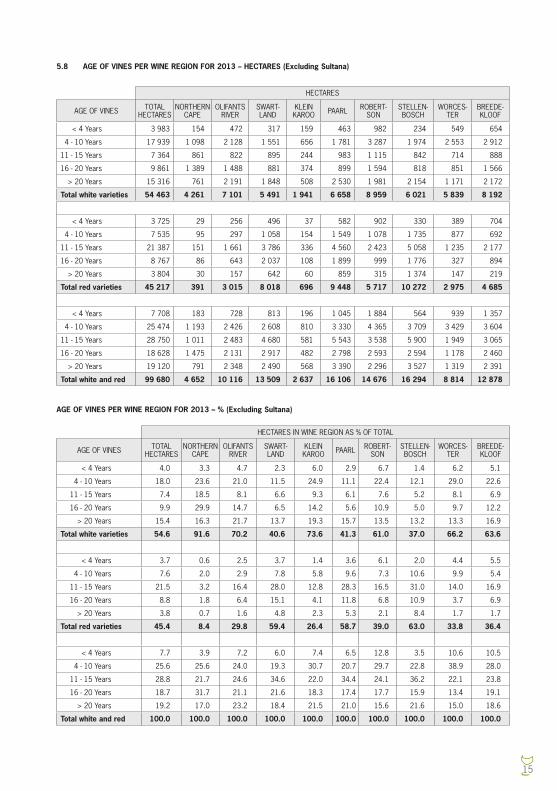
5.8 AGE OF VINES PER WINE REGION FOR 2013 – HECTARES (Excluding Sultana)
HEcTARES
AGE OF VINES TOTAL HEcTARES
NORTHERN cAPE
OLIFANTS RIVER
SWART-LANd
KLEIN KAROO PAARL ROBERT-
SONSTELLEN- BOScH
WORcES- TER
BREEdE- KLOOF
< 4 Years 3 983 154 472 317 159 463 982 234 549 654
4 - 10 Years 17 939 1 098 2 128 1 551 656 1 781 3 287 1 974 2 553 2 912
11 - 15 Years 7 364 861 822 895 244 983 1 115 842 714 888
16 - 20 Years 9 861 1 389 1 488 881 374 899 1 594 818 851 1 566
> 20 Years 15 316 761 2 191 1 848 508 2 530 1 981 2 154 1 171 2 172
Total white varieties 54 463 4 261 7 101 5 491 1 941 6 658 8 959 6 021 5 839 8 192
< 4 Years 3 725 29 256 496 37 582 902 330 389 704
4 - 10 Years 7 535 95 297 1 058 154 1 549 1 078 1 735 877 692
11 - 15 Years 21 387 151 1 661 3 786 336 4 560 2 423 5 058 1 235 2 177
16 - 20 Years 8 767 86 643 2 037 108 1 899 999 1 776 327 894
> 20 Years 3 804 30 157 642 60 859 315 1 374 147 219
Total red varieties 45 217 391 3 015 8 018 696 9 448 5 717 10 272 2 975 4 685
< 4 Years 7 708 183 728 813 196 1 045 1 884 564 939 1 357
4 - 10 Years 25 474 1 193 2 426 2 608 810 3 330 4 365 3 709 3 429 3 604
11 - 15 Years 28 750 1 011 2 483 4 680 581 5 543 3 538 5 900 1 949 3 065
16 - 20 Years 18 628 1 475 2 131 2 917 482 2 798 2 593 2 594 1 178 2 460
> 20 Years 19 120 791 2 348 2 490 568 3 390 2 296 3 527 1 319 2 391
Total white and red 99 680 4 652 10 116 13 509 2 637 16 106 14 676 16 294 8 814 12 878
HEcTARES IN WINE REGION AS % OF TOTAL
AGE OF VINES TOTAL HEcTARES
NORTHERN cAPE
OLIFANTS RIVER
SWART-LANd
KLEIN KAROO PAARL ROBERT-
SONSTELLEN- BOScH
WORcES- TER
BREEdE- KLOOF
< 4 Years 4.0 3.3 4.7 2.3 6.0 2.9 6.7 1.4 6.2 5.1
4 - 10 Years 18.0 23.6 21.0 11.5 24.9 11.1 22.4 12.1 29.0 22.6
11 - 15 Years 7.4 18.5 8.1 6.6 9.3 6.1 7.6 5.2 8.1 6.9
16 - 20 Years 9.9 29.9 14.7 6.5 14.2 5.6 10.9 5.0 9.7 12.2
> 20 Years 15.4 16.3 21.7 13.7 19.3 15.7 13.5 13.2 13.3 16.9
Total white varieties 54.6 91.6 70.2 40.6 73.6 41.3 61.0 37.0 66.2 63.6
< 4 Years 3.7 0.6 2.5 3.7 1.4 3.6 6.1 2.0 4.4 5.5
4 - 10 Years 7.6 2.0 2.9 7.8 5.8 9.6 7.3 10.6 9.9 5.4
11 - 15 Years 21.5 3.2 16.4 28.0 12.8 28.3 16.5 31.0 14.0 16.9
16 - 20 Years 8.8 1.8 6.4 15.1 4.1 11.8 6.8 10.9 3.7 6.9
> 20 Years 3.8 0.7 1.6 4.8 2.3 5.3 2.1 8.4 1.7 1.7
Total red varieties 45.4 8.4 29.8 59.4 26.4 58.7 39.0 63.0 33.8 36.4
< 4 Years 7.7 3.9 7.2 6.0 7.4 6.5 12.8 3.5 10.6 10.5
4 - 10 Years 25.6 25.6 24.0 19.3 30.7 20.7 29.7 22.8 38.9 28.0
11 - 15 Years 28.8 21.7 24.6 34.6 22.0 34.4 24.1 36.2 22.1 23.8
16 - 20 Years 18.7 31.7 21.1 21.6 18.3 17.4 17.7 15.9 13.4 19.1
> 20 Years 19.2 17.0 23.2 18.4 21.5 21.0 15.6 21.6 15.0 18.6
Total white and red 100.0 100.0 100.0 100.0 100.0 100.0 100.0 100.0 100.0 100.0
AGE OF VINES PER WINE REGION FOR 2013 – % (Excluding Sultana)

16
6 PRODUCTION AND UTILISATION OF CROP6.1 TOTAL CROP
YEAR
GRAPE PROdUc-
TION TONS
WINE PROdUcTS – GROSS LITRE
WINE WINE FOR BRANdY
AVERAGE % ALc/VOL
dISTILLING WINE
AVERAGE % ALc/VOL
GRAPE JUIcE cONcENTRATE
ANd GRAPE JUIcE
AVERAGE % ALc/VOL
TOTAL WINE cROP
2000 1 098 170 540 233 265 24 825 560 11.46 129 857 983 9.98 142 292 995 10.99 837 209 803
2001 977 461 530 399 518 8 130 916 11.67 108 546 970 10.09 99 407 830 12.04 746 485 234
2002 1 079 875 567 239 847 26 797 303 11.80 124 794 222 10.02 115 324 822 11.65 834 156 194
2003 1 233 689 712 660 742 50 453 126 11.75 122 209 343 9.93 70 692 300 11.71 956 015 511
2004 1 312 184 696 788 280 85 357 180 11.66 145 774 848 9.94 87 776 683 11.54 1 015 696 991
2005 1 171 632 628 482 614 82 927 858 11.84 129 238 525 9.96 64 577 593 11.70 905 226 590
2006 1 301 579 709 717 222 82 116 414 11.48 147 945 171 10.00 73 201 381 10.61 1 012 980 188
2007 1 351 447 730 420 212 101 487 106 11.31 146 361 237 9.96 65 190 234 11.57 1 043 458 789
2008 1 425 612 763 346 054 86 580 058 11.15 166 558 133 9.69 72 530 790 10.66 1 089 015 035
2009 1 347 620 805 111 420 71 424 165 11.49 122 123 936 9.82 34 759 776 11.04 1 033 419 297
2010 1 261 309 779 836 438 39 583 031 11.51 113 275 957 9.82 52 121 679 9.83 984 817 105
2011 1 302 530 831 187 919 34 217 371 11.06 107 184 033 9.50 40 181 527 1 012 770 850
2012 1 414 483 870 940 413 62 257 427 11.31 123 643 055 9.88 40 122 955 1 096 963 850
2013 1 498 701 915 451 775 41 987 289 11.69 140 730 471 10.29 58 738 100 1 156 907 635
PRODUCT AS % OF TOTAL WINE PRODUCTS PRODUCED
% OF cROP
90.0
80.0
70.0
60.0
50.0
40.0
30.0
20.0
10.0
0.0
2003 2013
WINE WINE FOR BRANdY dISTILLING WINE GRAPE JUIcE cONcENTRATE ANd
GRAPE JUIcE

17
6.2 DISTRIBUTION OF PRODUCTION BETWEEN RED AND WHITE
YEARWINE GRAPES UTILISEd
FOR TOTAL WINE MAKING PURPOSESWINE
PROdUcEd
% REd % WHITE % REd % WHITE
2003 28.1 71.9 32.1 67.9
2004 29.9 70.1 36.2 63.8
2005 33.5 66.5 38.9 61.1
2006 33.4 66.6 36.5 63.5
2007 34.4 65.6 36.1 63.9
2008 33.9 66.1 37.6 62.4
2009 33.1 66.9 35.2 64.8
2010 31.6 68.4 34.1 65.9
2011 34.1 65.9 35.0 65.0
2012 31.9 68.1 35.6 64.4
2013 32.2 67.8 37.9 62.1
6.3 VARIETIES UTILISED FOR TOTAL WINE MAKING PURPOSES DURING 2013
% OF VARIETY cRUSHEd BY
VARIETY TOTAL TONS PRIVATE WINE cELLARS
PROdUcER cELLARS
PROdUcING WHOLESALERS
chenin blanc 322 295 10.6 87.0 2.3
colombar(d) 315 273 5.2 94.7 0.1
Sauvignon blanc 105 744 31.8 53.9 14.3
chardonnay 87 533 22.7 67.8 9.6
Muscat d'Alexandrie 36 783 10.8 89.2 0.0
Sémillon 17 498 21.6 72.6 5.8
Muscat de Frontignan (Muscadel) 11 182 31.2 68.6 0.2
Viognier 10 571 26.9 57.6 15.5
Other white varieties 56 969 15.8 75.6 8.6
Table grapes 55 522 26.6 65.2 8.2
Total white varieties 1 019 370 13.9 81.8 4.3
Shiraz 109 454 30.3 55.0 14.7
cabernet Sauvignon 92 775 31.6 52.4 16.0
Merlot 65 849 31.4 53.4 15.1
Pinotage 82 209 25.1 65.1 9.8
Ruby cabernet 33 664 11.2 88.1 0.7
cinsaut 26 024 13.1 83.6 3.4
Petit Verdot 7 982 31.9 48.9 19.2
cabernet Franc 6 625 48.6 34.7 16.7
Other red varieties 34 050 51.2 34.0 14.8
Table grapes 20 699 0.0 100.0 -
Total red varieties 479 331 28.0 60.0 12.0
Total white and red 1 498 701 18.4 74.8 6.7
18
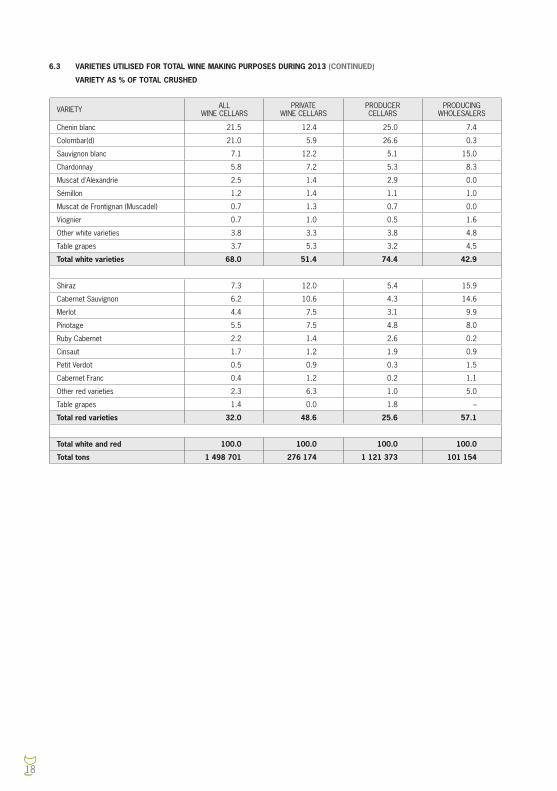
6.3 VARIETIES UTILISED FOR TOTAL WINE MAKING PURPOSES DURING 2013 (CONTINUED)
VARIETY AS % OF TOTAL CRUSHED
VARIETY ALL WINE cELLARS
PRIVATE WINE cELLARS
PROdUcER cELLARS
PROdUcING WHOLESALERS
chenin blanc 21.5 12.4 25.0 7.4
colombar(d) 21.0 5.9 26.6 0.3
Sauvignon blanc 7.1 12.2 5.1 15.0
chardonnay 5.8 7.2 5.3 8.3
Muscat d'Alexandrie 2.5 1.4 2.9 0.0
Sémillon 1.2 1.4 1.1 1.0
Muscat de Frontignan (Muscadel) 0.7 1.3 0.7 0.0
Viognier 0.7 1.0 0.5 1.6
Other white varieties 3.8 3.3 3.8 4.8
Table grapes 3.7 5.3 3.2 4.5
Total white varieties 68.0 51.4 74.4 42.9
Shiraz 7.3 12.0 5.4 15.9
cabernet Sauvignon 6.2 10.6 4.3 14.6
Merlot 4.4 7.5 3.1 9.9
Pinotage 5.5 7.5 4.8 8.0
Ruby cabernet 2.2 1.4 2.6 0.2
cinsaut 1.7 1.2 1.9 0.9
Petit Verdot 0.5 0.9 0.3 1.5
cabernet Franc 0.4 1.2 0.2 1.1
Other red varieties 2.3 6.3 1.0 5.0
Table grapes 1.4 0.0 1.8 –
Total red varieties 32.0 48.6 25.6 57.1
Total white and red 100.0 100.0 100.0 100.0
Total tons 1 498 701 276 174 1 121 373 101 154
19
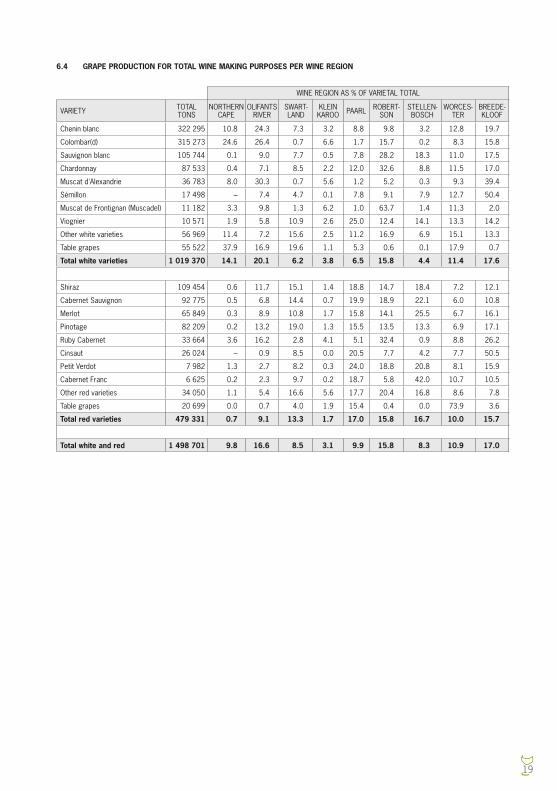
6.4 GRAPE PRODUCTION FOR TOTAL WINE MAKING PURPOSES PER WINE REGION
WINE REGION AS % OF VARIETAL TOTAL
VARIETY TOTAL TONS
NORTHERN cAPE
OLIFANTS RIVER
SWART- LANd
KLEIN KAROO PAARL ROBERT-
SONSTELLEN- BOScH
WORcES- TER
BREEdE- KLOOF
chenin blanc 322 295 10.8 24.3 7.3 3.2 8.8 9.8 3.2 12.8 19.7
colombar(d) 315 273 24.6 26.4 0.7 6.6 1.7 15.7 0.2 8.3 15.8
Sauvignon blanc 105 744 0.1 9.0 7.7 0.5 7.8 28.2 18.3 11.0 17.5
chardonnay 87 533 0.4 7.1 8.5 2.2 12.0 32.6 8.8 11.5 17.0
Muscat d'Alexandrie 36 783 8.0 30.3 0.7 5.6 1.2 5.2 0.3 9.3 39.4
Sémillon 17 498 – 7.4 4.7 0.1 7.8 9.1 7.9 12.7 50.4
Muscat de Frontignan (Muscadel) 11 182 3.3 9.8 1.3 6.2 1.0 63.7 1.4 11.3 2.0
Viognier 10 571 1.9 5.8 10.9 2.6 25.0 12.4 14.1 13.3 14.2
Other white varieties 56 969 11.4 7.2 15.6 2.5 11.2 16.9 6.9 15.1 13.3
Table grapes 55 522 37.9 16.9 19.6 1.1 5.3 0.6 0.1 17.9 0.7
Total white varieties 1 019 370 14.1 20.1 6.2 3.8 6.5 15.8 4.4 11.4 17.6
Shiraz 109 454 0.6 11.7 15.1 1.4 18.8 14.7 18.4 7.2 12.1
cabernet Sauvignon 92 775 0.5 6.8 14.4 0.7 19.9 18.9 22.1 6.0 10.8
Merlot 65 849 0.3 8.9 10.8 1.7 15.8 14.1 25.5 6.7 16.1
Pinotage 82 209 0.2 13.2 19.0 1.3 15.5 13.5 13.3 6.9 17.1
Ruby cabernet 33 664 3.6 16.2 2.8 4.1 5.1 32.4 0.9 8.8 26.2
cinsaut 26 024 – 0.9 8.5 0.0 20.5 7.7 4.2 7.7 50.5
Petit Verdot 7 982 1.3 2.7 8.2 0.3 24.0 18.8 20.8 8.1 15.9
cabernet Franc 6 625 0.2 2.3 9.7 0.2 18.7 5.8 42.0 10.7 10.5
Other red varieties 34 050 1.1 5.4 16.6 5.6 17.7 20.4 16.8 8.6 7.8
Table grapes 20 699 0.0 0.7 4.0 1.9 15.4 0.4 0.0 73.9 3.6
Total red varieties 479 331 0.7 9.1 13.3 1.7 17.0 15.8 16.7 10.0 15.7
Total white and red 1 498 701 9.8 16.6 8.5 3.1 9.9 15.8 8.3 10.9 17.0
20
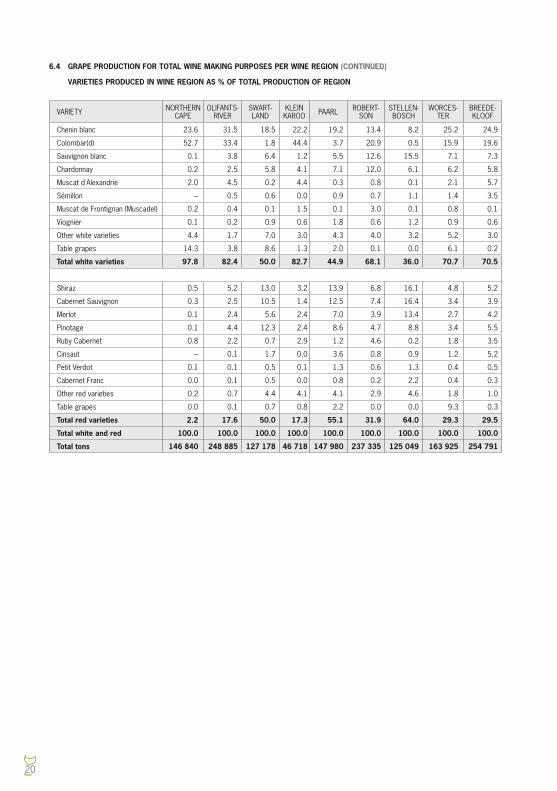
6.4 GRAPE PRODUCTION FOR TOTAL WINE MAKING PURPOSES PER WINE REGION (CONTINUED)
VARIETIES PRODUCED IN WINE REGION AS % OF TOTAL PRODUCTION OF REGION
VARIETY NORTHERN cAPE
OLIFANTS- RIVER
SWART- LANd
KLEIN KAROO PAARL ROBERT-
SONSTELLEN- BOScH
WORcES- TER
BREEdE- KLOOF
chenin blanc 23.6 31.5 18.5 22.2 19.2 13.4 8.2 25.2 24.9
colombar(d) 52.7 33.4 1.8 44.4 3.7 20.9 0.5 15.9 19.6
Sauvignon blanc 0.1 3.8 6.4 1.2 5.5 12.6 15.5 7.1 7.3
chardonnay 0.2 2.5 5.8 4.1 7.1 12.0 6.1 6.2 5.8
Muscat d'Alexandrie 2.0 4.5 0.2 4.4 0.3 0.8 0.1 2.1 5.7
Sémillon – 0.5 0.6 0.0 0.9 0.7 1.1 1.4 3.5
Muscat de Frontignan (Muscadel) 0.2 0.4 0.1 1.5 0.1 3.0 0.1 0.8 0.1
Viognier 0.1 0.2 0.9 0.6 1.8 0.6 1.2 0.9 0.6
Other white varieties 4.4 1.7 7.0 3.0 4.3 4.0 3.2 5.2 3.0
Table grapes 14.3 3.8 8.6 1.3 2.0 0.1 0.0 6.1 0.2
Total white varieties 97.8 82.4 50.0 82.7 44.9 68.1 36.0 70.7 70.5
Shiraz 0.5 5.2 13.0 3.2 13.9 6.8 16.1 4.8 5.2
cabernet Sauvignon 0.3 2.5 10.5 1.4 12.5 7.4 16.4 3.4 3.9
Merlot 0.1 2.4 5.6 2.4 7.0 3.9 13.4 2.7 4.2
Pinotage 0.1 4.4 12.3 2.4 8.6 4.7 8.8 3.4 5.5
Ruby cabernet 0.8 2.2 0.7 2.9 1.2 4.6 0.2 1.8 3.5
cinsaut – 0.1 1.7 0.0 3.6 0.8 0.9 1.2 5.2
Petit Verdot 0.1 0.1 0.5 0.1 1.3 0.6 1.3 0.4 0.5
cabernet Franc 0.0 0.1 0.5 0.0 0.8 0.2 2.2 0.4 0.3
Other red varieties 0.2 0.7 4.4 4.1 4.1 2.9 4.6 1.8 1.0
Table grapes 0.0 0.1 0.7 0.8 2.2 0.0 0.0 9.3 0.3
Total red varieties 2.2 17.6 50.0 17.3 55.1 31.9 64.0 29.3 29.5
Total white and red 100.0 100.0 100.0 100.0 100.0 100.0 100.0 100.0 100.0
Total tons 146 840 248 885 127 178 46 718 147 980 237 335 125 049 163 925 254 791
21
CERTIFIED WINE
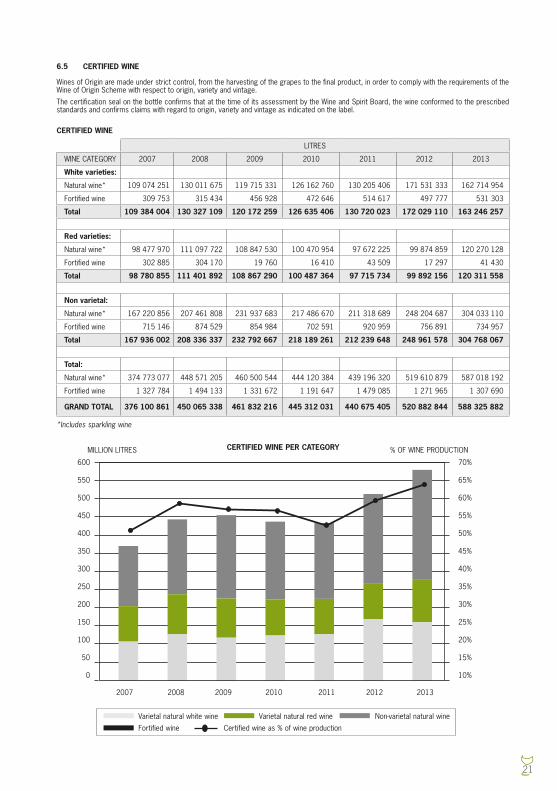
6.5 CERTIFIED WINE
Wines of Origin are made under strict control, from the harvesting of the grapes to the final product, in order to comply with the requirements of the Wine of Origin Scheme with respect to origin, variety and vintage.
The certification seal on the bottle confirms that at the time of its assessment by the Wine and Spirit Board, the wine conformed to the prescribed standards and confirms claims with regard to origin, variety and vintage as indicated on the label.
*Includes sparkling wine
LITRES
WINE cATEGORY 2007 2008 2009 2010 2011 2012 2013
White varieties:
Natural wine* 109 074 251 130 011 675 119 715 331 126 162 760 130 205 406 171 531 333 162 714 954
Fortified wine 309 753 315 434 456 928 472 646 514 617 497 777 531 303
Total 109 384 004 130 327 109 120 172 259 126 635 406 130 720 023 172 029 110 163 246 257
Red varieties:
Natural wine* 98 477 970 111 097 722 108 847 530 100 470 954 97 672 225 99 874 859 120 270 128
Fortified wine 302 885 304 170 19 760 16 410 43 509 17 297 41 430
Total 98 780 855 111 401 892 108 867 290 100 487 364 97 715 734 99 892 156 120 311 558
Non varietal:
Natural wine* 167 220 856 207 461 808 231 937 683 217 486 670 211 318 689 248 204 687 304 033 110
Fortified wine 715 146 874 529 854 984 702 591 920 959 756 891 734 957
Total 167 936 002 208 336 337 232 792 667 218 189 261 212 239 648 248 961 578 304 768 067
Total:
Natural wine* 374 773 077 448 571 205 460 500 544 444 120 384 439 196 320 519 610 879 587 018 192
Fortified wine 1 327 784 1 494 133 1 331 672 1 191 647 1 479 085 1 271 965 1 307 690
GRAND TOTAL 376 100 861 450 065 338 461 832 216 445 312 031 440 675 405 520 882 844 588 325 882
CERTIFIED WINE PER CATEGORYMILLION LITRES % OF WINE PROdUcTION
Varietal natural white wine
Fortified wine certified wine as % of wine production
Varietal natural red wine Non-varietal natural wineVarietal natural white wine
Fortified wine certified wine as % of wine production
Varietal natural red wine Non-varietal natural wine
600
550
500
450
400
350
300
250
200
150
100
50
0
2007 2008 2009 2010 2011 2012 2013
70%
65%
60%
55%
50%
45%
40%
35%
30%
25%
20%
15%
10%
22
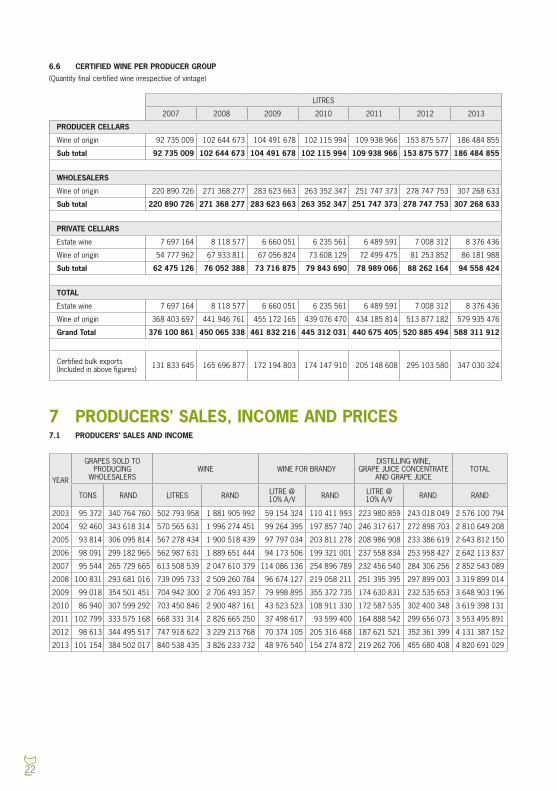
6.6 CERTIFIED WINE PER PRODUCER GROUP
(Quantity final certified wine irrespective of vintage)
LITRES
2007 2008 2009 2010 2011 2012 2013
PRODUCER CELLARS
Wine of origin 92 735 009 102 644 673 104 491 678 102 115 994 109 938 966 153 875 577 186 484 855
Sub total 92 735 009 102 644 673 104 491 678 102 115 994 109 938 966 153 875 577 186 484 855
WHOLESALERS
Wine of origin 220 890 726 271 368 277 283 623 663 263 352 347 251 747 373 278 747 753 307 268 633
Sub total 220 890 726 271 368 277 283 623 663 263 352 347 251 747 373 278 747 753 307 268 633
PRIVATE CELLARS
Estate wine 7 697 164 8 118 577 6 660 051 6 235 561 6 489 591 7 008 312 8 376 436
Wine of origin 54 777 962 67 933 811 67 056 824 73 608 129 72 499 475 81 253 852 86 181 988
Sub total 62 475 126 76 052 388 73 716 875 79 843 690 78 989 066 88 262 164 94 558 424
TOTAL
Estate wine 7 697 164 8 118 577 6 660 051 6 235 561 6 489 591 7 008 312 8 376 436
Wine of origin 368 403 697 441 946 761 455 172 165 439 076 470 434 185 814 513 877 182 579 935 476
Grand Total 376 100 861 450 065 338 461 832 216 445 312 031 440 675 405 520 885 494 588 311 912
certified bulk exports (Included in above figures) 131 833 645 165 696 877 172 194 803 174 147 910 205 148 608 295 103 580 347 030 324
YEAR
GRAPES SOLd TO PROdUcING
WHOLESALERSWINE WINE FOR BRANdY
dISTILLING WINE, GRAPE JUIcE cONcENTRATE
ANd GRAPE JUIcETOTAL
TONS RANd LITRES RANd LITRE @ 10% A/V RANd LITRE @
10% A/V RANd RANd
2003 95 372 340 764 760 502 793 958 1 881 905 992 59 154 324 110 411 993 223 980 859 243 018 049 2 576 100 794
2004 92 460 343 618 314 570 565 631 1 996 274 451 99 264 395 197 857 740 246 317 617 272 898 703 2 810 649 208
2005 93 814 306 095 814 567 278 434 1 900 518 439 97 797 034 203 811 278 208 986 908 233 386 619 2 643 812 150
2006 98 091 299 182 965 562 987 631 1 889 651 444 94 173 506 199 321 001 237 558 834 253 958 427 2 642 113 837
2007 95 544 265 729 665 613 508 539 2 047 610 379 114 086 136 254 896 789 232 456 540 284 306 256 2 852 543 089
2008 100 831 293 681 016 739 095 733 2 509 260 784 96 674 127 219 058 211 251 395 395 297 899 003 3 319 899 014
2009 99 018 354 501 451 704 942 300 2 706 493 357 79 998 895 355 372 735 174 630 831 232 535 653 3 648 903 196
2010 86 940 307 599 292 703 450 846 2 900 487 161 43 523 523 108 911 330 172 587 535 302 400 348 3 619 398 131
2011 102 799 333 575 168 668 331 314 2 826 665 250 37 498 617 93 599 400 164 888 542 299 656 073 3 553 495 891
2012 98 613 344 495 517 747 918 622 3 229 213 768 70 374 105 205 316 468 187 621 521 352 361 399 4 131 387 152
2013 101 154 384 502 017 840 538 435 3 826 233 732 48 976 540 154 274 872 219 262 706 455 680 408 4 820 691 029
7 PRODUCERS’ SALES, INCOME AND PRICES7.1 PRODUCERS’ SALES AND INCOME
23
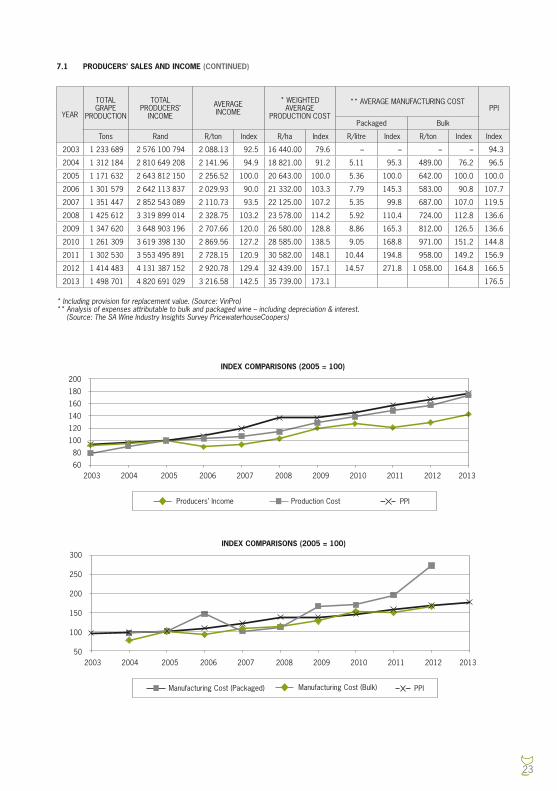
YEAR
TOTAL GRAPE
PROdUcTION
TOTAL PROdUcERS’
INcOME
AVERAGE INcOME
* WEIGHTEd AVERAGE
PROdUcTION cOST
** AVERAGE MANUFAcTURING cOSTPPI
Packaged Bulk
Tons Rand R/ton Index R/ha Index R/litre Index R/ton Index Index
2003 1 233 689 2 576 100 794 2 088.13 92.5 16 440.00 79.6 – – – – 94.3
2004 1 312 184 2 810 649 208 2 141.96 94.9 18 821.00 91.2 5.11 95.3 489.00 76.2 96.5
2005 1 171 632 2 643 812 150 2 256.52 100.0 20 643.00 100.0 5.36 100.0 642.00 100.0 100.0
2006 1 301 579 2 642 113 837 2 029.93 90.0 21 332.00 103.3 7.79 145.3 583.00 90.8 107.7
2007 1 351 447 2 852 543 089 2 110.73 93.5 22 125.00 107.2 5.35 99.8 687.00 107.0 119.5
2008 1 425 612 3 319 899 014 2 328.75 103.2 23 578.00 114.2 5.92 110.4 724.00 112.8 136.6
2009 1 347 620 3 648 903 196 2 707.66 120.0 26 580.00 128.8 8.86 165.3 812.00 126.5 136.6
2010 1 261 309 3 619 398 130 2 869.56 127.2 28 585.00 138.5 9.05 168.8 971.00 151.2 144.8
2011 1 302 530 3 553 495 891 2 728.15 120.9 30 582.00 148.1 10.44 194.8 958.00 149.2 156.9
2012 1 414 483 4 131 387 152 2 920.78 129.4 32 439.00 157.1 14.57 271.8 1 058.00 164.8 166.5
2013 1 498 701 4 820 691 029 3 216.58 142.5 35 739.00 173.1 176.5
* Including provision for replacement value. (Source: VinPro)** Analysis of expenses attributable to bulk and packaged wine – including depreciation & interest.
(Source: The SA Wine Industry Insights Survey PricewaterhouseCoopers)
7.1 PRODUCERS’ SALES AND INCOME (CONTINUED)
INDEX COMPARISONS (2005 = 100)
200
180
160
140
120
100
80
602003 2004 2005 2006 2007 2008 2009 2010 2011 20132012
PPIProduction costProducers’ Income
INDEX COMPARISONS (2005 = 100)
2003 2004 2005 2006 2007 2008 2009 2010 2011 20132012
PPIManufacturing cost (Packaged) Manufacturing cost (Bulk)
300
250
200
150
100
50
24
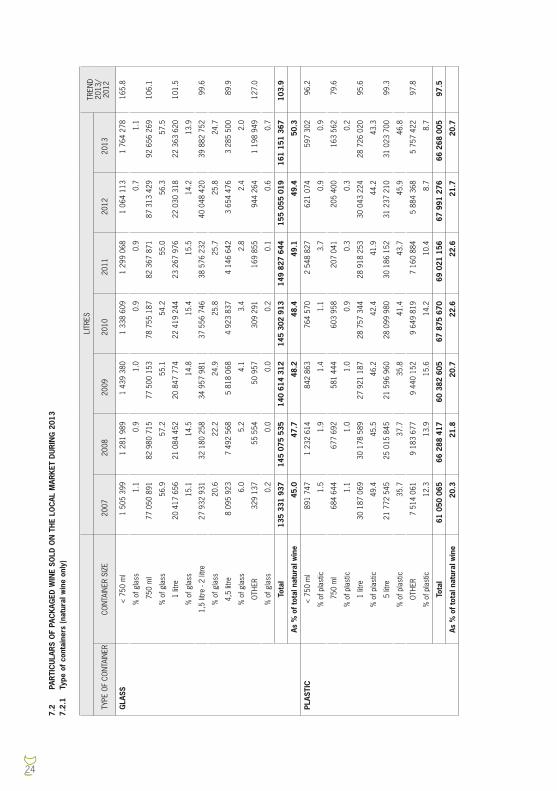
7.2
PAR
TIC
ULA
RS
OF
PAC
KAG
ED W
INE
SOLD
ON
TH
E LO
CAL
MAR
KET
DU
RIN
G 2
013
7.2.
1 Ty
pe o
f co
ntai
ners
(na
tura
l win
e on
ly)
LITR
ESTR
ENd
2013
/ 20
12TY
PE O
F cO
NTA
INER
cON
TAIN
ER S
IZE
2007
2008
2009
2010
2011
2012
2013
GLA
SS<
750
ml
1 5
05 3
99 1
281
989
1 4
39 3
80 1
338
609
1 2
99 0
68 1
064
113
1 7
64 2
7816
5.8
% o
f gla
ss1.
10.
91.
00.
90.
90.
71.
1
750
ml
77
050
891
82
980
715
77
500
153
78
755
187
82
367
871
87
313
429
92
656
269
106.
1
% o
f gla
ss56
.957
.255
.154
.255
.056
.357
.5
1 lit
re 2
0 41
7 65
6 2
1 08
4 45
2 2
0 84
7 77
4 2
2 41
9 24
4 2
3 26
7 97
6 2
2 03
0 31
8 2
2 36
3 62
010
1.5
% o
f gla
ss15
.114
.514
.815
.415
.514
.213
.9
1,5
litre
- 2
litre
27
932
931
32
180
258
34
957
981
37
556
746
38
576
232
40
048
420
39
882
752
99.6
% o
f gla
ss20
.622
.224
.925
.825
.725
.824
.7
4,5
litre
8 0
95 9
23 7
492
568
5 8
18 0
68 4
923
837
4 1
46 6
42 3
654
476
3 2
85 5
0089
.9
% o
f gla
ss6.
05.
24.
13.
42.
82.
42.
0
OTH
ER 3
29 1
37 5
5 55
4 5
0 95
7 3
09 2
91 1
69 8
55 9
44 2
64 1
198
949
127.
0
% o
f gla
ss0.
20.
00.
00.
20.
10.
60.
7
Tota
l 1
35 3
31 9
37 1
45 0
75 5
35 1
40 6
14 3
12 1
45 3
02 9
13 1
49 8
27 6
44 1
55 0
55 0
19 1
61 1
51 3
6710
3.9
As %
of t
otal
nat
ural
win
e45
.047
.748
.248
.449
.149
.450
.3
PLAS
TIC
< 7
50 m
l 8
91 7
47 1
232
614
842
863
764
570
2 5
48 8
27 6
21 0
74 5
97 3
0296
.2
% o
f pla
stic
1.5
1.9
1.4
1.1
3.7
0.9
0.9
750
ml
684
644
677
692
581
444
603
958
207
041
205
400
163
562
79.6
% o
f pla
stic
1.1
1.0
1.0
0.9
0.3
0.3
0.2
1 lit
re 3
0 18
7 06
9 3
0 17
8 58
9 2
7 92
1 18
7 2
8 75
7 34
4 2
8 91
8 25
3 3
0 04
3 22
4 2
8 72
6 02
095
.6
% o
f pla
stic
49.4
45.5
46.2
42.4
41.9
44.2
43.3
5 lit
re 2
1 77
2 54
5 2
5 01
5 84
5 2
1 59
6 96
0 2
8 09
9 98
0 3
0 18
6 15
2 3
1 23
7 21
0 3
1 02
3 70
099
.3
% o
f pla
stic
35.7
37.7
35.8
41.4
43.7
45.9
46.8
OTH
ER 7
514
061
9 1
83 6
77 9
440
152
9 6
49 8
19 7
160
884
5 8
84 3
68 5
757
422
97.8
% o
f pla
stic
12.3
13.9
15.6
14.2
10.4
8.7
8.7
Tota
l 6
1 05
0 06
5 6
6 28
8 41
7 6
0 38
2 60
5 6
7 87
5 67
0 6
9 02
1 15
6 6
7 99
1 27
6 6
6 26
8 00
597
.5
As %
of t
otal
nat
ural
win
e20
.321
.820
.722
.622
.621
.720
.7
25
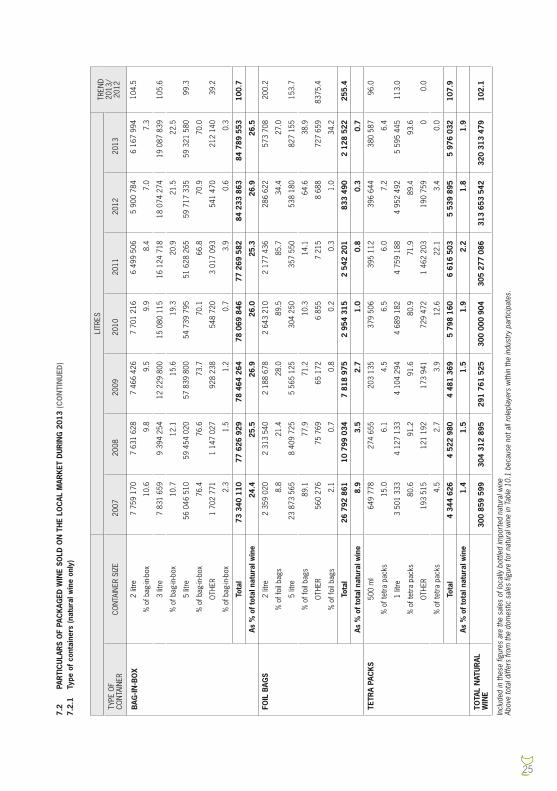
7.2
PAR
TIC
ULA
RS
OF
PAC
KAG
ED W
INE
SOLD
ON
TH
E LO
CAL
MAR
KET
DU
RIN
G 2
013
(CO
NTI
NU
ED)
7.2.
1 Ty
pe o
f co
ntai
ners
(na
tura
l win
e on
ly)
LITR
ESTR
ENd
2013
/ 20
12TY
PE O
F
cON
TAIN
ERcO
NTA
INER
SIZ
E20
0720
0820
0920
1020
1120
1220
13
BAG
-IN-B
OX
2 lit
re 7
759
170
7 6
31 6
28 7
466
426
7 7
01 2
16 6
499
506
5 9
00 7
84 6
167
994
104.
5
% o
f bag
-in-b
ox10
.69.
89.
59.
98.
47.
07.
3
3 lit
re 7
831
659
9 3
94 2
54 1
2 22
9 80
0 1
5 08
0 11
5 1
6 12
4 71
8 1
8 07
4 27
4 1
9 08
7 83
910
5.6
% o
f bag
-in-b
ox10
.712
.115
.619
.320
.921
.522
.5
5 lit
re 5
6 04
6 51
0 5
9 45
4 02
0 5
7 83
9 80
0 5
4 73
9 79
5 5
1 62
8 26
5 5
9 71
7 33
5 5
9 32
1 58
099
.3
% o
f bag
-in-b
ox76
.476
.673
.770
.166
.870
.970
.0
OTH
ER 1
702
771
1 1
47 0
27 9
28 2
38 5
48 7
20 3
017
093
541
470
212
140
39.2
% o
f bag
-in-b
ox2.
31.
51.
20.
73.
90.
60.
3
Tota
l 7
3 34
0 11
0 7
7 62
6 92
9 7
8 46
4 26
4 7
8 06
9 84
6 7
7 26
9 58
2 8
4 23
3 86
3 8
4 78
9 55
310
0.7
As %
of t
otal
nat
ural
win
e24
.425
.526
.926
.025
.326
.926
.5
FOIL
BAG
S2
litre
2 3
59 0
20 2
313
540
2 1
88 6
78 2
643
210
2 1
77 4
36 2
86 6
22 5
73 7
0820
0.2
% o
f foi
l bag
s8.
821
.428
.089
.585
.734
.427
.0
5 lit
re 2
3 87
3 56
5 8
409
725
5 5
65 1
25 3
04 2
50 3
57 5
50 5
38 1
80 8
27 1
5515
3.7
% o
f foi
l bag
s89
.177
.971
.210
.314
.164
.638
.9
OTH
ER 5
60 2
76 7
5 76
9 6
5 17
2 6
855
7 2
15 8
688
727
659
8375
.4
% o
f foi
l bag
s2.
10.
70.
80.
20.
31.
034
.2
Tota
l 2
6 79
2 86
1 1
0 79
9 03
4 7
818
975
2 9
54 3
15 2
542
201
833
490
2 1
28 5
2225
5.4
As %
of t
otal
nat
ural
win
e8.
93.
52.
71.
00.
80.
30.
7
TETR
A PA
CK
S50
0 m
l 6
49 7
78 2
74 6
55 2
03 1
35 3
79 5
06 3
95 1
12 3
96 6
44 3
80 5
8796
.0
% o
f tet
ra p
acks
15.0
6.1
4.5
6.5
6.0
7.2
6.4
1 lit
re 3
501
333
4 1
27 1
33 4
104
294
4 6
89 1
82 4
759
188
4 9
52 4
92 5
595
445
113.
0
% o
f tet
ra p
acks
80.6
91.2
91.6
80.9
71.9
89.4
93.6
OTH
ER 1
93 5
15 1
21 1
92 1
73 9
41 7
29 4
72 1
462
203
190
759
00.
0
% o
f tet
ra p
acks
4.5
2.7
3.9
12.6
22.1
3.4
0.0
Tota
l 4
344
626
4 5
22 9
80 4
481
369
5 7
98 1
60 6
616
503
5 5
39 8
95 5
976
032
107.
9
As %
of t
otal
nat
ural
win
e1.
41.
51.
51.
92.
21.
81.
9
TOTA
L N
ATU
RAL
W
INE
300
859
599
304
312
895
291
761
525
300
000
904
305
277
086
313
653
542
320
313
479
102.
1
Incl
uded
in th
ese
figur
es a
re th
e sa
les
of lo
cally
bot
tled
impo
rted
nat
ural
win
eAb
ove
tota
l diff
ers
from
the
dom
estic
sal
es fi
gure
for
natu
ral w
ine
in T
able
10.
1 be
caus
e no
t all
role
play
ers
with
in th
e in
dust
ry p
artic
ipat
es.

26
7.2.2 TYPE OF WINE SOLD IN 750 ML GLASS CONTAINERS
TYPE OF WINE
LITRES
2007 2008 2009 2010 2011 2012 2013TRENd 2013/ 2012
Natural White
chardonnay 3 122 636 3 233 076 3 072 756 3 168 187 3 264 462 3 324 663 3 625 688 109.1
Sauvignon blanc 8 098 087 8 756 066 9 084 215 10 156 223 10 464 299 11 435 302 11 645 756 101.8
chenin blanc 2 225 445 2 680 921 2 690 998 2 926 754 3 091 773 3 718 030 3 788 365 101.9
dry White 19 228 740 21 130 820 16 702 363 15 402 900 14 998 670 15 201 655 15 684 282 103.2
Semi Sweet 6 213 353 5 658 241 4 601 713 3 851 979 3 651 855 3 665 671 3 705 290 101.1
Total White 38 888 261 41 459 124 36 152 045 35 506 043 35 471 059 37 345 321 38 449 381 103.0
Natural Red
cabernet Sauvignon 4 373 266 4 692 006 4 340 395 4 302 782 4 633 250 5 034 979 5 549 986 110.2
Pinotage 2 849 294 2 848 480 2 899 625 3 186 618 3 585 270 3 617 006 3 791 345 104.8
Shiraz 3 057 393 3 312 598 3 252 802 3 484 483 4 009 149 4 251 149 4 301 129 101.2
Merlot 3 417 955 3 984 226 3 961 517 4 420 435 5 030 761 5 323 908 6 205 162 116.6
Other red 20 424 713 20 932 235 20 464 529 20 850 360 21 998 744 23 368 935 24 377 830 104.3
Total Red 34 122 621 35 769 545 34 918 868 36 244 678 39 257 174 41 595 977 44 225 452 106.3
Rosé / Blanc de Noir 4 040 009 5 752 047 6 429 240 7 004 467 7 639 639 8 372 134 9 981 438 119.2
Sparkling cap classique 1 770 766 1 764 148 1 719 727 1 839 806 1 933 257 1 853 896 2 064 207 111.3
Other Sparkling 7 384 634 7 943 038 6 770 477 7 061 973 6 858 385 6 621 439 6 018 137 90.9
8 EXPORTS8.1 TOTAL QUANTITY OF WINE EXPORTED
YEAR NATURAL WINE
FORTIFIEd WINE
SPARKLING WINE
TOTAL LITRES TRENd
EXPORT AS % OF WINE
PROdUcTION
% cERTIFIEd WINE
EXPORTEd *
2002 215 511 730 520 936 1 360 842 217 393 508 122.6 38.3 –
2003 236 374 075 525 789 1 564 707 238 464 571 109.7 33.5 97.4
2004 265 761 884 413 393 1 552 885 267 728 162 112.3 38.4 93.6
2005 279 128 314 406 982 1 537 824 281 073 120 105.0 44.7 92.3
2006 269 166 416 486 547 2 018 235 271 671 198 96.7 38.3 92.9
2007 309 354 585 405 696 2 779 364 312 539 645 115.0 42.8 89.8
2008 407 319 613 423 207 3 952 009 411 694 829 131.7 53.9 84.3
2009 389 102 275 282 636 6 206 991 395 591 902 96.1 49.1 91.5
2010 370 947 152 401 700 7 174 873 378 523 725 95.7 48.5 92.9
2011 350 414 988 348 858 6 649 735 357 413 581 94.4 43.0 93.8
2012 408 910 702 274 425 8 032 172 417 217 299 116.7 47.9 92.8
2013 517 406 010 282 755 7 897 380 525 586 145 126.0 57.4 88.1
* Available as from 2003
27
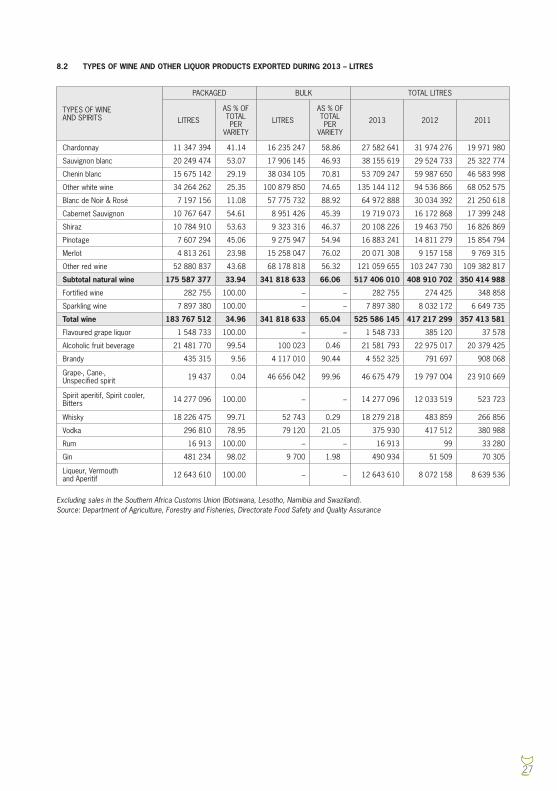
8.2 TYPES OF WINE AND OTHER LIQUOR PRODUCTS EXPORTED DURING 2013 – LITRES
TYPES OF WINE ANd SPIRITS
PAcKAGEd BULK TOTAL LITRES
LITRES
AS % OF TOTAL PER
VARIETY
LITRES
AS % OF TOTAL PER
VARIETY
2013 2012 2011
chardonnay 11 347 394 41.14 16 235 247 58.86 27 582 641 31 974 276 19 971 980
Sauvignon blanc 20 249 474 53.07 17 906 145 46.93 38 155 619 29 524 733 25 322 774
chenin blanc 15 675 142 29.19 38 034 105 70.81 53 709 247 59 987 650 46 583 998
Other white wine 34 264 262 25.35 100 879 850 74.65 135 144 112 94 536 866 68 052 575
Blanc de Noir & Rosé 7 197 156 11.08 57 775 732 88.92 64 972 888 30 034 392 21 250 618
cabernet Sauvignon 10 767 647 54.61 8 951 426 45.39 19 719 073 16 172 868 17 399 248
Shiraz 10 784 910 53.63 9 323 316 46.37 20 108 226 19 463 750 16 826 869
Pinotage 7 607 294 45.06 9 275 947 54.94 16 883 241 14 811 279 15 854 794
Merlot 4 813 261 23.98 15 258 047 76.02 20 071 308 9 157 158 9 769 315
Other red wine 52 880 837 43.68 68 178 818 56.32 121 059 655 103 247 730 109 382 817
Subtotal natural wine 175 587 377 33.94 341 818 633 66.06 517 406 010 408 910 702 350 414 988
Fortified wine 282 755 100.00 – – 282 755 274 425 348 858
Sparkling wine 7 897 380 100.00 – – 7 897 380 8 032 172 6 649 735
Total wine 183 767 512 34.96 341 818 633 65.04 525 586 145 417 217 299 357 413 581
Flavoured grape liquor 1 548 733 100.00 – – 1 548 733 385 120 37 578
Alcoholic fruit beverage 21 481 770 99.54 100 023 0.46 21 581 793 22 975 017 20 379 425
Brandy 435 315 9.56 4 117 010 90.44 4 552 325 791 697 908 068
Grape-, cane-, Unspecified spirit 19 437 0.04 46 656 042 99.96 46 675 479 19 797 004 23 910 669
Spirit aperitif, Spirit cooler, Bitters 14 277 096 100.00 – – 14 277 096 12 033 519 523 723
Whisky 18 226 475 99.71 52 743 0.29 18 279 218 483 859 266 856
Vodka 296 810 78.95 79 120 21.05 375 930 417 512 380 988
Rum 16 913 100.00 – – 16 913 99 33 280
Gin 481 234 98.02 9 700 1.98 490 934 51 509 70 305
Liqueur, Vermouth and Aperitif 12 643 610 100.00 – – 12 643 610 8 072 158 8 639 536
Excluding sales in the Southern Africa Customs Union (Botswana, Lesotho, Namibia and Swaziland).Source: Department of Agriculture, Forestry and Fisheries, Directorate Food Safety and Quality Assurance
28
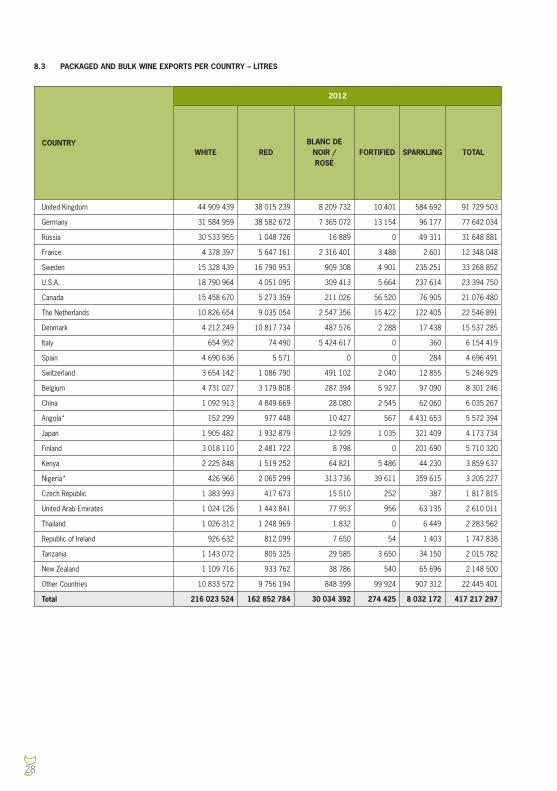
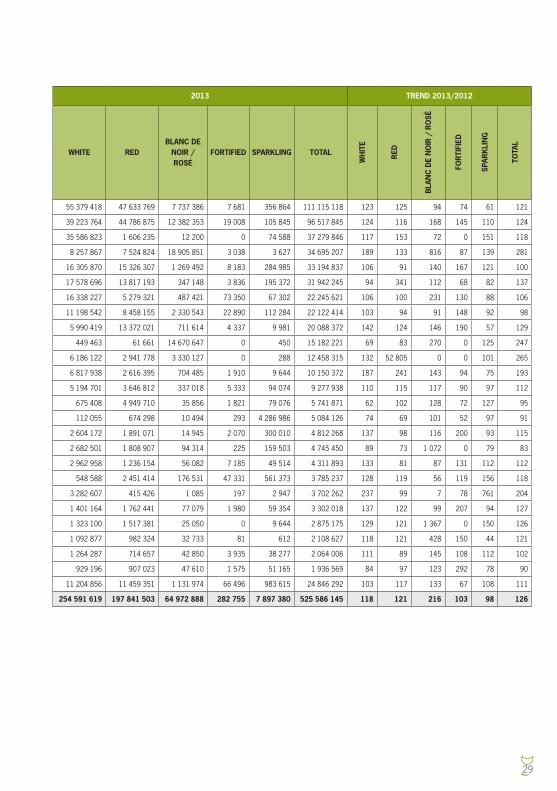
8.3 PACKAGED AND BULK WINE EXPORTS PER COUNTRY – LITRES
COUNTRY
2012 2013 TREND 2013/2012
WHITE REDBLANC DE
NOIR / ROSé
FORTIFIED SPARKLING TOTAL WHITE REDBLANC DE
NOIR / ROSé
FORTIFIED SPARKLING TOTAL
WH
ITE
RED
BLA
NC
DE
NO
IR /
RO
Sé
FOR
TIFI
ED
SPAR
K LI
NG
TOTA
L
United Kingdom 44 909 439 38 015 239 8 209 732 10 401 584 692 91 729 503 55 379 418 47 633 769 7 737 386 7 681 356 864 111 115 118 123 125 94 74 61 121
Germany 31 584 959 38 582 672 7 365 072 13 154 96 177 77 642 034 39 223 764 44 786 875 12 382 353 19 008 105 845 96 517 845 124 116 168 145 110 124
Russia 30 533 955 1 048 726 16 889 0 49 311 31 648 881 35 586 823 1 606 235 12 200 0 74 588 37 279 846 117 153 72 0 151 118
France 4 378 397 5 647 161 2 316 401 3 488 2 601 12 348 048 8 257 867 7 524 824 18 905 851 3 038 3 627 34 695 207 189 133 816 87 139 281
Sweden 15 328 439 16 790 953 909 308 4 901 235 251 33 268 852 16 305 870 15 326 307 1 269 492 8 183 284 985 33 194 837 106 91 140 167 121 100
U.S.A. 18 790 964 4 051 095 309 413 5 664 237 614 23 394 750 17 578 696 13 817 193 347 148 3 836 195 372 31 942 245 94 341 112 68 82 137
canada 15 458 670 5 273 359 211 026 56 520 76 905 21 076 480 16 338 227 5 279 321 487 421 73 350 67 302 22 245 621 106 100 231 130 88 106
The Netherlands 10 826 654 9 035 054 2 547 356 15 422 122 405 22 546 891 11 198 542 8 458 155 2 330 543 22 890 112 284 22 122 414 103 94 91 148 92 98
denmark 4 212 249 10 817 734 487 576 2 288 17 438 15 537 285 5 990 419 13 372 021 711 614 4 337 9 981 20 088 372 142 124 146 190 57 129
Italy 654 952 74 490 5 424 617 0 360 6 154 419 449 463 61 661 14 670 647 0 450 15 182 221 69 83 270 0 125 247
Spain 4 690 636 5 571 0 0 284 4 696 491 6 186 122 2 941 778 3 330 127 0 288 12 458 315 132 52 805 0 0 101 265
Switzerland 3 654 142 1 086 790 491 102 2 040 12 855 5 246 929 6 817 938 2 616 395 704 485 1 910 9 644 10 150 372 187 241 143 94 75 193
Belgium 4 731 027 3 179 808 287 394 5 927 97 090 8 301 246 5 194 701 3 646 812 337 018 5 333 94 074 9 277 938 110 115 117 90 97 112
china 1 092 913 4 849 669 28 080 2 545 62 060 6 035 267 675 408 4 949 710 35 856 1 821 79 076 5 741 871 62 102 128 72 127 95
Angola* 152 299 977 448 10 427 567 4 431 653 5 572 394 112 055 674 298 10 494 293 4 286 986 5 084 126 74 69 101 52 97 91
Japan 1 905 482 1 932 879 12 929 1 035 321 409 4 173 734 2 604 172 1 891 071 14 945 2 070 300 010 4 812 268 137 98 116 200 93 115
Finland 3 018 110 2 481 722 8 798 0 201 690 5 710 320 2 682 501 1 808 907 94 314 225 159 503 4 745 450 89 73 1 072 0 79 83
Kenya 2 225 848 1 519 252 64 821 5 486 44 230 3 859 637 2 962 958 1 236 154 56 082 7 185 49 514 4 311 893 133 81 87 131 112 112
Nigeria* 426 966 2 065 299 313 736 39 611 359 615 3 205 227 548 588 2 451 414 176 531 47 331 561 373 3 785 237 128 119 56 119 156 118
czech Republic 1 383 993 417 673 15 510 252 387 1 817 815 3 282 607 415 426 1 085 197 2 947 3 702 262 237 99 7 78 761 204
United Arab Emirates 1 024 126 1 443 841 77 953 956 63 135 2 610 011 1 401 164 1 762 441 77 079 1 980 59 354 3 302 018 137 122 99 207 94 127
Thailand 1 026 312 1 248 969 1 832 0 6 449 2 283 562 1 323 100 1 517 381 25 050 0 9 644 2 875 175 129 121 1 367 0 150 126
Republic of Ireland 926 632 812 099 7 650 54 1 403 1 747 838 1 092 877 982 324 32 733 81 612 2 108 627 118 121 428 150 44 121
Tanzania 1 143 072 805 325 29 585 3 650 34 150 2 015 782 1 264 287 714 657 42 850 3 935 38 277 2 064 006 111 89 145 108 112 102
New Zealand 1 109 716 933 762 38 786 540 65 696 2 148 500 929 196 907 023 47 610 1 575 51 165 1 936 569 84 97 123 292 78 90
Other countries 10 833 572 9 756 194 848 399 99 924 907 312 22 445 401 11 204 856 11 459 351 1 131 974 66 496 983 615 24 846 292 103 117 133 67 108 111
Total 216 023 524 162 852 784 30 034 392 274 425 8 032 172 417 217 297 254 591 619 197 841 503 64 972 888 282 755 7 897 380 525 586 145 118 121 216 103 98 126
29
COUNTRY
2012 2013 TREND 2013/2012
WHITE REDBLANC DE
NOIR / ROSé
FORTIFIED SPARKLING TOTAL WHITE REDBLANC DE
NOIR / ROSé
FORTIFIED SPARKLING TOTAL
WH
ITE
RED
BLA
NC
DE
NO
IR /
RO
Sé
FOR
TIFI
ED
SPAR
K LI
NG
TOTA
L
United Kingdom 44 909 439 38 015 239 8 209 732 10 401 584 692 91 729 503 55 379 418 47 633 769 7 737 386 7 681 356 864 111 115 118 123 125 94 74 61 121
Germany 31 584 959 38 582 672 7 365 072 13 154 96 177 77 642 034 39 223 764 44 786 875 12 382 353 19 008 105 845 96 517 845 124 116 168 145 110 124
Russia 30 533 955 1 048 726 16 889 0 49 311 31 648 881 35 586 823 1 606 235 12 200 0 74 588 37 279 846 117 153 72 0 151 118
France 4 378 397 5 647 161 2 316 401 3 488 2 601 12 348 048 8 257 867 7 524 824 18 905 851 3 038 3 627 34 695 207 189 133 816 87 139 281
Sweden 15 328 439 16 790 953 909 308 4 901 235 251 33 268 852 16 305 870 15 326 307 1 269 492 8 183 284 985 33 194 837 106 91 140 167 121 100
U.S.A. 18 790 964 4 051 095 309 413 5 664 237 614 23 394 750 17 578 696 13 817 193 347 148 3 836 195 372 31 942 245 94 341 112 68 82 137
canada 15 458 670 5 273 359 211 026 56 520 76 905 21 076 480 16 338 227 5 279 321 487 421 73 350 67 302 22 245 621 106 100 231 130 88 106
The Netherlands 10 826 654 9 035 054 2 547 356 15 422 122 405 22 546 891 11 198 542 8 458 155 2 330 543 22 890 112 284 22 122 414 103 94 91 148 92 98
denmark 4 212 249 10 817 734 487 576 2 288 17 438 15 537 285 5 990 419 13 372 021 711 614 4 337 9 981 20 088 372 142 124 146 190 57 129
Italy 654 952 74 490 5 424 617 0 360 6 154 419 449 463 61 661 14 670 647 0 450 15 182 221 69 83 270 0 125 247
Spain 4 690 636 5 571 0 0 284 4 696 491 6 186 122 2 941 778 3 330 127 0 288 12 458 315 132 52 805 0 0 101 265
Switzerland 3 654 142 1 086 790 491 102 2 040 12 855 5 246 929 6 817 938 2 616 395 704 485 1 910 9 644 10 150 372 187 241 143 94 75 193
Belgium 4 731 027 3 179 808 287 394 5 927 97 090 8 301 246 5 194 701 3 646 812 337 018 5 333 94 074 9 277 938 110 115 117 90 97 112
china 1 092 913 4 849 669 28 080 2 545 62 060 6 035 267 675 408 4 949 710 35 856 1 821 79 076 5 741 871 62 102 128 72 127 95
Angola* 152 299 977 448 10 427 567 4 431 653 5 572 394 112 055 674 298 10 494 293 4 286 986 5 084 126 74 69 101 52 97 91
Japan 1 905 482 1 932 879 12 929 1 035 321 409 4 173 734 2 604 172 1 891 071 14 945 2 070 300 010 4 812 268 137 98 116 200 93 115
Finland 3 018 110 2 481 722 8 798 0 201 690 5 710 320 2 682 501 1 808 907 94 314 225 159 503 4 745 450 89 73 1 072 0 79 83
Kenya 2 225 848 1 519 252 64 821 5 486 44 230 3 859 637 2 962 958 1 236 154 56 082 7 185 49 514 4 311 893 133 81 87 131 112 112
Nigeria* 426 966 2 065 299 313 736 39 611 359 615 3 205 227 548 588 2 451 414 176 531 47 331 561 373 3 785 237 128 119 56 119 156 118
czech Republic 1 383 993 417 673 15 510 252 387 1 817 815 3 282 607 415 426 1 085 197 2 947 3 702 262 237 99 7 78 761 204
United Arab Emirates 1 024 126 1 443 841 77 953 956 63 135 2 610 011 1 401 164 1 762 441 77 079 1 980 59 354 3 302 018 137 122 99 207 94 127
Thailand 1 026 312 1 248 969 1 832 0 6 449 2 283 562 1 323 100 1 517 381 25 050 0 9 644 2 875 175 129 121 1 367 0 150 126
Republic of Ireland 926 632 812 099 7 650 54 1 403 1 747 838 1 092 877 982 324 32 733 81 612 2 108 627 118 121 428 150 44 121
Tanzania 1 143 072 805 325 29 585 3 650 34 150 2 015 782 1 264 287 714 657 42 850 3 935 38 277 2 064 006 111 89 145 108 112 102
New Zealand 1 109 716 933 762 38 786 540 65 696 2 148 500 929 196 907 023 47 610 1 575 51 165 1 936 569 84 97 123 292 78 90
Other countries 10 833 572 9 756 194 848 399 99 924 907 312 22 445 401 11 204 856 11 459 351 1 131 974 66 496 983 615 24 846 292 103 117 133 67 108 111
Total 216 023 524 162 852 784 30 034 392 274 425 8 032 172 417 217 297 254 591 619 197 841 503 64 972 888 282 755 7 897 380 525 586 145 118 121 216 103 98 126
30
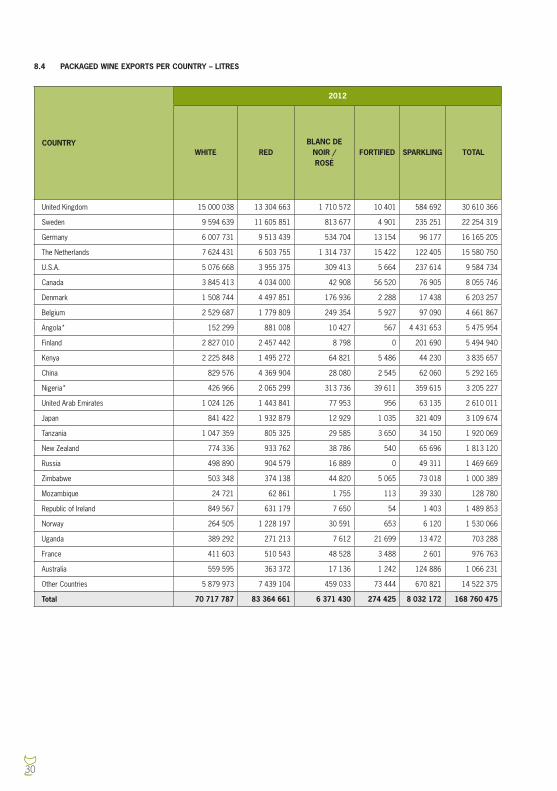
8.4 PACKAGED WINE EXPORTS PER COUNTRY – LITRES
COUNTRY
2012 2013 TREND 2013/2012
WHITE REDBLANC DE
NOIR / ROSé
FORTIFIED SPARKLING TOTAL WHITE REDBLANC DE
NOIR / ROSé
FORTIFIED SPARKLING TOTAL
WH
ITE
RED
BLA
NC
DE
NO
IR /
RO
Sé
FOR
TIFI
ED
SPAR
K LI
NG
TOTA
L
United Kingdom 15 000 038 13 304 663 1 710 572 10 401 584 692 30 610 366 20 729 208 16 694 293 2 266 950 7 681 356 864 40 054 996 138 125 133 74 61 131
Sweden 9 594 639 11 605 851 813 677 4 901 235 251 22 254 319 10 572 410 9 546 249 910 472 8 183 284 985 21 322 299 110 82 112 167 121 96
Germany 6 007 731 9 513 439 534 704 13 154 96 177 16 165 205 7 158 111 11 091 524 486 655 19 008 105 845 18 861 143 119 117 91 145 110 117
The Netherlands 7 624 431 6 503 755 1 314 737 15 422 122 405 15 580 750 7 783 522 6 369 174 1 225 883 22 890 112 284 15 513 753 102 98 93 148 92 100
U.S.A. 5 076 668 3 955 375 309 413 5 664 237 614 9 584 734 5 494 496 4 275 566 347 148 3 836 195 372 10 316 418 108 108 112 68 82 108
canada 3 845 413 4 034 000 42 908 56 520 76 905 8 055 746 3 868 903 3 788 373 55 881 73 350 67 302 7 853 809 101 94 130 130 88 97
denmark 1 508 744 4 497 851 176 936 2 288 17 438 6 203 257 1 828 652 5 300 297 352 514 4 337 9 981 7 495 781 121 118 199 190 57 121
Belgium 2 529 687 1 779 809 249 354 5 927 97 090 4 661 867 2 668 432 2 049 242 337 018 5 333 94 074 5 154 099 105 115 135 90 97 111
Angola* 152 299 881 008 10 427 567 4 431 653 5 475 954 112 055 626 093 10 494 293 4 286 986 5 035 921 74 71 101 52 97 92
Finland 2 827 010 2 457 442 8 798 0 201 690 5 494 940 2 418 821 1 808 907 94 314 225 159 503 4 481 770 86 74 1 072 0 79 82
Kenya 2 225 848 1 495 272 64 821 5 486 44 230 3 835 657 2 962 958 1 236 154 56 082 7 185 49 514 4 311 893 133 83 87 131 112 112
china 829 576 4 369 904 28 080 2 545 62 060 5 292 165 531 667 3 526 328 35 856 1 821 79 076 4 174 748 64 81 128 72 127 79
Nigeria* 426 966 2 065 299 313 736 39 611 359 615 3 205 227 548 588 2 451 414 176 531 47 331 561 373 3 785 237 128 119 56 119 156 118
United Arab Emirates 1 024 126 1 443 841 77 953 956 63 135 2 610 011 1 401 164 1 762 441 77 079 1 980 59 354 3 302 018 137 122 99 207 94 127
Japan 841 422 1 932 879 12 929 1 035 321 409 3 109 674 706 442 1 891 071 14 945 2 070 300 010 2 914 538 84 98 116 200 93 94
Tanzania 1 047 359 805 325 29 585 3 650 34 150 1 920 069 1 168 081 714 657 42 850 3 935 38 277 1 967 800 112 89 145 108 112 102
New Zealand 774 336 933 762 38 786 540 65 696 1 813 120 857 451 907 023 47 610 1 575 51 165 1 864 824 111 97 123 292 78 103
Russia 498 890 904 579 16 889 0 49 311 1 469 669 685 315 1 079 675 12 200 0 74 588 1 851 778 137 119 72 0 151 126
Zimbabwe 503 348 374 138 44 820 5 065 73 018 1 000 389 793 532 497 837 60 734 5 525 94 444 1 452 072 158 133 136 109 129 145
Mozambique 24 721 62 861 1 755 113 39 330 128 780 701 989 554 478 7 450 99 153 794 1 417 810 2 840 882 425 88 391 1 101
Republic of Ireland 849 567 631 179 7 650 54 1 403 1 489 853 757 967 647 579 7 101 81 612 1 413 340 89 103 93 150 44 95
Norway 264 505 1 228 197 30 591 653 6 120 1 530 066 306 907 1 028 707 7 907 90 3 591 1 347 202 116 84 26 14 59 88
Uganda 389 292 271 213 7 612 21 699 13 472 703 288 540 702 354 099 11 129 11 420 11 187 928 537 139 131 146 53 83 132
France 411 603 510 543 48 528 3 488 2 601 976 763 385 644 435 357 39 573 3 038 3 627 867 239 94 85 82 87 139 89
Australia 559 595 363 372 17 136 1 242 124 886 1 066 231 390 318 361 659 15 566 1 490 96 975 866 008 70 100 91 120 78 81
Other countries 5 879 973 7 439 104 459 033 73 444 670 821 14 522 375 6 162 937 7 855 752 497 214 49 979 646 597 15 212 479 105 106 108 68 96 105
Total 70 717 787 83 364 661 6 371 430 274 425 8 032 172 168 760 475 81 536 272 86 853 949 7 197 156 282 755 7 897 380 183 767 512 115 104 113 103 98 109
31
COUNTRY
2012 2013 TREND 2013/2012
WHITE REDBLANC DE
NOIR / ROSé
FORTIFIED SPARKLING TOTAL WHITE REDBLANC DE
NOIR / ROSé
FORTIFIED SPARKLING TOTAL
WH
ITE
RED
BLA
NC
DE
NO
IR /
RO
Sé
FOR
TIFI
ED
SPAR
K LI
NG
TOTA
L
United Kingdom 15 000 038 13 304 663 1 710 572 10 401 584 692 30 610 366 20 729 208 16 694 293 2 266 950 7 681 356 864 40 054 996 138 125 133 74 61 131
Sweden 9 594 639 11 605 851 813 677 4 901 235 251 22 254 319 10 572 410 9 546 249 910 472 8 183 284 985 21 322 299 110 82 112 167 121 96
Germany 6 007 731 9 513 439 534 704 13 154 96 177 16 165 205 7 158 111 11 091 524 486 655 19 008 105 845 18 861 143 119 117 91 145 110 117
The Netherlands 7 624 431 6 503 755 1 314 737 15 422 122 405 15 580 750 7 783 522 6 369 174 1 225 883 22 890 112 284 15 513 753 102 98 93 148 92 100
U.S.A. 5 076 668 3 955 375 309 413 5 664 237 614 9 584 734 5 494 496 4 275 566 347 148 3 836 195 372 10 316 418 108 108 112 68 82 108
canada 3 845 413 4 034 000 42 908 56 520 76 905 8 055 746 3 868 903 3 788 373 55 881 73 350 67 302 7 853 809 101 94 130 130 88 97
denmark 1 508 744 4 497 851 176 936 2 288 17 438 6 203 257 1 828 652 5 300 297 352 514 4 337 9 981 7 495 781 121 118 199 190 57 121
Belgium 2 529 687 1 779 809 249 354 5 927 97 090 4 661 867 2 668 432 2 049 242 337 018 5 333 94 074 5 154 099 105 115 135 90 97 111
Angola* 152 299 881 008 10 427 567 4 431 653 5 475 954 112 055 626 093 10 494 293 4 286 986 5 035 921 74 71 101 52 97 92
Finland 2 827 010 2 457 442 8 798 0 201 690 5 494 940 2 418 821 1 808 907 94 314 225 159 503 4 481 770 86 74 1 072 0 79 82
Kenya 2 225 848 1 495 272 64 821 5 486 44 230 3 835 657 2 962 958 1 236 154 56 082 7 185 49 514 4 311 893 133 83 87 131 112 112
china 829 576 4 369 904 28 080 2 545 62 060 5 292 165 531 667 3 526 328 35 856 1 821 79 076 4 174 748 64 81 128 72 127 79
Nigeria* 426 966 2 065 299 313 736 39 611 359 615 3 205 227 548 588 2 451 414 176 531 47 331 561 373 3 785 237 128 119 56 119 156 118
United Arab Emirates 1 024 126 1 443 841 77 953 956 63 135 2 610 011 1 401 164 1 762 441 77 079 1 980 59 354 3 302 018 137 122 99 207 94 127
Japan 841 422 1 932 879 12 929 1 035 321 409 3 109 674 706 442 1 891 071 14 945 2 070 300 010 2 914 538 84 98 116 200 93 94
Tanzania 1 047 359 805 325 29 585 3 650 34 150 1 920 069 1 168 081 714 657 42 850 3 935 38 277 1 967 800 112 89 145 108 112 102
New Zealand 774 336 933 762 38 786 540 65 696 1 813 120 857 451 907 023 47 610 1 575 51 165 1 864 824 111 97 123 292 78 103
Russia 498 890 904 579 16 889 0 49 311 1 469 669 685 315 1 079 675 12 200 0 74 588 1 851 778 137 119 72 0 151 126
Zimbabwe 503 348 374 138 44 820 5 065 73 018 1 000 389 793 532 497 837 60 734 5 525 94 444 1 452 072 158 133 136 109 129 145
Mozambique 24 721 62 861 1 755 113 39 330 128 780 701 989 554 478 7 450 99 153 794 1 417 810 2 840 882 425 88 391 1 101
Republic of Ireland 849 567 631 179 7 650 54 1 403 1 489 853 757 967 647 579 7 101 81 612 1 413 340 89 103 93 150 44 95
Norway 264 505 1 228 197 30 591 653 6 120 1 530 066 306 907 1 028 707 7 907 90 3 591 1 347 202 116 84 26 14 59 88
Uganda 389 292 271 213 7 612 21 699 13 472 703 288 540 702 354 099 11 129 11 420 11 187 928 537 139 131 146 53 83 132
France 411 603 510 543 48 528 3 488 2 601 976 763 385 644 435 357 39 573 3 038 3 627 867 239 94 85 82 87 139 89
Australia 559 595 363 372 17 136 1 242 124 886 1 066 231 390 318 361 659 15 566 1 490 96 975 866 008 70 100 91 120 78 81
Other countries 5 879 973 7 439 104 459 033 73 444 670 821 14 522 375 6 162 937 7 855 752 497 214 49 979 646 597 15 212 479 105 106 108 68 96 105
Total 70 717 787 83 364 661 6 371 430 274 425 8 032 172 168 760 475 81 536 272 86 853 949 7 197 156 282 755 7 897 380 183 767 512 115 104 113 103 98 109
32
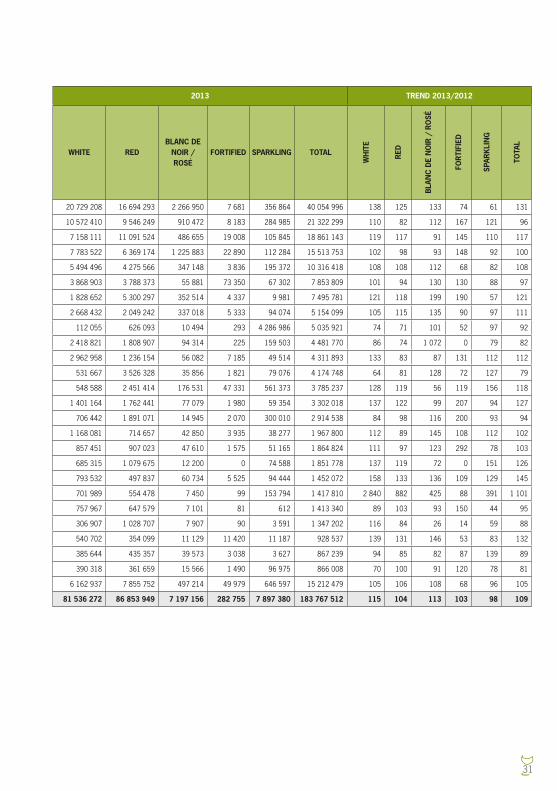
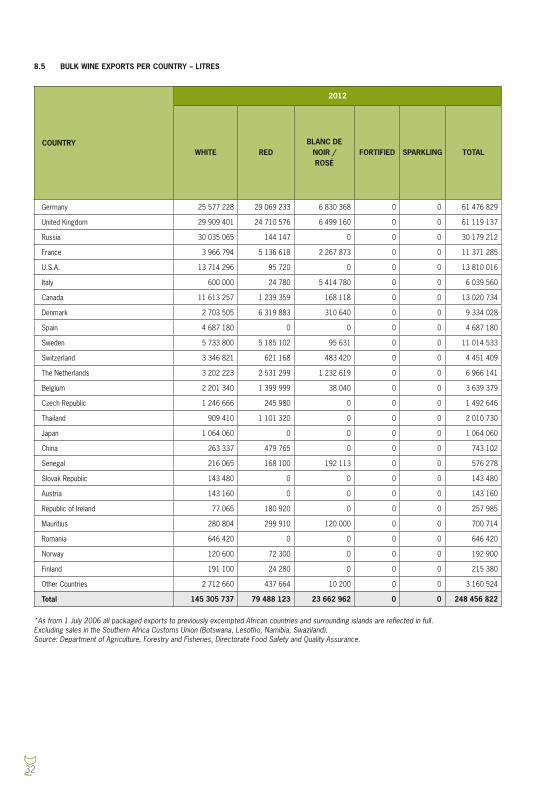
8.5 BULK WINE EXPORTS PER COUNTRY – LITRES
COUNTRY
2012 2013 TREND 2013/2012
WHITE REDBLANC DE
NOIR / ROSé
FORTIFIED SPARKLING TOTAL WHITE REDBLANC DE
NOIR / ROSé
FORTIFIED SPARKLING TOTAL
WH
ITE
RED
BLA
NC
DE
NO
IR /
RO
Sé
FOR
TIFI
ED
SPAR
K LI
NG
TOTA
L
Germany 25 577 228 29 069 233 6 830 368 0 0 61 476 829 32 065 653 33 695 351 11 895 698 0 0 77 656 702 125 116 174 0 0 126
United Kingdom 29 909 401 24 710 576 6 499 160 0 0 61 119 137 34 650 210 30 939 476 5 470 436 0 0 71 060 122 116 125 84 0 0 116
Russia 30 035 065 144 147 0 0 0 30 179 212 34 901 508 526 560 0 0 0 35 428 068 116 365 0 0 0 117
France 3 966 794 5 136 618 2 267 873 0 0 11 371 285 7 872 223 7 089 467 18 866 278 0 0 33 827 968 198 138 832 0 0 297
U.S.A. 13 714 296 95 720 0 0 0 13 810 016 12 084 200 9 541 627 0 0 0 21 625 827 88 9 968 0 0 0 157
Italy 600 000 24 780 5 414 780 0 0 6 039 560 409 840 25 940 14 660 625 0 0 15 096 405 68 105 271 0 0 250
canada 11 613 257 1 239 359 168 118 0 0 13 020 734 12 469 324 1 490 948 431 540 0 0 14 391 812 107 120 257 0 0 111
denmark 2 703 505 6 319 883 310 640 0 0 9 334 028 4 161 767 8 071 724 359 100 0 0 12 592 591 154 128 116 0 0 135
Spain 4 687 180 0 0 0 0 4 687 180 6 182 837 2 937 440 3 330 001 0 0 12 450 278 132 0 0 0 0 266
Sweden 5 733 800 5 185 102 95 631 0 0 11 014 533 5 733 460 5 780 058 359 020 0 0 11 872 538 100 111 375 0 0 108
Switzerland 3 346 821 621 168 483 420 0 0 4 451 409 6 540 367 2 224 737 696 962 0 0 9 462 066 195 358 144 0 0 213
The Netherlands 3 202 223 2 531 299 1 232 619 0 0 6 966 141 3 415 020 2 088 981 1 104 660 0 0 6 608 661 107 83 90 0 0 95
Belgium 2 201 340 1 399 999 38 040 0 0 3 639 379 2 526 269 1 597 570 0 0 0 4 123 839 115 114 0 0 0 113
czech Republic 1 246 666 245 980 0 0 0 1 492 646 3 089 821 216 964 0 0 0 3 306 785 248 88 0 0 0 222
Thailand 909 410 1 101 320 0 0 0 2 010 730 1 222 400 1 367 340 23 700 0 0 2 613 440 134 124 0 0 0 130
Japan 1 064 060 0 0 0 0 1 064 060 1 897 730 0 0 0 0 1 897 730 178 0 0 0 0 178
china 263 337 479 765 0 0 0 743 102 143 741 1 423 382 0 0 0 1 567 123 55 297 0 0 0 211
Senegal 216 065 168 100 192 113 0 0 576 278 432 012 672 000 432 000 0 0 1 536 012 200 400 225 0 0 267
Slovak Republic 143 480 0 0 0 0 143 480 692 780 312 000 0 0 0 1 004 780 483 0 0 0 0 700
Austria 143 160 0 0 0 0 143 160 717 400 0 0 0 0 717 400 501 0 0 0 0 501
Republic of Ireland 77 065 180 920 0 0 0 257 985 334 910 334 745 25 632 0 0 695 287 435 185 0 0 0 270
Mauritius 280 804 299 910 120 000 0 0 700 714 254 724 253 760 120 080 0 0 628 564 91 85 100 0 0 90
Romania 646 420 0 0 0 0 646 420 333 580 0 0 0 0 333 580 52 0 0 0 0 52
Norway 120 600 72 300 0 0 0 192 900 216 660 60 320 0 0 0 276 980 180 83 0 0 0 144
Finland 191 100 24 280 0 0 0 215 380 263 680 0 0 0 0 263 680 138 0 0 0 0 122
Other countries 2 712 660 437 664 10 200 0 0 3 160 524 443 231 337 164 0 0 0 780 395 16 77 0 0 0 25
Total 145 305 737 79 488 123 23 662 962 0 0 248 456 822 173 055 347 110 987 554 57 775 732 0 0 341 818 633 119 140 244 0 0 138
*As from 1 July 2006 all packaged exports to previously excempted African countries and surrounding islands are reflected in full.Excluding sales in the Southern Africa Customs Union (Botswana, Lesotho, Namibia, Swaziland).Source: Department of Agriculture, Forestry and Fisheries, Directorate Food Safety and Quality Assurance.
33
COUNTRY
2012 2013 TREND 2013/2012
WHITE REDBLANC DE
NOIR / ROSé
FORTIFIED SPARKLING TOTAL WHITE REDBLANC DE
NOIR / ROSé
FORTIFIED SPARKLING TOTAL
WH
ITE
RED
BLA
NC
DE
NO
IR /
RO
Sé
FOR
TIFI
ED
SPAR
K LI
NG
TOTA
L
Germany 25 577 228 29 069 233 6 830 368 0 0 61 476 829 32 065 653 33 695 351 11 895 698 0 0 77 656 702 125 116 174 0 0 126
United Kingdom 29 909 401 24 710 576 6 499 160 0 0 61 119 137 34 650 210 30 939 476 5 470 436 0 0 71 060 122 116 125 84 0 0 116
Russia 30 035 065 144 147 0 0 0 30 179 212 34 901 508 526 560 0 0 0 35 428 068 116 365 0 0 0 117
France 3 966 794 5 136 618 2 267 873 0 0 11 371 285 7 872 223 7 089 467 18 866 278 0 0 33 827 968 198 138 832 0 0 297
U.S.A. 13 714 296 95 720 0 0 0 13 810 016 12 084 200 9 541 627 0 0 0 21 625 827 88 9 968 0 0 0 157
Italy 600 000 24 780 5 414 780 0 0 6 039 560 409 840 25 940 14 660 625 0 0 15 096 405 68 105 271 0 0 250
canada 11 613 257 1 239 359 168 118 0 0 13 020 734 12 469 324 1 490 948 431 540 0 0 14 391 812 107 120 257 0 0 111
denmark 2 703 505 6 319 883 310 640 0 0 9 334 028 4 161 767 8 071 724 359 100 0 0 12 592 591 154 128 116 0 0 135
Spain 4 687 180 0 0 0 0 4 687 180 6 182 837 2 937 440 3 330 001 0 0 12 450 278 132 0 0 0 0 266
Sweden 5 733 800 5 185 102 95 631 0 0 11 014 533 5 733 460 5 780 058 359 020 0 0 11 872 538 100 111 375 0 0 108
Switzerland 3 346 821 621 168 483 420 0 0 4 451 409 6 540 367 2 224 737 696 962 0 0 9 462 066 195 358 144 0 0 213
The Netherlands 3 202 223 2 531 299 1 232 619 0 0 6 966 141 3 415 020 2 088 981 1 104 660 0 0 6 608 661 107 83 90 0 0 95
Belgium 2 201 340 1 399 999 38 040 0 0 3 639 379 2 526 269 1 597 570 0 0 0 4 123 839 115 114 0 0 0 113
czech Republic 1 246 666 245 980 0 0 0 1 492 646 3 089 821 216 964 0 0 0 3 306 785 248 88 0 0 0 222
Thailand 909 410 1 101 320 0 0 0 2 010 730 1 222 400 1 367 340 23 700 0 0 2 613 440 134 124 0 0 0 130
Japan 1 064 060 0 0 0 0 1 064 060 1 897 730 0 0 0 0 1 897 730 178 0 0 0 0 178
china 263 337 479 765 0 0 0 743 102 143 741 1 423 382 0 0 0 1 567 123 55 297 0 0 0 211
Senegal 216 065 168 100 192 113 0 0 576 278 432 012 672 000 432 000 0 0 1 536 012 200 400 225 0 0 267
Slovak Republic 143 480 0 0 0 0 143 480 692 780 312 000 0 0 0 1 004 780 483 0 0 0 0 700
Austria 143 160 0 0 0 0 143 160 717 400 0 0 0 0 717 400 501 0 0 0 0 501
Republic of Ireland 77 065 180 920 0 0 0 257 985 334 910 334 745 25 632 0 0 695 287 435 185 0 0 0 270
Mauritius 280 804 299 910 120 000 0 0 700 714 254 724 253 760 120 080 0 0 628 564 91 85 100 0 0 90
Romania 646 420 0 0 0 0 646 420 333 580 0 0 0 0 333 580 52 0 0 0 0 52
Norway 120 600 72 300 0 0 0 192 900 216 660 60 320 0 0 0 276 980 180 83 0 0 0 144
Finland 191 100 24 280 0 0 0 215 380 263 680 0 0 0 0 263 680 138 0 0 0 0 122
Other countries 2 712 660 437 664 10 200 0 0 3 160 524 443 231 337 164 0 0 0 780 395 16 77 0 0 0 25
Total 145 305 737 79 488 123 23 662 962 0 0 248 456 822 173 055 347 110 987 554 57 775 732 0 0 341 818 633 119 140 244 0 0 138
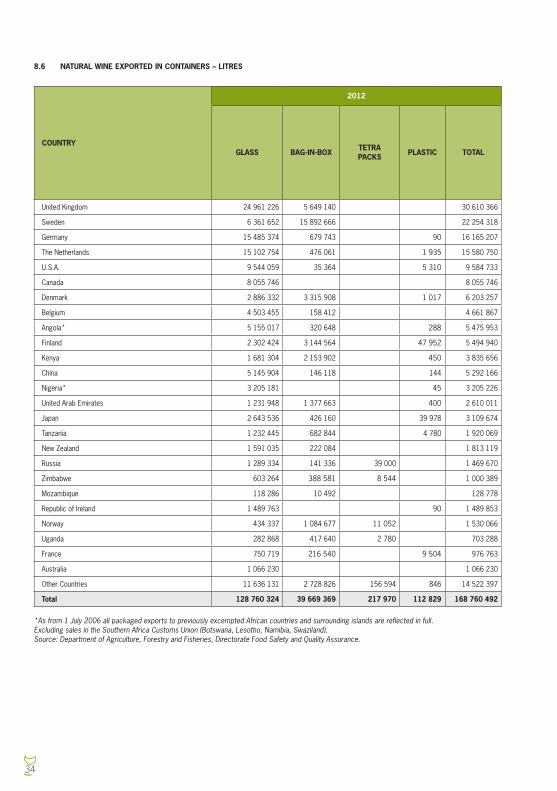
34
8.6 NATURAL WINE EXPORTED IN CONTAINERS – LITRES
COUNTRY
2012 2013 TREND 2013/2012
GLASS BAG-IN-BOX TETRA PACKS PLASTIC TOTAL GLASS BAG-IN-BOX TETRA
PACKS PLASTIC TOTAL
GLA
SS
BAG
-IN-B
OX
TETR
A PA
CK
S
PLAS
TIC
TOTA
L
United Kingdom 24 961 226 5 649 140 30 610 366 33 820 941 6 212 134 21 924 40 054 999 135.49 109.97 130.85
Sweden 6 361 652 15 892 666 22 254 318 5 869 579 15 438 023 14 697 21 322 299 92.27 97.14 95.81
Germany 15 485 374 679 743 90 16 165 207 18 335 040 525 808 297 18 861 145 118.40 77.35 330.00 116.68
The Netherlands 15 102 754 476 061 1 935 15 580 750 14 991 571 496 343 25 839 15 513 753 99.26 104.26 1 335.35 99.57
U.S.A. 9 544 059 35 364 5 310 9 584 733 10 258 187 57 240 990 10 316 417 107.48 161.86 18.64 107.63
canada 8 055 746 8 055 746 7 853 710 99 7 853 809 97.49 97.49
denmark 2 886 332 3 315 908 1 017 6 203 257 3 171 388 4 324 392 7 495 780 109.88 130.41 0.00 120.84
Belgium 4 503 455 158 412 4 661 867 4 856 123 297 612 365 5 154 100 107.83 187.87 110.56
Angola* 5 155 017 320 648 288 5 475 953 4 821 597 214 260 63 5 035 920 93.53 66.82 21.88 91.96
Finland 2 302 424 3 144 564 47 952 5 494 940 1 866 735 2 573 244 41 790 4 481 769 81.08 81.83 87.15 81.56
Kenya 1 681 304 2 153 902 450 3 835 656 1 865 836 2 443 857 2 200 4 311 893 110.98 113.46 488.89 112.42
china 5 145 904 146 118 144 5 292 166 4 025 424 148 630 698 4 174 752 78.23 101.72 484.72 78.89
Nigeria* 3 205 181 45 3 205 226 3 765 858 19 377 3 785 235 117.49 43 060.00 118.10
United Arab Emirates 1 231 948 1 377 663 400 2 610 011 1 374 541 1 926 196 1 280 3 302 017 111.57 139.82 320.00 126.51
Japan 2 643 536 426 160 39 978 3 109 674 2 459 990 426 957 27 590 2 914 537 93.06 100.19 69.01 93.72
Tanzania 1 232 445 682 844 4 780 1 920 069 1 493 138 474 662 1 967 800 121.15 69.51 0.00 102.49
New Zealand 1 591 035 222 084 1 813 119 1 614 348 250 476 1 864 824 101.47 112.78 102.85
Russia 1 289 334 141 336 39 000 1 469 670 1 710 685 141 092 1 851 777 132.68 99.83 0.00 126.00
Zimbabwe 603 264 388 581 8 544 1 000 389 893 104 553 354 5 613 1 452 071 148.05 142.40 0.00 145.15
Mozambique 118 286 10 492 128 778 1 042 089 375 720 1 417 809 880.99 3 581.01 1 100.97
Republic of Ireland 1 489 763 90 1 489 853 1 413 144 196 1 413 340 94.86 0.00 94.86
Norway 434 337 1 084 677 11 052 1 530 066 316 941 1 030 260 1 347 201 72.97 94.98 0.00 88.05
Uganda 282 868 417 640 2 780 703 288 373 924 553 218 1 395 928 537 132.19 132.46 0.00 132.03
France 750 719 216 540 9 504 976 763 645 839 221 400 867 239 86.03 102.24 0.00 88.79
Australia 1 066 230 1 066 230 866 007 866 007 81.22 81.22
Other countries 11 636 131 2 728 826 156 594 846 14 522 397 11 886 578 3 304 373 21 550 15 212 501 102.15 121.09 0.00 2 547.28 104.75
Total 128 760 324 39 669 369 217 970 112 829 168 760 492 141 592 317 41 989 447 0 185 767 183 767 531 109.97 105.85 0.00 164.64 108.89
*As from 1 July 2006 all packaged exports to previously excempted African countries and surrounding islands are reflected in full. Excluding sales in the Southern Africa Customs Union (Botswana, Lesotho, Namibia, Swaziland). Source: Department of Agriculture, Forestry and Fisheries, Directorate Food Safety and Quality Assurance.
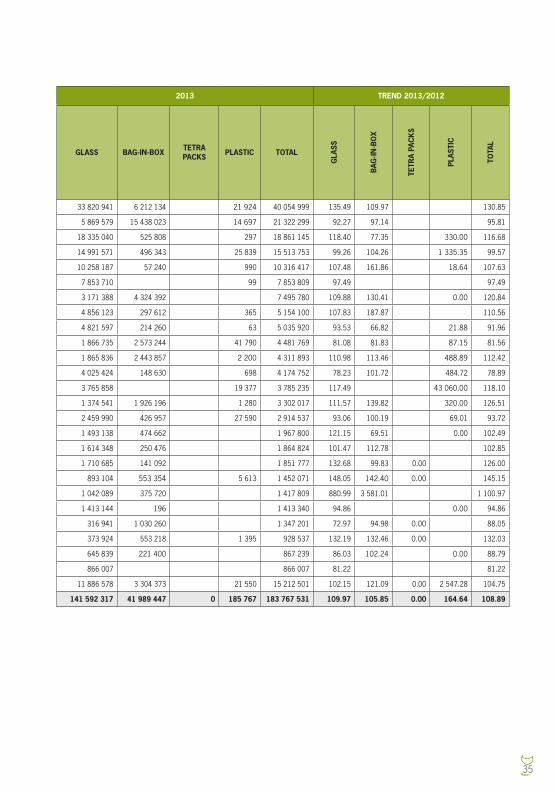
35
COUNTRY
2012 2013 TREND 2013/2012
GLASS BAG-IN-BOX TETRA PACKS PLASTIC TOTAL GLASS BAG-IN-BOX TETRA
PACKS PLASTIC TOTAL
GLA
SS
BAG
-IN-B
OX
TETR
A PA
CK
S
PLAS
TIC
TOTA
L
United Kingdom 24 961 226 5 649 140 30 610 366 33 820 941 6 212 134 21 924 40 054 999 135.49 109.97 130.85
Sweden 6 361 652 15 892 666 22 254 318 5 869 579 15 438 023 14 697 21 322 299 92.27 97.14 95.81
Germany 15 485 374 679 743 90 16 165 207 18 335 040 525 808 297 18 861 145 118.40 77.35 330.00 116.68
The Netherlands 15 102 754 476 061 1 935 15 580 750 14 991 571 496 343 25 839 15 513 753 99.26 104.26 1 335.35 99.57
U.S.A. 9 544 059 35 364 5 310 9 584 733 10 258 187 57 240 990 10 316 417 107.48 161.86 18.64 107.63
canada 8 055 746 8 055 746 7 853 710 99 7 853 809 97.49 97.49
denmark 2 886 332 3 315 908 1 017 6 203 257 3 171 388 4 324 392 7 495 780 109.88 130.41 0.00 120.84
Belgium 4 503 455 158 412 4 661 867 4 856 123 297 612 365 5 154 100 107.83 187.87 110.56
Angola* 5 155 017 320 648 288 5 475 953 4 821 597 214 260 63 5 035 920 93.53 66.82 21.88 91.96
Finland 2 302 424 3 144 564 47 952 5 494 940 1 866 735 2 573 244 41 790 4 481 769 81.08 81.83 87.15 81.56
Kenya 1 681 304 2 153 902 450 3 835 656 1 865 836 2 443 857 2 200 4 311 893 110.98 113.46 488.89 112.42
china 5 145 904 146 118 144 5 292 166 4 025 424 148 630 698 4 174 752 78.23 101.72 484.72 78.89
Nigeria* 3 205 181 45 3 205 226 3 765 858 19 377 3 785 235 117.49 43 060.00 118.10
United Arab Emirates 1 231 948 1 377 663 400 2 610 011 1 374 541 1 926 196 1 280 3 302 017 111.57 139.82 320.00 126.51
Japan 2 643 536 426 160 39 978 3 109 674 2 459 990 426 957 27 590 2 914 537 93.06 100.19 69.01 93.72
Tanzania 1 232 445 682 844 4 780 1 920 069 1 493 138 474 662 1 967 800 121.15 69.51 0.00 102.49
New Zealand 1 591 035 222 084 1 813 119 1 614 348 250 476 1 864 824 101.47 112.78 102.85
Russia 1 289 334 141 336 39 000 1 469 670 1 710 685 141 092 1 851 777 132.68 99.83 0.00 126.00
Zimbabwe 603 264 388 581 8 544 1 000 389 893 104 553 354 5 613 1 452 071 148.05 142.40 0.00 145.15
Mozambique 118 286 10 492 128 778 1 042 089 375 720 1 417 809 880.99 3 581.01 1 100.97
Republic of Ireland 1 489 763 90 1 489 853 1 413 144 196 1 413 340 94.86 0.00 94.86
Norway 434 337 1 084 677 11 052 1 530 066 316 941 1 030 260 1 347 201 72.97 94.98 0.00 88.05
Uganda 282 868 417 640 2 780 703 288 373 924 553 218 1 395 928 537 132.19 132.46 0.00 132.03
France 750 719 216 540 9 504 976 763 645 839 221 400 867 239 86.03 102.24 0.00 88.79
Australia 1 066 230 1 066 230 866 007 866 007 81.22 81.22
Other countries 11 636 131 2 728 826 156 594 846 14 522 397 11 886 578 3 304 373 21 550 15 212 501 102.15 121.09 0.00 2 547.28 104.75
Total 128 760 324 39 669 369 217 970 112 829 168 760 492 141 592 317 41 989 447 0 185 767 183 767 531 109.97 105.85 0.00 164.64 108.89
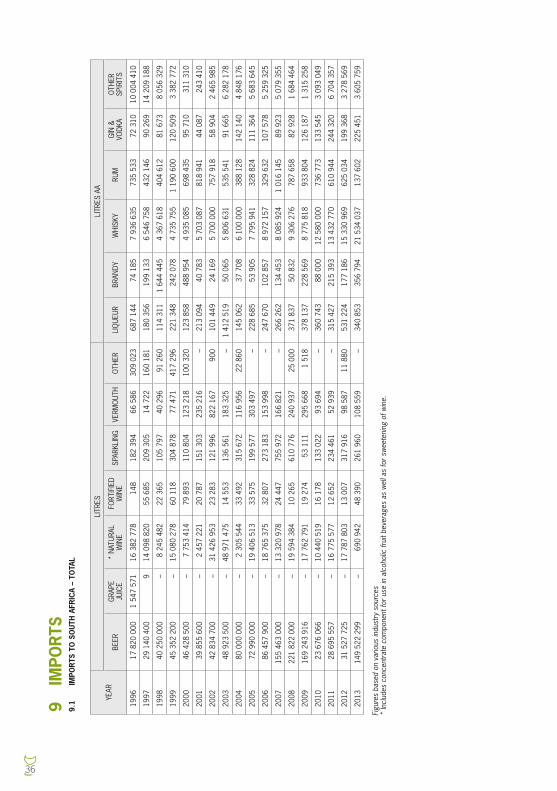
36
9 IM
POR
TS9.
1 IM
POR
TS T
O S
OU
TH A
FRIC
A –
TOTA
L
YEAR
LITR
ESLI
TRES
AA
BEER
GRA
PE
JUIc
E*
NAT
URAL
W
INE
FORT
IFIE
d W
INE
SPAR
KLIN
GVE
RMO
UTH
OTH
ERLI
QUE
URBR
ANdY
W
HISK
YRU
MG
IN &
VO
dKA
OTH
ER
SPIR
ITS
1996
17 8
20 0
001
547
571
16 3
82 7
78 1
48 1
82 3
94 6
6 58
6 3
09 0
23 6
87 1
44 7
4 18
57
936
635
735
533
72
310
10 0
04 4
10
1997
29
140
400
9
14
098
820
55
685
20
9 30
5
14 7
22
160
181
18
0 35
6
199
133
6 5
46 7
58
432
146
90
269
14
209
188
1998
40
250
000
– 8
245
482
22
365
10
5 79
7
40 2
96
91 2
60
114
311
1 6
44 4
45 4
367
618
40
4 61
2
81 6
73 8
056
329
1999
45
352
200
– 1
5 08
0 27
8
60 1
18
304
878
77
471
41
7 29
6
221
348
24
2 07
8 4
735
755
1 1
90 6
00
120
509
3 3
82 7
72
2000
46
428
500
– 7
753
414
79
893
11
0 80
4
123
218
10
0 32
0
123
858
48
8 95
4 4
935
085
69
8 43
5
95 7
10
311
310
2001
39
855
600
– 2
457
221
20
787
15
1 30
3
235
216
–
213
094
40
783
5 7
03 0
87
818
941
44
087
24
3 41
0
2002
42
834
700
– 3
1 42
6 95
3
23 2
83
121
996
82
2 16
7 9
00
101
449
24
169
5 7
00 0
00
757
918
58
904
2 4
65 9
85
2003
48
923
500
– 4
8 97
1 47
5
14 5
53
136
561
18
3 32
5–
1 4
12 5
19
50 0
65 5
806
631
53
5 54
1
91 6
65 6
282
178
2004
80
000
000
– 2
305
544
33
492
31
5 67
2
116
956
22
860
14
5 06
2
37 7
08 6
100
000
38
8 12
8
142
140
4 8
48 1
76
2005
72
990
000
– 1
9 40
6 51
3
33 5
75
199
577
30
3 49
7–
22
8 68
5
53 9
05 7
795
941
32
8 82
4
111
364
5 6
83 6
45
2006
86
457
900
– 1
8 76
5 37
5
32 8
07
273
183
15
3 99
8–
24
7 67
0
102
857
8 9
72 1
57
329
632
10
7 57
8 5
259
325
2007
155
463
000
– 1
3 32
0 97
8
24 4
47
755
972
16
6 82
1–
26
6 26
2
134
453
8 0
85 9
24 1
016
145
89
923
5 0
79 3
55
2008
221
822
000
– 1
9 59
4 38
4
10 2
65
610
776
24
0 93
7
25 0
00
371
837
50
832
9 3
06 2
76
787
658
82
928
1 6
84 4
64
2009
169
243
916
– 1
7 76
2 79
1
19 2
74
53 1
11
295
668
1
518
37
8 13
7
228
569
8 7
75 8
18
933
804
12
6 18
7 1
315
258
2010
23
676
066
– 1
0 44
0 51
9
16 1
78
133
022
93
694
–
360
743
88
000
12
580
000
73
6 77
3
133
545
3 0
93 0
49
2011
28
695
557
– 1
6 77
5 57
7
12 6
52
234
461
52
939
–
315
427
21
5 39
3 1
3 43
2 77
0
610
944
24
4 32
0 6
704
357
2012
31
527
725
– 1
7 78
7 80
3
13 0
07
317
916
98
587
11
880
53
1 22
4
177
186
15
330
969
62
5 03
4
199
368
3 2
78 5
69
2013
149
522
299
–
690
942
48
390
26
1 96
0
108
559
–
340
853
35
6 79
4 2
1 53
4 03
7
137
602
22
5 45
1 3
605
759
Figu
res
base
d on
var
ious
indu
stry
sou
rces
* In
clud
es c
once
ntra
te c
ompo
nent
for
use
in a
lcoh
olic
frui
t bev
erag
es a
s w
ell a
s fo
r sw
eete
ning
of w
ine.
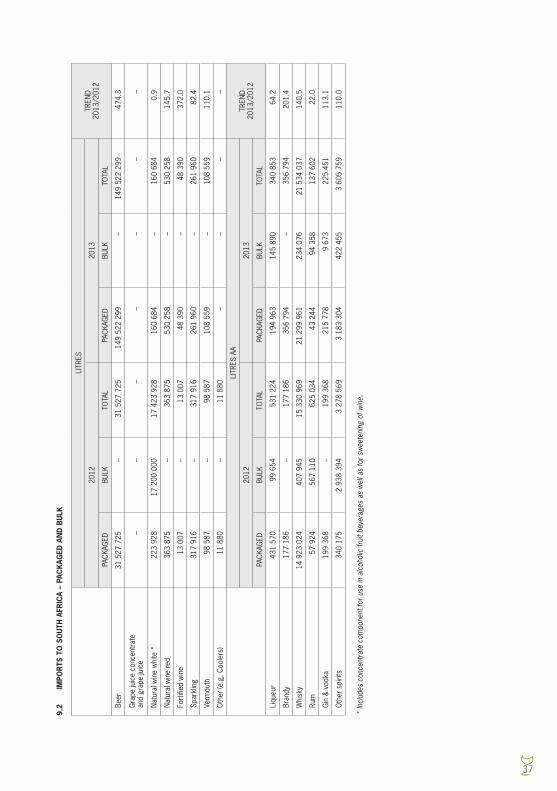
37
9.2
IMPO
RTS
TO
SO
UTH
AFR
ICA
– PA
CK
AGED
AN
D B
ULK
LITR
ESTR
ENd
2013
/201
220
1220
13
PAcK
AGEd
BULK
TOTA
LPA
cKAG
EdBU
LKTO
TAL
Beer
31 5
27 7
25 –
31
527
725
149
522
299
–
149
522
299
474
.3
Gra
pe ju
ice
conc
entr
ate
and
grap
e ju
ice
–
–
––
–
–
–
Nat
ural
win
e w
hite
* 2
23 9
2817
200
000
17 4
23 9
28 1
60 6
84 –
1
60 6
84 0
.9
Nat
ural
win
e re
d 3
63 8
75 –
3
63 8
75 5
30 2
58 –
5
30 2
5814
5.7
Fort
ified
win
e 1
3 00
7 –
1
3 00
7 4
8 39
0 –
4
8 39
037
2.0
Spar
klin
g 3
17 9
16 –
3
17 9
16 2
61 9
60 –
2
61 9
6082
.4
Verm
outh
98
587
–
98
587
108
559
–
108
559
110.
1
Oth
er (e
.g. c
oole
rs)
11
880
–
11
880
–
–
–
–
LITR
ES A
ATR
ENd
2013
/201
220
1220
13
PAcK
AGEd
BULK
TOTA
LPA
cKAG
EdBU
LKTO
TAL
Liqu
eur
431
570
99
654
531
224
194
963
145
890
340
853
64.2
Bran
dy
177
186
–
177
186
356
794
– 3
56 7
9420
1.4
Whi
sky
14
923
024
407
945
15
330
969
21
299
961
234
076
21
534
037
140.
5
Rum
57
924
567
110
625
034
43
244
94
358
137
602
22.0
Gin
& v
odka
199
368
–
199
368
215
778
9 6
73 2
25 4
5111
3.1
Oth
er s
pirit
s 3
40 1
75 2
938
394
3 2
78 5
69 3
183
304
422
455
3 6
05 7
5911
0.0
* In
clud
es c
once
ntra
te c
ompo
nent
for
use
in a
lcoh
olic
frui
t bev
erag
es a
s w
ell a
s fo
r sw
eete
ning
of w
ine.
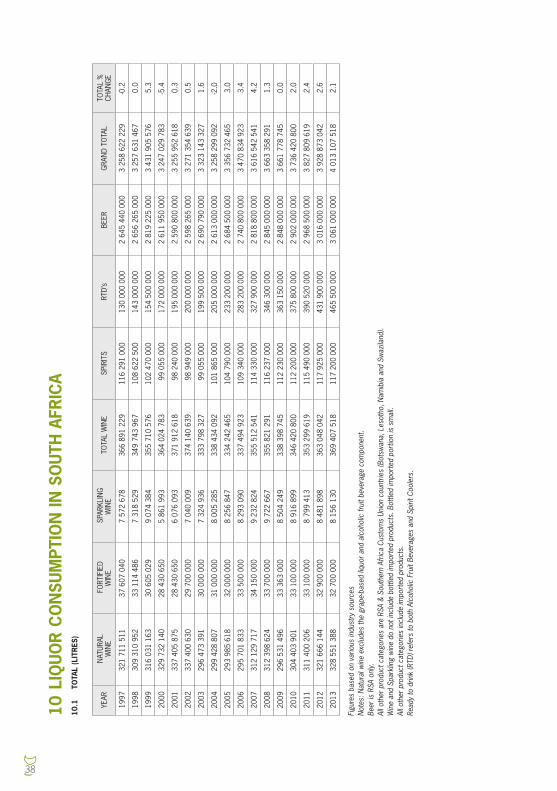
38
10 L
IQU
OR
CO
NSU
MPT
ION
IN S
OU
TH A
FRIC
A10
.1
TOTA
L (L
ITR
ES)
YEAR
NAT
URAL
W
INE
FO
RTIF
IEd
WIN
E S
PARK
LIN
G
WIN
ETO
TAL
WIN
ESP
IRIT
SRT
d’s
BEER
GRA
Nd
TOTA
LTO
TAL
%
cHAN
GE
1997
321
711
511
37
607
040
7 5
72 6
78 3
66 8
91 2
29 1
16 2
91 0
00 1
30 0
00 0
00 2
645
440
000
3 2
58 6
22 2
29-0
.2
1998
309
310
952
33
114
486
7 3
18 5
29 3
49 7
43 9
67 1
08 6
22 5
00 1
43 0
00 0
00 2
656
265
000
3 2
57 6
31 4
670.
0
1999
316
031
163
30
605
029
9 0
74 3
84 3
55 7
10 5
76 1
02 4
70 0
00 1
54 5
00 0
00 2
819
225
000
3 4
31 9
05 5
765.
3
2000
329
732
140
28
430
650
5 8
61 9
93 3
64 0
24 7
83 9
9 05
5 00
0 1
72 0
00 0
00 2
611
950
000
3 2
47 0
29 7
83-5
.4
2001
337
405
875
28
430
650
6 0
76 0
93 3
71 9
12 6
18 9
8 24
0 00
0 1
95 0
00 0
00 2
590
800
000
3 2
55 9
52 6
180.
3
2002
337
400
630
29
700
000
7 0
40 0
09 3
74 1
40 6
39 9
8 94
9 00
0 2
00 0
00 0
00 2
598
265
000
3 2
71 3
54 6
390.
5
2003
296
473
391
30
000
000
7 3
24 9
36 3
33 7
98 3
27 9
9 05
5 00
0 1
99 5
00 0
00 2
690
790
000
3 3
23 1
43 3
271.
6
2004
299
428
807
31
000
000
8 0
05 2
85 3
38 4
34 0
92 1
01 8
65 0
00 2
05 0
00 0
00 2
613
000
000
3 2
58 2
99 0
92-2
.0
2005
293
985
618
32
000
000
8 2
56 8
47 3
34 2
42 4
65 1
04 7
90 0
00 2
33 2
00 0
00 2
684
500
000
3 3
56 7
32 4
653.
0
2006
295
701
833
33
500
000
8 2
93 0
90 3
37 4
94 9
23 1
09 3
40 0
00 2
83 2
00 0
00 2
740
800
000
3 4
70 8
34 9
233.
4
2007
312
129
717
34
150
000
9 2
32 8
24 3
55 5
12 5
41 1
14 3
30 0
00 3
27 9
00 0
00 2
818
800
000
3 6
16 5
42 5
414.
2
2008
312
398
624
33
700
000
9 7
22 6
67 3
55 8
21 2
91 1
16 2
37 0
00 3
46 3
00 0
00 2
845
000
000
3 6
63 3
58 2
911.
3
2009
296
531
496
33
363
000
8 5
04 2
49 3
38 3
98 7
45 1
12 2
30 0
00 3
63 1
50 0
00 2
848
000
000
3 6
61 7
78 7
450.
0
2010
304
403
901
33
100
000
8 9
16 8
99 3
46 4
20 8
00 1
12 2
00 0
00 3
75 8
00 0
00 2
902
000
000
3 7
36 4
20 8
002.
0
2011
311
400
206
33
100
000
8 7
99 4
13 3
53 2
99 6
19 1
15 4
90 0
00 3
90 5
20 0
00 2
968
500
000
3 8
27 8
09 6
192.
4
2012
321
666
144
32
900
000
8 4
81 8
98 3
63 0
48 0
42 1
17 9
25 0
00 4
31 9
00 0
00 3
016
000
000
3 9
28 8
73 0
422.
6
2013
328
551
388
32
700
000
8 1
56 1
30 3
69 4
07 5
18 1
17 2
00 0
00 4
65 5
00 0
00 3
061
000
000
4 0
13 1
07 5
182.
1
Figu
res
base
d on
var
ious
indu
stry
sou
rces
Not
es: N
atur
al w
ine
excl
udes
the
grap
e-ba
sed
liquo
r an
d al
coho
lic fr
uit b
ever
age
com
pone
nt.
Beer
is R
SA o
nly.
All o
ther
pro
duct
cat
egor
ies
are
RSA
& So
uthe
rn A
fric
a Cu
stom
s Un
ion
coun
trie
s (B
otsw
ana,
Les
otho
, Nam
ibia
and
Sw
azila
nd).
Win
e an
d Sp
arkl
ing
win
e do
not
incl
ude
bottl
ed im
port
ed p
rodu
cts.
Bot
tled
impo
rted
por
tion
is s
mal
l.Al
l oth
er p
rodu
ct c
ateg
orie
s in
clud
e im
port
ed p
rodu
cts.
Read
y to
drin
k (R
TD) r
efer
s to
bot
h Al
coho
lic F
ruit
Beve
rage
s an
d Sp
irit C
oole
rs.
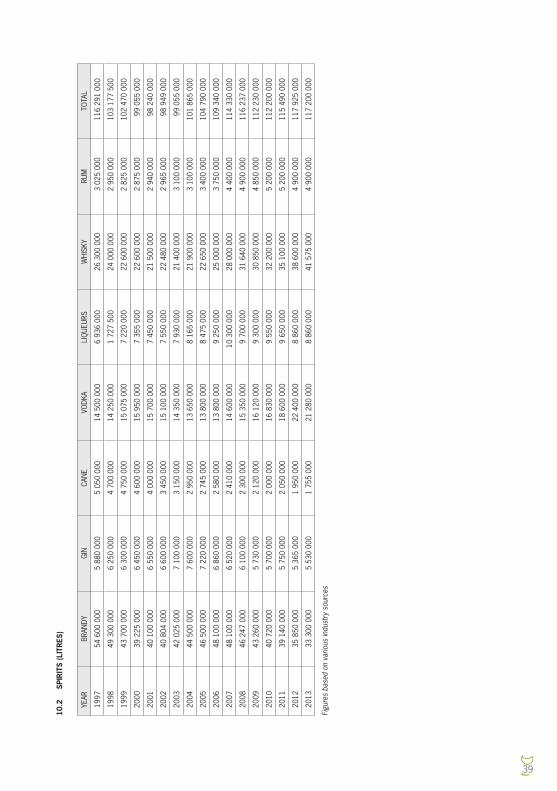
39
10.2
SP
IRIT
S (L
ITR
ES)
YEAR
BRAN
dYG
INcA
NE
VOdK
ALI
QUE
URS
WHI
SKY
RUM
TOTA
L
1997
54
600
000
5 8
80 0
00
5 0
50 0
00
14
500
000
6 9
36 0
00
26
300
000
3 0
25 0
00
116
291
000
1998
49
300
000
6 2
50 0
00
4 7
00 0
00
14
250
000
1 7
27 5
00
24
000
000
2 9
50 0
00
103
177
500
1999
43
700
000
6 3
00 0
00
4 7
50 0
00
15
075
000
7 2
20 0
00
22
600
000
2 8
25 0
00
102
470
000
2000
39
225
000
6 4
50 0
00
4 6
00 0
00
15
950
000
7 3
55 0
00
22
600
000
2 8
75 0
00
99
055
000
2001
40
100
000
6 5
50 0
00
4 0
00 0
00
15
700
000
7 4
50 0
00
21
500
000
2 9
40 0
00
98
240
000
2002
40
804
000
6 6
00 0
00
3 4
50 0
00
15
100
000
7 5
50 0
00
22
480
000
2 9
65 0
00
98
949
000
2003
42
025
000
7 1
00 0
00
3 1
50 0
00
14
350
000
7 9
30 0
00
21
400
000
3 1
00 0
00
99
055
000
2004
44
500
000
7 6
00 0
00
2 9
50 0
00
13
650
000
8 1
65 0
00
21
900
000
3 1
00 0
00
101
865
000
2005
46
500
000
7 2
20 0
00
2 7
45 0
00
13
800
000
8 4
75 0
00
22
650
000
3 4
00 0
00
104
790
000
2006
48
100
000
6 8
60 0
00
2 5
80 0
00
13
800
000
9 2
50 0
00
25
000
000
3 7
50 0
00
109
340
000
2007
48
100
000
6 5
20 0
00
2 4
10 0
00
14
600
000
10
300
000
28
000
000
4 4
00 0
00
114
330
000
2008
46
247
000
6 1
00 0
00
2 3
00 0
00
15
350
000
9 7
00 0
00
31
640
000
4 9
00 0
00
116
237
000
2009
43
260
000
5 7
30 0
00
2 1
20 0
00
16
120
000
9 3
00 0
00
30
850
000
4 8
50 0
00
112
230
000
2010
40
720
000
5 7
00 0
00
2 0
00 0
00
16
830
000
9 5
50 0
00
32
200
000
5 2
00 0
00
112
200
000
2011
39
140
000
5 7
50 0
00
2 0
50 0
00
18
600
000
9 6
50 0
00
35
100
000
5 2
00 0
00
115
490
000
2012
35
850
000
5 3
65 0
00
1 9
50 0
00
22
400
000
8 8
60 0
00
38
600
000
4 9
00 0
00
117
925
000
2013
33
300
000
5 5
30 0
00
1 7
55 0
00
21
280
000
8 8
60 0
00
41
575
000
4 9
00 0
00
117
200
000
Figu
res
base
d on
var
ious
indu
stry
sou
rces
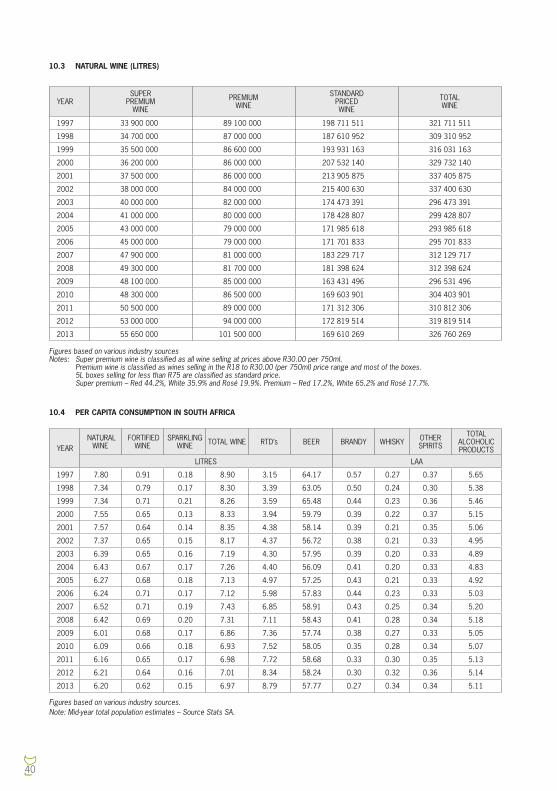
40
10.3 NATURAL WINE (LITRES)
YEARSUPER
PREMIUM WINE
PREMIUM WINE
STANdARd PRIcEd WINE
TOTAL WINE
1997 33 900 000 89 100 000 198 711 511 321 711 511
1998 34 700 000 87 000 000 187 610 952 309 310 952
1999 35 500 000 86 600 000 193 931 163 316 031 163
2000 36 200 000 86 000 000 207 532 140 329 732 140
2001 37 500 000 86 000 000 213 905 875 337 405 875
2002 38 000 000 84 000 000 215 400 630 337 400 630
2003 40 000 000 82 000 000 174 473 391 296 473 391
2004 41 000 000 80 000 000 178 428 807 299 428 807
2005 43 000 000 79 000 000 171 985 618 293 985 618
2006 45 000 000 79 000 000 171 701 833 295 701 833
2007 47 900 000 81 000 000 183 229 717 312 129 717
2008 49 300 000 81 700 000 181 398 624 312 398 624
2009 48 100 000 85 000 000 163 431 496 296 531 496
2010 48 300 000 86 500 000 169 603 901 304 403 901
2011 50 500 000 89 000 000 171 312 306 310 812 306
2012 53 000 000 94 000 000 172 819 514 319 819 514
2013 55 650 000 101 500 000 169 610 269 326 760 269
YEAR NATURAL
WINE FORTIFIEd
WINESPARKLING
WINE TOTAL WINE RTd’s BEER BRANdY WHISKY OTHER SPIRITS
TOTAL ALcOHOLIc PROdUcTS
LITRES LAA
1997 7.80 0.91 0.18 8.90 3.15 64.17 0.57 0.27 0.37 5.65
1998 7.34 0.79 0.17 8.30 3.39 63.05 0.50 0.24 0.30 5.38
1999 7.34 0.71 0.21 8.26 3.59 65.48 0.44 0.23 0.36 5.46
2000 7.55 0.65 0.13 8.33 3.94 59.79 0.39 0.22 0.37 5.15
2001 7.57 0.64 0.14 8.35 4.38 58.14 0.39 0.21 0.35 5.06
2002 7.37 0.65 0.15 8.17 4.37 56.72 0.38 0.21 0.33 4.95
2003 6.39 0.65 0.16 7.19 4.30 57.95 0.39 0.20 0.33 4.89
2004 6.43 0.67 0.17 7.26 4.40 56.09 0.41 0.20 0.33 4.83
2005 6.27 0.68 0.18 7.13 4.97 57.25 0.43 0.21 0.33 4.92
2006 6.24 0.71 0.17 7.12 5.98 57.83 0.44 0.23 0.33 5.03
2007 6.52 0.71 0.19 7.43 6.85 58.91 0.43 0.25 0.34 5.20
2008 6.42 0.69 0.20 7.31 7.11 58.43 0.41 0.28 0.34 5.18
2009 6.01 0.68 0.17 6.86 7.36 57.74 0.38 0.27 0.33 5.05
2010 6.09 0.66 0.18 6.93 7.52 58.05 0.35 0.28 0.34 5.07
2011 6.16 0.65 0.17 6.98 7.72 58.68 0.33 0.30 0.35 5.13
2012 6.21 0.64 0.16 7.01 8.34 58.24 0.30 0.32 0.36 5.14
2013 6.20 0.62 0.15 6.97 8.79 57.77 0.27 0.34 0.34 5.11
10.4 PER CAPITA CONSUMPTION IN SOUTH AFRICA
Figures based on various industry sources.Note: Mid-year total population estimates – Source Stats SA.
Figures based on various industry sourcesNotes: Super premium wine is classified as all wine selling at prices above R30.00 per 750ml. Premium wine is classified as wines selling in the R18 to R30.00 (per 750ml) price range and most of the boxes. 5L boxes selling for less than R75 are classified as standard price. Super premium – Red 44.2%, White 35.9% and Rosé 19.9%. Premium – Red 17.2%, White 65.2% and Rosé 17.7%.
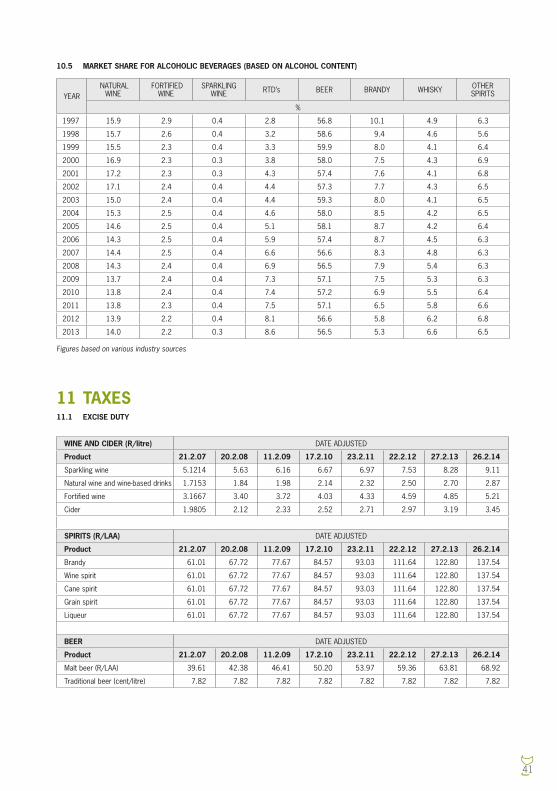
41
11 TAXES11.1 EXCISE DUTY
10.5 MARKET SHARE FOR ALCOHOLIC BEVERAGES (BASED ON ALCOHOL CONTENT)
YEAR NATURAL
WINE FORTIFIEd
WINESPARKLING
WINE RTd’s BEER BRANdY WHISKY OTHER SPIRITS
%
1997 15.9 2.9 0.4 2.8 56.8 10.1 4.9 6.3
1998 15.7 2.6 0.4 3.2 58.6 9.4 4.6 5.6
1999 15.5 2.3 0.4 3.3 59.9 8.0 4.1 6.4
2000 16.9 2.3 0.3 3.8 58.0 7.5 4.3 6.9
2001 17.2 2.3 0.3 4.3 57.4 7.6 4.1 6.8
2002 17.1 2.4 0.4 4.4 57.3 7.7 4.3 6.5
2003 15.0 2.4 0.4 4.4 59.3 8.0 4.1 6.5
2004 15.3 2.5 0.4 4.6 58.0 8.5 4.2 6.5
2005 14.6 2.5 0.4 5.1 58.1 8.7 4.2 6.4
2006 14.3 2.5 0.4 5.9 57.4 8.7 4.5 6.3
2007 14.4 2.5 0.4 6.6 56.6 8.3 4.8 6.3
2008 14.3 2.4 0.4 6.9 56.5 7.9 5.4 6.3
2009 13.7 2.4 0.4 7.3 57.1 7.5 5.3 6.3
2010 13.8 2.4 0.4 7.4 57.2 6.9 5.5 6.4
2011 13.8 2.3 0.4 7.5 57.1 6.5 5.8 6.6
2012 13.9 2.2 0.4 8.1 56.6 5.8 6.2 6.8
2013 14.0 2.2 0.3 8.6 56.5 5.3 6.6 6.5
Figures based on various industry sources
WINE AND CIDER (R/litre) dATE AdJUSTEd
Product 21.2.07 20.2.08 11.2.09 17.2.10 23.2.11 22.2.12 27.2.13 26.2.14
Sparkling wine 5.1214 5.63 6.16 6.67 6.97 7.53 8.28 9.11
Natural wine and wine-based drinks 1.7153 1.84 1.98 2.14 2.32 2.50 2.70 2.87
Fortified wine 3.1667 3.40 3.72 4.03 4.33 4.59 4.85 5.21
cider 1.9805 2.12 2.33 2.52 2.71 2.97 3.19 3.45
SPIRITS (R/LAA) dATE AdJUSTEd
Product 21.2.07 20.2.08 11.2.09 17.2.10 23.2.11 22.2.12 27.2.13 26.2.14
Brandy 61.01 67.72 77.67 84.57 93.03 111.64 122.80 137.54
Wine spirit 61.01 67.72 77.67 84.57 93.03 111.64 122.80 137.54
cane spirit 61.01 67.72 77.67 84.57 93.03 111.64 122.80 137.54
Grain spirit 61.01 67.72 77.67 84.57 93.03 111.64 122.80 137.54
Liqueur 61.01 67.72 77.67 84.57 93.03 111.64 122.80 137.54
BEER dATE AdJUSTEd
Product 21.2.07 20.2.08 11.2.09 17.2.10 23.2.11 22.2.12 27.2.13 26.2.14
Malt beer (R/LAA) 39.61 42.38 46.41 50.20 53.97 59.36 63.81 68.92
Traditional beer (cent/litre) 7.82 7.82 7.82 7.82 7.82 7.82 7.82 7.82
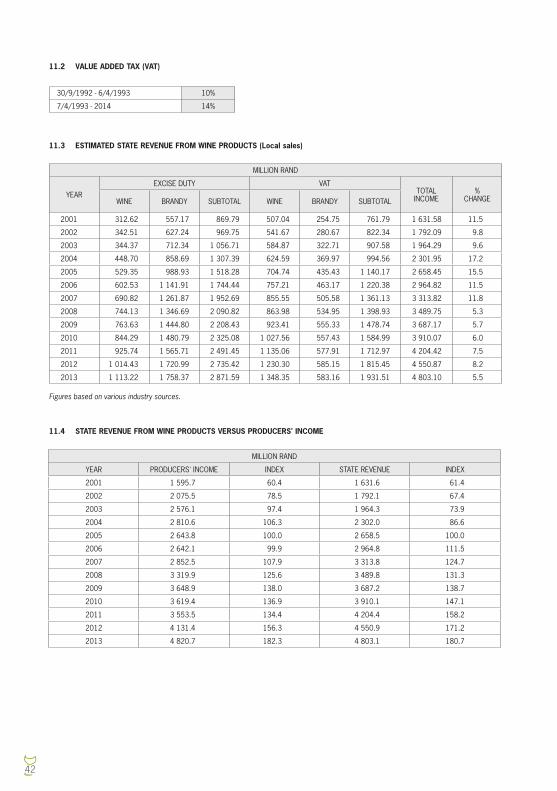
42
30/9/1992 - 6/4/1993 10%
7/4/1993 - 2014 14%
11.2 VALUE ADDED TAX (VAT)
11.3 ESTIMATED STATE REVENUE FROM WINE PRODUCTS (Local sales)
11.4 STATE REVENUE FROM WINE PRODUCTS VERSUS PRODUCERS' INCOME
MILLION RANd
YEAREXcISE dUTY VAT
TOTAL INcOME
% cHANGEWINE BRANdY SUBTOTAL WINE BRANdY SUBTOTAL
2001 312.62 557.17 869.79 507.04 254.75 761.79 1 631.58 11.5
2002 342.51 627.24 969.75 541.67 280.67 822.34 1 792.09 9.8
2003 344.37 712.34 1 056.71 584.87 322.71 907.58 1 964.29 9.6
2004 448.70 858.69 1 307.39 624.59 369.97 994.56 2 301.95 17.2
2005 529.35 988.93 1 518.28 704.74 435.43 1 140.17 2 658.45 15.5
2006 602.53 1 141.91 1 744.44 757.21 463.17 1 220.38 2 964.82 11.5
2007 690.82 1 261.87 1 952.69 855.55 505.58 1 361.13 3 313.82 11.8
2008 744.13 1 346.69 2 090.82 863.98 534.95 1 398.93 3 489.75 5.3
2009 763.63 1 444.80 2 208.43 923.41 555.33 1 478.74 3 687.17 5.7
2010 844.29 1 480.79 2 325.08 1 027.56 557.43 1 584.99 3 910.07 6.0
2011 925.74 1 565.71 2 491.45 1 135.06 577.91 1 712.97 4 204.42 7.5
2012 1 014.43 1 720.99 2 735.42 1 230.30 585.15 1 815.45 4 550.87 8.2
2013 1 113.22 1 758.37 2 871.59 1 348.35 583.16 1 931.51 4 803.10 5.5
MILLION RANd
YEAR PROdUcERS' INcOME INdEX STATE REVENUE INdEX
2001 1 595.7 60.4 1 631.6 61.4
2002 2 075.5 78.5 1 792.1 67.4
2003 2 576.1 97.4 1 964.3 73.9
2004 2 810.6 106.3 2 302.0 86.6
2005 2 643.8 100.0 2 658.5 100.0
2006 2 642.1 99.9 2 964.8 111.5
2007 2 852.5 107.9 3 313.8 124.7
2008 3 319.9 125.6 3 489.8 131.3
2009 3 648.9 138.0 3 687.2 138.7
2010 3 619.4 136.9 3 910.1 147.1
2011 3 553.5 134.4 4 204.4 158.2
2012 4 131.4 156.3 4 550.9 171.2
2013 4 820.7 182.3 4 803.1 180.7
Figures based on various industry sources.
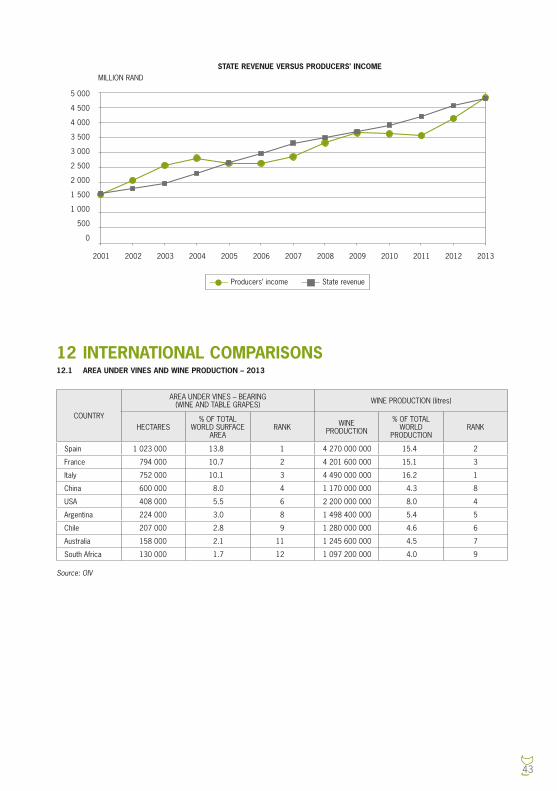
43
12 INTERNATIONAL COMPARISONS12.1 AREA UNDER VINES AND WINE PRODUCTION – 2013
cOUNTRY
AREA UNdER VINES – BEARING (WINE ANd TABLE GRAPES) WINE PROdUcTION (litres)
HEcTARES% OF TOTAL
WORLd SURFAcE AREA
RANK WINE PROdUcTION
% OF TOTAL WORLd
PROdUcTIONRANK
Spain 1 023 000 13.8 1 4 270 000 000 15.4 2
France 794 000 10.7 2 4 201 600 000 15.1 3
Italy 752 000 10.1 3 4 490 000 000 16.2 1
china 600 000 8.0 4 1 170 000 000 4.3 8
USA 408 000 5.5 6 2 200 000 000 8.0 4
Argentina 224 000 3.0 8 1 498 400 000 5.4 5
chile 207 000 2.8 9 1 280 000 000 4.6 6
Australia 158 000 2.1 11 1 245 600 000 4.5 7
South Africa 130 000 1.7 12 1 097 200 000 4.0 9
Source: OIV
MILLION RANd
Producers’ income State revenue
5 000
4 500
4 000
3 500
3 000
2 500
2 000
1 500
1 000
500
0
2001 2002 2003 2004 2005 2006 2007 2008 2009 2010 2011 20132012
STATE REVENUE VERSUS PRODUCERS’ INCOME
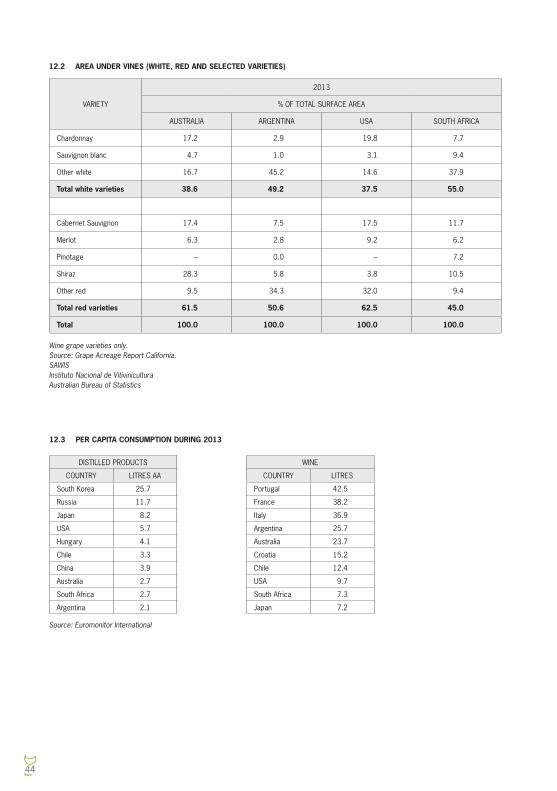
44
VARIETY
2013
% OF TOTAL SURFAcE AREA
AUSTRALIA ARGENTINA USA SOUTH AFRIcA
chardonnay 17.2 2.9 19.8 7.7
Sauvignon blanc 4.7 1.0 3.1 9.4
Other white 16.7 45.2 14.6 37.9
Total white varieties 38.6 49.2 37.5 55.0
cabernet Sauvignon 17.4 7.5 17.5 11.7
Merlot 6.3 2.8 9.2 6.2
Pinotage – 0.0 – 7.2
Shiraz 28.3 5.8 3.8 10.5
Other red 9.5 34.3 32.0 9.4
Total red varieties 61.5 50.6 62.5 45.0
Total 100.0 100.0 100.0 100.0
12.2 AREA UNDER VINES (WHITE, RED AND SELECTED VARIETIES)
12.3 PER CAPITA CONSUMPTION DURING 2013
Wine grape varieties only.Source: Grape Acreage Report California.SAWISInstituto Nacional de VitiviniculturaAustralian Bureau of Statistics
dISTILLEd PROdUcTS WINE
cOUNTRY LITRES AA cOUNTRY LITRES
South Korea 25.7 Portugal 42.5
Russia 11.7 France 38.2
Japan 8.2 Italy 36.9
USA 5.7 Argentina 25.7
Hungary 4.1 Australia 23.7
chile 3.3 croatia 15.2
china 3.9 chile 12.4
Australia 2.7 USA 9.7
South Africa 2.7 South Africa 7.3
Argentina 2.1 Japan 7.2
Source: Euromonitor International