SOUTH AFRICAN NATIONAL SURVEY OF … · 1 south african national survey of intellectual property...
70
SOUTH AFRICAN NATIONAL SURVEY OF INTELLECTUAL PROPERTY AND TECHNOLOGY TRANSFER AT PUBLICLY FUNDED RESEARCH INSTITUTIONS Inaugural Baseline Study: 2008-2014
Transcript of SOUTH AFRICAN NATIONAL SURVEY OF … · 1 south african national survey of intellectual property...

SOUTH AFRICAN NATIONAL SURVEY OFINTELLECTUAL PROPERTY AND TECHNOLOGY TRANSFERAT PUBLICLY FUNDED RESEARCH INSTITUTIONS
Inaugural Baseline Study: 2008-2014
1SOUTH AFRICAN NATIONAL SURVEY OF INTELLECTUAL PROPERTY AND TECHNOLOGY TRANSFER AT PUBLICLY FUNDED RESEARCH INSTITUTIONS
Inaugural Baseline Study: 2008-2014
Produced by the Department of Science and Technology (DST), the Southern African Research and Innovation Management Association (SARIMA), the National Intellectual Property Management Office (NIPMO) and the Centre for Science, Technology and Innovation Indicators (CeSTII).
First published: April 2017
This report may be downloaded free of charge from the following websites:• http://www.hsrc.ac.za/en/departments/cestii• http://www.sarima.co.za/• http://www.dst.gov.za/
Data extractions in response to users’ special data requests are generally provided free of charge, unless a substantial amount of analytical work is required to meet any such request. The data extractions are done in accordancewiththeapproveddataaccessprotocol,[email protected] aggregated and suitably anonymised data will be made available on request. However, individual survey respondents will have access to their own unit level data.
The DST, SARIMA, NIPMO, and CeSTII jointly reserve the right to revise the data and the indicators contained in this report. Explanations regarding any revisions will be made available and accessible on the HSRC-CeSTII website.
Totals in the data tables may not add up to the sum of their constituent items due to rounding. Data was compiled based on non-missing and imputed responses. Summary data was not reported if it was based on input data that was too sparse to preserve confidentiality.
In the data notes to tables, “n=” refers to the number of institutions that responded most frequently for that table over the study period, that is, the modal value for the responses. The survey targeted all ‘institutions’ defined in the Intellectual Property Rights from Publicly Financed Research and Development Act (IPR Act), as at 2014, which are the 23 Higher Education Institutions (HEIs) and the 10 Schedule 1 institutions or Science Councils (SCs).
All currency values are in current prices, unless otherwise indicated. Current prices refer to the value of a financial quantity in the reference period quoted. Constant 2010 prices are used in the text to deflate current values to the base year of 2010 using the GDP deflator.
Unless otherwise specified, the results are for the period 2008 to 2014.
NOTIFICATIONS
DISSEMINATION
DATA NOTES

2SOUTH AFRICAN NATIONAL SURVEY OF INTELLECTUAL PROPERTY AND TECHNOLOGY TRANSFER AT PUBLICLY FUNDED RESEARCH INSTITUTIONS
Inaugural Baseline Study: 2008-2014
Innovation is crucial for South Africa’s economic growth and competitiveness.To enhance technological innovation, scientific research and development (R&D) is necessary. As the enabler, government, playing the role of an “Entrepreneurial State”, is thus required to invest significantly in R&D and in the institutional platforms that drive innovation.
To reap the full benefits of government R&D investment and grow the knowledge economy, South Africa must accelerate the transfer and commercialisation of results from publicly funded research in ways that benefit the country. It is on this basis that, among other measures, the Intellectual Property Rights from Publicly Financed Research and Development Act of 2008 (IPR Act) was introduced to incentivise actors in the research-to-innovation value chain to improve their approaches towards identifying and managing intellectual property (IP) for eventual commercial and social use, as well as their interface with the private sector and international partners on these aspects.
Effective policy making requires evidence. This inaugural survey is an important addition to a portfolio of instruments that are used in assessing the performance of the South African National System of Innovation (NSI). The survey helps to define, in practical terms, specific indicators that government and its stakeholders, including the broader community of technology transfer practitioners, can use to measure the capacity, outputs and targeted outcomes and ultimately impacts of publicly funded R&D. A selection of international benchmarks that are used in this report help us better understand the domestic context of Technology Transfer (TT) capabilities and how itis evolving.
By undertaking this inaugural survey, we have raised awareness about the key indicators that institutions should track in order to monitor their own activities and achievements. There are still gaps in the information sources, availability of data, and validation records at institutions, which need improvement. The intention, however, is to use the lessons learnt to date and regularise a biennial survey to monitor the progress in IP and TT management at public institutions.
I am encouraged by the progress to date and look forward to realising the vision of our National Development Plan, where innovation is acknowledged as the “primary driver of technological growth driving higher living standards”.
MRS GNM PANDORMinister of Science and Technology
FOREWORD

3SOUTH AFRICAN NATIONAL SURVEY OF INTELLECTUAL PROPERTY AND TECHNOLOGY TRANSFER AT PUBLICLY FUNDED RESEARCH INSTITUTIONS
Inaugural Baseline Study: 2008-2014
Technology transfer, which translates promising intellectual property into products, processes and services in the economy, holds the promise of creating jobs, increasing exports, and making a tangible impact on the lives of South Africans. Although some TT activity and successes existed prior to the implementation of the IPR Act, the introduction of this legislation, which placed clear obligations on publicly funded institutions, has mobilised TT capabilities across these institutions. This first-of-its-kind national survey of TT activities is an important mechanism to gauge progress in this nascent sector of the NSI and indeed, where appropriate, internationally. The survey has value for practitioners to benchmark their activities and outputs, for institutions to measure their progress in terms of added impact from their research endeavours, and for policy makers to calibrate the performance of their policy interventions.
The questionnaire collected data spanning seven years, 2008 to 2014, and was designed to measure an ambitious set of metrics. These metrics drew on surveys conducted in other countries, whilst including aspects specific to the South African context, such as measuring existing capability and capacity to undertake TT. Not all institutions were able to respond fully to the questionnaire, however. This was, in part, due to some institutions only starting formal TT activities following the implementation of the IPR Act, whilst the outputs and outcomes of TT are typically many years in the making. Furthermore, many institutions are still putting in place the systems to capture, measure and store the full suite of metrics, and it is hoped that this survey will inform and accelerate this process. There has also been much learning in the survey development and implementation process, which will be ploughed back into the next survey design, to: increase the response levels and the quality of data obtained; and enable a more detailed analysis to be conducted and inferences to be drawn.
The report provides a range of quantitative, as well as some qualitative, metrics. To appreciate the human impact of TT, the report also highlights a handful of stories about the socio-economic outcomes that were a result of the development and application of technologies. It is stories such as these, and not just the promise of generating financial returns, that inspire and energise the work of TT practitioners, the inventors and researchers they work with, and policy makers.
Although the concept of a first national survey was originated by the Southern African Research and Innovation Management Association in 2012, the survey design, implementation and report development process was driven as a team effort in partnership with the Department of Science and Technology’s National Intellectual Property Management Office and the Science and Technology Investment Chief Directorate, with survey implementation support from the Centre for Science, Technology and Innovation Indicators at the Human Sciences Research Council. The passion and contributions of these partners was critical to building what, it is hoped, will be a platform for ongoing measurement of TT activities and outcomes. Perhaps the most important contribution to the survey, was, however, provided by the responding institutions, some of which had, as yet, little to report at the time. Nonetheless, they still participated to the extent possible, and this needs to be specifically acknowledged. We hope that this commitment, together with the value of the report, will inspire increased participation in future, so as to improve our ability to measure and communicate the impact created through TT at South African publicly funded institutions.
Jose Jackson-MaletePresident, SARIMA
STATEMENT FROM SARIMA

4SOUTH AFRICAN NATIONAL SURVEY OF INTELLECTUAL PROPERTY AND TECHNOLOGY TRANSFER AT PUBLICLY FUNDED RESEARCH INSTITUTIONS
Inaugural Baseline Study: 2008-2014
The South African National Survey of Intellectual Property and Technology Transfer at Publicly Funded Research Institutions was embarked on to establish a number of baseline indicators that are required to track overall activity in Intellectual Property (IP) management and Technology Transfer (TT).
The survey was sent to all ‘institutions’ as defined in the Intellectual Property Rights from Publicly Financed Research and Development Act (IPR Act), which are the 23 Higher Education Institutions (HEIs) and the 10 Schedule 1 institutions or Science Councils (SCs). Valid responses were obtained from 24 institutions. Of these, 23 indicated that they have either established a dedicated office of technology transfer (OTT), have dedicated TT individuals or are members of a regional office.
Management of technologies, patent families, trade mark families, registered design families and new patent applications filed increased more rapidly than the increase in research expenditure, which indicates acceleration of these activities relative to research expenditure. On average, 100 new technologies were added annually between 2011 and 2014 to the portfolio managed by respondent institutions.
There has been a quadrupling in the actual number of licences executed per year in the period. Of significance is that more than 88% of this revenue accrued consistently each year to the same four institutions that have well-established TTFs. The majority of IP transactions yielded less than R100 000 per year.
In total, 45 start-up companies were formed over the period to commercialise the institutions’ technology, 73% of which were based on publicly funded IP.
As at 2014: the majority (53.5%) of all staff in the OTTs had four years or less TT experience; females comprised 62.5%oftheTTstaffinHEIsand61.9%inSCs;Black,ColouredandIndian/Asiangroupstogetherrepresented56.4% of TTF staff in HEIs, and 65.2% in SCs. Viewed in the context of overall trends in the racial and skills composition of the labour force in the country, these statistics show that there is clear room for improvement.
Most institutions are performing a range of activities within the categories of IP management, commercialisation and administration. Noticeably, enforcement is less active.
Institutions have indicated that they required 19% and 50% additional funding in 2014 for TT operations and IP expenditure, respectively.
It was not possible to report on a significant number of indicators set out in Section H of the report due to the paucity of data reported and, in some instances, the activities not being undertaken by one or more institutions. Most noticeably, what is lacking from the current report is detailed information on the IP portfolio and outputs of commercialisation activities. Such indicators include: the jurisdictions in which IP protection was filed for, and granted; the number of licences granted to foreign registered organisations; the number of IP transactions concluded with broad-based black economic empowerment (BBBEE) entities; the number of start-up companies that became non-operational in a specific year, and the number of FTEs employed by those companies; and the estimated revenue from licensed products. It is believed that future iterations of this survey will be able to track these and other indicators that are not reported on here.
KEY FINDINGS
5SOUTH AFRICAN NATIONAL SURVEY OF INTELLECTUAL PROPERTY AND TECHNOLOGY TRANSFER AT PUBLICLY FUNDED RESEARCH INSTITUTIONS
Inaugural Baseline Study: 2008-2014
The South African Survey of Intellectual Property and Technology Transfer at Publicly Funded Research Institutions is the inaugural baseline survey, which was conducted as an initiative of the Southern African Research and Innovation Management Association (SARIMA), the National Intellectual Property Management Office (NIPMO) and the Department of Science and Technology (DST), with project implementation by the Centre for Science, Technology and Innovation Indicators (CESTII) at the Human Sciences Research Council (HSRC).
This survey is an important milestone for our National System of Innovation. The project team therefore extends its appreciation for the initiation of the project to: Ms Ela Romanowska (SARIMA); Dr Kerry Faul and Ms Jetane Weyers (NIPMO); Mr Godfrey Mashamba and Ms Kgomotso Matlapeng (DST), and their respective teams. We convey our gratitudetotheteamatCeSTII,undertheleadershipofDrNazeemMustaphaandDrFirdousKhan,forprojectimplementation.
The project team expresses appreciation for the leadership of the Director-General of the DST, Dr Phil Mjwara and his Executives, Mr Imraan Patel and Mr Mmboneni Muofhe; the Chief Executive Officer of the HSRC, Professor Crain Soudien; Deputy CEO-Research at the HSRC, Professor Leickness Simbayi; and the Deputy Executive Director of CeSTII, Dr Glenda Kruss.
We are most grateful for the cooperation of the respondents during the survey. In particular, we appreciate the invaluable input provided by the pilot institutions, namely University of Cape Town, Walter Sisulu University,Nuclear Energy Corporation of South Africa, University of Free State, and the Central University of Technology.A list of all individuals that have contributed to the development of the survey and the drafting of this report is provided in Section I.
ACKNOWLEDGEMENTS

6SOUTH AFRICAN NATIONAL SURVEY OF INTELLECTUAL PROPERTY AND TECHNOLOGY TRANSFER AT PUBLICLY FUNDED RESEARCH INSTITUTIONS
Inaugural Baseline Study: 2008-2014
ATTP Association of Technology Transfer Professionals
AUTM Association of University Technology Managers
BBBEE Broad-based black economic empowerment
CeSTII Centre for Science, Technology and Innovation Indicators
DST Department of Science and Technology
FTE Full-time Equivalent
HEI Higher Education Institution
HSRC Human Sciences Research Council
IP Intellectual Property
IPR Intellectual Property Right
IPR Act Intellectual Property Rights from Publicly Financed Research and Development Act, 2008
NIPMO National Intellectual Property Management Office
NSI National System of Innovation
OTT Office of Technology Transfer
R&D Research and Development
RTTP Registered Technology Transfer Professional
SARIMA Southern African Research and Innovation Management Association
SC Science Council
TIA Technology Innovation Agency
TT Technology Transfer
TTF Technology Transfer Function
UK United Kingdom
USA United States of America
ABBREVIATIONS
7SOUTH AFRICAN NATIONAL SURVEY OF INTELLECTUAL PROPERTY AND TECHNOLOGY TRANSFER AT PUBLICLY FUNDED RESEARCH INSTITUTIONS
Inaugural Baseline Study: 2008-2014
NOTIFICATIONS 1
DISSEMINATION 1
DATA NOTES 1
FOREWORD 2
STATEMENT FROM SARIMA 3
KEY FINDINGS 4
ACKNOWLEDGEMENTS 5
ABBREVIATIONS 6
TABLE OF CONTENTS 7
TABLE OF FIGURES 9
LIST OF TABLES 11
INTRODUCTION 12Aim of the survey 12
Scope and approach 12
Structure of this report 12
CONTEXT OF IP AND TT IN SOUTH AFRICA 13Defining Technology Transfer 13
South African legislative context 15
International context 15
SURVEY RESULTS 171. CAPABILITIES AND STRUCTURE OF THE TECHNOLOGY TRANSFER FUNCTION 17
1.1 Profile of the technology transfer function 17
1.2 Perceived gaps in the skills base of the technology transfer function 21
2. THE TECHNOLOGY TRANSFER FUNCTION 23
2.1 Activities, systems and resources 23
2.2 Factors which promote or inhibit the technology transfer function 25
2.3 Expenditure associated with the TTF 26
3. IP PORTFOLIO 29
3.1 Disclosures 29
3.2 Technologies 29
3.3 Patents 30
3.4 Trade Marks 32
3.5 Designs 33
3.6 IP related activities per billion Rand of institutional research expenditure 33
TABLE OF CONTENTS
A
B
C

8SOUTH AFRICAN NATIONAL SURVEY OF INTELLECTUAL PROPERTY AND TECHNOLOGY TRANSFER AT PUBLICLY FUNDED RESEARCH INSTITUTIONS
Inaugural Baseline Study: 2008-2014
4. IP TRANSACTIONS AND REVENUE 36
4.1 IP transactions 36
4.2 IP transaction revenue 37
5. START-UPS 40
5.1 Start-ups 40
CONCLUSIONS 41
METHODOLOGY 42Survey design and planning 42
External data used in calculations of indicators 43
Fieldwork and quality indicators of survey coverage 44
Frame, sample selection and fieldwork periods 45
Imputation 46
Data processing, analysis and validation 47
REFERENCES 48
SURVEY DEFINITIONS 49
LIST OF INDICATORS NOT REPORTED 58
LIST OF ACKNOWLEDGEMENTS 63
F
G
H
I
D
E

9SOUTH AFRICAN NATIONAL SURVEY OF INTELLECTUAL PROPERTY AND TECHNOLOGY TRANSFER AT PUBLICLY FUNDED RESEARCH INSTITUTIONS
Inaugural Baseline Study: 2008-2014
Figure 1: Number of institutions to first dedicate 0.5 FTE to the TTF 17
Figure 2: Types of structures of the TTF, 2014 17
Figure 3: Percentage distribution of years of TT experience of individual, 2014 18
Figure 4: Percentage distribution of employment categories, 2014 18
Figure 5: Percentage distribution by gender of individuals, 2014 19
Figure 6: Percentage distribution of population groups, 2014 19
Figure 7: Percentage distribution of highest qualification of individuals employed in the TTF, 2014 19
Figure 8: Percentage distribution by field of undergraduate qualification of staff, 2014 20
Figure 9: Percentage distribution of legal qualification of staff, 2014 20
Figure 10: Percentage of institutions that indicated which specific skills were “much” or 21
“critically” needed, as at 2014
Figure 11: TTF activities, 2014 23
Figure 12: Support systems used by institutions, 2014 24
Figure 13: Incubation space in use 24
Figure14:Perceivedimportanceofpromoters/enablersoftheTTF,2014 25
Figure15:Perceivedpresenceandfunctioningofpromoters/enablers,2014 25
Figure 16: Perceived importance of inhibitors of the TTF, 2014 26
Figure 17: Perceived impact of inhibitors of the TTF, 2014 26
Figure 18: TT operations, IP and litigation expenditures, as well as estimated required budget, 26
in constant 2010 prices
Figure 19: Legal fees reimbursement in constant 2010 prices 27
Figure 20: Number of disclosures received 29
Figure 21: Proportion of actionable disclosures to disclosures received 29
Figure 22: Number of technologies managed by the TTF 29
Figure 23: Number of new patent applications 30
Figure 24: Number of new convention patent applications 30
Figure 25: Number of new national phase patent applications 30
Figure 26: Comparison of number of new patent applications filed per disclosure received for 31
South Africa and USA
Figure 27: Patent families managed by the TTF 31
Figure 28: Number of new trade mark applications filed 32
Figure 29: Number of trade marks granted 32
Figure 30: Number of trade mark families managed 32
Figure 31: Registered designs 33
Figure 32: IP related activities per Billion Rand of institutional research expenditure in 33
constant 2010 prices
TABLE OF FIGURES

10SOUTH AFRICAN NATIONAL SURVEY OF INTELLECTUAL PROPERTY AND TECHNOLOGY TRANSFER AT PUBLICLY FUNDED RESEARCH INSTITUTIONS
Inaugural Baseline Study: 2008-2014
Figure 33: IP related activities managed per billion Rand of institutional research expenditure 34
in constant 2010 prices
Figure 34: Number of licences executed in a particular year 36
Figure 35: Exclusive vs non-exclusive licences executed per year 36
Figure 36: Total IP transaction revenue 37
Figure 37: Number of IP transactions yielding revenue in five revenue brackets 37
Figure 38: Number of start-ups formed to commercialise institutions’ technologies and, of those 40
technologies, the number based on publicly funded IP
Figure 39: Total start-up companies operational at the financial year end 40
Figure 40: Statistical Value Chain used in quality and metadata management 42

11SOUTH AFRICAN NATIONAL SURVEY OF INTELLECTUAL PROPERTY AND TECHNOLOGY TRANSFER AT PUBLICLY FUNDED RESEARCH INSTITUTIONS
Inaugural Baseline Study: 2008-2014
Table 1: Total FTEs and headcount by institution type, 2014 18
Table 2: GDP deflator 43
Table3:PurchasingpowerparityinunitsofRands/USDollar(asatSeptember2014) 43
Table 4: Completion rate for sections of the baseline survey 44
Table 5: Institutions 45
Table 6: Research expenditure including clinical trials, in millions of Rands 46
LIST OF TABLES

12SOUTH AFRICAN NATIONAL SURVEY OF INTELLECTUAL PROPERTY AND TECHNOLOGY TRANSFER AT PUBLICLY FUNDED RESEARCH INSTITUTIONS
Inaugural Baseline Study: 2008-2014
INTRODUCTION
Aim of the survey
This survey establishes baseline indicators required to track overall activity in Intellectual Property (IP) management and Technology Transfer (TT) at publicly funded research institutions in South Africa.
Scope and approach
The study period starts in 2008, the year when the Intellectual Property Rights from Publicly Financed Research and Development Act (IPR Act) was passed, and runs to 20141. The survey targeted all institutions as defined in the IPR Act, which are the 23 Higher Education Institutions (HEIs) and the 10 Schedule 1 institutions or Science Councils (SCs). In many cases, the TT functions (TTFs) at these institutions were established as a direct response to the requirements of the IPR Act. However, it is important to note that, even before the landmark legislation was introduced, some institutions had already led the way and set up TTFs.
Responding to the survey was voluntary. Third-party administrative data was also used in the study, both to enhance data and its quality and also as a measure to reduce respondent burden. However, despite these measures, a paucity of data remains in many parts of the survey. Therefore, the survey results in this report represent seventy-three percent (73%) of the 33 publicly financed research institutions. International benchmarking data was referenced, where possible, to enhance the process of interpreting the findings. Comprehensive international benchmarking will onlybe possible in future surveys as it is anticipated that more complete data will become available as the system matures.
The survey instrument was initially based on a similar survey in the United States of America (USA), which
was undertaken by the Association of University Technology Managers (AUTM). An oversight committee consisting of members from SARIMA, NIPMO, DST and CeSTII was established to assist with adaptation of the instrument to the South African context. This process also involved piloting the instrument with several institutions that are at various stages of TTF maturity. Steps were taken – workshops and email communication – to sensitise the TT community prior to the survey taking place, and to promote participation by institutions. However, due to the level of maturity of TTFs at many of the institutions surveyed, there are indicators that could not yet be meaningfully reported. It is hoped that future surveys will see a broadening of the dataset and indicators reported.
Structure of this report
The next section (Section B) provides the context of IP and TT in South Africa. Section C presents the survey results and covers a selection of indicators, namely: capabilities and structure of the Technology Transfer Function; the activities of the Technology Transfer Function; IP portfolio; IP transactions and revenue; and start-up companies. Four stories from publicly funded research institutions that illustrate the social impact of TT, are interspersed in this section. Section D provides the report conclusions, while Section E explains the methodology followed in conducting the survey and preparing the results. Section F lists the references used and Section G provides the definitions for a number of the terms contained in the report. Section H provides a list of all indicators that could not be reported on due to insufficient data. Section I provides a comprehensive list of all contributors to the survey development process, and the drafting and reviewing of this report.
A
1 There have been other surveys, however, to the best of the project team’s knowledge this survey covers a more recent and longer time period, and a much broader set of indicators.

13SOUTH AFRICAN NATIONAL SURVEY OF INTELLECTUAL PROPERTY AND TECHNOLOGY TRANSFER AT PUBLICLY FUNDED RESEARCH INSTITUTIONS
Inaugural Baseline Study: 2008-2014
CONTEXT OF IP AND TT IN SOUTH AFRICA
Defining Technology Transfer
In its broadest sense, technology transfer (TT) is the process of translating promising ideas into products, processes and services in the economy. More specifically, in a South African institutional context, and framed by the IPR Act, TT involves the identification, protection and putting into use (also referred to as commercialisation) of promising technology concepts that emanate from research activities, for the benefit of society. This definition resonates with South Africa’s stated policy intent to improve the regulatory environment for the identification and utilisation of IP, to improvethetranslationofresearchresultsforeconomicgain,andtoimprovethelivingstandardsofcitizens(1996White Paper on Science and Technology; 2002 National Research and Development Strategy; 2007 Ten Year Innovation Plan).
The TT process is made up of many activities, which can be depicted in many ways, and, in reality, TT is a fluid and dynamic process that rarely follows a linear course (see infographic). However, for the purposes of simplicity, and to provide a useful framework for appreciating the results reported in this survey, we depict it here as a sequence of steps, detailed below as steps (a) to (i).
a) Knowledge creation: Research is undertaken, and in some instances research result(s) with potential commercial application may be identified, such as an invention.
b) Disclosure: Submitting a disclosure to the TTF is the important first step in the process of documenting a new IP creation (such as an invention) and facilitating further activities in the
B
Knowledgecreation
Fundraising andtechnology development
IP protection
IP transaction
Marketing
Assessment and go/no go decision making
Start-upcompany
Disclosure
Productdevelopment
Existingcompany
IMPACT

14SOUTH AFRICAN NATIONAL SURVEY OF INTELLECTUAL PROPERTY AND TECHNOLOGY TRANSFER AT PUBLICLY FUNDED RESEARCH INSTITUTIONS
Inaugural Baseline Study: 2008-2014
development of the technology, its protection and commercialisation.
Some or all of the following three steps (c) to (e) can occur after disclosure and initial evaluation thereof.
c) IP protection: In support of the likely commercialisation strategy, the TTF may pursue patent or other IP protection of the new disclosure. The TTF will work with IP creator(s) and IP attorneys to draft and file a patent, registered design, or plant breeders’ rights application. Another protection approach is to maintain confidentiality and treat the technology as a trade secret. It should be appreciated that registered protection is not an end goal; instead, it should be viewed as a means to facilitate commercialisation, whether for social and/orcommercialbenefit.
d) Fundraising and technology development: The TTF in partnership with the IP creator(s) will raise funds to support further development and testing of the technology, conduct market and techno-economic studies, and other activities that may make the technology more attractive to partners to commercialise the technology.
e) Marketing: The TTF in partnership with the IP creator(s) will identify opportunities and market technologies to potential commercial partners. These partners have the expertise to translate discoveries into new products, processes and services, or are entrepreneurs with the right experience and credentials to create a company for the purposes of undertaking such translation.
f) IP transaction: This is an agreement entered into in order to grant a third party the right to developand/orcommercialisethetechnology(licence)and/ortotransferownershiptosuchparty (assignment). In some instances an option is granted that gives this party the first right to negotiate a suitable assignment or licence arrangement at a later stage. Licences can be exclusive (only one party can exercise the rights granted) or non-exclusive (more than one party can exercise similar rights). An IP transaction is entered into with the chosen party which can be an existing company or a start-up
company. With an existing company, a due diligence may be conducted prior to negotiating and executing the IP transaction. With a start-up company, the TTF facilitates the formation and registration of the start-up company, may take equity in the company, and enters into a suitable IP transaction with the newly formed company. The start-up company may require incubation and capital raising support, which the TTF can facilitate or support directly, depending on its capabilities and available support mechanisms.
g) Product development: After an IP transaction is concluded, companies typically invest significant resources to translate the IP creation/invention/technologyintoausefulproduct, process or service, which can generate revenue for the company. As part of this process the IP creator(s) may be tasked to assist the company by transferring their knowledge of the technology,and/oractingastechnicalexpertstoguideproductdevelopment,and/ortheymayelect to become directly involved as employees of the start-up company.
h) Impact: Impact may be created through the use of the technology in a new or improved product, process or service, inter alia, through:• Jobs,exports,increasedtaxrevenue,etc.
created in the economy;• Socialimpactintermsofimprovedqualityof
life, health and safety, etc.;• Revenuetotheinstitution,throughroyalties
paid, dividends earned or equity sold. A portion of this income is shared with the IP creators as per an institution’s IP policy; and/or
• Indirectimpacttotheinstitution,forexample,through securing additional research opportunities with industry partners due to successful TT.
i) Assessment/Evaluation: Ongoing assessment and evaluation is conducted, especially during disclosure, marketing, fundraising and protection activities. The technology and its commercial prospects are evaluated in terms of many factors, including IP protection (such as patentability), market

15SOUTH AFRICAN NATIONAL SURVEY OF INTELLECTUAL PROPERTY AND TECHNOLOGY TRANSFER AT PUBLICLY FUNDED RESEARCH INSTITUTIONS
Inaugural Baseline Study: 2008-2014
prospects in relation to competing technology solutions, commercial potential and possible partners with whom to work. IP creator(s) and the TTF work closely together to ensure all parties are up to date with all developments. Go/nogodecisionsaremadeandtechnologiescan be abandoned at any stage if the prospects are not favourable.
South African legislative context
Inspired, in part, by the USA Bayh-Dole Act of 1980 and the United Kingdom (UK) Patent Law in 1978, South Africa adopted the IPR Act, which came into effect on 2 August 2010. The stated objective of the IPR Act is that, “intellectual property emanating from publicly financed research and development is identified, protected, utilised and commercialised for the benefit of the people of the Republic, whether it be for social, economic, military or other benefit”. To this end, the IPR Act obligates recipients of public funds to: assess, record and report on the benefits of their work to society; and to ensure that IP emanating from publicly financed R&D becomes available to South Africancitizens,orimprovestheirqualityoflife,directlyor indirectly.
Institutions, including HEIs and those listed in Schedule 1 of the IPR Act, are required to have capability to perform TT activities, including the receipt, analysis and subsequent statutory protection of any identified IP (collectively referred to as IP management), as well as all aspects of IP commercialisation, including concluding any IP transactions. Such capabilities – referred to here as TTFs – are thus the vehicles used by institutions to ensure that the returns from all IP generated through publicly financed R&D are protected, managed and commercialised in the interests of the Republic.
Another important outcome of the IPR Act was the establishment of NIPMO, which has a mandate to oversee the implementation of the legislation on behalf of the Government of South Africa, as well as to support the establishment and development of TTFs
at institutions. NIPMO is required to provide support (including financial support), to capacitate TTFs and secure Intellectual Property Rights (IPRs). In this regard, NIPMO’s role has been pivotal in taking a nascent TT activity to a higher level, as will be tracked in this survey’s results.
International context
Many other countries have drawn inspiration from the UK Patent Law and the USA Bayh-Dole Act to drive policy shifts and new legislative protection regimes for publicly financed IP. Some of their legislation and TT activities have been in place for over thirty years; however as indicated, in South Africa the IPR Act was only implemented fairly recently. As context to this it is useful to understand the legislative frameworks and resulting IP creation and commercialisation momentum in specific developed and developing countries, such as theUSA,UK,BrazilandRussia.
In the USA, the 1980 Bayh-Dole Act allowed universities to retain title to inventions and to take the lead in patenting and licensing discoveries. AUTM provides a learning network for best practices for TTFs, facilitates relations with industry, and supports members through education and TT advocacy. SARIMA plays a similar role in the Southern African region. AUTM surveys of licensing activity (conducted since 1996) show that responses to the Bayh-Dole Act resulted in the establishment of an estimated 300 TTF equivalent offices, and the launch of more than 10 000 start-up companies, of which just over 4 000 were still operational in 2012. As a further measure of economic impact, companies that commercialised technologies licensed from institutions realised product sales income of US$22.8 billion and US$28 billion in 2013 and 2014, respectively.
In the UK, although there is no explicit legislative framework, many universities established TTFs in the 1990s, encouraged particularly by the government’s support for so-called ‘Third Stream’ funding to universities to promote business-university collaboration and entrepreneurship. The Higher Education-Business
16SOUTH AFRICAN NATIONAL SURVEY OF INTELLECTUAL PROPERTY AND TECHNOLOGY TRANSFER AT PUBLICLY FUNDED RESEARCH INSTITUTIONS
Inaugural Baseline Study: 2008-2014
Community Interaction Survey (HE-BCI) on 159 publicly funded HEIs found that there has been a 51.3% increase in IP income from £87 million in 2012 to £131 million in 2013.
InBrazil,the2004InnovationLawmandatedBrazil’suniversities to set up TTFs and facilitated more flexibility in how research and knowledge moved from universities into the private sector. A survey conducted bytheCambridgeEnterpriseofBrazilianTTFs,published in 2014, shows 193 TTFs in existence. Many of the TTFs were established around 2006, shortly after the Innovation Law was passed.
In Russia, Federal Law 217 of 2009 regulates and encourages universities and institutes of the Russian Academy of Sciences to form start-up companies where the organisation can be sole founders or co-founders. A 2012 Policy Research Working Paper (6263) by the World Bank indicates that as result of this Federal Law, by 2011, 943 start-ups had been created based on IP produced by 1089 institutions.
17SOUTH AFRICAN NATIONAL SURVEY OF INTELLECTUAL PROPERTY AND TECHNOLOGY TRANSFER AT PUBLICLY FUNDED RESEARCH INSTITUTIONS
Inaugural Baseline Study: 2008-2014
SURVEY RESULTS
1. CAPABILITIES AND STRUCTURE OF THE TECHNOLOGY TRANSFER FUNCTION
This section describes the capabilities that exist within the institutional TT system, in terms of the establishment of the TTF, its structure, and human resource capacity. Other demographic information, such as population group and gender, is also reported on as part of the process of tracking transformation within the TTF. Certain indicators are limited to data as at 2014.
1.1 Profile of the technology transfer function
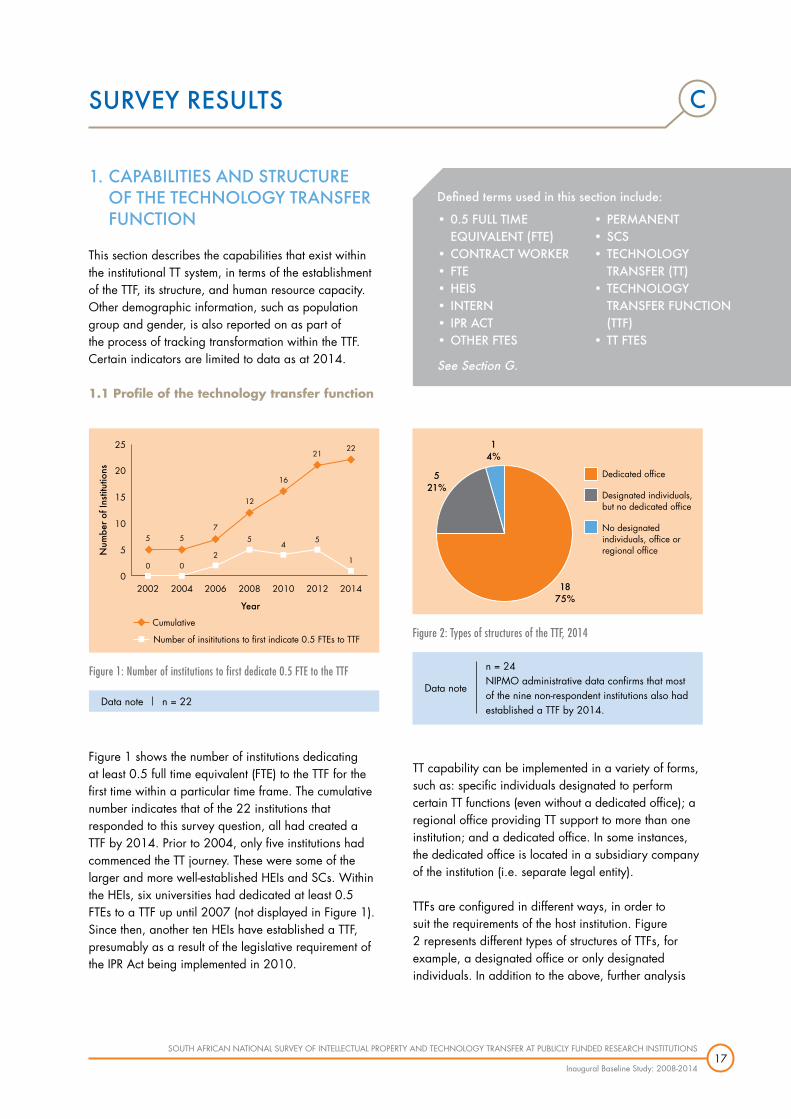
Figure 1 shows the number of institutions dedicating at least 0.5 full time equivalent (FTE) to the TTF for the first time within a particular time frame. The cumulative number indicates that of the 22 institutions that responded to this survey question, all had created a TTF by 2014. Prior to 2004, only five institutions had commenced the TT journey. These were some of the larger and more well-established HEIs and SCs. Within the HEIs, six universities had dedicated at least 0.5 FTEs to a TTF up until 2007 (not displayed in Figure 1). Since then, another ten HEIs have established a TTF, presumably as a result of the legislative requirement of the IPR Act being implemented in 2010.
TT capability can be implemented in a variety of forms, such as: specific individuals designated to perform certain TT functions (even without a dedicated office); a regional office providing TT support to more than one institution; and a dedicated office. In some instances, the dedicated office is located in a subsidiary company of the institution (i.e. separate legal entity).
TTFs are configured in different ways, in order to suit the requirements of the host institution. Figure 2 represents different types of structures of TTFs, for example, a designated office or only designated individuals. In addition to the above, further analysis
C
Figure 1: Number of institutions to first dedicate 0.5 FTE to the TTF
n = 22Data note
25
2002
0
5
0
5
2
75
12
4
16
5
21
1
22
2004 2006 2008 2010 2012 2014
20
15
10
5
0
Num
ber
of In
stitu
tions
Year
Cumulative
Number of insititutions to first indicate 0.5 FTEs to TTF Figure 2: Types of structures of the TTF, 2014
Dedicated office
Designated individuals, but no dedicated office
No designated individuals, office or regional office
14%
521%
1875%
n = 24NIPMO administrative data confirms that most of the nine non-respondent institutions also had established a TTF by 2014.
Data note
•0.5FULLTIMEEQUIVALENT(FTE)
•CONTRACTWORKER•FTE•HEIS•INTERN•IPRACT•OTHERFTES
•PERMANENT•SCS•TECHNOLOGY
TRANSFER(TT)•TECHNOLOGY
TRANSFERFUNCTION(TTF)
•TTFTES
SeeSectionG.
Definedtermsusedinthissectioninclude:

18SOUTH AFRICAN NATIONAL SURVEY OF INTELLECTUAL PROPERTY AND TECHNOLOGY TRANSFER AT PUBLICLY FUNDED RESEARCH INSTITUTIONS
Inaugural Baseline Study: 2008-2014
of the data shows that:• Fourrespondentsindicatedthattheyarelinkedtoa
regional office.• Sevenrespondentsindicatedthattheyhavea
separate legal entity dedicated to perform all or part of the TTF.
• TworespondentsindicatedthattheIPoftheinstitution is assigned to a subsidiary that is mandated to manage the institution’s IP.
The data in Table1, Figures 3 to 7 and Figure 9, on labour, demographics and education of staff were obtained at an individual level. The institutions were still regarded as the reporting unit, but the statistics compiled for these items are at the level of the individual within the TTFs. The respondents were asked to provide this information for each individual in the TTF. The number of institutions that responded are indicated in a data note as “n =”. Within these institutional level responses, there were some missing points for some of the items reported on individuals, which could not be imputed in a reliable manner. The number of non-missing responses for any particular item is also recorded in the data note for the respective table and figures, and is denoted by “individuals =”.
Table 1 illustrates the FTEs and headcounts of individuals working within the TTF, indicating an average FTE count of 3.9.
Figure 3 indicates that the majority (53.5%) of all individuals within TTFs have four years or less TT experience. The relatively low number of combined years of experience reflects the fact that South Africa’s system of TTFs is both fairly new and small.
Total headcount
TT FTEs
Other FTEs
Total FTEs
HEI
80
58
12
70
SC
23
8.3
7.8
16.1
TOTAL
103
66.3
19.8
86.1
Table 1: Total FTEs and headcount by institution type, 2014
HEI n = 16SC n = 6Note: “Other FTEs” are, typically, administrative in nature.FTEs are undercounted relative to headcounts due to missing data.
Data note
Figure 3: Percentage distribution of years of TT experience of individual, 2014
n = 22 (Individuals = 103)Missing data from at least one large established respondent could change this distribution.
Data note
Percentage (%)
0 5 10 15 20 25 30 35 40
18.50 to 1
352 to 4
27.25 to 7
7.88 to 10
3.911 to 13
4.914 to 16
0.017 to 19
2.920 to 22
Percentage (%)
0.0 10.0 20.0 30.0 40.0 50.0 60.0 70.0 80.0 90.0 100.0
HEI52.5
38.83.85.0
SC
87.013.0
0.00.0
Permanent Contract Intern Temporary
Figure 4: Percentage distribution of employment categories, 2014
HEI n = 16 (Individuals = 80)SC n = 6 (Individuals = 23)
Data note

19SOUTH AFRICAN NATIONAL SURVEY OF INTELLECTUAL PROPERTY AND TECHNOLOGY TRANSFER AT PUBLICLY FUNDED RESEARCH INSTITUTIONS
Inaugural Baseline Study: 2008-2014
Within HEIs: 52.5% of the individuals employed by the TTF were permanent; 38.8% were employed on contract; and a further 8.8% were appointed as interns and temporary workers. In comparison, the majority (87.0%) of individuals at SCs were employed on a permanent basis.
There is a concern with regard to continuity within the TTF, especially at HEIs, and the potential loss of valuable, highly specialised skills, if the contracts cannot be renewed or made permanent.
Nearly two-thirds of the total individuals within the TTF are female. In comparison, the Quarterly Labour Force Survey (Stats SA 2015) reported that the national urban working age group profile is 50.8% female and 49.2% male.
In HEIs, 43.8% of the individuals involved with the TTF are from the White population group. Other population groups,namelyBlack,ColouredandIndian/Asiangroups together represent 56.4% of TTF individuals in HEIs. In SCs the demographics are slightly different, with the Black population group representing the largest group at 39.1%, followed by White with 34.8% and 13.0%apieceforColouredandIndian/Asiangroups.
Figure 5: Percentage distribution by gender, 2014
Percentage (%)
HEI
SC
0.0 10.0 20.0 30.0 40.0 50.0 60.0 70.0
62.537.5
61.938.1
Female Male
HEI n = 16 (Individuals = 80)SC n = 5 (Individuals = 21)
Data was not available from at least two major contributors. This means that this series is possibly under-estimated.
Data note
Figure 6: Percentage distribution of population groups, 2014
HEI n = 16 (Individuals = 80)SC n = 6 (Individuals = 23)
Data note
Percentage (%)
0.0 5.0 10.0 15.0 20.0 25.0 30.0 35.0 40.0 45.0 50.0
HEI36.3
43.813.8
6.3
SC
39.134.8
13.013.0
Black White Coloured Indian/Asian
Figure 7: Percentage distribution of highest qualification of individuals employed in the TTF, 2014
HEI n = 16 (Individuals = 80)SC n = 6 (Individuals = 23)
Data note
Percentage (%)
0.0 5.0 10.0 15.0 20.0 25.0 30.0 35.0 40.0 45.0
HEI
17.939.7
11.515.4
6.47.7
1.3
SC
25.020.8
8.325.0
20.80.00.0
PhD
Diploma Other qualification No qualification
Masters Honours Bachelors
20SOUTH AFRICAN NATIONAL SURVEY OF INTELLECTUAL PROPERTY AND TECHNOLOGY TRANSFER AT PUBLICLY FUNDED RESEARCH INSTITUTIONS
Inaugural Baseline Study: 2008-2014
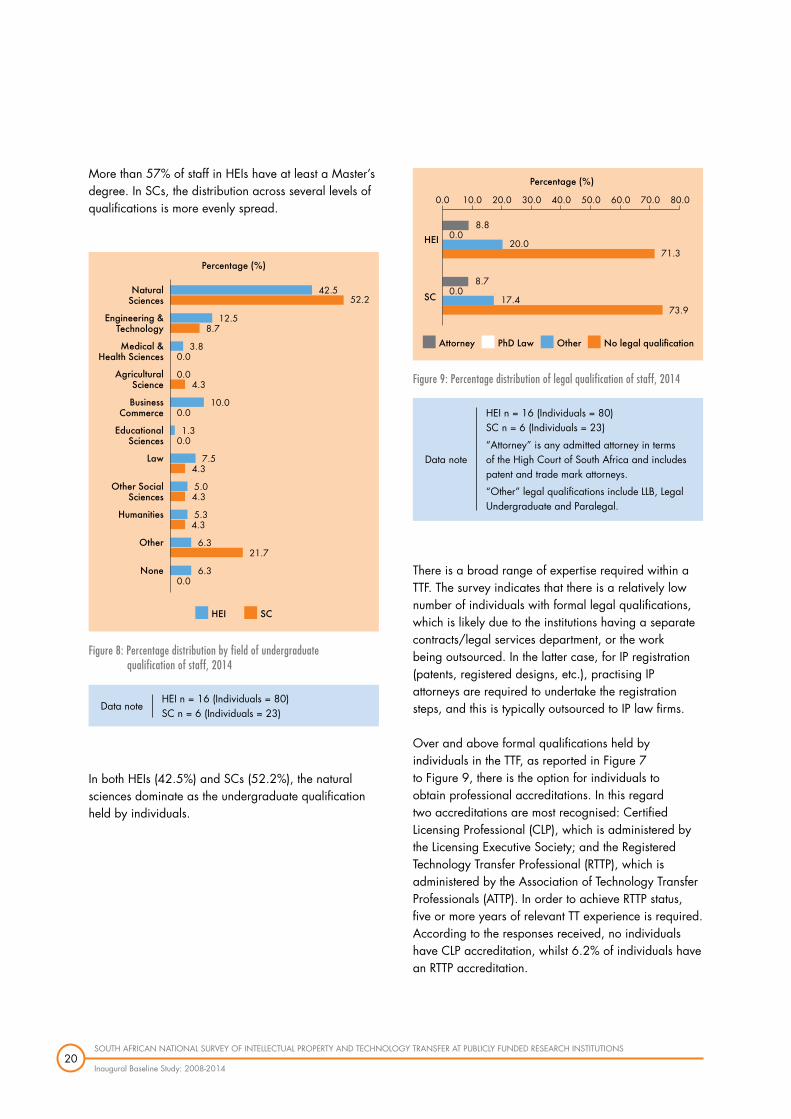
More than 57% of staff in HEIs have at least a Master’s degree. In SCs, the distribution across several levels of qualifications is more evenly spread.
In both HEIs (42.5%) and SCs (52.2%), the natural sciences dominate as the undergraduate qualification held by individuals.
There is a broad range of expertise required within a TTF. The survey indicates that there is a relatively low number of individuals with formal legal qualifications, which is likely due to the institutions having a separate contracts/legalservicesdepartment,ortheworkbeing outsourced. In the latter case, for IP registration (patents, registered designs, etc.), practising IP attorneys are required to undertake the registration steps, and this is typically outsourced to IP law firms.
Over and above formal qualifications held by individuals in the TTF, as reported in Figure 7 to Figure 9, there is the option for individuals to obtain professional accreditations. In this regard two accreditations are most recognised: Certified Licensing Professional (CLP), which is administered by the Licensing Executive Society; and the Registered Technology Transfer Professional (RTTP), which is administered by the Association of Technology Transfer Professionals (ATTP). In order to achieve RTTP status, five or more years of relevant TT experience is required. According to the responses received, no individuals have CLP accreditation, whilst 6.2% of individuals have an RTTP accreditation.
Figure 8: Percentage distribution by field of undergraduate qualification of staff, 2014
HEI n = 16 (Individuals = 80)SC n = 6 (Individuals = 23)
Data note
Percentage (%)
HEI SC
NaturalSciences
42.552.2
BusinessCommerce
10.00.0
Engineering & Technology
12.58.7
EducationalSciences
1.30.0
Humanities 5.34.3
Medical &Health Sciences
3.80.0
Law 7.54.3
Other 6.321.7
AgriculturalScience
0.04.3
Other Social Sciences
5.04.3
None 6.30.0
Figure 9: Percentage distribution of legal qualification of staff, 2014
HEI n = 16 (Individuals = 80)SC n = 6 (Individuals = 23)
“Attorney” is any admitted attorney in terms of the High Court of South Africa and includes patent and trade mark attorneys.
“Other” legal qualifications include LLB, Legal Undergraduate and Paralegal.
Data note
Percentage (%)
0.0 10.0 20.0 30.0 40.0 50.0 60.0 70.0 80.0
Attorney PhD Law Other No legal qualification
HEI8.8
0.020.0
71.3
SC
8.70.0
17.473.9

21SOUTH AFRICAN NATIONAL SURVEY OF INTELLECTUAL PROPERTY AND TECHNOLOGY TRANSFER AT PUBLICLY FUNDED RESEARCH INSTITUTIONS
Inaugural Baseline Study: 2008-2014
1.2 Perceived gaps in the skills base of the technology transfer function
It is apparent that many of the skills required to undertake TT are still needed in the responding institutions. The skills most required by HEIs and SCs are skills relating to marketing their technologies. Responses from SCs indicate that administrative skills are also “much” or “critically” needed.
It is encouraging to see that TTFs acknowledge the need for marketing skills, given the need to actively market technologies to entrepreneurs and innovative companies, in a technology-push scenario, and, in so doing, progress commercialisation.
Figure 10: Percentage of institutions that indicated which specific skills were “much” or “critically” needed, as at 2014.
Percentage (%)
HEI SC
Legal (IP) 35.342.9
Legal (other) 17.642.9
Scientific/Technical
41.228.6
Marketing 47.157.1
Management 17.628.6
Administration 35.357.1
Commercial/Business
35.342.9
0.0 10.0 20.0 30.0 40.0 50.0 60.0
HEI n = 17SC n = 7These percentages were computed basedon the number of responses per skill dividedby the total number of respondents by institution type.
Data note

22SOUTH AFRICAN NATIONAL SURVEY OF INTELLECTUAL PROPERTY AND TECHNOLOGY TRANSFER AT PUBLICLY FUNDED RESEARCH INSTITUTIONS
Inaugural Baseline Study: 2008-2014
MAXHOSA – “MY HERITAGE, MY INHERITANCE”
DESIGN AND COPYRIGHT PROTECTED
Laduma Ngxokolo completed his BTech degree in 2010 with majors
in Textile Design and Technology at Nelson Mandela Metropolitan
University (NMMU). For his final year project he developed a high
quality, Xhosa-inspired knitwear range for amakrwala (Xhosa
initiates). His work interpreted traditional Xhosa beadwork into
knitwear designs using authentic Xhosa colours. Laduma’s
knitwear won the 2010 Society of Dyers and Colourists
Design Award, an annual international design competition
that takes place in London. In February 2011, Laduma was
one of six handpicked international post-graduates invited to
present at the 2011 Design Indaba Conference.
Even with these awards and accolades, Laduma struggled to get
his business started as he lacked space and funding, as well as access
to business expertise. He approached NMMU’s Innovation Office
for support. NMMU and Laduma agreed to work together to develop his business and protect the IP that he had
developed during his studies. The support provided included filing of design registrations on Laduma’s initial five
designs, funding for materials, funding for knitting machines, access to a network of suppliers, mentorship, and
space for manufacturing.
After two years, Laduma needed to expand and, with NMMU’s help, found a manufacturer in Cape Town. He set up
an online store and also has shelf space in high-end shops in Cape Town and Johannesburg under the brand name
“Maxhosa by Laduma”. NMMU continued to provide support to Laduma’s business, assisting with IP maintenance as
well as financial administration. In 2015, NMMU assigned the designs to Laduma’s business and exited its interests,
as the business was mature enough to continue without their support. Most recently, one of Laduma’s designs won
an award for “The most beautiful object in South Africa” at the 2016 Design Indaba.

23SOUTH AFRICAN NATIONAL SURVEY OF INTELLECTUAL PROPERTY AND TECHNOLOGY TRANSFER AT PUBLICLY FUNDED RESEARCH INSTITUTIONS
Inaugural Baseline Study: 2008-2014
2. THE TECHNOLOGY TRANSFER FUNCTION
2.1 Activities, systems and resources
This section describes the activities performed by the TTFs, including seed funding, incubation space managed, and support system(s) in use by the TTF.
Percentage of institutions that reported performing these activities (%)
Receiving disclosures 100.057.1
Marketing of technologies 70.657.1
Fundraising 82.442.9
Novelty searches 93.857.1
Negotiating license deals 82.457.1
Statutory compliance 100.085.7
Managing IP registration &maintenance process
100.071.4
Spinning out start-up companies 58.814.3
Administering/managing funding 94.128.6
Infringement monitoring 35.314.3
Market research/analysis 88.271.4
Mentoring & other supportof start-up companies
58.828.6
Conducting training/awareness workshops etc.
94.157.1
Infringement litigation 17.614.3
IP M
anag
emen
tC
omm
erci
alis
atio
n
TFF
Act
iviti
es
Adm
inEn
forc
emen
t
0 20 40 60 80 100
Figure 11: TTF activities, 2014
HEI n = 16 SC n = 7Data note
HEI SC
Definedtermsusedinthissectioninclude:
•DISCLOSURES•FORMALENGAGEMENT•HEI•INCUBATIONSPACE•INFORMAL
ENGAGEMENT•IP•IPEXPENDITURE•IPRACT•LEGALFEES
REIMBURSEMENT•LITIGATION
EXPENDITURE
•REGISTRABLEIP•SEED/GAPFUNDING•START-UPCOMPANIES•TECHNOLOGYOR
TECHNOLOGIES•TECHNOLOGY
TRANSFERFUNCTION(TTF)
•TTOPERATIONSEXPENDITURE
SeeSectionG.
24SOUTH AFRICAN NATIONAL SURVEY OF INTELLECTUAL PROPERTY AND TECHNOLOGY TRANSFER AT PUBLICLY FUNDED RESEARCH INSTITUTIONS
Inaugural Baseline Study: 2008-2014
Most institutions are performing a range of activities listed under IP management, commercialisation, and administration. However, enforcement is noticeably less active. This could be indicative of the limited capability and/orcapacityofindividualinstitutionstoperformenforcement related activities. Furthermore, it may be linked to the maturity of an institution’s IP portfolio, as infringement monitoring and litigation are not a priority until such time as there are enforceable IP rights (for exampleagranted/issuedpatent,whichprovidesalegal basis to sue for infringement, or to be sued).
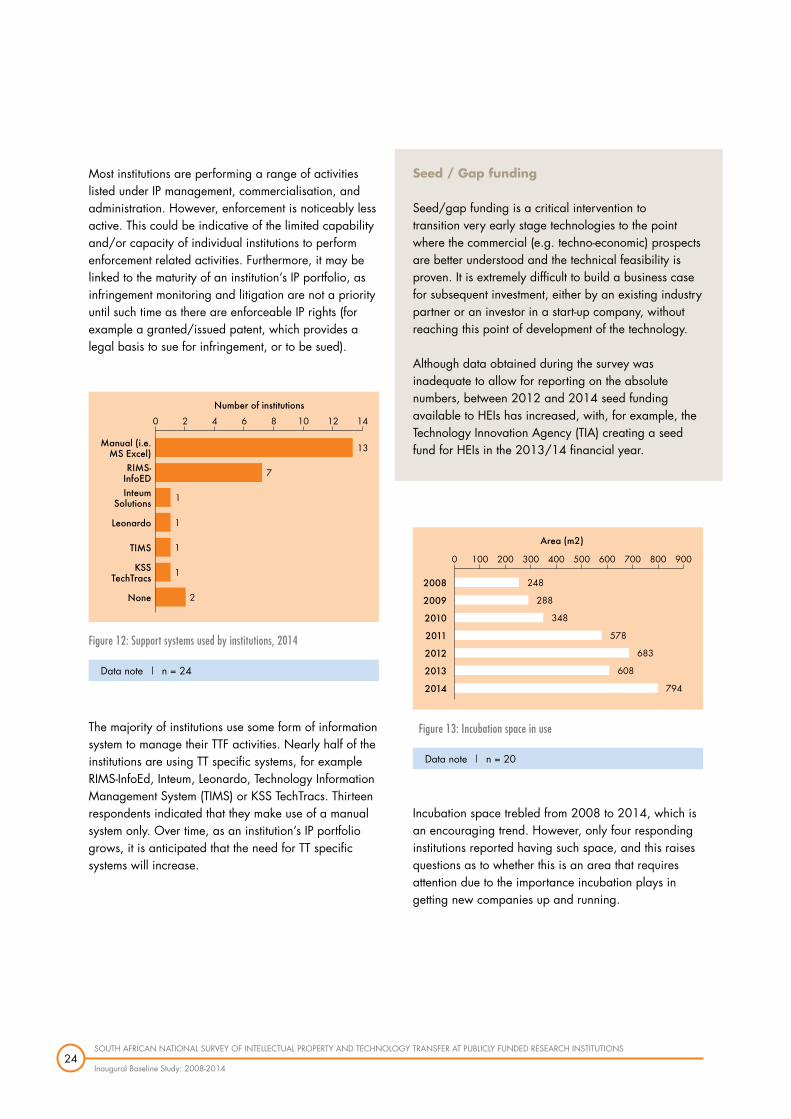
The majority of institutions use some form of information system to manage their TTF activities. Nearly half of the institutions are using TT specific systems, for example RIMS-InfoEd, Inteum, Leonardo, Technology Information Management System (TIMS) or KSS TechTracs. Thirteen respondents indicated that they make use of a manual system only. Over time, as an institution’s IP portfolio grows, it is anticipated that the need for TT specific systems will increase.
Seed / Gap funding
Seed/gapfundingisacriticalinterventionto transition very early stage technologies to the point where the commercial (e.g. techno-economic) prospects are better understood and the technical feasibility is proven. It is extremely difficult to build a business case for subsequent investment, either by an existing industry partner or an investor in a start-up company, without reaching this point of development of the technology.
Although data obtained during the survey was inadequate to allow for reporting on the absolute numbers, between 2012 and 2014 seed funding available to HEIs has increased, with, for example, the Technology Innovation Agency (TIA) creating a seed fundforHEIsinthe2013/14financialyear.
Incubation space trebled from 2008 to 2014, which is an encouraging trend. However, only four responding institutions reported having such space, and this raises questions as to whether this is an area that requires attention due to the importance incubation plays in getting new companies up and running.
Number of institutions
0 2 4 6 8 10 12 14
Manual (i.e.MS Excel) 13
Leonardo 1
RIMS-InfoED 7
TIMS 1
Inteum Solutions 1
KSS TechTracs 1
None 2
Figure 12: Support systems used by institutions, 2014
n = 24Data note
Figure 13: Incubation space in use
n = 20Data note
Area (m2)
0 100 200 300 400 500 600 700 800 900
2008 248
2009 288
2010 348
2011 578
2012 683
2013 608
2014 794

25SOUTH AFRICAN NATIONAL SURVEY OF INTELLECTUAL PROPERTY AND TECHNOLOGY TRANSFER AT PUBLICLY FUNDED RESEARCH INSTITUTIONS
Inaugural Baseline Study: 2008-2014
2.2 Factors that promote or inhibit the technology transfer function
This section reports on relevant factors in promoting or inhibiting the TTF, as well as their perceived importance or impact.
Figures 14 and 15 are instructive in identifying strengthsandweaknessesinpromoters/enablersofTTF.Allofthepromoters/enablersaredeemedvery important by the majority of respondents. It is encouraging to note that, for the majority of respondents, ‘DedicatedTTfundsfromgovernment/NIPMO’ and ‘Internal (Institutional) individual relationships’ are either fully present and functioning effectively or at least partially present and functioning. Incontrast,alloftheremainingpromoters/enablers,are either not present, or only partially present and partially functioning, for the large majority of institutions; this suggests that there are areas of weakness in institutions.
Figure 14: Perceived importance of promoters/enablers of the TTF, 2014
n = 24Data note
Number of respondents
Prom
oter
s of
TFF
0 5 10 15 20 25
Very important Moderately important Not important
Dedicated TT funds from Government/NIPMO
204
0
2400
231
0
157
2
211
2
175
2
184
2
2311
A national forum to showcase technologies
Internal (institutional) individual relationships
Marketing channels like web- sites, brochures, newsletters
Human Resourcescapacity
INFORMAL ENGAGEMENT with industry
A forum to discuss national technologial needs
FORMAL ENGAGEMENT with industry
Figure 15: Perceived presence and functioning of promoters/enablers, 2014
n = 24Data note
1210862
Number of respondents
Prom
oter
s of
TFF
0 4 14 16
Fully present and functioning effectively
Partially present and partially functioning
Not present
Dedicated TT funds from Government/NIPMO
910
5
1111
2
514
5
29
13
511
8
512
7
516
3
515
4
A national forum to showcase technologies
Internal (institutional) individual relationships
Marketing channels like web- sites, brochures, newsletters
Human Resourcescapacity
INFORMAL ENGAGEMENT with industry
A forum to discuss national technologial needs
FORMAL ENGAGEMENT with industry
26SOUTH AFRICAN NATIONAL SURVEY OF INTELLECTUAL PROPERTY AND TECHNOLOGY TRANSFER AT PUBLICLY FUNDED RESEARCH INSTITUTIONS
Inaugural Baseline Study: 2008-2014
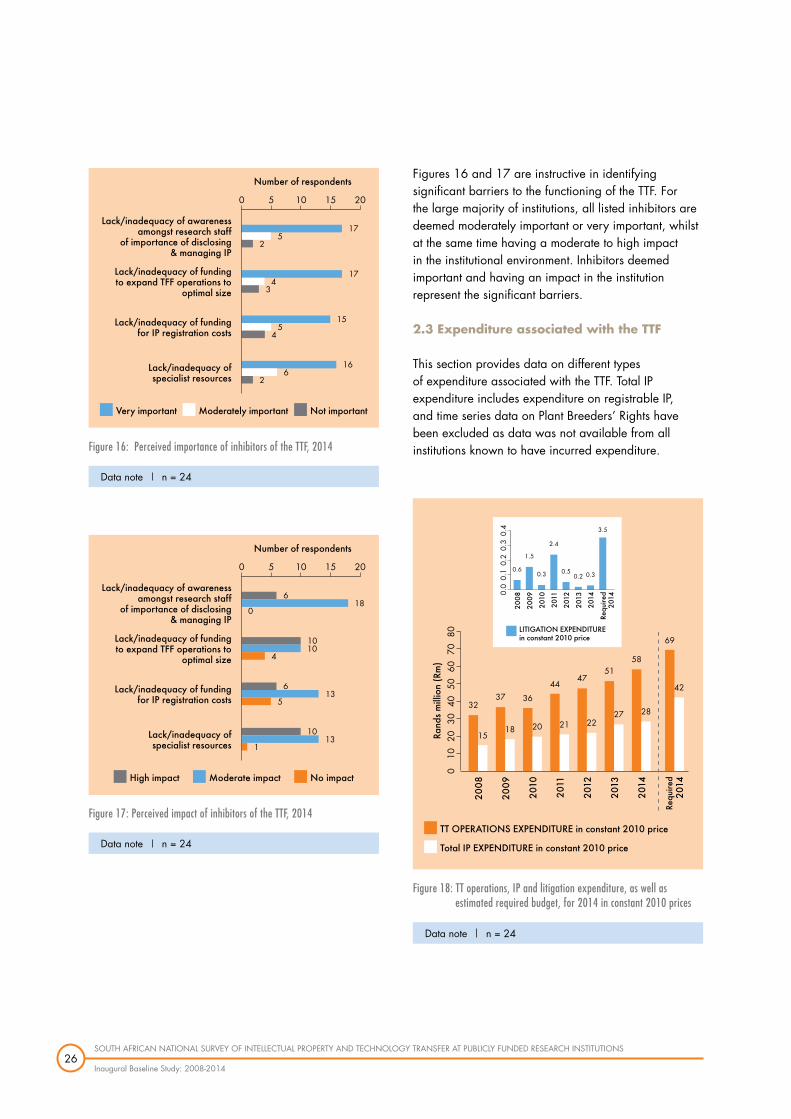
Figures 16 and 17 are instructive in identifying significant barriers to the functioning of the TTF. Forthe large majority of institutions, all listed inhibitors are deemed moderately important or very important, whilst at the same time having a moderate to high impact in the institutional environment. Inhibitors deemed important and having an impact in the institution represent the significant barriers.
2.3 Expenditure associated with the TTF
This section provides data on different types of expenditure associated with the TTF. Total IP expenditure includes expenditure on registrable IP,and time series data on Plant Breeders’ Rights have been excluded as data was not available from all institutions known to have incurred expenditure.
20155
Number of respondents
0 10
Lack/inadequacy of awareness amongst research staff
of importance of disclosing& managing IP
175
2
Lack/inadequacy of funding to expand TFF operations to
optimal size
174
3
Lack/inadequacy of fundingfor IP registration costs
155
4
Lack/inadequacy ofspecialist resources
166
2
Very important Moderately important Not important
Figure 16: Perceived importance of inhibitors of the TTF, 2014
Figure 17: Perceived impact of inhibitors of the TTF, 2014
n = 24Data note
n = 24Data note
20155
Number of respondents
0 10
Lack/inadequacy of awareness amongst research staff
of importance of disclosing& managing IP
618
0
Lack/inadequacy of funding to expand TFF operations to
optimal size
1010
4
Lack/inadequacy of fundingfor IP registration costs
613
5
Lack/inadequacy ofspecialist resources
1013
1
High impact Moderate impact No impact
n = 24Data note
Figure 18: TT operations, IP and litigation expenditure, as well as estimated required budget, for 2014 in constant 2010 prices
2008
0.6
2009
1.5
2010
0.3
2011
2.4
2012
0.520
130.2
2014
0.3
Requ
ired
2014
3.5
0.0
0.1
0.2
0.3
0.4
LITIGATION EXPENDITUREin constant 2010 price
Rand
s m
illio
n (R
m)
Requ
ired
2014
2008
32
15
2009
37
18
2010
36
20
2011
44
21
2012
47
22
2013
51
27
2014
58
28
69
42
010
2030
4050
6070
80
Total IP EXPENDITURE in constant 2010 price
TT OPERATIONS EXPENDITURE in constant 2010 price

27SOUTH AFRICAN NATIONAL SURVEY OF INTELLECTUAL PROPERTY AND TECHNOLOGY TRANSFER AT PUBLICLY FUNDED RESEARCH INSTITUTIONS
Inaugural Baseline Study: 2008-2014
Figure 18 represents TTF expenditure in Rands (millions) in constant 2010 prices. Both TT operations expenditure and IP expenditure show an increase over time. The IP expenditure almost doubled over the period; this growth is at least partly attributable to the financial support provided by the Innovation Fund’s Patent Support Fund, which was later replaced by the IP Fund established through the IPR Act and administered by NIPMO as from 2011. The increased growth in TT operations expenditure is supported by the OTT Support Fund provided by NIPMO for capacity development funding at a TTF, which amounted to R75 million across all qualifying institutions between 2011 and 2014. This capacity development funding includes all operational expenditure over a defined period (e.g. salaries, access to courses and expert consultants).
Litigation expenditure is low and fluctuates, with institutions indicating an additional funding need of approximately R3.5 million in constant 2010 prices, for 2014. However, the majority of institutions projected no need for litigation expenditure. While only three institutions indicated litigation expenditure in 2014, six indicated that they needed additional funds for litigation. This may relate to Figure 11, which indicates that enforcement is not active at most institutions. Additional factors which may influence the fluctuation in the figures include the ad hoc nature of litigation, and the fact that a single litigation case can be very expensive and can extend over multiple years. Thus,the high fluctuations are not unexpected.
Figure 18 also depicts the required funding for TT operations and IP expenditure, with respondents indicating a 19.0% and 50.0% additional funding required over existing expenditure levels, respectively. This is consistent with the findings presented in figures 16 and 17 where the most important inhibitor with overall moderate impact is funding required to expand TTFoperationstooptimalsize,andforIPregistration.
Since 2011 institutions are increasingly recovering IP expenditure directly from licensees, with a fourfold increase between 2013 and 2014. This could be attributed to institutional portfolios maturing.
LEGAL FEES REIMBURSEMENT in constant 2010 price
Rands million (Rm)
0.0 1.0 2.0 3.0 4.0 5.0 6.0 7.0 8.0
2008 0.2
2009 0.4
2010 0.5
2011 0.6
2012 1.7
2013 1.7
2014 6.8
Figure 19: Legal fees reimbursement in constant 2010 prices
n = 22 Missing data from early years in the case of some respondents, together with certain major contributors’ data not being supplied for any year could have impacted the data materially.
Data note

28SOUTH AFRICAN NATIONAL SURVEY OF INTELLECTUAL PROPERTY AND TECHNOLOGY TRANSFER AT PUBLICLY FUNDED RESEARCH INSTITUTIONS
Inaugural Baseline Study: 2008-2014
OMEGA CARO-E
PATENT AND TRADE MARK PROTECTED
The typical Western diet is rich in fat, sugar and salt while poor in
fish, fruit and vegetables, leading to deficiencies in nutrients, such
as omega-3 fatty acids and vitamin E. Omega-3 fatty acids are
found in cold water fatty fish, such as pilchards, mackerel
and herring. These are essential for good health, brain
function and normal growth and development. Since they
are not produced by the human body, omega-3 fatty acids
need to be obtained through the diet. Fruit and vegetables
contain carotenes (colour pigments in fruit and vegetables)
and vitamin E, which are also vital for health. Deficiencies
in these nutrients can be addressed by taking supplements in
order to prevent large-scale deficiency diseases. Symptoms of
omega-3 fatty acid deficiency include low energy levels (fatigue),
poor memory, depression and heart problems.
Unfortunately, many of the omega-3 supplements on the market are highly oxidised
and do not contain the amount of omega-3 stated on the labels. In response to this, Spinnler Benadè and Maretha
Opperman of the Cape Peninsula University of Technology (CPUT) developed and patented a health supplement
called Omega Caro-E. This supplement is a unique combination of high quality omega-3 oils, 11 different carotenes
and five different forms of vitamin E. Omega Caro-E contains no artificial colourants or preservatives and adheres to
all international recommendations regarding pesticide and heavy metal contents. Health Canada recently approved
the product licence authorising the sale of Omega Caro-E in Canada.
CPUThassubsequentlyformulatedOmegaCaro-EKidz,whichisanemulsionforpre-schoolchildrenwhoarenot
able to swallow capsules, as well as NUTRI Caro-E which is a nutritional supplement premix that can be added in
various applications, such as fortified biscuits, porridge and peanut butter.
29SOUTH AFRICAN NATIONAL SURVEY OF INTELLECTUAL PROPERTY AND TECHNOLOGY TRANSFER AT PUBLICLY FUNDED RESEARCH INSTITUTIONS
Inaugural Baseline Study: 2008-2014
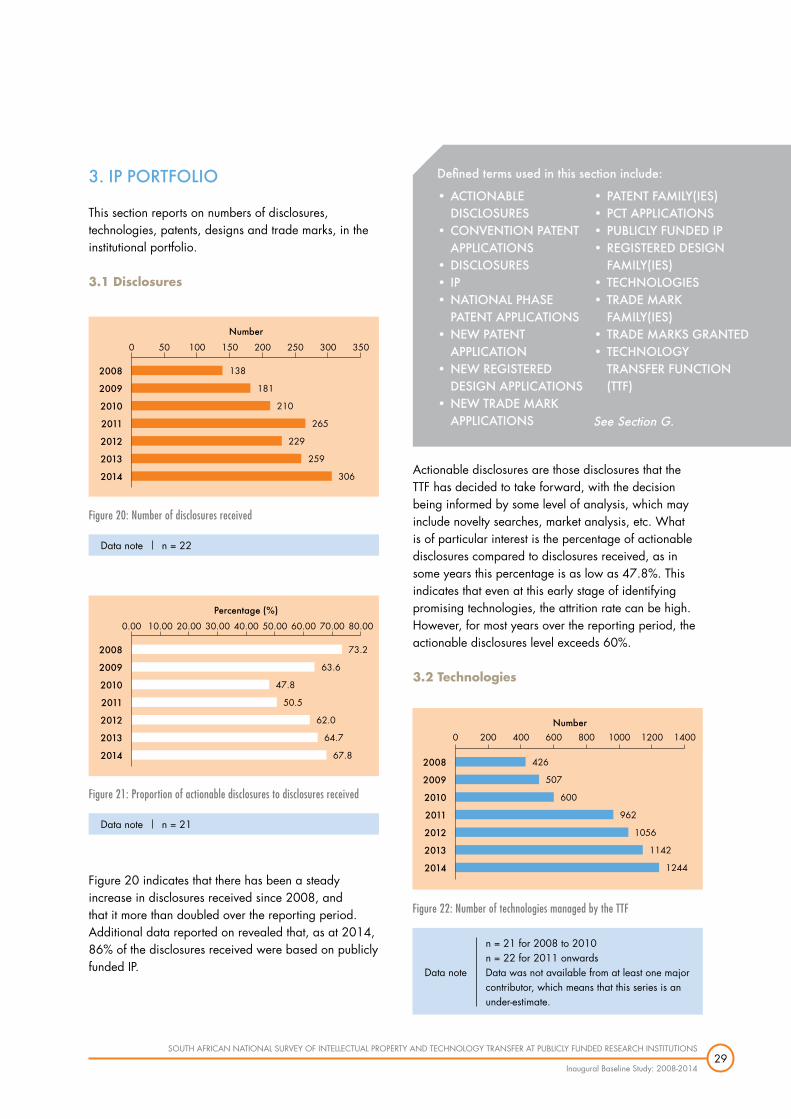
3. IP PORTFOLIO
This section reports on numbers of disclosures, technologies, patents, designs and trade marks, in the institutional portfolio.
3.1 Disclosures
Figure 20 indicates that there has been a steady increase in disclosures received since 2008, and that it more than doubled over the reporting period. Additional data reported on revealed that, as at 2014, 86% of the disclosures received were based on publicly funded IP.
Actionable disclosures are those disclosures that the TTF has decided to take forward, with the decision being informed by some level of analysis, which may include novelty searches, market analysis, etc. What is of particular interest is the percentage of actionable disclosures compared to disclosures received, as in some years this percentage is as low as 47.8%. This indicates that even at this early stage of identifying promising technologies, the attrition rate can be high. However, for most years over the reporting period, the actionable disclosures level exceeds 60%.
3.2 Technologies
Figure 20: Number of disclosures received
n = 22Data note
Number
0 50 100 150 200 250 300 350
2008 138
2009 181
2010 210
2011 265
2012 229
2013 259
2014 306
Figure 21: Proportion of actionable disclosures to disclosures received
n = 21Data note
Percentage (%)
0.00 10.00 20.00 30.00 40.00 50.00 70.0060.00 80.00
2008 73.2
2009 63.6
2010 47.8
2011 50.5
2012 62.0
2013 64.7
2014 67.8
Figure 22: Number of technologies managed by the TTF
n = 21 for 2008 to 2010n = 22 for 2011 onwardsData was not available from at least one major contributor, which means that this series is an under-estimate.
Data note
Number0 200 400 600 800 1000 1200 1400
2008 426
2009 507
2010 600
2011 962
2012 1056
2013 1142
2014 1244
Definedtermsusedinthissectioninclude:
•ACTIONABLEDISCLOSURES
•CONVENTIONPATENTAPPLICATIONS
•DISCLOSURES•IP•NATIONALPHASE
PATENTAPPLICATIONS•NEWPATENT
APPLICATION•NEWREGISTERED
DESIGNAPPLICATIONS•NEWTRADEMARK
APPLICATIONS
•PATENTFAMILY(IES)•PCTAPPLICATIONS•PUBLICLYFUNDEDIP•REGISTEREDDESIGN
FAMILY(IES)•TECHNOLOGIES•TRADEMARK
FAMILY(IES)•TRADEMARKSGRANTED•TECHNOLOGY
TRANSFERFUNCTION(TTF)
SeeSectionG.

30SOUTH AFRICAN NATIONAL SURVEY OF INTELLECTUAL PROPERTY AND TECHNOLOGY TRANSFER AT PUBLICLY FUNDED RESEARCH INSTITUTIONS
Inaugural Baseline Study: 2008-2014
The number of technologies managed each year increased between 2008 and 2014. Just as not every disclosure leads to an actionable disclosure, not every actionable disclosure leads to a technology being accepted into the portfolio managed by the TTF. In some instances, multiple disclosures are combined into one technology package. In addition, technologies are abandoned each year on the basis of weak commercial prospects or other considerations, and these could be technologies that have been in the portfolio for just one year or for many years. Therefore, caution should be exercised in attempting a direct correlation between disclosure rates and technologies under management. However, it is apparent that the high growth rate in disclosures received over the period has led to a ramping up of technologies managed, which is a positive trend.
3.3 Patents
The typical patent registration process starts with the filing of a new patent application, followed 12 months later by a convention patent application (which includes a Patent Cooperation Treaty (PCT) application and a South African complete application). At a defined point in time after a PCT application has been filed, a national phase application is filed in each country and/orregionwhereaninstitutionwishestopursuepatent protection. It should be noted that for each PCT application filed there may be anything between 1 and 148 such countries (as at 1 April 2016) in which subsequent national phase applications may be filed. The absolute number of convention patent applications
has remained somewhat constant despite the growth in the total number of new patent applications filed. There are a number of factors that could have influenced this, including a substantial increase in filing costs between the new and convention patent application stages.
The somewhat erratic trend of national phase patent applications is due to the plethora of factors that inform the decision as to which countries patent protection will be pursued in. Factors that impact this decision include possible markets, manufacturing locations, requirements ofthelicensees/assignees,negativesearchreportresults, strength of patent, etc. Bearing this in mind, caution must be exercised in correlating the number of national phase patent applications with the number of newand/orconventionpatentapplicationsfiled.
Figure 23: Number of new patent applications
n = 22Data note
Number0 50 100 150 200 250
2008 103
2009 146
2010 143
2011 169
2012 205
2013 209
2014 216
Figure 24: Number of new convention patent applications
n = 22Data note
Number0 20 40 60 80 100 120
2008 59
2009 91
2010 90
2011 111
2012 78
2013 83
2014 77
Figure 25: Number of new national phase patent applications
n = 20Data note
Number0 50 100 150 200 250
2008 118
2009 112
2010 117
2011 199
2012 186
2013 104
2014 238

31SOUTH AFRICAN NATIONAL SURVEY OF INTELLECTUAL PROPERTY AND TECHNOLOGY TRANSFER AT PUBLICLY FUNDED RESEARCH INSTITUTIONS
Inaugural Baseline Study: 2008-2014
In South Africa a higher percentage of disclosures received by the TTF are converted into new patent applications than is the case in the USA. This could be a reflection of a propensity for seeking patent protection – a step that is encouraged by the IPR Act. However, there could also be other factors at play,such as South African new patent applications being relatively inexpensive to file, or an inability to adequately analyse the merits of a disclosure prior to filing a new patent application.
A patent family is a suite of corresponding patents and/orpatentapplicationsrelatingtoaparticulartechnology, that stems from one new patent application that may be issued in one or more countries. The number of patent families managed by institutions almost doubled over the period.
74.660.6
80.759.4
68.157.8
63.860.7
89.559.8
80.762.3
70.657.7
Percentage (%)0 2010 4030 6050 8070 10090
2008
2009
2010
2011
2012
2013
2014
South Africa USA
AUTM survey dataset up to 2014.Data note
Figure 26: Comparison of number of new patent applications filed per disclosure received for South Africa and USA
Number0 100 200 300 400 500 600 700
2008 348
2009 403
2010 448
2011 501
2012 557
2013 580
2014 629
Figure 27: Patent families managed by the TTF
n = 22Data note
32SOUTH AFRICAN NATIONAL SURVEY OF INTELLECTUAL PROPERTY AND TECHNOLOGY TRANSFER AT PUBLICLY FUNDED RESEARCH INSTITUTIONS
Inaugural Baseline Study: 2008-2014
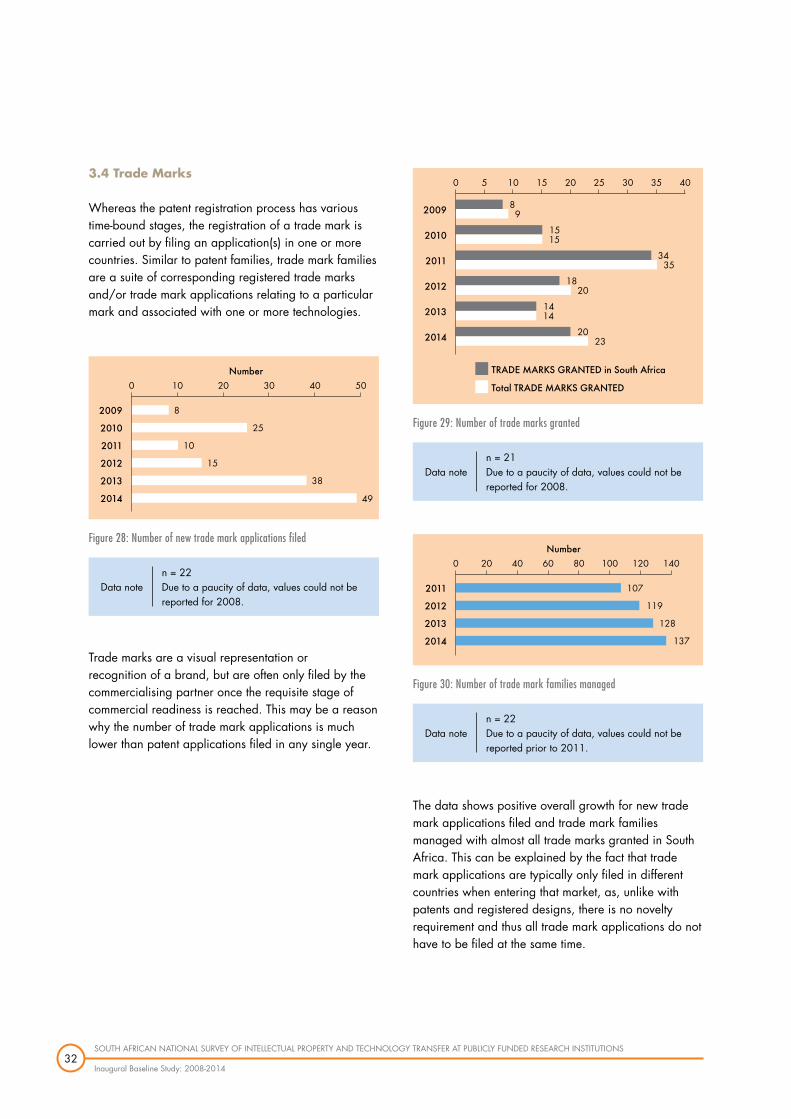
3.4 Trade Marks
Whereas the patent registration process has various time-bound stages, the registration of a trade mark is carried out by filing an application(s) in one or more countries. Similar to patent families, trade mark families are a suite of corresponding registered trade marks and/ortrademarkapplicationsrelatingtoaparticularmark and associated with one or more technologies.
Trade marks are a visual representation or recognition of a brand, but are often only filed by the commercialising partner once the requisite stage of commercial readiness is reached. This may be a reason why the number of trade mark applications is much lower than patent applications filed in any single year.
The data shows positive overall growth for new trade mark applications filed and trade mark families managed with almost all trade marks granted in South Africa. This can be explained by the fact that trade mark applications are typically only filed in different countries when entering that market, as, unlike with patents and registered designs, there is no novelty requirement and thus all trade mark applications do not have to be filed at the same time.
Figure 28: Number of new trade mark applications filed
2009 8
2010 25
2011 10
2012 15
2013 38
2014 49
Number0 10 20 30 40 50
n = 22Due to a paucity of data, values could not be reported for 2008.
Data note
Figure 29: Number of trade marks granted
n = 21Due to a paucity of data, values could not be reported for 2008.
Data note
89
1515
3435
1820
1414
2023
0 105 2015 3025 35 40
2009
2010
2011
2012
2013
2014
TRADE MARKS GRANTED in South Africa
Total TRADE MARKS GRANTED
Figure 30: Number of trade mark families managed
n = 22Due to a paucity of data, values could not be reported prior to 2011.
Data note
Number0 20 40 60 80 100 120 140
2011 107
2012 119
2013 128
2014 137

33SOUTH AFRICAN NATIONAL SURVEY OF INTELLECTUAL PROPERTY AND TECHNOLOGY TRANSFER AT PUBLICLY FUNDED RESEARCH INSTITUTIONS
Inaugural Baseline Study: 2008-2014
3.5 Designs
The design registration process does not have the same number of stages as the patent registration process but requires that a design application be filed in all elected countries within a certain period. Similar to patent and trade mark families, registered design families areasuiteofcorrespondingregistereddesignsand/or design applications that relate to a particular design and which are associated with a technology.
Figure 31 shows slight growth in registered design families managed, however, the number of new registered design applications filed was constant from 2011 to 2014. Registered design applications have limited scope of protection in protecting the aesthetic and, to some extent, the functional design of an article.
3.6 IP related activities per billion Rand of institutional research expenditure
Figure 32 shows the number of disclosures received, new patent applications, new trade mark applications filed, and new registered design applications between 2008 and 2013 per billion Rand of institutional expenditure in constant 2010 prices.
Most indicators have increased over the period, with the increase in IP related activities being greater than that of research expenditure, which indicates growth in terms of these activities relative to research expenditure.
Figure 31: Registered designs
n = 22Due to a paucity of data, values could not be reported prior to 2011.
Data note
937
538
640
1046
0 105 2015 353025 4540 50
2011
2012
2013
2014
NEW REGISTERED DESIGN APPLICATIONS filed
REGISTERED DESIGN FAMILIES managed
Number of Designs
Figure 32: IP related activities per Billion Rand of institutional research expenditure in constant 2010 prices
n = 21*Plant Breeders’ Rights data was not included due to insufficient data.
Data note
4035
2008 2009 2010 2011 2012 2013
3025
15
5
20
10
0
Num
ber
per
Billi
on (
Rb)
DISCLOSURES received
NEW TRADE MARK APPLICATIONS filedNEW PATENT APPLICATIONS
NEW REGISTERED DESIGN APPLICATIONS filed
3
15
20 20
25
19
29
22
35
28
31
28
34
13 1
1.22
0.7 0.8
5
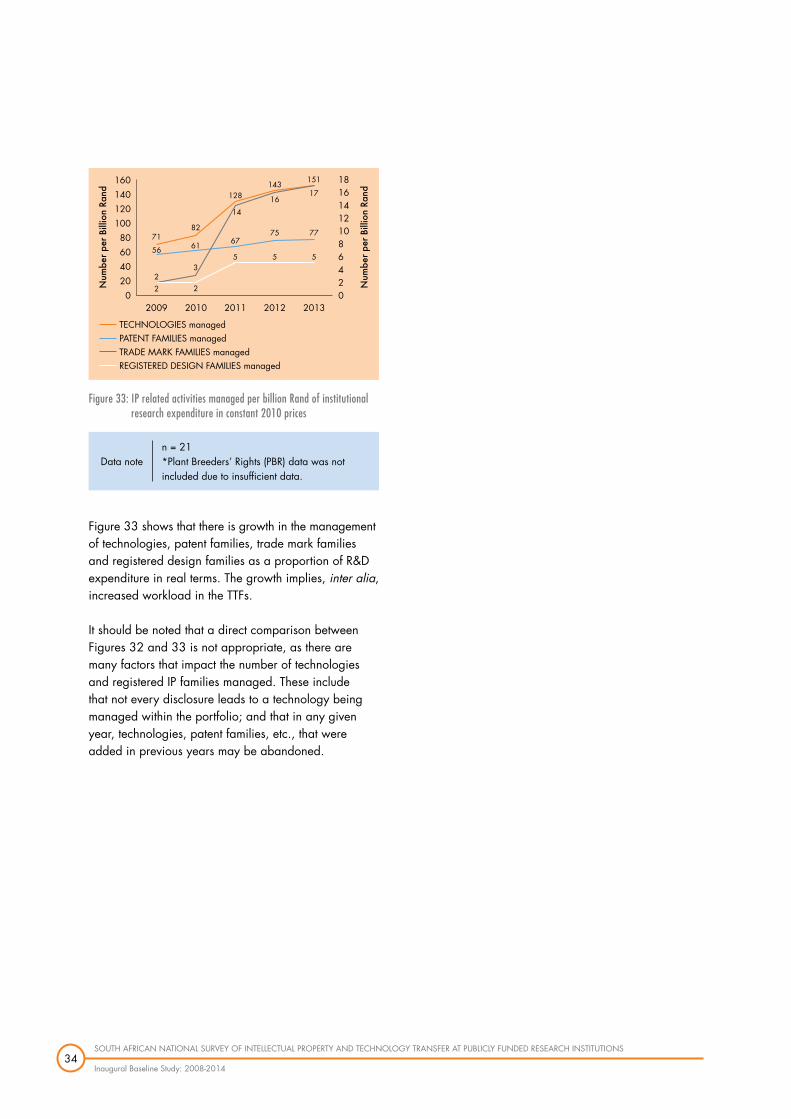
34SOUTH AFRICAN NATIONAL SURVEY OF INTELLECTUAL PROPERTY AND TECHNOLOGY TRANSFER AT PUBLICLY FUNDED RESEARCH INSTITUTIONS
Inaugural Baseline Study: 2008-2014
Figure 33 shows that there is growth in the management of technologies, patent families, trade mark families and registered design families as a proportion of R&D expenditure in real terms. The growth implies, inter alia, increased workload in the TTFs.
It should be noted that a direct comparison between Figures 32 and 33 is not appropriate, as there are many factors that impact the number of technologies and registered IP families managed. These include that not every disclosure leads to a technology being managed within the portfolio; and that in any given year, technologies, patent families, etc., that were added in previous years may be abandoned.
Figure 33: IP related activities managed per billion Rand of institutional research expenditure in constant 2010 prices
n = 21*Plant Breeders’ Rights (PBR) data was not included due to insufficient data.
Data note
160140
2009 2010 2011 2012 2013
120100
60
20
80
40
0 02468101214
1816
Num
ber
per
Billi
on R
and
Num
ber
per
Billi
on R
and
TECHNOLOGIES managed
TRADE MARK FAMILIES managedPATENT FAMILIES managed
REGISTERED DESIGN FAMILIES managed
2
56
7161
82
6775 77
3
14
128 16
14317
151
5 5 5
22
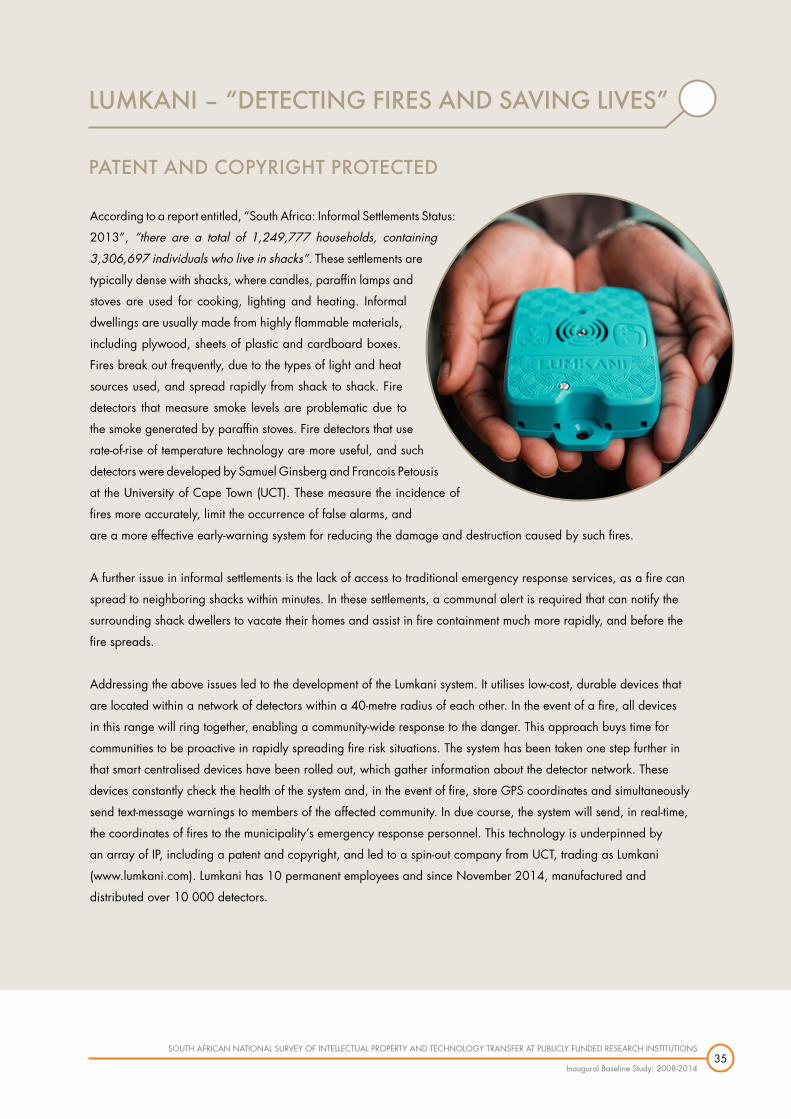
35SOUTH AFRICAN NATIONAL SURVEY OF INTELLECTUAL PROPERTY AND TECHNOLOGY TRANSFER AT PUBLICLY FUNDED RESEARCH INSTITUTIONS
Inaugural Baseline Study: 2008-2014
LUMKANI – “DETECTING FIRES AND SAVING LIVES”
PATENT AND COPYRIGHT PROTECTED
According to a report entitled, “South Africa: Informal Settlements Status:
2013”, “there are a total of 1,249,777 households, containing
3,306,697 individuals who live in shacks”. These settlements are
typically dense with shacks, where candles, paraffin lamps and
stoves are used for cooking, lighting and heating. Informal
dwellings are usually made from highly flammable materials,
including plywood, sheets of plastic and cardboard boxes.
Fires break out frequently, due to the types of light and heat
sources used, and spread rapidly from shack to shack. Fire
detectors that measure smoke levels are problematic due to
the smoke generated by paraffin stoves. Fire detectors that use
rate-of-rise of temperature technology are more useful, and such
detectors were developed by Samuel Ginsberg and Francois Petousis
at the University of Cape Town (UCT). These measure the incidence of
fires more accurately, limit the occurrence of false alarms, and
are a more effective early-warning system for reducing the damage and destruction caused by such fires.
A further issue in informal settlements is the lack of access to traditional emergency response services, as a fire can
spread to neighboring shacks within minutes. In these settlements, a communal alert is required that can notify the
surrounding shack dwellers to vacate their homes and assist in fire containment much more rapidly, and before the
fire spreads.
Addressing the above issues led to the development of the Lumkani system. It utilises low-cost, durable devices that
are located within a network of detectors within a 40-metre radius of each other. In the event of a fire, all devices
in this range will ring together, enabling a community-wide response to the danger. This approach buys time for
communities to be proactive in rapidly spreading fire risk situations. The system has been taken one step further in
that smart centralised devices have been rolled out, which gather information about the detector network. These
devices constantly check the health of the system and, in the event of fire, store GPS coordinates and simultaneously
send text-message warnings to members of the affected community. In due course, the system will send, in real-time,
the coordinates of fires to the municipality’s emergency response personnel. This technology is underpinned by
an array of IP, including a patent and copyright, and led to a spin-out company from UCT, trading as Lumkani
(www.lumkani.com). Lumkani has 10 permanent employees and since November 2014, manufactured and
distributed over 10 000 detectors.

36SOUTH AFRICAN NATIONAL SURVEY OF INTELLECTUAL PROPERTY AND TECHNOLOGY TRANSFER AT PUBLICLY FUNDED RESEARCH INSTITUTIONS
Inaugural Baseline Study: 2008-2014
4. IP TRANSACTIONS AND REVENUE
IP transactions are agreements concluded with third parties – typically commercialisation partners - that confer certain rights or transfer ownership of those rights. These rights are conferred as either options (i.e. the partner is afforded a preferential option to negotiatefurtherrightsand/ortransferofownership)or licences (i.e. where the partner is granted rights to use a technology for one or more particular purposes in one or more countries). Ownership transfer is effected by means of an assignment.
This section reports on IP transactions and revenue accruing to the institution as a result of these transactions.
4.1 IP transactions
Figure 34 shows an increase in the absolute number of licences executed, with a significantly higher number observed in 2013 attributed to a higher licensing activity by one institution in that year. The overall positive growth in the number of licences executed is encouraging, however, it should be noted that many factors may impact the execution of a licence agreement. These factors include the nature of the
technology and its stage of development, as well as negotiations with a third party which may affect the lead time to executing a licence.
Exclusive licences are those that effectively provide rights to use a technology to a single commercial partner, whereas non-exclusive licences allow for the possibility of concluding licences, in respect of the same technology, with more than one commercial partner. Figure 35 indicates that there was substantial growth in exclusive licences in 2011. Furthermore, there is marked growth in respect of non-exclusive licences over
Figure 34: Number of licences executed in a particular year
n = 22Data was unavailable from one major contributor, which means that this series is under-estimated.
Data note
Number0 5 10 15 20 3025 35 40
2008 7
2009 10
2010 10
2011 26
2012 26
2013 37
2014 28
Total number of LICENCES executed
Figure 35: Exclusive vs non-exclusive licences executed per year
n = 23Data was not available from one major contributor, which means that this series is under-estimated.
Data note
6
2
4
5
75
216
179
2116
1412
0 105 2015 25
2009
2008
2010
2011
2012
2013
2014
Total number of LICENCES executed (EXCLUSIVE)
Total number of LICENCES executed (NON-EXCLUSIVE)
Definedtermsusedinthissectioninclude:
SeeSectionG.
•EXCLUSIVE•IPCREATORS•IPEXPENDITURE•IPTRANSACTION•IPTRANSACTION
REVENUE
•IPRACT•LICENCES•NON-EXCLUSIVE•REVENUE•TTOPERATIONS
EXPENDITURE

37SOUTH AFRICAN NATIONAL SURVEY OF INTELLECTUAL PROPERTY AND TECHNOLOGY TRANSFER AT PUBLICLY FUNDED RESEARCH INSTITUTIONS
Inaugural Baseline Study: 2008-2014
the period. However, it should be noted that only half the respondents reported having executed licences over the period. The IPR Act (effective from 2010) provides for a preference in non-exclusive licensing. However, bearing in mind that licences concluded since 2010 may have been in relation to technologies created several years before, it is too early to conclude what influence the policy change has had.
4.2 IP transaction revenue
Fluctuations in revenue over the period are dependent on a range of factors, including major milestone payments, the termination of licences, among other factors, and as such are not surprising. What is most notable, however, is that out of 22 respondents, the same four respondents account for 88% or more of the total IP transaction revenue each year. This is likely due to the maturity of the TT system, given that only a small number of institutions have been active in TT since the early 2000s, combined with the fact that it may take many years for a concluded IP transaction to yield revenues, if any, as the lead time can be significant to fully develop and successfully commercialise a product or service based on the institution’s technology.
When comparing the actual current TT operations and IP expenditure (R109 million in 2014) with the actual revenues earned (R35.6 million in 2014), it is apparent that it will likely take many years before the revenue –
after benefit sharing with IP creators and the institution – can cover all costs of the TTF, if at all. However, the full economic impact of TT is much broader than the direct and immediate revenues that accrue to institutions.
Rands Million (Rm)0 5 10 15 2520 3530 4540 50
2008 27.6
2009 48.9
2010 26.1
2011 23.0
2012 23.2
2013 45.4
2014 35.6
Figure 36: Total IP transaction revenue
n = 22Data note
Figure 37: Number of IP transactions yielding revenue in five revenue brackets
n = 20
The Rand equivalent of US$1m was obtained from purchasing power parity (PPP) estimates for South Africa from the Organisation for Economic Cooperation and Development (OECD)website(http://data.oecd.org/conversion/purchasing-power-parities-ppp.htm,accessed2015/02/19).SeeTable3.
Data was not available from at least one major contributor, which means that this series is an under-estimate.
Data note
1210862
Number of IP transactions
0 4 14 1816
Less than R100 000 R100 000 - R500 000
R1.5m - US$1mR500 000 - R1.5m
Greater than US$1m
13
20084
03
0
20092
12
02
0
20101
10
21
0
20111
14
02
1
20128
15
01
0
20134
17
04
0
201411
18
24
0

38SOUTH AFRICAN NATIONAL SURVEY OF INTELLECTUAL PROPERTY AND TECHNOLOGY TRANSFER AT PUBLICLY FUNDED RESEARCH INSTITUTIONS
Inaugural Baseline Study: 2008-2014
The revenue from IP transactions is predominantly less than R100 000 per year for a particular transaction and, in 2014, only two transactions yielded more than R1.5 million in revenue. This resonates with the findings of the AUTM 2014 survey, where more than half of the respondents reported less than US$4m in revenue per year, whilst only 5% of institutions reported US$70m or more.Therefore, one can expect that only a limited number of technologies will be so-called “big hits” and provide a more substantial return on investment in the form of revenue accruing to the institution from commercialisation. Instead, most technologies, if commercialised, bring in a small stream of revenue to the institution. This revenue has to be divided amongst the IP creators, the institution, the IP costs, as well as the cost of the TTF.
Additional data reveals that an average of R1.3 million per year was paid out to IP creators over the period measured (2008 to 2014). With the enactment of the IPR Act, which places an obligation on every institution to have a minimum benefit sharing policy in place, it is anticipated that this will increase over time.

39SOUTH AFRICAN NATIONAL SURVEY OF INTELLECTUAL PROPERTY AND TECHNOLOGY TRANSFER AT PUBLICLY FUNDED RESEARCH INSTITUTIONS
Inaugural Baseline Study: 2008-2014
MABU CASING
PATENT PROTECTED
Sugar cane bagasse is the remains after sugar cane is crushed to extract
the juice before processing the juice to make sugar. In seeking ways
to productively utilise the bagasse, the fibres are used in a paper-
making process, with the bagasse pith as waste substrate. The
pith was used to develop casing soil for mushroom production
that is a suitable replacement for imported peat soil. The
South African Mushroom Farmers Association (SAMFA)
and the Technology and Human Resources for Industry
Programme (THRIP) funded the initial research project at the
University of Pretoria (UP). The technology was licensed to a
start-up company, Mabu Casing Soils (Pty) Ltd, which currently
manufactures the soil on a commercial scale.
One of the inventors, Linda Meyer, left her academic job at UP to
help establish and run the company on a full-time basis. Mabu Casing
Soils acquired a processing site near Bapsfontein in Gauteng. The company currently employs 36 people and has
been in full production since August 2014.
UP filed patents on this technology in several countries where either mushrooms are produced, sugarcane bagasse is
available,and/orpeatisscarceorimported.
The Technology Innovation Agency provided technology development funding to Mabu Casing Soils, to enable it to
bridge the gap between research and commercialisation. The company was runner up in the Gauteng Accelerator
Programme (GAP) Biosciences award in 2013, which yielded additional funding to support the company in its
formative stages. Mabu Casing Soils was also a SA Innovation Awards 2015 finalist. The Industrial Development
Corporation currently funds its commercial development.
Mabu Casing Soils supplies local and Namibian mushroom producers, and is expanding into the nursery and
horticultural industry with specialised growing and propagation substrates.
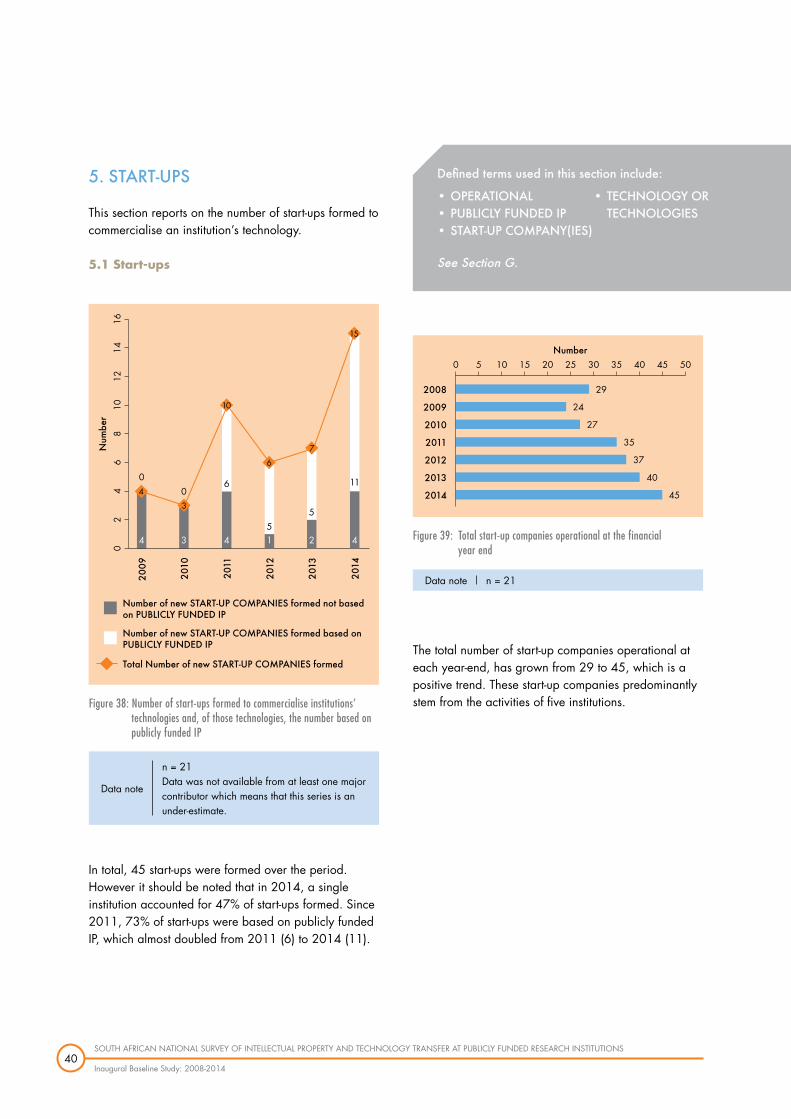
40SOUTH AFRICAN NATIONAL SURVEY OF INTELLECTUAL PROPERTY AND TECHNOLOGY TRANSFER AT PUBLICLY FUNDED RESEARCH INSTITUTIONS
Inaugural Baseline Study: 2008-2014
5. START-UPS
This section reports on the number of start-ups formed to commercialise an institution’s technology.
5.1 Start-ups
In total, 45 start-ups were formed over the period. However it should be noted that in 2014, a single institution accounted for 47% of start-ups formed. Since 2011, 73% of start-ups were based on publicly funded IP, which almost doubled from 2011 (6) to 2014 (11).
The total number of start-up companies operational at each year-end, has grown from 29 to 45, which is a positive trend. These start-up companies predominantly stem from the activities of five institutions.
Num
ber
02
46
812
1014
16
2010
3
03
2011
6
4
10
2012
51
6
2013
5
2
7
2014
11
4
15
2009
0
4
4
Number of new START-UP COMPANIES formed not based on PUBLICLY FUNDED IP
Number of new START-UP COMPANIES formed based on PUBLICLY FUNDED IP
Total Number of new START-UP COMPANIES formed
Figure 38: Number of start-ups formed to commercialise institutions’ technologies and, of those technologies, the number based on publicly funded IP
n = 21Data was not available from at least one major contributor which means that this series is an under-estimate.
Data note
Figure 39: Total start-up companies operational at the financial year end
n = 21Data note
Number0 5 10 15 2520 3530 4540 50
2008 29
2009 24
2010 27
2011 35
2012 37
2013 40
2014 45
Definedtermsusedinthissectioninclude:
SeeSectionG.
•OPERATIONAL•PUBLICLYFUNDEDIP•START-UPCOMPANY(IES)
•TECHNOLOGYORTECHNOLOGIES
41SOUTH AFRICAN NATIONAL SURVEY OF INTELLECTUAL PROPERTY AND TECHNOLOGY TRANSFER AT PUBLICLY FUNDED RESEARCH INSTITUTIONS
Inaugural Baseline Study: 2008-2014
CONCLUSIONS
The results of this inaugural baseline study has provided meaningful data on a wide range of indicators, enabling the tracking of IP and TT activities, outputs and outcomes over time, from when the TT system was nascent, into the future when impact is measurable.
Conducting the survey allowed for significant learning, both in terms of the process to develop a suitable questionnaire, conduct the study and deliver this report, but also, and perhaps more importantly, in terms of the paucity of results reported. The issue of data paucity requires some consideration. It is clear from the response rates that there is a lack of data, especially in terms of commercialisation activities. This is largely due to the quality and maturity of the technology portfolio, in terms of the number of technologies that are commercialisable, and those that are ready for commercialisation, for which a key determinant is the capacity and capability of the TTFs. The capacity of TTFs to identify, protect and translate technologies to successful commercialisation outcomes is a direct contributor to the quality and maturity of the portfolio. Thus, it is the capacity in the TT system, rather than the ability of institutions to record and report data, which has resulted in a paucity of results. All institutions are at varying stages of building capability and capacity. More than half of the individuals at the responding TTFs have less than five years’ experience in TT. Yet these individuals undertake a complex set of tasks that ideally require a blend of: technical background in science and engineering; an understanding of the stages of R&D of technologies; an understanding of the value and suitability of different forms of IP protection; the ability to design IP protection strategies to enable commercialisation; the ability to market and develop commercial relationships with local and international partners; and the ability to negotiate complex transactions, whilst meeting all statutory requirements of the IPR Act. In the context of this complex skillset required by TTFs for optimal
functioning, the following actions are critical to nurture the growing sector: capacity development programmes; mechanisms to attract, develop and retain highly skilled staff; support for start-up company incubation and seed funding; as well as harmonised systems to record and report data. This growth will consequently increase the impact that can be realised from TT where new products and services are introduced, export revenues are generated, jobs are created and the lives of South Africans are improved. Given that the financial returns to institutions do not necessarily cover the cost of TT, these mechanisms must, out of necessity, be a partnershipbetweeninstitutionsandgovernment/publicsector actors. It is hoped that the results reported here will serve as a meaningful dataset on the TT activities of institutions, and inform robust debate on the goals of the TT sector as a whole in achieving the aims of policy makers and institutions. Individual institutions can utilise the results to benchmark their own activities against the sector as a whole. Furthermore, the stories provided give some insight into the human impact created through TT,indevelopingtechnologiestosupportcitizensandgrowing entrepreneurs.
It is acknowledged that further analysis must be conducted to extend the value of this report in terms of developing more in-depth understanding of individual institutions and benchmarking of aggregated findings with other countries where TT systems are at different stages of development; in so doing it will be possible to identify specific areas that may require intervention. This, however, should not detract from the value that the baseline indicators provide. Subsequent surveys will help deepen the analysis and assist the TT sector as a whole in tracking progress towards meaningful impact on the South African economy and society.
D

42SOUTH AFRICAN NATIONAL SURVEY OF INTELLECTUAL PROPERTY AND TECHNOLOGY TRANSFER AT PUBLICLY FUNDED RESEARCH INSTITUTIONS
Inaugural Baseline Study: 2008-2014
METHODOLOGY
The Intellectual Property and Technology Transfer (IP & TT) project is a baseline survey project which commencedin2013/14,withfieldworkstartingin April 2015 and ending in November 2015. It collected seven years of data spanning the period between 2008 and 2014. The focus of the project was on establishing a statistical baseline of OTTs, their capacity and activities at public research institutions, and the nature of the output that can be delivered. The survey will provide the South African Government and its stakeholders with information regarding the implementation and impact of the IPR Act.
Survey design and planning
The scope of the survey covered 33 institutions, comprising 23 HEIs and 10 Schedule 1 institutions (as appended to the IPR Act and collectively referred to as SCs). The survey questionnaire obtained data on inputs, activities, output and outcomes. The inputs included human capability (capacity, skills, experience and qualifications), R&D expenditure, TT office operations expenditure, litigation expenditure, seed funding of projects overseen by offices of TT, as well as the organisational structure of TT functions. The activities covered IP management, commercialisation and other activities, in both number and IP expenditure
on those activities. The output and outcomes of TT activities that were measured were: IP output produced, IP transactions, number of start-up companies emanating from TT activities, and full-time equivalent (FTE) level of employees of such start-up companies.
In the interests of coherence of its data with other South African economic survey data and HSRC data on R&D measurement, the IP & TT survey took care to use standards and methods applied or recommended by Statistics South Africa (Stats SA). Concepts and definitions were aligned, as far as possible, with those in use by the national statistical institute (Stats SA, 2010a). Indicators that use external data are sourced from Stats SA surveys. For example, gross domestic product (GDP) values are the values for the 2013 annual reference period taken from the quarterly Stats SA GDP statistical release P0441 (Stats SA, 2015).
Overall, CeSTII performs quality management in line with practices recommended by Stats SA in the South African Statistical Quality Assessment Framework (SASQAF) (Stats SA, 2010b). The survey was conducted according to a project plan aligned with the phases of the Statistical Value Chain (SVC) illustrated in, which is modelled on practice at Stats SA.
E
EvaluateArchiveDisseminateAnalyseProcessCollect
Quality Management and Metadata Management
Statistical Value Chain
BuildDesignNeed
Figure 40: Statistical Value Chain used in quality and metadata management

43SOUTH AFRICAN NATIONAL SURVEY OF INTELLECTUAL PROPERTY AND TECHNOLOGY TRANSFER AT PUBLICLY FUNDED RESEARCH INSTITUTIONS
Inaugural Baseline Study: 2008-2014
Where possible, data points that corresponded to similar data in the USA, European or other TT surveys were included to facilitate benchmarking with TT sectors in other parts of the world. CeSTII has access to the raw data, metadata, aggregated data and spreadsheets thereof, as wells as the individual questionnaire responses provided by each institution.
External data used in the calculationof indicators
The GDP deflator is calculated by using GDP in current values for a reference year to GDP that has been based to 2010 prices. This is used to convert currency values of quantities in this report in current prices to constant prices based to 2010. The GDP deflator values in Table 2 were derived from the GDP statistical release (Stats SA 2015).
The purchasing power of a currency is the quantity of that currency needed to buy a specified unit of goods or a basket of common goods and services. The purchasing power parity rates in Table 3 were obtained from data published by the OECD on their website (OECD 2015).
Year
GDP deflator
2008
87.46446
2009
94.02824
2010
100
2011
106.6518
2012
112.5307
2013
119.2663
2014
126.188
Table 2: GDP deflator
Year
Purchasing Power Parity
(PPP)
2008
4.032531
2009
4.333744
2010
4.590348
2011
4.773938
2012
4.948004
2013
5.159253
2014
5.385465
Table 3: Purchasing power parity in units of Rands/US Dollar (as at September 2014)

44SOUTH AFRICAN NATIONAL SURVEY OF INTELLECTUAL PROPERTY AND TECHNOLOGY TRANSFER AT PUBLICLY FUNDED RESEARCH INSTITUTIONS
Inaugural Baseline Study: 2008-2014
Fieldwork and quality indicators ofsurvey coverage
The survey was administered as an online survey with secure access and using the HSRC server. Managers of OTTs were requested to provide responses to the instrument questions and enter this onto the system. Follow-up communication consisted of automated email, personal email and telephone contact. Initially, this was done once per week, but the process was managed so as to not be intrusive. The typical call or follow-up call frequency was at least five, but usually more. Difficult respondents were dealt with by either the CeSTII survey manager engaging directly with respondents, or members of the Oversight Committee from SARIMA or NIPMO engaging them in the field.
After the online questionnaire closed, further fieldwork was initiated in an attempt to obtain key data from some large institutions. This was achieved with partial success. Other additional fieldwork operations included efforts to obtain data for a part of Section 5 of the questionnaire that had been omitted from the online tool. This was successfully achieved using a hardcopy emailed add-on to the survey, with data entered manually. Further fieldwork was done on one or two items at a much later stage of the project when validation was performed on the summary results(see below).
National and international standards and benchmark indicators (Association of University Technology Managers 2015) were adopted as part of the methodological approach to the survey project. Quality processes that were in line with Statistics South Africa’s guidelines (as described in the South African Statistical Quality Assessment Framework (Stats SA 2010)) were followed in conducting this survey. The statistical concepts and definitions followed those used in CeSTII surveys, which are guided by those of the national authority (Stats SA 2010).
Non-response2 was defined as failure to obtain the required information from the institutions selected in
the sample. All 33 units on the list of relevant units determined by the IPR Act were selected for inclusion in the survey. Of the 33 units, 24 answered a sufficient number of questions to be considered as unit responses, which yielded a 72.7% survey response rate. The nine units that did not respond comprised: four units that did not respond at all; and five units that only answered the initial biographical information of the respondent.
Therefore, the items selected for the body of this report reflect data from a maximum of 24 institutions (17 HEIs and 7 SCs), which answered the questions partially and fully. The item response levels are presented in Table 4.
There appears to have been some attrition in item response after the second substantive section. We note that the survey collected data for the period 2008 to 2014 for these sections. Thus, the lowered response for these sections may be due to respondent burden, or lowappetiteforthesizeofthesesections.Alternatively,as the latter sections represent more advanced stages
2 Adapted from Särndal, Swensson and Wretman (1992).
24 (17 HE and 7 SC) institutions provided usable information and were counted as responses.
Data note
Modal average ofresponses per section
29
24
24
21
21
21
21
Table 4: Completion rate for sections of the baseline survey
Section
Section: Institution Details
Section 1: Technology Transfer Context
Section 2: Technology Transfer Function
Section 3: IP Portfolio
Section 4: IP Transactions
Section 5: IP Impact
Section 6: Qualitative Input

45SOUTH AFRICAN NATIONAL SURVEY OF INTELLECTUAL PROPERTY AND TECHNOLOGY TRANSFER AT PUBLICLY FUNDED RESEARCH INSTITUTIONS
Inaugural Baseline Study: 2008-2014
in the process of commercialisation of technologies that result in IP transactions, start-up companies, etc., it is possible that some institutions have not achieved the output, as their technologies or TTF capabilities have not matured to this point.
Because not all institutions responded, the results presented in this report for TT activities and outcomes are likely to be under-estimates, if other possible sources of error are excluded.
Frame, sample selection and fieldwork periods
The survey was limited to those publicly financed institutions, as per the definition of “institution” in the IPR Act, namely HEIs and Schedule 1 institutions (which are referred to as SCs in this report). The TTFs were identified as reporting units, which served as the source of primary data. The statistics are compiled and reported at the level of an institution.
The reference period for the SCs was the financial (fiscal) year ending 31 March, and for the HEIs it was the calendar year. The field work period was 1 April 2015 to 20 November 2015.
Table 5: Institutions
Higher Education
Cape Peninsula University of Technology (CPUT)
Central University of Technology (CUT)
Durban University of Technology (DUT)
Mangosuthu University of Technology (MUT)
Nelson Mandela Metropolitan University (NMMU)
North-West University (NWU)
Rhodes University (RU)
Stellenbosch University (SU)
Tshwane University of Technology (TUT)
University of Cape Town (UCT)
University of Fort Hare (UFH)
University of Johannesburg (UJ)
University of KwaZulu-Natal (UKZN)
University of Limpopo (UL)
University of Pretoria (UP)
University of South Africa (UNISA)
University of the Free State (UFS)
University of the Western Cape (UWC)
University of the Witwatersrand (WITS)
University of Venda for Science and Technology (UV)
University of Zululand (UZ)
Vaal University of Technology (VUT)
Walter Sisulu University (WSU)
Science Councils/Schedule 1 Institutions
Agricultural Research Council (ARC)
Council for Geoscience (CG)
Council for Mineral Technology (MINTEK)
Council for Scientific and Industrial Research (CSIR)
Human Sciences Research Council (HSRC)
National Research Foundation (NRF)
South African Bureau of Standards (SABS)
South African Medical Research Council (MRC)
South African Nuclear Energy Corporation (NECSA)
Water Research Commission (WRC)

46SOUTH AFRICAN NATIONAL SURVEY OF INTELLECTUAL PROPERTY AND TECHNOLOGY TRANSFER AT PUBLICLY FUNDED RESEARCH INSTITUTIONS
Inaugural Baseline Study: 2008-2014
Imputation
Imputation is a procedure for entering a value for a specific data item where the response is missing or unusable. Four institutions did not provide any data for the survey. Because the survey was a baseline survey of TT and IP, the data for these institutions were not imputed because there was no available source to do so. However, imputation on some missing or unusable items was performed.
Data on institutional research expenditure was collected for responding institutions through the survey instrument. Where necessary, data obtained from the National Survey of Research and Experimental Development (CeSTII 2013) was used to edit responses from offices of TT. Logical imputations were performed on a case-by-case basis. Range imputation was performed on three data items for one institution, based on expert knowledge of the variables and the institution concerned.
The research expenditure values in Table 6 should not be compared to the research expenditure for all institutions published in the National Survey of Research & Experimental Development (CeSTII 2013), primarily because the number of institutions covered in the South African Survey of Technology Transfer at Publicly-funded Research Institutions is smaller. However, individual institutions with large disparities to those reported in the national R&D survey were edited to conform to the national R&D survey.
Year
Higher education institutions
Science councils
Total
2008
3948
2882
6830
2009
4120
3056
7176
2010
4155
3179
7334
2011
4549
2966
7515
2012
4487
2903
7390
2013
4442
3134
7576
Table 6: Research expenditure, including clinical trials, in millions of Rands
HEIs: n = 20SCs: n = 8
South African Survey of Technology Transfer at Publicly-funded Research InstitutionsNational Survey of Research & Experimental Development
Data note
Data source

47SOUTH AFRICAN NATIONAL SURVEY OF INTELLECTUAL PROPERTY AND TECHNOLOGY TRANSFER AT PUBLICLY FUNDED RESEARCH INSTITUTIONS
Inaugural Baseline Study: 2008-2014
Data processing, analysis and validation
Data tables were drawn from the data in the form of output agreed upon by CeSTII, SARIMA, NIPMO and the DST. Final data quality control measures required that the formatted tables be analysed by CeSTII researchers cross-checking sectoral data items with corresponding aggregate data items. The full data set consisted of online data plus hardcopy questionnaire responses obtained in follow-up operations. The dataset had also already been edited and imputed for variables where:
• logicalinconsistencieswerepickedup;• outlierswereamendedorconsidered
unusable, to ensure consistency with other data sources (e.g. R&D survey expenditures, TIA administrative records);
• expertopinionsprovidedbySARIMA,HSRC,DST and NIPMO in joint project workshops were taken into account; and
• othereditswerenecessaryforcalculationandcross-checking purposes.
A final validation process was performed, with SARIMA, NIPMO and DST as the principal validators. The final dataset after validation obtained new data from an additional fieldwork process. This fieldwork process involved requests to certain institutions for further information on a small selection of variables. The original data set was then edited and imputed for variables where:
• newfieldworkdatareplacedtheoriginaldata;• logicalinconsistencieswerepickedup;and• expertopinionsweretakenintoaccountand
confirmed.
48SOUTH AFRICAN NATIONAL SURVEY OF INTELLECTUAL PROPERTY AND TECHNOLOGY TRANSFER AT PUBLICLY FUNDED RESEARCH INSTITUTIONS
Inaugural Baseline Study: 2008-2014
REFERENCES
AssociationofUniversityTechnologyManagers.AboutTechnologyTransfer.http://www.autm.net/Tech_Transfer.htm(accessed June 11, 2015).
CeSTII. NationalSurveyofResearch&ExperimentalDevelopment(2010/11FiscalYear):StatisticalReport2010/11. Pretoria: Department: Science and Technology, Republic of South Africa, 2013.
Department of Science and Technology, ‘Innovation Towards a Knowledge-Based Economy: Ten-Year Plan for Science andTechnology’,Availableathttp://www.dst.gov.za,2007.
DepartmentofScienceandTechnology,‘SouthAfricanR&DStrategy’,Availableathttp://www.dst.gov.za,2002.
DepartmentofScienceandTechnology,‘WhitePaperonScienceandTechnology’,Availableathttp://www.dst.gov.za,1996.
JuanJulioGutierrezandPauloCorrea.Policy Research Working Paper 6263.‘CommercializationofPubliclyFundedResearch and Development (R&D) in Russia, Scaling up the Emergence of Spinoff Companies’, World Bank, 2012, Availableathttp://documents.worldbank.org/curated/en/872931468092959742/pdf/wps6263.pdf
OECD.“OECD.Stat.”2015.http://stats.oecd.org/index.aspx?DatasetCode=SNA_TABLE4(accessed September 30, 2015).
Stats SA. Concepts and definitions for South Africa 2010 v.3. Pretoria: Statistics South Africa, 2010.
Stats SA. Gross domestic product: P0441, 2nd quarter 2015. Statistical release, Pretoria: Statistics South Africa, 2015.
Stats SA. Quarterly Labour Force Survey: Quarter 1 2015. Statistical release, Pretoria: Statistics South Africa, 2015.
Stats SA. South African Statistical Quality Assessment Framework (SASQAF), Second Edition. Pretoria, Gauteng: Statistics South Africa, 2010.
F
49SOUTH AFRICAN NATIONAL SURVEY OF INTELLECTUAL PROPERTY AND TECHNOLOGY TRANSFER AT PUBLICLY FUNDED RESEARCH INSTITUTIONS
Inaugural Baseline Study: 2008-2014
SURVEY DEFINITIONS
0.5 PROFESSIONAL: A professional person whose duties included support of TECHNOLOGY TRANSFER ACTIVITIES at least 50% of the time. This person may or may not have been located in a formally established TECHNOLOGY TRANSFER office at that time.
ACTIONABLE DISCLOSURES: DISCLOSURES which the institution acts on, for example by filing for statutory IP protection during the twelve months following disclosure, bringing IP rights under institutional management, or which otherwise remains active because future action is expected within one year of receipt of the DISCLOSURE. ACTIONABLE DISCLOSURES are not DISCLOSURES which have been closed by the institution, or have had no action by the institution within twelve months of receipt.
ACTIVE: The cumulative number of IP TRANSACTIONS over all the years that had not terminated by the end of the year requested in the Survey.
ARIPO:AfricanRegionalIPOrganization.
ASSIGNMENT(S): A transaction whereby all rights and title to, as well as interest in, a TECHNOLOGY (and its associated REGISTERABLE IP, if applicable) is transferred to another party and that is executed with the purpose of that IP being commercialised, which will specifically include an IP TRANSACTION concluded for commercialisation of foreground IP which will be created during the research and development collaboration.
AVAILABLE: LICENSED TECHNOLOGIES (please refer to the definition of LICENCED TECHNOLOGIES which includes ASSIGNMENTS and OPTIONS) that are sold as a product to the public or are placed into commercial use by a company, for example, as part of a manufacturing process. A LICENSED TECHNOLOGY is considered AVAILABLE if the TECHNOLOGY was placed into use during that year, i.e. evidenced by royalties generated for the first time or licensee diligence reporting.
BEE ENTITIES: These are companies or entities where at least 25% of shareholding is held by either black individuals or legal entities that are at least 50% black owned. “Black people” is a generic term which means Africans, ColouredsandIndianswhoarecitizensofSouthAfricabybirthorbydescentorwhobecamecitizensof South Africa by naturalisation a) before 27 April 1994 (the commencement date of the ISA interim Constitution),orb)onorafter27April1994andwhowouldhavebeenentitledtoacquirecitizenshipbynaturalisation prior to that date but were precluded by apartheid policies (ref SA BBBEE Act 2011).
BRICS:Brazil,Russia,India,China,SouthAfrica.
CASHED-IN EQUITY: This includes the amount received from cashing in equity holdings, resulting in a cash transfer to the institution. The amount reported should be reduced by the cost basis, if any, at which the equity was acquired. Excluded from this amount is any type of analysis or process whereby a value for the equity holdings is determined but a cash transaction does not take place through the sale of these holdings. An internal sale (e.g., to the endowment) will constitute cashing-in if the transaction results in cash being made available for internal distribution.
CLINICAL TRIALS: These are trials undertaken for the purposes of obtaining registration of a drug, vaccine or treatment, including Phase I, II, III and those aspects of Phase IV trials that lead to a new scientific discovery.
G

50SOUTH AFRICAN NATIONAL SURVEY OF INTELLECTUAL PROPERTY AND TECHNOLOGY TRANSFER AT PUBLICLY FUNDED RESEARCH INSTITUTIONS
Inaugural Baseline Study: 2008-2014
CONTRACT WORKER: This relates to an individual who works under a fixed- term contract, here taken to be greater than or equal to six months to distinguish it from a fixed-term contract for a TEMPORARY WORKER. The employment contract for a TEMPORARY WORKER and CONTRACT WORKER may be contrasted to a PERMANENT contract where there is no end-date. Employment under contracts often entails a different set of legal obligations on behalf of employers; in particular, certain aspects of employment protection legislation do not apply to contract work.
CONVENTION PATENT APPLICATIONS:Anapplicationforapatentmadeinajurisdiction/region/countrywhich claims priority from a relevant application in a convention country. This includes all patent applications that were filed claiming priority from a SA PROVISIONAL PATENT APPLICATION or a provisional application filedinanyotherjurisdiction.Directfilingofapatentapplicationinanotherjurisdiction/region/countrywithout claiming priority would also qualify as a CONVENTION PATENT APPLICATION.
CO-OWNED: Co-ownership is where another party is a co-applicant, co-assignee, co-patentee, or the like, or where an agreement is in place between two or more parties that inter alia regulates co-ownership of the IP.
DISCLOSURES: The number of disclosures, no matter how comprehensive, that is submitted during the requested survey year and is counted as received by the institution. Not all DISCLOSURES become ACTIONABLE DISCLOSURES.
EQUITY: An institution acquiring an ownership interest in a company (e.g., shares or the right to receive shares).
ESTIMATED REVENUE OF LICENSED PRODUCTS: REVENUE of licensed products (goods or services) can be estimated by dividing the RUNNING ROYALTIES for a particular licence or assignment by the negotiated royalty rate. These are for the most recent year in which a royalty report and associated IP TRANSACTION INCOME was received. For example: if the negotiated royalty rate for license A was 5% and it generated R500 000 in RUNNING ROYALTIES then the ESTIMATED REVENUES OF LICENSED PRODUCT for that LICENSEDTECHNOLOGYwouldbeR500000/0.05=R10000000.RepeatforeachLICENCEorASSIGNMENT generating RUNNING ROYALTIES and sum to get the total ESTIMATED REVENUES OF LICENSED PRODUCTS.
EXCLUSIVE: The reporting of a licence as EXCLUSIVE or NON-EXCLUSIVE should follow the terms of the licence agreement. If a licence is designated as EXCLUSIVE in the licence agreement, it should be reported as an EXCLUSIVE licence in this Survey. EXCLUSIVE licences include licences that are designated as EXCLUSIVE by field of use, territory, or otherwise but excludes sole licences, which are reported as NON-EXCLUSIVE LICENCES. Sole licence in this instance refers to a licence wherein the licensor reserves some or all rights to use the IP for their own use, for example the licensor reserving the right to use the IP for research and teaching.
FOREIGN CONTROLLED SOUTH AFRICAN ORGANISATIONS: These are organisations registered in South Africa, where 50% or more of the organisation is foreign owned (by ultimate ownership if complex holding structures exist).
FOREIGN REGISTERED ORGANISATIONS: These are organisations that are not registered with the Companies and Intellectual Property Commission (CIPC) in South Africa.
FORMAL ENGAGEMENT: Denotes the existence of a contract(s) with industry (e.g. research contracts) or a measurable output such as a report or scientific paper.
51SOUTH AFRICAN NATIONAL SURVEY OF INTELLECTUAL PROPERTY AND TECHNOLOGY TRANSFER AT PUBLICLY FUNDED RESEARCH INSTITUTIONS
Inaugural Baseline Study: 2008-2014
FTE: Full-Time Equivalent. See use in definitions for, TT FTE and OTHER FTE. Please also refer to the advice on how to calculate percentages provided in Section 1 above titled Instructions.
FULL COST:Asdeterminedaccordingtotheinstitution’sfullcostmatricesassubmittedforapprovaltoand/orapproved by NIPMO in terms of section 15(4) and regulation 16 of the IPR ACT.
HEI: Higher Education Institution.
INCUBATION SPACE:Physicalofficeand/orlaboratoryspaceavailableand/orinuseonsomepreferentialtermstoSTART-UPCOMPANIES,managedand/orresourcedbytheinstitution.
INCUBATION SERVICES: Services such as IT infrastructure, back office assistance such as accounting services, reception/secretarialsupport,marketingsupport,strategicadvice,mentoring,INCUBATIONSPACEetc.
INFORMAL ENGAGEMENT: Social or work gathering where there are no tangible expected outputs but where an exchange of ideas and information is possible.
INTERN: An INTERN is usually employed on a contractual basis, either short (here taken to mean less than six months) or long-term. In contrast to a TEMPORARY WORKER or CONTRACT WORKER position, an INTERN position must involve an agreement for on-the-job training at the outset of the work contract. INTERN positions may be paid or unpaid. PERMANENT workers are normally not employed as INTERNS.
IP: Intellectual Property.
IP CREATORS:AsdefinedintheIPRAct,and/ortheInstitution’sIPPolicy.Insomecasesinstitutionalpoliciesmake provision for benefits to be shared with those involved in enabling the technology, not just the direct IP CREATORS.
IP EXPENDITURE: Includes the amount spent by an institution in external legal fees for REGISTERABLE IP. These costs include prosecution, maintenance, and interference costs, as well as minor litigation expenses that are included in everyday office expenditures (an example of a minor litigation expense might be the cost of an initial letter to a potential infringer written by counsel). Excluded from these fees are (i)significant litigation expense, e.g., any individual litigation expenses that exceed 5% of total IP EXPENDITURE which is deemed to be LITIGATION EXPENDITURE, and (ii) direct payment of any of these costs by licensees; i.e. LEGAL FEES REIMBURSEMENTS.
IPR ACT: Intellectual Property Rights from Publicly Financed Research and Development Act (Act No, 51 of 2008) and the regulations thereto, as amended from time to time.
IP TRANSACTION: A LICENCE, OPTION or ASSIGNMENT or combination of these as applicable that is executed with the purpose of that IP being commercialised which will specifically include an IP TRANSACTION concluded for commercialisation of foreground IP which will be created during research and development collaboration. However, this excludes licensing of background IP for research purposes.

52SOUTH AFRICAN NATIONAL SURVEY OF INTELLECTUAL PROPERTY AND TECHNOLOGY TRANSFER AT PUBLICLY FUNDED RESEARCH INSTITUTIONS
Inaugural Baseline Study: 2008-2014
IP TRANSACTION REVENUE: Includes all revenue received as consideration in an IP TRANSACTION such as licence issue fees, payments under options or on assignment, milestones or minimum payments (also referred to as annual minimums), running royalties, termination payments, the amount of equity received when cashed-in, and dividends. Also include software and biological material end-user license fees equal to R10 000 or more. It excludes research funding, IP expense reimbursement, a valuation of equity not cashed-in, software and biological material end-user license fees less than R10 000, or trademark licensing royalties from an institution insignia, nor revenue received in support of the cost to make and transfer materials under Material Transfer Agreements. For the avoidance of doubt this is the amount received from the “third party” before any deductions or payment of VAT.
LARGE COMPANIES: Companies that had more than 500 employees at the time of executing an IP TRANSACTION.
LEGAL FEES REIMBURSEMENTS: Includes the amounts reimbursed by licensees to the institution for IP EXPENDITURE. Include in this category both LEGAL FEES REIMBURSEMENTS paid via lump sum payments of costs incurred in prior years when a new license is signed AND regular reimbursements of new costs incurred after the license is signed. Do not include amounts deducted from LICENSE INCOME prior to internal distribution because IP EXPENDITUREhas not previously been reimbursed (e.g., technologies licensed non-exclusively)noranyrebatereceivedfromthePatentSupportFund(InnovationFund/TechnologyInnovationAgency) or IP Fund (NIPMO).
LICENCE(S): A transaction whereby part or all of the rights to a TECHNOLOGY (and its associated REGISTERABLE IP if applicable), are granted to another party, whether on an EXCLUSIVE or NON-EXCLUSIVE basis, and that is executed with the purpose of that IP being commercialised which will specifically include an IP TRANSACTION concluded for commercialisation of foreground IP which will be created during the research and development collaboration. However this excludes the licensing of background IP for research purposes.
LICENSED TECHNOLOGIES: These are TECHNOLOGIES that are the subject of a duly executed LICENCE, OPTION or ASSIGNMENT which may or may not have become a product that was sold either to the public or to industry, or process that was put into commercial use.
TT FTE: Person(s) involved in the TTF whose duties are specifically related to licensing, IP registration & maintenance processes as either full or fractional FTE allocations. Licensing examples include licensee solicitation, technology valuation, marketing of technology, licence agreement drafting and negotiation, and start-up activity efforts. Note that these exclude OTHER FTEs.
LITIGATION EXPENDITURE: Significant litigation expenses e.g., any individual litigation expense that exceeds 5% of total IP EXPENDITURE, excluding direct payment of any of these costs by licensees; i.e. LEGAL FEES REIMBURSEMENTS.
MEDIUM-LARGE COMPANIES: Companies that had 251 to 500 employees at time of executing an IP TRANSACTION.
MEDIUM SIZED COMPANIES: Companies that had 51 to 250 employees at time of executing an IP TRANSACTION.

53SOUTH AFRICAN NATIONAL SURVEY OF INTELLECTUAL PROPERTY AND TECHNOLOGY TRANSFER AT PUBLICLY FUNDED RESEARCH INSTITUTIONS
Inaugural Baseline Study: 2008-2014
NATIONAL PHASE PATENT APPLICATIONS:Acompleteapplicationfiledinajurisdiction/region/countrybasedon a PCT APPLICATION.
NEW PATENT APPLICATIONS: The first filing of patentable subject matter. NEW PATENT APPLICATIONS do not include continuations, divisionals, or reissues, and do not include continuations in part (CIPs). A provisional patentapplicationinanyjurisdiction/region/countrywillbecountedasnewifitdoesnotclaimpriorityfromanyotherpatentapplication(thereforearefillingofalapsed/withdrawnprovisionalapplicationiscountedasnew). If a SA PROVISIONAL PATENT APPLICATION is completed by filing a subsequent patent application in anyjurisdiction/region/country,thenthecorrespondingcompletepatentapplication,CONVENTIONPATENTAPPLICATIONS or NATIONAL PHASE PATENT APPLICATIONS should not be counted as new.
NEW PLANT BREEDERS’ RIGHTS APPLICATIONS: The first filing of an application for a plant breeders’ right (includes plant variety rights and United States plant patent applications and community plant breeders’ rights applications).
NEW PRODUCTS:Includesanynewproduct(goodsorservice)deliveredtoclientsofthelicensee/assignee.Byimplicationthisexcludestheuseofthelicensed/assignedTECHNOLOGYtoimprovetheefficientandeffectiveproductionand/ordeliveryofexistingproductsorservicesorinternalbusinesspractice(e.g.manufacturingprocesses).
NEW REGISTERED DESIGN APPLICATIONS: The first filing of an application for a registered design, and includes United States and Australian design patent applications, as well as European Union (European Community) design applications. Furthermore, both aesthetic and functional registered design applications are included regardless of the number of classes in which the application was filed i.e. each distinct design in any number of classes is a new registered design for the purposes of determining NEW REGISTERED DESIGN APPLICATIONS.
NEW TRADE MARK APPLICATIONS: The first filing of a trade mark regardless of the number of classes in which applicationwas filed i.e. each distinct trade mark in any number of classes is a new trade mark for the purposes of determining NEW TRADE MARK APPLICATIONS. NEW TRADE MARK APPLICATIONS are limited to those associated with a TECHNOLOGY, and do not include trademarks such as those used by the institution, or its subsidiaries, for branding etc.
NON-EXCLUSIVE: The reporting of a licence or option as EXCLUSIVE or NON-EXCLSUIVE should adhere to the terms of the licence agreement. If a licence is designated as NON-EXCLUSIVE or sole in the licence agreement, it should be reported under NON-EXCLUSIVE licenses to this Survey. Sole licence in this instance refers to a licence wherein the licensor reserves some or all rights to use the IP for their own use, for example, the licensor reserving the right to use the IP for research and teaching or for commercial purposes.
NON-OPERATIONAL: A company that no longer possesses sufficient financial resources and expends these resources to make progress toward stated business goals. The licence to a company that is NON-OPERATIONAL will most likely have been terminated. A company may have terminated its licence and still be OPERATIONAL because it has changed its business focus, however, it may be difficult to determine if such a company is still OPERATIONAL. A company that has been acquired and no longer operates independently should be counted as NON-OPERATIONAL if the licence has been terminated.

54SOUTH AFRICAN NATIONAL SURVEY OF INTELLECTUAL PROPERTY AND TECHNOLOGY TRANSFER AT PUBLICLY FUNDED RESEARCH INSTITUTIONS
Inaugural Baseline Study: 2008-2014
OPERATIONAL: A company that possesses sufficient financial resources and expends these resources to make progress toward stated business goals. The company must also be diligent in its efforts to achieve these goals. A company that has been acquired and no longer operates independently should still be counted as OPERATIONAL if the license is still active and in compliance.
OPTION(S): A transaction whereby a party is granted an option to negotiate on a first right of refusal basis of certain rights or title to a TECHNOLOGY (and its associated REGISTERED IP, if applicable) and that is executed with the purpose of that IP being commercialised which will specifically include an IP TRANSACTION concluded for commercialisation of foreground IP which will be created during the research and development collaboration. An OPTION can also be a right granted subject to certain conditions being met. An OPTION grants the potential licensee a time period during which the licensee may evaluate the TECHNOLOGY and negotiate the terms of a LICENCE agreement.
OTHER FTE: Person(s) involved in the TTF as either full or fractional FTE allocations whose duties and responsibilities are to provide professional, administrative, or staff support of TECHNOLOGY TRANSFER ACTIVITIES that are not otherwise included in TT FTE. Such duties might include management, compliance reporting, and license maintenance, negotiation of research agreements, contract management, accounting, MTA activity, and generalofficeactivity.Generalsecretarial/administrativeassistancetotheTTFmayalsobeincludedinthiscategory.
OTHER INSTITUTIONS: Other publicly funded institutions(as per the IPR ACT) who are invited to respond to the Survey. The Survey will use this information to avoid double-counting, for example in measuring LICENSE INCOME, RESEARCH EXPENDITURE etc.
PATENT FAMILY(IES):Asuiteofcorrespondingpatent(s)and/orpatentapplication(s)relatingtoaparticularinvention,whichmayhavebeenfiledinoneormorejurisdiction/region/countrythatdrawonthesamepriority application.However, where a divisional application is filed it would be regarded as a separate patent family.
PATENTS GRANTED:Patentrightsgrantedinaparticularjurisdiction/country/region.
PCT APPLICATIONS: Patent Co-operation Treaty applications.
PERMANENT: A PERMANENT employment contract is one where there is no end-date. PERMANENT employees enjoy greater protection than CONTRACT WORKERS or TEMPORARY WORKERS as it entails a different set of legal obligations on behalf of employers, in particular, certain aspects of employment protection legislation do not apply to contract work.
PLANT BREEDERS’ RIGHTS FAMILY(IES):Asuiteofcorrespondingplantbreeders’rightsand/orplantbreeders’rights application(s) relating to a particular plant variety, which may have been filed in one or more jurisdiction/region/country,thatdrawonthesamepriorityapplication(includesplantvarietyrightsandUnitedStates plant patent applications and community plant breeders’ rights applications).
PLANT BREEDERS’ RIGHTS GRANTED:Plantbreeders’rightsgrantedinaparticularjurisdiction/country/regionand include plant variety rights and granted United States plant patents and community plant breeders’ rights.
PUBLICLY FUNDED IP: IP that falls within the scope of the IPR ACT.
55SOUTH AFRICAN NATIONAL SURVEY OF INTELLECTUAL PROPERTY AND TECHNOLOGY TRANSFER AT PUBLICLY FUNDED RESEARCH INSTITUTIONS
Inaugural Baseline Study: 2008-2014
PURCHASED: This refers to any arrangement whereby a party, other than the START-UP COMPANY, acquires the right to receive the majority of economic benefits created by the START-UP COMPANY, whether through a purchase of more than 50% of the shares, or any other equivalent arrangement.
PPP: Purchasing Power Parity.
REGISTERABLE IP:AllformsofIPforwhichstatutoryprotectioncanbeobtainedinajurisdiction/region/country,including patents, trademarks, plant breeders’ rights, designs and copyright.
REGISTERED DESIGN FAMILY(IES):Asuiteofcorrespondingregistereddesign(s)and/ordesignapplication(s)relatingtoaparticulardesign,whichmayhavebeenfiledinoneormorejurisdiction/region/countrythatdraw on the same priority application.
REGISTERED DESIGNS GRANTED:Registereddesignrightsgrantedinaspecificjurisdiction/country/regionandincludes granted United States and Australian design patents and community designs.
RESEARCH EXPENDITURE: Expenditure of the institution in support of its research and development activities, which may be funded from different sources, excluding expenditure on CLINICAL TRIALS.
REVENUE: Invoicable income (turnover) from sales of products or services, accounted as such in the income statement. This excludes capital investments, loans etc secured by the company that are accounted for in the balance sheet.
RUNNING ROYALTIES: Royalties earned on and tied to the sale of products or services based on the licensed or assigned IP before any disbursement to any other funding partners (e.g. Technology Innovation Agency, private company etc.). Excluded from this number are licence issue fees, payments under options, termination payments, the amount of annual minimums not supported by sales, and CASHED-IN EQUITY.
SA COMPLETE PATENT APPLICATIONS: A complete patent application filed in accordance with the laws of South Africa, specifically the South African Patents Act No. 57 of 1978, at the Companies and Intellectual Property Commission (CIPC), or its predecessor the Companies and Intellectual Property Registration Office (CIPRO). NATIONAL PHASE PATENT APPLICATIONS filed in SA following a PCT application should be excluded and counted as a NATIONAL PHASE PATENT APPLICATIONS.
SA PROVISIONAL PATENT APPLICATIONS: A provisional patent application filed in accordance with the laws of South Africa, specifically the South African Patents Act No. 57 of 1978, at the Companies and Intellectual Property Commission (CIPC), or its predecessor the Companies and Intellectual Property Registration Office (CIPRO), providing a priority date for the application.
SEED / GAP FUND(S): This is funding available to the responding institution to promote the further development andcommercialisationofTECHNOLOGIESbytheinstitutionand/orSTART-UPCOMPANY/IES.Thefundingcanbefrombudget/fundsallocatedbytheinstitutionorotherpartiesincludingfundingagencies,discretionaryfunding ring-fenced for such purposes within the TTF, or a dedicated fund raised from internal or external sourcesandmanagedasastructuredfund.Whatdistinguishesthisfundingisthatitis(i)ring-fenced/earmarked for TECHNOLOGY development and commercialisation as opposed to IP costs or operational costsoftheTTF,and(ii)isforallintentsandpurposesmanagedbytheTTF(thoughitmayhaveaninvestment/decisionmakingcommitteethathasinstitutionaland/orexternalpersonsincludedinit).

56SOUTH AFRICAN NATIONAL SURVEY OF INTELLECTUAL PROPERTY AND TECHNOLOGY TRANSFER AT PUBLICLY FUNDED RESEARCH INSTITUTIONS
Inaugural Baseline Study: 2008-2014
SMALL COMPANIES: Companies that have 50 or less employees at the time of executing an IP TRANSACTION.
START-UP COMPANY(IES): New companies that were dependent on an IP TRANSACTION granting rights in respect of, or title to, the institution’s technology for their formation. If the IP TRANSACTION was with an existing company, this company should be counted as a SMALL COMPANY or MEDIUM SIZED COMPANY or MEDIUM LARGE COMPANY or LARGE COMPANY as applicable, not a START-UP COMPANY.
TECHNOLOGY OR TECHNOLOGIES: A TECHNOLOGY is the embodiment of an idea that results from the creative work performed by faculty, students or staff during research or teaching that are deemed to form part of the portfolio managed by the TTF. Multiple TECHNOLOGIES can arise from a single DISCLOSURE or a single TECHNOLOGY can be the result from a number of DISCLOSURES. A TECHNOLOGY can also take many different forms; the most common are compositions of matter, biological materials, processes, methods, devices, asexually reproduced plants and designs. Also common are works of expression such as software, photos and drawings. A TECHNOLOGY is the embodiment of a single innovative idea, no matter how many (i) protection filings (being patents, trade marks, designs, plant breeders’ rights or copyrights), or (ii) disclosures thatmaybeassociatedwith/includedintheTECHNOLOGY.
TECHNOLOGY TRANSFER or TT: See TECHNOLOGY TRANSFER ACTIVITIES.
TT: TECHNOLOGY TRANSFER.
TECHNOLOGY TRANSFER ACTIVITIES: Those activities associated with the identification, documentation, evaluation, protection, marketing, assigning and licensing of technology (including trade marks but not an institution’s insignia) and IP management, in general. It encompasses all other activities also associated with the day-to-day operations of a TECHNOLOGY TRANSFER FUNCTION (TTF), including assisting with the negotiationofresearchagreements,MaterialTransferAgreements,reportingofinventionstofunders/sponsors,compliance with the IPR ACT, and all other duties performed by the TTF.
TECHNOLOGY TRANSFER FUNCTION or TTF: The function (be it an individual(s), a dedicated office, a regional office etc.) that manages and performs the TECHNOLOGY TRANSFER ACTIVITIES at the institution. For some TTF they are also referred to as a technology transfer office, technology licensing office or office of technology transfer.
TEMPORARY WORKER: Temporary employment comprises work under a fixed- term contract, here taken to be less than six months to distinguish it from a fixed-term contract for a CONTRACT WORKER. The employment contract for a TEMPORARY WORKER and CONTRACT WORKER may be contrasted to a PERMANENT contract where there is no end-date. Employment under contracts often entails a different set of legal obligations on behalf of employers, in particular certain aspects of employment protection legislation do not apply to contract work. Often a TEMPORARY WORKER may be sourced from employment agencies or brokers, and may sometimes be referred to as “temps”.
TRIADIC PATENT FAMILIES FILED: A set of patent applications filed as a PATENT FAMILY at the following patent offices: the European Patent Office (EPO), the Japan Patent Office (JPO) and the United States Patent and Trademark Office (USPTO). The TRIADIC PATENT FAMILIES FILED can only be counted as one (1) once all three patent applications have been filed at the respective patent offices.

57SOUTH AFRICAN NATIONAL SURVEY OF INTELLECTUAL PROPERTY AND TECHNOLOGY TRANSFER AT PUBLICLY FUNDED RESEARCH INSTITUTIONS
Inaugural Baseline Study: 2008-2014
TRIADIC PATENT FAMILIES GRANTED: PATENTS GRANTED at the European Patent Office (EPO), the Japan Patent Office (JPO) and the United States Patent and Trademark Office (USPTO). The TRIADIC PATENT FAMILIES GRANTED will only be counted as one (1) once all three patent offices have granted the TRIADIC PATENT FAMILIES FILED.
TRADE MARK FAMILY(IES):Asuiteofcorrespondingtrademark(s)and/ortrademarkapplication(s)relatingtoa particular mark (name or logo or any other type of mark per the Trade Marks Act) and associated with a specificTECHNOLOGY,whichmayhavebeenfiledinoneormorejurisdiction/region/country,regardlessofthenumberofclassesandjurisdictions/regions/countriesinwhichapplicationswerefiledand/orgranted.
TRADE MARKS GRANTED:Includestrademarkrightsgrantedinaparticularjurisdiction/region/countryassociated with a specific TECHNOLOGY.
TT OPERATIONS EXPENDITURE: The expenses associated with the operation of the TTF, such as human resource costs, office infrastructure, consultants, marketing. It excludes IP EXPENDITURE and LITIGATION EXPENDITURE, SEED/GAPFUNDSandthecostofanyINCUBATIONSPACEorINCUBATIONSERVICES.
UNITED STATES PROVISIONAL PATENT APPLICATIONS: A provisional patent application filed in the United States of America, in accordance with the laws of the United States of America.

58SOUTH AFRICAN NATIONAL SURVEY OF INTELLECTUAL PROPERTY AND TECHNOLOGY TRANSFER AT PUBLICLY FUNDED RESEARCH INSTITUTIONS
Inaugural Baseline Study: 2008-2014
LIST OF INDICATORS NOT REPORTED
1. Percentage of RESEARCH EXPENDITURE and CLINICAL TRIALS expenditure that was funded on a FULL COST basis
2. Breakdown of IP EXPENDITURE for the different types of registered IP (Patents, Registered Designs, Plant Breeders’ Rights, Trade Marks, Copyright (registered))
3. Total amount paid to other institutions from total IP EXPENDITURE reported
4. TotalSEED/GAPFUNDSreceived
5. INCUBATION SPACE available (m2)
6. Cost to institution of all INCUBATION SERVICES rendered
7. Number of DISCLOSURES received from PUBLICLY FUNDED IP
8. Total number of TECHNOLOGIES within the portfolio managed by the TTF which are LICENSED TECHNOLOGIES
9. Total number of TECHNOLOGIES within the portfolio managed by the TTF which are based on PUBLICLY FUNDED IP
10. Number of TECHNOLOGIES protected (in the case of registerable IP it is irrespective of whether the application is still being prosecuted or already granted) through one or more of the following: Patents, Trade Marks, Registered Designs, Plant Breeders’ Rights, Registered Copyright, Copyright and Trade Secrets
11. Total number of NEW PATENT APPLICATIONS filed:11.1 as SA PROVISIONAL PATENT APPLICATIONS 11.2 directly as UNITED STATES PROVISIONAL PATENT APPLICATIONS 11.3 in any other jurisdiction
12. Total number of CONVENTION PATENT APPLICATIONS filed as: 12.1 PCT APPLICATIONS12.2 SA COMPLETE PATENT APPLICATIONS 12.3 complete applications filed in any other jurisdiction that are not NATIONAL PHASE PATENT
APPLICATIONS
13. Total number of NATIONAL PHASE PATENT APPLICATIONS filed in: 13.1 South Africa 13.2 Allotherjurisdictions/regions/countries
13.2.1 BRICS (other than South Africa) 13.2.2 ARIPO 13.2.3 United States 13.2.4 European Union 13.2.5 Japan13.2.6 Other
H

59SOUTH AFRICAN NATIONAL SURVEY OF INTELLECTUAL PROPERTY AND TECHNOLOGY TRANSFER AT PUBLICLY FUNDED RESEARCH INSTITUTIONS
Inaugural Baseline Study: 2008-2014
14. Total number of PATENTS GRANTED in:14.1 South Africa 14.2 Allotherjurisdictions/regions/countries
14.2.1 BRICS (other than South Africa) 14.2.2 ARIPO 14.2.3 United States 14.2.4 European Union 14.2.5 Japan14.2.6 Other
15. Total number of PATENT FAMILIES in the portfolio which:15.1 are CO-OWNED15.2 is the subject of an IP TRANSACTION
16. Total number of TRIADIC PATENT FAMILIES FILED
17. Total number of TRIADIC PATENT FAMILIES GRANTED
18. Total number of NEW TRADE MARK APPLICATIONS filed in:18.1 South Africa18.2 United States 18.3 allotherjurisdictions/regions/countries
19. Total number of TRADE MARKS GRANTED in:19.1 Allotherjurisdictions/regions/countries
19.1.1 BRICS (other than South Africa) 19.1.2 ARIPO 19.1.3 United States 19.1.4 European Union 19.1.5 Japan 19.1.6 Other
20. Total number of TRADE MARK FAMILIES in the portfolio which:20.1 are CO-OWNED20.2 is the subject of an IP TRANSACTION
21. Total number of NEW REGISTERED DESIGN APPLICATIONS filed in21.1 South Africa21.2 United States 21.3 allotherjurisdictions/regions/countries

60SOUTH AFRICAN NATIONAL SURVEY OF INTELLECTUAL PROPERTY AND TECHNOLOGY TRANSFER AT PUBLICLY FUNDED RESEARCH INSTITUTIONS
Inaugural Baseline Study: 2008-2014
22. Total number of REGISTERED DESIGNS GRANTED in:22.1 South Africa
22.1.1 of which are SA Aesthetic design registration only 22.1.2 of which are SA Functional design registration only
22.2 Allotherjurisdictions/regions/countries22.2.1 BRICS (other than South Africa) 22.2.2 ARIPO 22.2.3 United States 22.2.4 European Union 22.2.5 Japan 22.2.6 Other
23. Total number of REGISTERED DESIGN FAMILIES in the portfolio which23.1 are CO-OWNED23.2 is the subject of an IP TRANSACTION
24. Total number of NEW PLANT BREEDERS’ RIGHTS APPLICATIONS filed in:24.1 South Africa 24.2 Allotherjurisdictions/regions/countries
25. Total number of PLANT BREEDERS’ RIGHTS GRANTED in:25.1 South Africa 25.2 Allotherjurisdictions/regions/countries
25.2.1 BRICS (other than South Africa) 25.2.2 ARIPO 25.2.3 United States 25.2.4 European Union 25.2.5 Japan25.2.6 Other
26. Total number of PLANT BREEDERS’ RIGHTS FAMILIES in the portfolio which26.1 are CO-OWNED26.2 is the subject of an IP TRANSACTION
27. Total number of EXCLUSIVE LICENCES executed which:27.1 included the right to use in foreign jurisdictions 27.2 granted rights to FOREIGN REGISTERED ORGANISATIONS 27.3 granted rights to FOREIGN CONTROLLED SOUTH AFRICAN ORGANISATIONS
28. Total number of NON-EXCLUSIVE LICENCES executed which:28.1 included the right to use in foreign jurisdictions 28.2 granted rights to FOREIGN REGISTERED ORGANISATIONS 28.3 granted rights to FOREIGN CONTROLLED SOUTH AFRICAN ORGANISATIONS
29. Number of TECHNOLOGIES that formed part of LICENCES executed
30. Number of DISCLOSURES that formed part of LICENCES executed

61SOUTH AFRICAN NATIONAL SURVEY OF INTELLECTUAL PROPERTY AND TECHNOLOGY TRANSFER AT PUBLICLY FUNDED RESEARCH INSTITUTIONS
Inaugural Baseline Study: 2008-2014
31. Total number of OPTIONS executed which: 31.1 are not embedded in an R&D agreement31.2 were with FOREIGN REGISTERED ORGANISATIONS 31.3 were with FOREIGN CONTROLLED SOUTH AFRICAN ORGANISATIONS
32. Number of TECHNOLOGIES that formed part of OPTIONS executed
33. Number of DISCLOSURES that formed part of OPTIONS executed
34. Total number of ASSIGNMENTS executed which:34.1 are not embedded in an R&D agreement34.2 were with FOREIGN REGISTERED ORGANISATIONS 34.3 were with FOREIGN CONTROLLED SOUTH AFRICAN ORGANISATIONS
35. Number of DISCLOSURES that formed part of these ASSIGNMENTS
36. Number of TECHNOLOGIES that formed part of these ASSIGNMENTS
37. Total number of IP TRANSACTIONS that were:37.1 executed which included EQUITY 37.2 executed which involved PUBLICLY FUNDED IP 37.3 ACTIVE as of the last day of the year, cumulative throughout the year
38. Number of IP TRANSACTIONS executed with South African registered:38.1 START-UP COMPANIES38.2 SMALL COMPANIES 38.3 MEDIUM SIZED COMPANIES38.4 MEDIUM-LARGE COMPANIES38.5 LARGE COMPANIES38.6 BEE ENTITIES
39. IP TRANSACTION REVENUE, of this how much:39.1 is from IP TRANSACTIONS that involved PUBLICLY FUNDED IP39.2 can be attributed to RUNNING ROYALTIES39.3 can be attributed to CASHED-IN EQUITY
40. IP TRANSACTION REVENUE, of this what amount was paid to:40.1 OTHER INSTITUTIONS 40.2 IP CREATORS 40.3 other third parties not mentioned above
41. Number of OTHER INSTITUTIONS to whom IP TRANSACTION REVENUE payments were made
42. Number of IP CREATORS to whom payments were made for the first time
43. Total number of IP CREATORS to whom payments were made

62SOUTH AFRICAN NATIONAL SURVEY OF INTELLECTUAL PROPERTY AND TECHNOLOGY TRANSFER AT PUBLICLY FUNDED RESEARCH INSTITUTIONS
Inaugural Baseline Study: 2008-2014
44. Number of START-UP COMPANIES formed to commercialise an institution’s technology in which:44.1 the institution holds equity (directly or through an institution subsidiary)44.2 have their primary location in the institution’s Province 44.3 are BEE ENTITIES
45. Total START-UP COMPANIES from all years that became NON-OPERATIONAL
46. Total annual REVENUE for all START-UP COMPANIES
47. Total START-UP COMPANIES that were PURCHASED
48. Total number of LICENSED TECHNOLOGIES that became AVAILABLE:48.1 Number of NEW PRODUCTS offered 48.2 Number primarily aimed at improving the effective and efficient production and delivery of existing
products (goods or services)
49. ESTIMATEDREVENUEOFLICENSEDPRODUCTS,basedonroyaltyreportsreceivedfromlicenses/assignees
50. ESTIMATED REVENUE OF LICENSED PRODUCTS which pertains to START-UP COMPANIES
51. Number new jobs (in FTEs) created as result of the use of LICENSED TECHNOLOGIES (excluding FTEs reported in START-UP COMPANIES)

63SOUTH AFRICAN NATIONAL SURVEY OF INTELLECTUAL PROPERTY AND TECHNOLOGY TRANSFER AT PUBLICLY FUNDED RESEARCH INSTITUTIONS
Inaugural Baseline Study: 2008-2014
LIST OF ACKNOWLEDGEMENTS
The following people are acknowledged, in alphabetical order, for their contribution to this survey project.
I
Pilot Study Interviewees
Dr Piet Barnard Director: Research Contracts & IP Services - UCT
Dr Andrew Bailey IP Manager Research Contracts & IP Services - UCT
Dr Glen Taylor Senior Director, Research Development - UFS
Mr Werner Nel Deputy Director, Research Development, Innovation and Business Development - UFS
Prof Jorrie Jordaan Director of Technology and Innovation - CUT
Ms Margaret Jordaan Technology and Innovation - CUT
Mr Theunis Hanekom Advisor: IP Management - Office of TT - NECSA
Mr Louis Bouwer Office of TT - NECSA
Mr Nkosinathi Sotshangane Senior Research Associate, Research Resource Centre, Directorate of Research Development - WSU
Expert Reference Group
Prof Anthony Arundel Professor of Innovation - University of Tazmania
Dr Andrew Bailey IP Manager Research Contracts & IP Services - UCT
Ms Nicki Koorbanally Group Manager CSIR Licensing & Ventures
Dr Khangelani Zuma Executive Director & Head of Biostatistics, Research Methodology & Data Centre (RMDC), HSRC

64SOUTH AFRICAN NATIONAL SURVEY OF INTELLECTUAL PROPERTY AND TECHNOLOGY TRANSFER AT PUBLICLY FUNDED RESEARCH INSTITUTIONS
Inaugural Baseline Study: 2008-2014
CeSTII
Mr Mario Clayford
Dr Firdous Khan
Mr Lwando Kondlo
Dr Glenda Kruss
Ms Natalie le Roux
Dr Gillian Marcelle
Ms Helen Morrissey
Dr Nazeem Mustapha
Ms Marjorie Pyoos
Mr Fhatuwani Rambau
Mr Julien Rumbelow
Ms Sinovuyo Takatshana
Ms Natalie Vlotman
Mr Darryn Whisgary
Mr Thembinkosi Zulu
Ms Janine Senekal
Mr Nhlanhla Malaza
Mr Gerard Ralphs
SARIMA
Dr Andrew Bailey
Mr Piet Barnard
Mr Sean Moolman
Dr Shelley Mulder
Ms Mavis Nyatlo
Ms Cristina Pinto
Mr Peter Rose
Ms Ela Romanowska
Mr Nkosinathi Sotshangane
Mr Rudi van der Walt
DST/NIPMO
Dr Kerry Faul
Ms Phumela Gantsho
Ms Tshidi Mamogobo
Mr Godfrey Mashamba
Ms Kgomotso Matlapeng
Ms Rose Msiza
Ms Jetane Weyers

65SOUTH AFRICAN NATIONAL SURVEY OF INTELLECTUAL PROPERTY AND TECHNOLOGY TRANSFER AT PUBLICLY FUNDED RESEARCH INSTITUTIONS
Inaugural Baseline Study: 2008-2014
NOTES

66SOUTH AFRICAN NATIONAL SURVEY OF INTELLECTUAL PROPERTY AND TECHNOLOGY TRANSFER AT PUBLICLY FUNDED RESEARCH INSTITUTIONS
Inaugural Baseline Study: 2008-2014
NOTES

67SOUTH AFRICAN NATIONAL SURVEY OF INTELLECTUAL PROPERTY AND TECHNOLOGY TRANSFER AT PUBLICLY FUNDED RESEARCH INSTITUTIONS
Inaugural Baseline Study: 2008-2014
NOTES

68SOUTH AFRICAN NATIONAL SURVEY OF INTELLECTUAL PROPERTY AND TECHNOLOGY TRANSFER AT PUBLICLY FUNDED RESEARCH INSTITUTIONS
Inaugural Baseline Study: 2008-2014
NOTES

ISBN: 978-0-621-45025-5
RP355/2016