South Africa’s energy future: Visions, driving factors and ... · Visions, driving factors and...
43
South Africa’s energy future: Visions, driving factors and sustainable development indicators Prepared by OGUNLADE DAVIDSON and HARALD WINKLER Report for Phase I of the Sustainable Development and Climate Change project August 2003 ENERGY & DEVELOPMENT RESEARCH CENTRE University of Cape Town
Transcript of South Africa’s energy future: Visions, driving factors and ... · Visions, driving factors and...
South Africa’s energy future: Visions, driving factors and sustainable
development indicators
Prepared by OGUNLADE DAVIDSON and HARALD WINKLER
Report for Phase I of the Sustainable Development and Climate Change project
August 2003 ENERGY & DEVELOPMENT RESEARCH CENTRE
University of Cape Town
CONTENTS
1. Introduction 1
2. Overview of the South African energy sector 1 2.1 Liquid fuels and gas 4
2.1.1 Refining and downstream petroleum activities 4 2.1.2 Synthetic fuels 5 2.1.3 Oil and gas exploration 5 2.1.4 Production 6
3. Existing energy policy objectives 7 3.1 Energy in the NEPAD context 7 3.2 Energy in the SADC context 7 3.3 Energy in the broader South African policy context 8 3.4 Energy policy objectives and progress 9 3.5 Importance of energy to climate change mitigation 12
4. Driving forces for the energy future 16 4.1 General factors 16
4.1.1 Development first 16 4.1.2 Globalisation and economic trends 16 4.1.3 Power sector reform 16 4.1.4 Local technology development 17 4.1.5 Demographic trends 17
4.2 Energy-specific drivers 18 4.2.1 Access to affordable modern energy services 18 4.2.2 Reducing local environmental impacts 19 4.2.3 Job creation 19 4.2.4 Black economic empowerment 19 4.2.5 Building local manufacturing capacity 19 4.2.6 Coal exports 19 4.2.7 Energy-intensive industry 19 4.2.8 Energy security through diversity of supply 19
4.3 Future energy sector outlook 20 4.3.1 Energy demand 20 4.3.2 Energy efficiency 20 4.3.3 Energy supply 21
5. Assessment of existing energy scenarios 22 5.1 National Integrated Resource Plan (IRP) 22 5.2 Integrated Energy Plan (IEP) 23 5.3 Future electricity scenarios 23 5.4 Scenarios combining renewable energy and energy efficiency 24 5.5 Energy scenario in Foresight Study 27 5.6 Lessons on SA energy scenarios 28
6. Visions of energy futures 28
ENERGY & DEVELOPMENT RESEARCH CENTRE
6.1 Current development trends 28 6.2 Increased fuel diversity and energy efficiency 29 6.3 The SADC option 29 6.4 Renewable energy 29
6.4.1 Renewable energy for grid electricity generation 30 6.4.2 Solar water heaters 30 6.4.3 Off-grid electricity 30
6.5 Energy efficiency 31 6.5.1 Industrial energy efficiency 32 6.5.2 National electricity efficiency 32 6.5.3 Transport: better public transport and planning 33 6.5.4 Bio-fuel 33
6.6 The nuclear option 33
7. Sustainable development indicators for energy development 34 7.1 Sustainble energy and sustainable development 34 7.2 Sustainable development Indicators 34
7.2.1 SD indicators for CDM projects 34
8. Conclusion: En ergy policy questions for further analysis 36
References 37
South Africa’s energy future 1
ENERGY & DEVELOPMENT RESEARCH CENTRE
1. Introduction The Sustainable Development and Climate Change Project is an initiative of 12 institutes from developing and developed countries. The project aims at meeting the challenges of sustainable development and climate change in an integrated way that will assist developing countries to advance their development priorities and at the same time respond to the global challenge of climate change.
South Africa is one of the six countries involved in the project (others are Senegal, Bangladesh, Brazil, India and China), and this paper takes the first steps to identify promising policy options for a transition to long-term sustainable development in South Africa. It sets the context for further analysis (in Phase 2) of energy development policies and strategies that both meet the development priorities of South Africa and address climate change.
The paper first locates energy in the broader national policy context, highlighting major assumptions and constraints that will shape any policy. For energy policy more specifically, it recalls the major objectives of energy policy. It then identifies driving forces for energy futures – in general, and those specific to the energy sector. Section 3 outlines different visions of energy futures in South Africa. These energy futures might be analysed using indicators for sustainable development outlined in the following section. The paper concludes by posing key energy policy questions to be examined in Phase 2.
2. Overview of the South African energy sector The South African energy sector has been, and continues to be, at the centre of the country’s development. The origins of the electricity supply industry in the first years of the twentieth century, for example, were driven by the needs of the booming mining industry. Later, the development of a local nuclear capacity reflected concerns for power supply security. In the 1950s the apartheid government decided to develop a synthetic petroleum industry to as a response to threats to crude oil imports. Today, with the present government’s focus on widening household access to electricity, making modern energy services more equitable and also affordable for the poor, increasing empowerment of the dis-advantaged in the energy sector, the sector remains at the heart of structural developments in the economy.
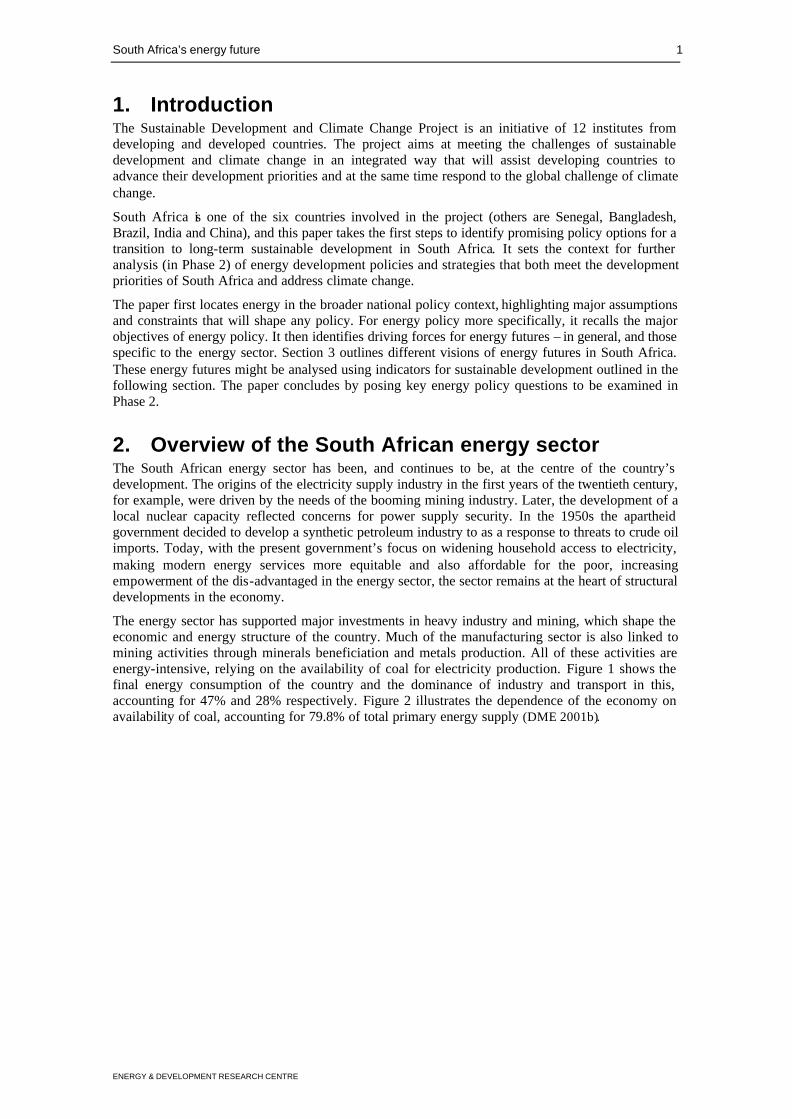
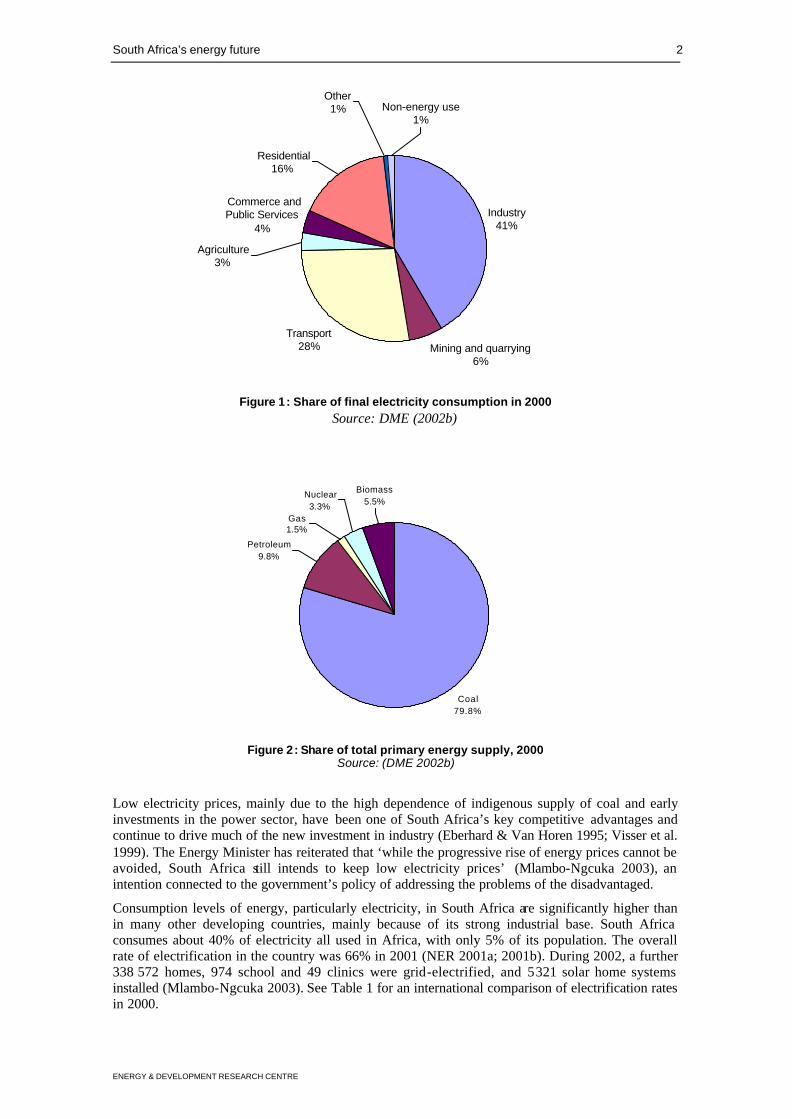
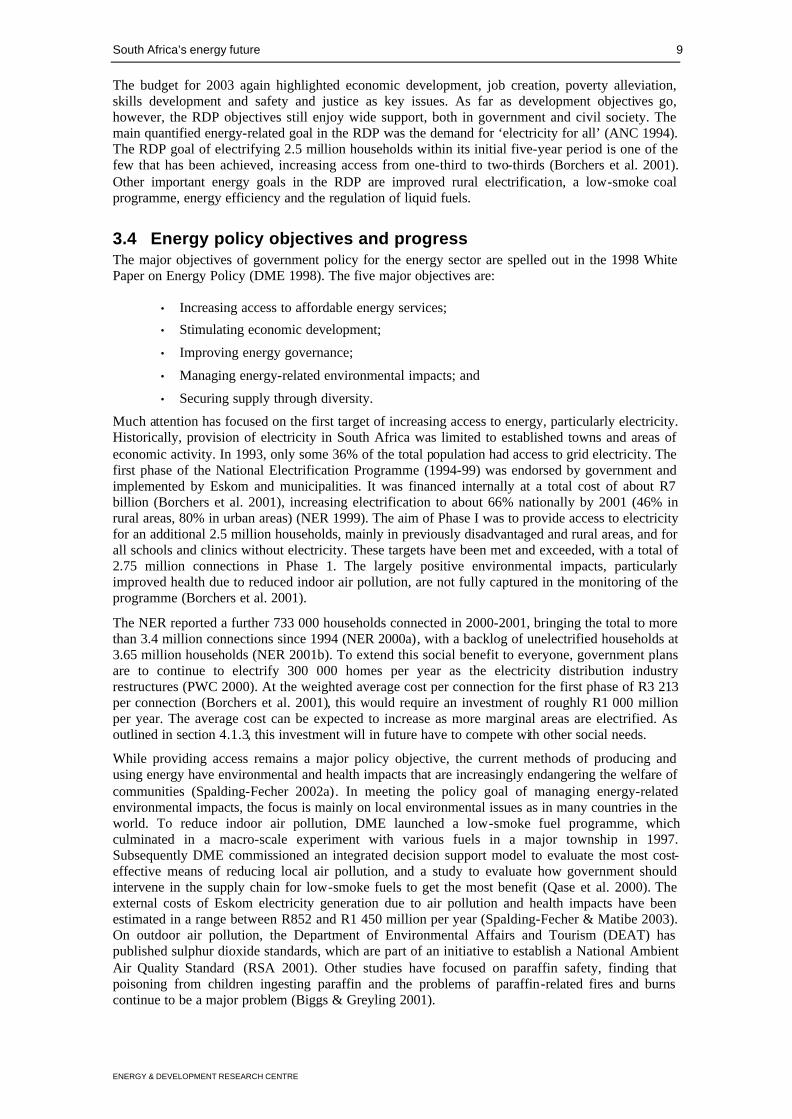
The energy sector has supported major investments in heavy industry and mining, which shape the economic and energy structure of the country. Much of the manufacturing sector is also linked to mining activities through minerals beneficiation and metals production. All of these activities are energy-intensive, relying on the availability of coal for electricity production. Figure 1 shows the final energy consumption of the country and the dominance of industry and transport in this, accounting for 47% and 28% respectively. Figure 2 illustrates the dependence of the economy on availability of coal, accounting for 79.8% of total primary energy supply (DME 2001b).
South Africa’s energy future 2
ENERGY & DEVELOPMENT RESEARCH CENTRE
Industry41%
Mining and quarrying6%
Transport28%
Commerce and Public Services
4%
Other1%
Residential16%
Agriculture3%
Non-energy use1%
Figure 1: Share of final electricity consumption in 2000
Source: DME (2002b)
Coal79.8%
Biomass5.5%
Gas1.5%
Nuclear3.3%
Petroleum9.8%
Figure 2: Share of total primary energy supply, 2000
Source: (DME 2002b)
Low electricity prices, mainly due to the high dependence of indigenous supply of coal and early investments in the power sector, have been one of South Africa’s key competitive advantages and continue to drive much of the new investment in industry (Eberhard & Van Horen 1995; Visser et al. 1999). The Energy Minister has reiterated that ‘while the progressive rise of energy prices cannot be avoided, South Africa still intends to keep low electricity prices’ (Mlambo-Ngcuka 2003), an intention connected to the government’s policy of addressing the problems of the disadvantaged.
Consumption levels of energy, particularly electricity, in South Africa are significantly higher than in many other developing countries, mainly because of its strong industrial base. South Africa consumes about 40% of electricity all used in Africa, with only 5% of its population. The overall rate of electrification in the country was 66% in 2001 (NER 2001a; 2001b). During 2002, a further 338 572 homes, 974 school and 49 clinics were grid-electrified, and 5 321 solar home systems installed (Mlambo-Ngcuka 2003). See Table 1 for an international comparison of electrification rates in 2000.
South Africa’s energy future 3
ENERGY & DEVELOPMENT RESEARCH CENTRE
South Africa’s energy intensity – the amount of energy per unit of economic output, and a function of both economic structure and the energy efficiency of individual sectors – is high (see Table 2) due to the large share of energy-intensive activities within the economy, based on the historical development of the economy around the ‘minerals-energy complex’ (Fine & Rustomjee 1996). Compared to an industrialising nation like South Korea, SA energy intensity is high per GDP, but similar if adjusted for power purchasing parity; and per capita consumption of primary energy is lower. South Africa’s intensity is more comparable to that of Indonesia, albeit at a higher level of primary energy and electricity consumption per capita. There is room for energy efficiency improvements, when compared to other middle-income countries. Areas for such improvements, and also requiring high amounts of energy per unit of output, include mining, iron and steel, aluminium, ferrochrome, and chemicals – the same sectors that make up a large share of South African exports. The abundance of cheap coal for generation has provided little incentive for efficient use of energy, and the specific energy efficiency of many sectors is low by international comparison; for example, energy intensity for iron and steel improved from 40 TJ per ton of steel in 1971 to 30 TJ/t in 1991, but in Taiwan the improvement was from 31 to 14 TJ/t. In gold mining, while annual production has been generally declining since the 1970s, the input of energy per unit (TJ/ton) has shown an increasing trend. However, effective comparison of intensity levels would require more details regarding resource endowment, type of mining and industrial processes.
Table 1: Electrification rates in 2000 Source: IEA (2002b)
Electrification rate
Population without electricity
Population with electricity
% million million
South Africa 66.1 14.5 28.3
Africa 34.3 522.3 272.7
South Korea
Indonesia 53.4 98.0 112.4
Developing countries 64.2 1 34.2 2 930.7
OECD 99.2 8.5 1108.3
World 72.8 1644.5 4 390.4
Table 2: Energy consumption and intensity indicators, 2000 Source: IEA (2002a)
TPES/capita TPES/GDP TPES/GDP Elec. consumption per capita (national average)
Toe/capita toe/000 1995 US$
Toe/ 000 PPP 1995 US$
kWh/capita
South Africa 2.51 0.63 0.29 4 533
Africa 0.64 0.86 0.32 501
South Korea 4.10 0.31 0.30 5 901
Indonesia 0.69 0.70 0.25 390
Non-OECD 0.96 0.74 0.28 1 028
OECD 4.78 0.19 0.22 8 090
World 1.67 0.30 0.24 2 343
Key: TPES = total primary energy supply, toe = tonnes of oil equivalent, PPP = purchasing power parity (i.e. adjusted to remove distortions of exchange rates), GDP = Gross domestic product
South African industry at present depends largely on primary extraction and relatively low-grade processing, making it a heavy user of energy; but as it diversifies into higher technology manufacturing and processing, its energy intensity should reduce. However, international trends show that countries like South Africa become receptors of energy-intensive investment as developed
South Africa’s energy future 4
ENERGY & DEVELOPMENT RESEARCH CENTRE
countries shed them in favour of more service-oriented and lucrative activites. Recent investments in aluminium smelters and iron and steel mills, and the SAPP strategy, suggest the trends in the country’s industrial future.
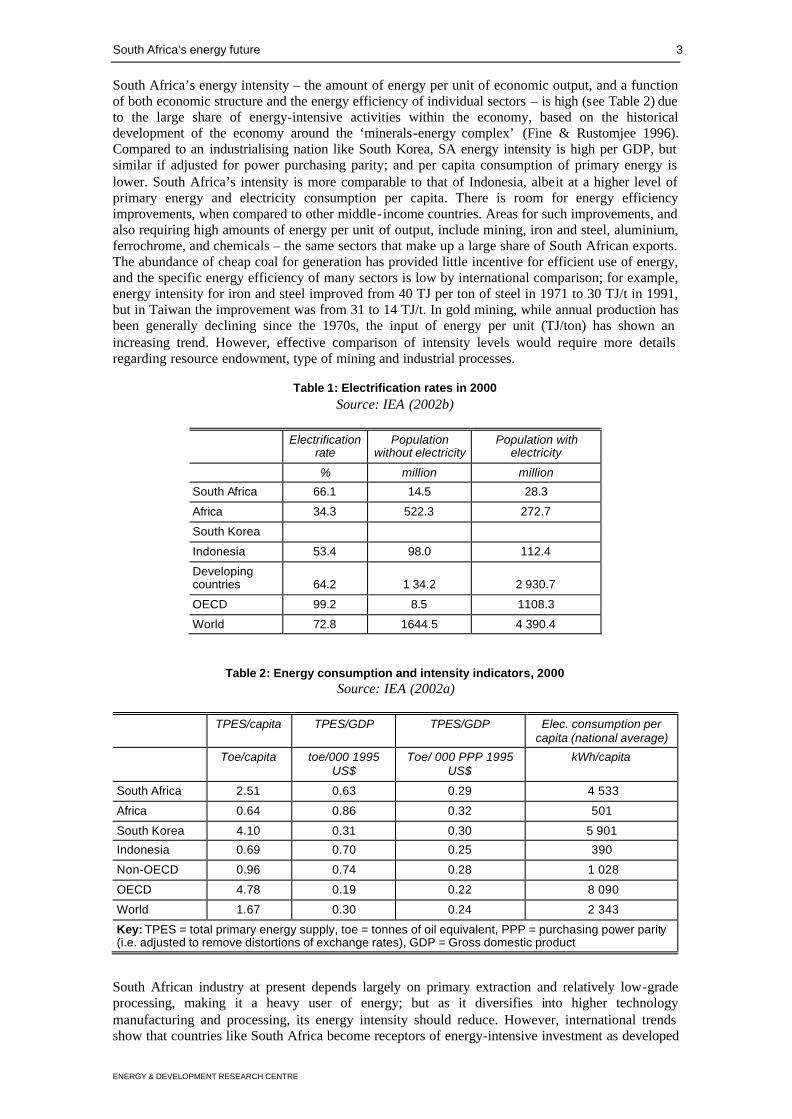
The electricity supply sector plays a pivotal role in the South African energy economy. Its importance lies both in improving the quality of life for the previously disadvantaged majority as well as supporting large-scale industrial development. As Figure 3 shows, electricity makes up 22% of final energy demand in South Africa, following coal and liquid fuels (DME 2000). (Upstream, 93% of electricity is generated from coal-fired power stations.) This share underplays the role of electricity, however, as a high quality energy carrier and as a critical input to key economic sectors. On the industry and manufacturing side, the electricity-intensive industries are some of the largest contributors to both economic growth and exports, and take up more than 60% of national electricity sales (Trollip 1996; Berger 2000; DME 2000).
Liquid fuels &gas 28%
Coal 33%
Electricity22%
Biomass 17%
Figure 3: Share of final energy demand by energy carrier
Source: SANEA (1998) On the household side, providing electricity to previously disadvantaged communities has been one of the more successful elements of the government’s Reconstruction and Development Programme (ANC 1994; Borchers et al. 2001). Access to affordable electricity, through a mass electrification drive, was a key policy priority in the White Paper on Energy Policy (DME 1998).
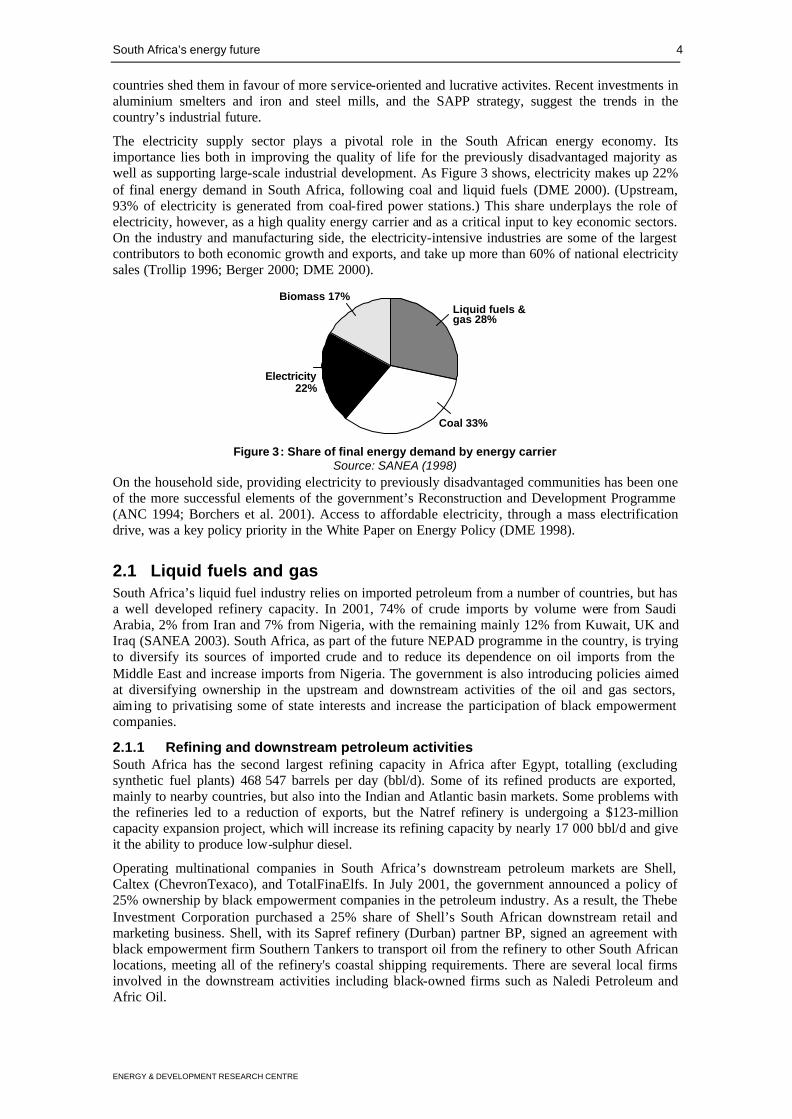
2.1 Liquid fuels and gas South Africa’s liquid fuel industry relies on imported petroleum from a number of countries, but has a well developed refinery capacity. In 2001, 74% of crude imports by volume were from Saudi Arabia, 2% from Iran and 7% from Nigeria, with the remaining mainly 12% from Kuwait, UK and Iraq (SANEA 2003). South Africa, as part of the future NEPAD programme in the country, is trying to diversify its sources of imported crude and to reduce its dependence on oil imports from the Middle East and increase imports from Nigeria. The government is also introducing policies aimed at diversifying ownership in the upstream and downstream activities of the oil and gas sectors, aiming to privatising some of state interests and increase the participation of black empowerment companies.
2.1.1 Refining and downstream petroleum activities South Africa has the second largest refining capacity in Africa after Egypt, totalling (excluding synthetic fuel plants) 468 547 barrels per day (bbl/d). Some of its refined products are exported, mainly to nearby countries, but also into the Indian and Atlantic basin markets. Some problems with the refineries led to a reduction of exports, but the Natref refinery is undergoing a $123-million capacity expansion project, which will increase its refining capacity by nearly 17 000 bbl/d and give it the ability to produce low-sulphur diesel.
Operating multinational companies in South Africa’s downstream petroleum markets are Shell, Caltex (ChevronTexaco), and TotalFinaElfs. In July 2001, the government announced a policy of 25% ownership by black empowerment companies in the petroleum industry. As a result, the Thebe Investment Corporation purchased a 25% share of Shell’s South African downstream retail and marketing business. Shell, with its Sapref refinery (Durban) partner BP, signed an agreement with black empowerment firm Southern Tankers to transport oil from the refinery to other South African locations, meeting all of the refinery's coastal shipping requirements. There are several local firms involved in the downstream activities including black-owned firms such as Naledi Petroleum and Afric Oil.
South Africa’s energy future 5
ENERGY & DEVELOPMENT RESEARCH CENTRE
Recent proposed amendments to the Petroleum Products Act would allow synthetic fuel producers Sasol and PetroSA to enter the retail market. In August 2001, Sasol signed an agreement with Petromoc, Mozambique's state-owned oil marketing and distribution firm, to market petroleum products to Mozambican service stations and commercial customers. The joint venture also plans to develop service stations in Mozambique.
As a result of the privatisation in the gas distribution sector in August 2000, a consortium led by the US-based Cinergy and a black empowerment group, Egoli Empowerment Holdings, purchased Johannesburg’s Metro Gas Company and renamed it as Egoli Gas. In September 2000, the consortium signed a 20-year contract with Sasol Gas to supply 2.5 million cubic feet of gas to Johannesburg area with an option to increase to 7 million cubic feet per year. Other natural gas projects planned are to pipe gas from the Kudu field to Cape Town, where it will supply fuel for a 1 200-2 000 megawatt (MW) power station, possibly extending the pipeline to the PetroSA synfuel facilit ies at Mossel Bay. Sasol and Belgian-based Tractebel have signed a memorandum of understanding for the development of gas-fired co-generation in South Africa (African Energy 2001).
2.1.2 Synthetic fuels The highly developed synthetic fuels industry, developed to meet South Africa’s fuel needs in the years of apartheid isolation, is involved in the country's abundant coal resources and offshore natural gas and condensate production in Mossel Bay. The two major players are Sasol (coal-to-oil/chemicals) and PetroSA (natural gas-to-petroleum products). Sasol has the capacity to produce 150 000 bbl/d, and PetroSA produces 45 000 bbl/d – respectively 23% and 7% of South Africa’s requirements (SANEA 2003).
Sasol is the world's largest manufacturer of oil from coal, with coal liquefaction plants located at Secunda (oil) and Sasolburg (petrochemicals). Started by the government in the 1950s to reduce the country’s dependence on imported oil, the company was privatised in 1979. In 1996, Sasol upgraded and expanded its programme in Secunda so as to become competitive. In early 2000, Sasol started working on the feasibility of replacing coal with natural gas, a switch which it estimates will reduce investment expenditures in its coal-mining operations and the high costs of compliance with environmental regulations associated with coal. This project is expected to start delivering natural gas in the first half of 2004 and it includes connecting Pande and Temane gas fields in Mozambique to Secunda through a 865-kilometre pipeline. Sasol will use its existing pipeline-gas network to supply natural gas to industries and its own facilities, and will switch its Sasolburg plants from coal to gas feedstock. The pipeline will be owned by a joint venture between Sasol and the South African and Mozambican states. Provisions have made for the future inclusion of black empowerment shareholders as well as other privatisation initiatives (Sasol 2002).
PetroSA, the Petroleum Oil and Gas Corporation of South Africa, was launched in October 2002 as a upstream company for all South Africa’s government-owned oil and gas holdings. In line with the recommendations of the Energy White Paper, it resulted from the merger of state-owned Soeker and Mossgas as well as other assets that were managed by the Strategic Fuel Fund. The PetroSA plant receives feedstocks of natural gas and condensate from gas fields in Mossel Bay through a pair of 91-kilometer pipelines. The facility also has the ability to process up to 8 000 bbl/d of imported condensate. The onshore plant is situated approximately 13 kilometres west of Mossel Bay. PetroSA converts the gas into a variety of liquid fuels including motor gasoline, distillates, kerosene, alcohols and LPG. PetroSA is also active in Gabon, Nigeria and Alg eria, and in the Middle East. At present, it is an active trader and provider of oil and chemicals to over 40 countries.
2.1.3 Oil and gas exploration PetroSA plans to concentrate its exploration efforts on South Africa’s western and southern coasts. The FA, EM and EBF natural gas fields currently supply feedstocks to the PetroSA synfuel facility. Oribi, the first significant and commercially viable oil discovery in Block 9, in the Bredasdorp Basin, was made in 1990. Two other significant finds, Oryx and Sable, have been made in the block. PetroSA, and its Sable field partner Pioneer Natural Resources (Pioneer), announced the results of their Boomslang discovery in February 2001. The find, located on the southern portion of Block 9, tested at a combined rate of 3 120 bbl/d of oil, 26 million cubic feet of natural gas per day (Mmcf/d), and 300 bbl/d of condensate. PetroSA and Pioneer plan to drill additional wells on Boomslang, as well as on the EBB discovery. EBB, discovered in 1991, originally tested at 46 Mmcf/d of natural gas and 1 830 bbl/d of condensate. Pioneer also holds the rights to offshore Block 7 (Petroleum Agency 2001).
South Africa’s energy future 6
ENERGY & DEVELOPMENT RESEARCH CENTRE
Two natural gas discoveries are located on Block 11A, which lies east of Block 9. PetroSA made the Ga-A find in 1969. The discovery had a combined flow rate of 24 Mmcf/d from two reservoirs. The Ga-Q field was discovered in 1983, and it had an initial test flow rate of 11.4 Mmcf/d. Additional appraisal drilling is planned on Block 11A.
A natural gas discovery was made in March 2000 in Block 2, off South Africa's western coast and close to the border with Namibia. The find is reportedly part of a reservoir which extends to the Kudu prospect off the coast of Namibia. Kudu’s potential reserves are estimated at 20 trillion cubic feet (tcf). Denver-based Forest Oil Corporation reported that the find, AK-1, flowed at a rate of 52.8 Mmcf/d of natural gas and 342 bbl/d of condensate. Forest’s initial estimates placed recoverable reserves at 200 billion cubic feet (bcf) of natural gas. Forest drilled three appraisal wells in 2000-2001, of which two were successful. One appraisal well flowed at 71.4 Mmcf/d of natural gas and 1 376 bbl/d of condensate, while the other had flows of 53 Mmcf/d and 182 bbl/d respectively. Forest revised its estimate of total reserves for the discovery, renamed the Ibhubezi field, to 2.5 tcf. Forest stated that production, which may be channelled towards regional electricity production, is not expected to begin prior to 2004. Forest, and its partner, Denver-based Anschutz Overseas Corporation, control 70% and 30% respectively of South Africa’s Blocks 1 and 2. In September 2000, Forest and Anschutz offered a 10% share in both blocks to South African firm Mvelaphanda Holdings, in accordance with a governmental directive encouraging black participation in the upstream sector (Petroleum Agency 2001).
South Africa's recent offshore success is sparking interest in further developments. Sasol holds the rights to Blocks 3A and 4A, which are adjacent to the West Coast and south of Forest’s holdings. In February 2002, Colorado-based Global Energy Holdings announced the formal approval of its prospecting agreement for Block 3B/4B from the DME and the South African Agency for Promotion of Petroleum Exploration and Exploitation. The seven and one-half year agreement for Block 3B/4B covers 29 000 square kilometres off the western coast in waters ranging in depth from 300 to 1 200 metres). In January 2002, Petroleum Geo-Services and the Petroleum Agency announced a joint cooperation agreement to promote deepwater exploration acreage in South Africa. The area, Block 2B and acreage west of Blocks 5 and 6, contains 160 000 square kilometres. PGS will shoot and market 2D seismic data, with the survey commencing in the first half of 2002.
2.1.4 Production The Oribi oil field began production from a floating production, storage and offloading vessel (FPSO) in May 1997 – South Africa's first conventional oil production. The field currently produces a light oil (API 42º) at the rate of 10 000 bbl/d with 15 Mmcf/d of associated gas, which is flared. The Oryx oil field lies six kilometres from the Oribi field and was tied back to the Oribi’s FPSO production facility. Oryx began production in May 2000, and currently produces at 12 000 bbl/d. The Oryx reservoir is similar in type and age to Oribi. Combined, the Oribi and Oryx fields have to date produced over 23 million barrels of oil.
PetroSA and Pioneer announced plans for the development of the Sable field in June 2001. The field will be developed with six subsea wells tied back to a FPSO. The FPSO will have the capacity to process 60 000 bbl/d of oil, re-inject 80 Mmcf/d of natural gas and recover natural gas liquids. Production of 40 000 bbl/d is expected to begin in the first quarter of 2003. Total recoverable oil reserves are estimated to be 25 million barrels. Associated gas, which will be re-injected to improve liquids recovery, may be recovered at a later date as part of a planned natural gas development project.
The FA natural gas field currently produces at a rate of 194 Mmcf/d gas and 9 500 bbl/d of condensate. The FA production platform is one of the largest single structures ever constructed in South Africa. Nine production wells have been drilled from the platform. Four production wells on the FAR and FAH satellite gas fields are linked to the platform by subsea systems. The production wells on the EM and EBF gas fields are connected to the FA platform by a 52-kilometer 18 inch diameter pipeline that has been designed for the future tie-in of other gasfields in the area.
South Africa’s energy future 7
ENERGY & DEVELOPMENT RESEARCH CENTRE
3. Existing energy policy objectives
3.1 Energy in the NEPAD context The New Partnership for Africa’s Development (NEPAD) is a pledge by African leaders to address the need to eradicate poverty and put African countries on a path of sustainable growth and development (NEPAD 2001). NEPAD will operate as a partnership with external and African efforts. The major objectives set for energy are as follows:
• To increase African’s access to reliable and affordable commercial energy supply from 10-30% or more within 20 years.
• To improve the reliability and lower the cost of energy supply to productive activities in order to enable economic growth to 6% pa.
• To reverse the environmental degradation that is associated with the use of tradit ional fuels in rural areas.
• To exploit and develop the hydropower potential of Africa.
• To integrate transmission grids and gas pipelines so as to facilitate cross-border energy flows
• To reform and harmonise petroleum regulations and legislation on the continent
• Capacity building to strengthen the African Energy Commission (AFREC) and its sub-regional organisations
NEPAD’s Energy Infrastructure Initiative will include power system and gas/oil projects that are ready for implementation. In addition, studies will be undertaken for physical projects that will be implemented in the medium-to-long term.
Of immediate relevance to South Africa’s energy development paths is the opportunity for greater interconnection within the Southern African Power Pool (SAPP). Also, within the NEPAD framework, South Africa intends to substantially increase its share of oil imports from Nigeria, and to work with other African countries in further development of the huge hydropower potential of Inga Falls in the Democratic Republic of Congo. The existing operations of energy institutions in Africa are expected to expand under the NEPAD framework. These include the operations of Eskom that already involve 39 of the 53 countries in the continent. The similar activities of Sasol and PetroSA are also included.
3.2 Energy in the SADC context The Southern African Development Community (SADC) is an intergovernmental legal entity grouping fourteen southern African States (Angola, Botswana, the Democratic Republic of Congo, Lesotho, Malawi, Mauritius, Mozambique, Namibia, Seychelles, South Africa, Swaziland, Tanzania, Zambia and Zimbabwe), committed to equitable economic integration and sustainable development. A SADC paper prepared for the World Summit on Sustainable Development stated that: ‘The SADC member states have noted with concern the current impact and potential future impacts of climate change on the region, particularly sea level rise and extreme weather events such as floods and droughts’ (SADC 2001a). Platforms for SADC cooperation in energy have been set through the 1982 and 1992 policy documents entitled Towards an energy policy in Southern Africa which has been translated into the SADC protocol on energy and signed by all member states in 1996 (SADC 1996).
Given the central role energy plays in the socio-economic development of the SADC region, and the possible negative environmental impacts of fossil fuels and use of biogas, there is need to continue to explore opportunities in research and development of alternative sources of energy, including solar power, wind power, pumped storage and hydropower schemes, as well as cleaner coal technologies, efficiency of energy supply and usage and indigenous technologies (SADC 2001b). Recent discoveries of gas off Namibia, Mozambique and Tanzania are important for the region. Another untapped potential is the flaring of gas in Angola, reportedly able to generate 30 000 MW of power, equivalent to almost 71% of the current power generation of Eskom (Venter 2001). Another area that is of interest to SADC is to optimise electricity use by reducing the spare capacity in the region that is estimated to be about 11 000 MW. SAPP aims to address this issue by introducing competitive schemes among member countries.
South Africa’s energy future 8
ENERGY & DEVELOPMENT RESEARCH CENTRE
The degree to which South Africa’s energy future integrates into broader regional development depends on choices made. Regional development could be significantly enhanced if South Africa explores energy development paths that either (i) include significant increases in imported hydro-electricity, or (ii) construct more gas pipelines within the region, especially from Namibia and Angola. However, political stability in the region is a critical pre-condition for economic development.
3.3 Energy in the broader South African policy context A central driver for policy in South Africa is to redress the imbalance of apartheid and to promote the socio-economic development of poor and disadvantaged communities. (See Table 3 for an international comparison of income disparities.) Many of the detailed development objectives were set in the African National Congress’ Reconstruction and Development Programme (RDP) (ANC 1994). It outlined job creation through public works and meeting a range of basic needs as key priorities. These overall development objectives set the context for energy policy as well. However, the RDP has been superseded by a new macro-economic policy, the Growth, Employment and Redistribution (GEAR) strategy (DTI 1996). As the name suggests, GEAR emphasised growth and jobs, while still seeking to redistribute resources. GEAR highlights the financial constraints on achieving development objectives. Sector-specific government policy can be found in a range of White Papers that have been developed since the first democratic elections in 1994. The long-term vision of GEAR emphasises economic and social goals (DTI 1996):
• a competitive, fast-growing economy which creates sufficient jobs for all work-seekers;
• a redistribution of income and opportunities in favour of the poor;
• a society in which sound health, education and other services are available to all; and
• an environment in which homes are secure and places of work are productive.
GEAR thus at least in principle includes some of the social development objectives of the RDP; however, its focus in explicitly macro-economic and social goals is referenced to the earlier document. Social goals are not elaborated in great detail in GEAR, but include
• education: sustained improvement in public school, and increasing enrolment in secondary schools
• health: universal and free access to comprehensive primary care, shifting resources from urban, tertiary institutions toward rural, primary clinics
• housing: accelerating labour-intensive delivery of housing
• improved water and sanitation
• land reform combined with support for emergent farmers. (DTI 1996: Chapter 6)
Table 3: Population and income, 1999
Population GNP per capita Gini coefficient
Millions $ PPP 1999 Index (year of survey)
South Africa 42.1 8 318 59.3 (1993-4)
Africa 642.3 1 450
South Korea 46.8 14 637 31.6 (1993)
Indonesia 207.0 2 439 36.5 (1996)
Low income 2 417.0 1 790
High income 890.9 25 730
World 5 974.9 4 890
Source: World Bank (2000). Note: the Gini coefficient is a measure of the extent to which the distribution of income among individuals or households deviates from a perfectly equal distribution. Zero would be perfect equality, 100 perfect inequality.
South Africa’s energy future 9
ENERGY & DEVELOPMENT RESEARCH CENTRE
The budget for 2003 again highlighted economic development, job creation, poverty alleviation, skills development and safety and justice as key issues. As far as development objectives go, however, the RDP objectives still enjoy wide support, both in government and civil society. The main quantified energy-related goal in the RDP was the demand for ‘electricity for all’ (ANC 1994). The RDP goal of electrifying 2.5 million households within its initial five-year period is one of the few that has been achieved, increasing access from one-third to two-thirds (Borchers et al. 2001). Other important energy goals in the RDP are improved rural electrification, a low-smoke coal programme, energy efficiency and the regulation of liquid fuels.
3.4 Energy policy objectives and progress The major objectives of government policy for the energy sector are spelled out in the 1998 White Paper on Energy Policy (DME 1998). The five major objectives are:
• Increasing access to affordable energy services;
• Stimulating economic development;
• Improving energy governance;
• Managing energy-related environmental impacts; and
• Securing supply through diversity.
Much attention has focused on the first target of increasing access to energy, particularly electricity. Historically, provision of electricity in South Africa was limited to established towns and areas of economic activity. In 1993, only some 36% of the total population had access to grid electricity. The first phase of the National Electrification Programme (1994-99) was endorsed by government and implemented by Eskom and municipalities. It was financed internally at a total cost of about R7 billion (Borchers et al. 2001), increasing electrification to about 66% nationally by 2001 (46% in rural areas, 80% in urban areas) (NER 1999). The aim of Phase I was to provide access to electricity for an additional 2.5 million households, mainly in previously disadvantaged and rural areas, and for all schools and clinics without electricity. These targets have been met and exceeded, with a total of 2.75 million connections in Phase 1. The largely positive environmental impacts, particularly improved health due to reduced indoor air pollution, are not fully captured in the monitoring of the programme (Borchers et al. 2001).
The NER reported a further 733 000 households connected in 2000-2001, bringing the total to more than 3.4 million connections since 1994 (NER 2000a), with a backlog of unelectrified households at 3.65 million households (NER 2001b). To extend this social benefit to everyone, government plans are to continue to electrify 300 000 homes per year as the electricity distribution industry restructures (PWC 2000). At the weighted average cost per connection for the first phase of R3 213 per connection (Borchers et al. 2001), this would require an investment of roughly R1 000 million per year. The average cost can be expected to increase as more marginal areas are electrified. As outlined in section 4.1.3, this investment will in future have to compete with other social needs.
While providing access remains a major policy objective, the current methods of producing and using energy have environmental and health impacts that are increasingly endangering the welfare of communities (Spalding-Fecher 2002a). In meeting the policy goal of managing energy-related environmental impacts, the focus is mainly on local environmental issues as in many countries in the world. To reduce indoor air pollution, DME launched a low-smoke fuel programme, which culminated in a macro-scale experiment with various fuels in a major township in 1997. Subsequently DME commissioned an integrated decision support model to evaluate the most cost-effective means of reducing local air pollution, and a study to evaluate how government should intervene in the supply chain for low-smoke fuels to get the most benefit (Qase et al. 2000). The external costs of Eskom electricity generation due to air pollution and health impacts have been estimated in a range between R852 and R1 450 million per year (Spalding-Fecher & Matibe 2003). On outdoor air pollution, the Department of Environmental Affairs and Tourism (DEAT) has published sulphur dioxide standards, which are part of an initiative to establish a National Ambient Air Quality Standard (RSA 2001). Other studies have focused on paraffin safety, finding that poisoning from children ingesting paraffin and the problems of paraffin-related fires and burns continue to be a major problem (Biggs & Greyling 2001).
South Africa’s energy future 10
ENERGY & DEVELOPMENT RESEARCH CENTRE
Energy-related environmental impacts are also governed by environmental legislation. Of particular note are the National Environmental Management Act and, for air pollution, the Atmospheric Pollution Prevention Act. DEAT published sulphur dioxide standards for comment, which are part of an initiative to establish a National Ambient Air Quality Standard (RSA 2001). Institutional requirement are probably the key constraint to effective implementation. The co-ordination and effective communication between different national departments (DME, Transport and DEAT) as well as different levels of government will also be necessary. Without compliance and enforcement mechanisms, regulations are not meaningful. Accurate monitoring of emissions may soon be required through the mechanisms created in the National Air Quality Management Bill, as well as ensuring that such information is widely disseminated.
The Energy Minister has made clear that South Africa intends ‘to use every energy source optimally: coal, gas, oil, nuclear and renewable energy’ (Mlambo-Ngcuka 2003). Starting from a coal-dominated base, the initial focus in terms of securing supply through diversity has been on importing natural gas from Mozambique and possibly Namibia, as well as more recent finds off South Africa (Marrs 2000a, 2000b; DME 2001b). The first gas to be delivered via a pipeline from the Pande and Temane fiels in Mozambique to Sasol’s plant in Secunda is scheduled for 15 February 2004 (Mlambo-Ngcuka 2003). These investments – US$1 200 million in the Mozambique project alone (Venter 2001) – could promote a significant shift away from coal as a primary energy source, and provide feedstock for high value added chemicals and the synfuels plants, but focus on gas rather than renewable energy sources.
A proposed Gas Act is intended to lead to the setting up of a Gas Regulator with the aim of strengthening the government’s capacity to govern the energy sector. In the liquid fuels industry, government is phasing out subsidies to Sasol, the coal-to-liquid fuel producer, and removing the requirement of petroleum marketers to buy Sasol liquid fuels, which will reduce the energy intensity of this sector. It is hoped that by 2005, this process of coal to liquid would have been phased as Sasol is expected to be fully involved in importing natural gas from Mozambique. Imports from Namibia are also possible. The amended Petroleum Products Act will change the licensing rules for petrol stations to give government more influence, and the Petroleum Pipelines Bill is expected to establish pricing and access rules for oil and gas pipelines. These will be the first major changes in petroleum sector regulations in many years – and are revisions of regulations rather than full-scale deregulation of the oil industry.
Renewable energy sources are another major option for increasing diversity. The focus has been primarily on increased imports of hydro-electricity from within SAPP as best as possible, if political stability is achieved. Despite some ongoing conflicts over the price of importing electricity, the region’s utilities are working on a combined regional power expansion plan, and Eskom has identified more than 9 000 MW potential for regional imports, even without considering the massive potential of the Grand Inga scheme in the Democratic Republic of Congo, which has the potential of over 40 000 MW in the longer term (Eskom 1997). Regional co-operation on energy development is also a major drive within NEPAD.
The White Paper on Energy Policy included a range of initiatives to promote renewable energy. Much of this effort, however, still is only focused on rural areas, where renewable energy is more financially cost effective than extending the electricity grid (DME 1998). The DME is in the process of releasing a White Paper on Renewable Energy soon to provide the basis for government investment and implementation in this sub-sector (DME 2002a). The Energy Minister announced in her 2003 budget speech that the policy ‘will lead to the subsidization of Renewable Energy and develop a sustainable market share for clean energy’ (Mlambo-Ngcuka 2003).
In addressing renewable energy sources, the White Paper outlines the following challenges:
• Ensuring that economically feasible technologies and applications are implemented through the development and implementation of an appropriate programme of action.
• Ensuring that an equitable level of national resources is invested in renewable technologies, given their potential and compared to investments in other energy supply options.
• Addressing constraints on the development of the renewable energy industry.
However, the cost of renewable energy systems remain a major constraint in introducing a large share of these energy systems into the fuel mix of the country, particularly in the power sector. A
South Africa’s energy future 11
ENERGY & DEVELOPMENT RESEARCH CENTRE
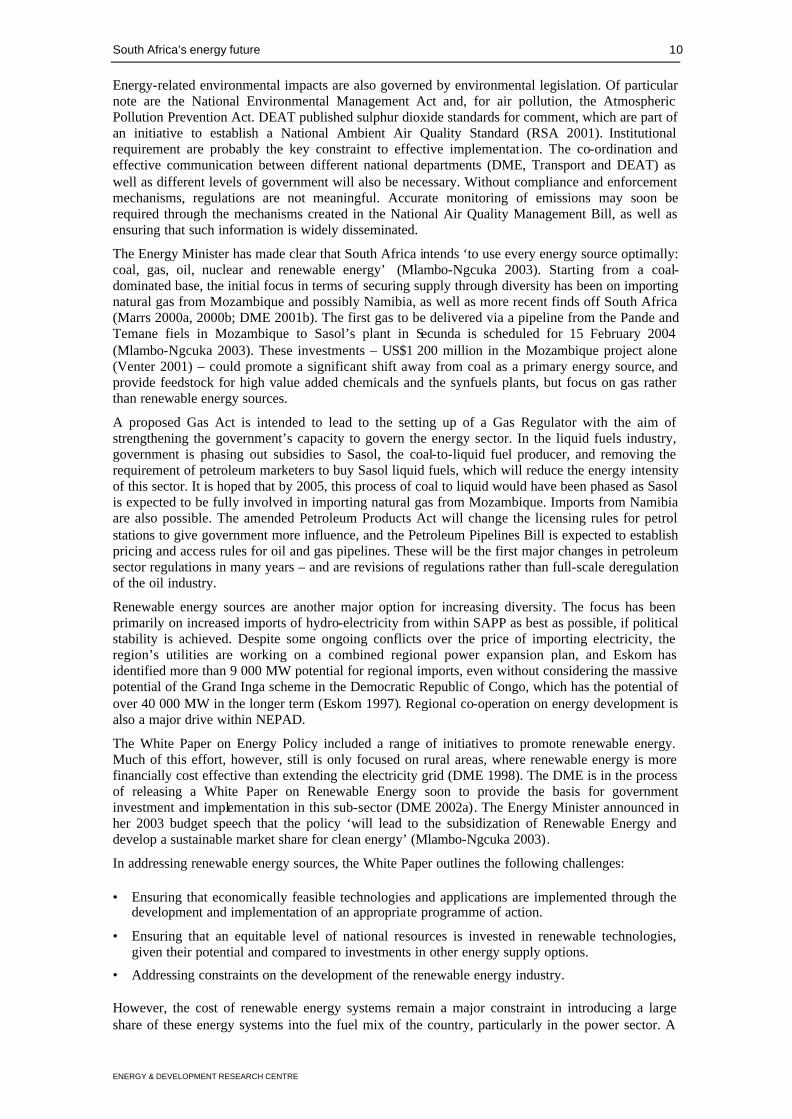
recent study, which compared three scenarios for electricity production that included different shares of renewable energy combined with different energy efficiency measures, came up with some interesting results (EDRC 2003). The three scenarios were economic instruments which yielded 12% renewable energy for electricity generation by 2020, using market mechanisms, the next was policy reform scenario with introduction of set targets of 15% , and the last was intensive policy scenario with target of 25% renewable energy. Figure 4 shows levelised annual investment in the power sector for the different scenarios. Predictably, costs are much higher with the intensive policy scenario. Although intensive policy has an advantage of stronger weighting of social and environmental concerns, reaching 25% renewables share of total power generation by 2020 would be quite costly. The economic instruments and policy reform scenarios show very little change in power sector costs, though a high share of renewable electricity generation. However, in all these scenarios demand-side energy efficiency investments are introduced which reduce the total power capacity required, and these (cost of renewables and energy efficiency cost) were not separated in the study.
0
5,000
10,000
15,000
20,000
25,000
30,000
35,000
40,000
45,000
50,000
2001
2003
2005
2007
2009
2011
2013
2015
2017
2019
To
tal
po
wer
sec
tor
cost
s (R
mil
lio
n)
Base CaseEconomic InstrumentsPolicy ReformIntensive Policy
Figure 4: Power sector costs by scenario
Source: EDRC (2003)
There are now on-going policy interventions to restructure the electricity supply industry. The Eskom Conversion Act of 2001 turned the parastatal utility into a public company. Legislation are progressing to establish electricity distribution and supply industries, but the way in which the restructuring happens in the electricity sector will have significant impact on delivery of services, and the future role of energy efficiency (EE) and renewable energy (Winkler & Mavhungu 2001). Opportunities will exist for independent power producers to sell energy services including renewable energy, but entry into the power market will be difficult as there are many constraints the interests of private investors when revenues are reduced (Clark & Mavhungu 2000).
The White Paper also recognises that significant potential exists for EE improvements in South Africa and that the efficient use of energy is best achieved through the creation of an awareness of the environmental and economic benefits of EE measures and the deployment of incentives to encourage these measures. Government therefore undertakes to promote an awareness campaign amongst industrial and commercial energy consumers and encourage the use of EE practices by this sector, while at the same time implementing an EE programme to reduce consumption in its own installations. In addition, it undertakes to establish EE norms and standards for commercial buildings and industrial equipment as well as promoting the performance of audits, demonstrations, information dissemination, sectoral analyses and training programmes.
In relation to EE in households, the government undertakes to promote EE awareness and facilitate the establishment of relevant standards and codes of practice for the thermal performance of dwellings, the inclusion thereof in building codes and the implementation thereof through appropriate measures. A programme of education is also to be developed dealing with the costs and benefits of building dwellings with good thermal performance and labelling programmes for
South Africa’s energy future 12
ENERGY & DEVELOPMENT RESEARCH CENTRE
domestic appliances will be promoted. Certain detailed policies are also included to increase transport EE, for example, the use of alternative fuels.
3.5 Importance of energy to climate change mitigation Most of South Africa’s greenhouse gas emission are related to the production and consumption of energy. According to SA’s draft Initial National Communication, total emissions of CO2, CH4 and N2O were 379 842 Gg1 CO2 equivalents in 1994 (Van der Merwe & Scholes 1998). This converts to 103.6 million tons of carbon, which can be attributed to major sectors of energy, industry, agriculture and waste.
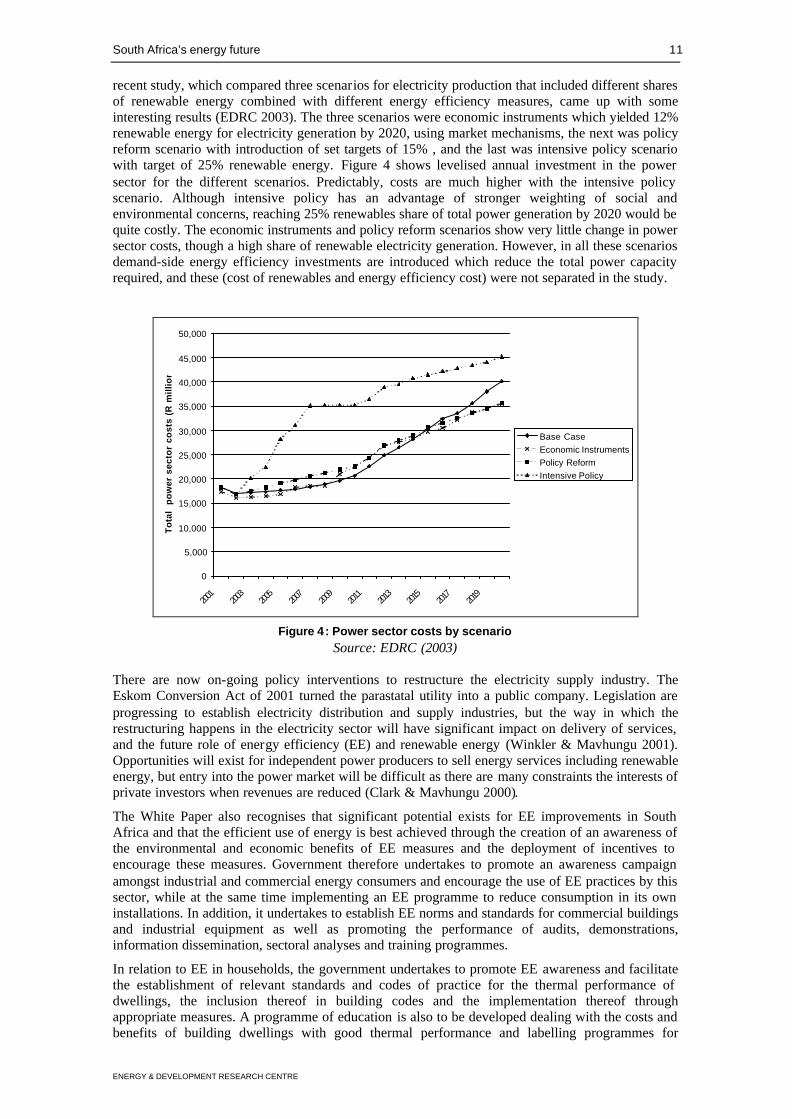
The energy sector, including energy production and use, contributed 78% of GHG emissions in 1994 (297 564 Gg CO2 equivalent), agriculture 9.3%, industrial processes 8.0% and waste 4.3%. Comparing the three GHGs in the inventory, carbon dioxide contributed by far the most, 83.2% in 1994. Methane contributed 11.4% and nitrous oxide 5.4% respectively. The energy sector is a key source of emissions, which include a number of critical energy-related activities such as energy industries (45% of total gross2 emissions), manufacturing and industry (14%), transport (11%), as well as fugitive emissions from fuels (2%), and other energy-related activities (6.6%) – including commercial (0.2%), residential (2.0%) and agricultural (4.4%) use of energy.
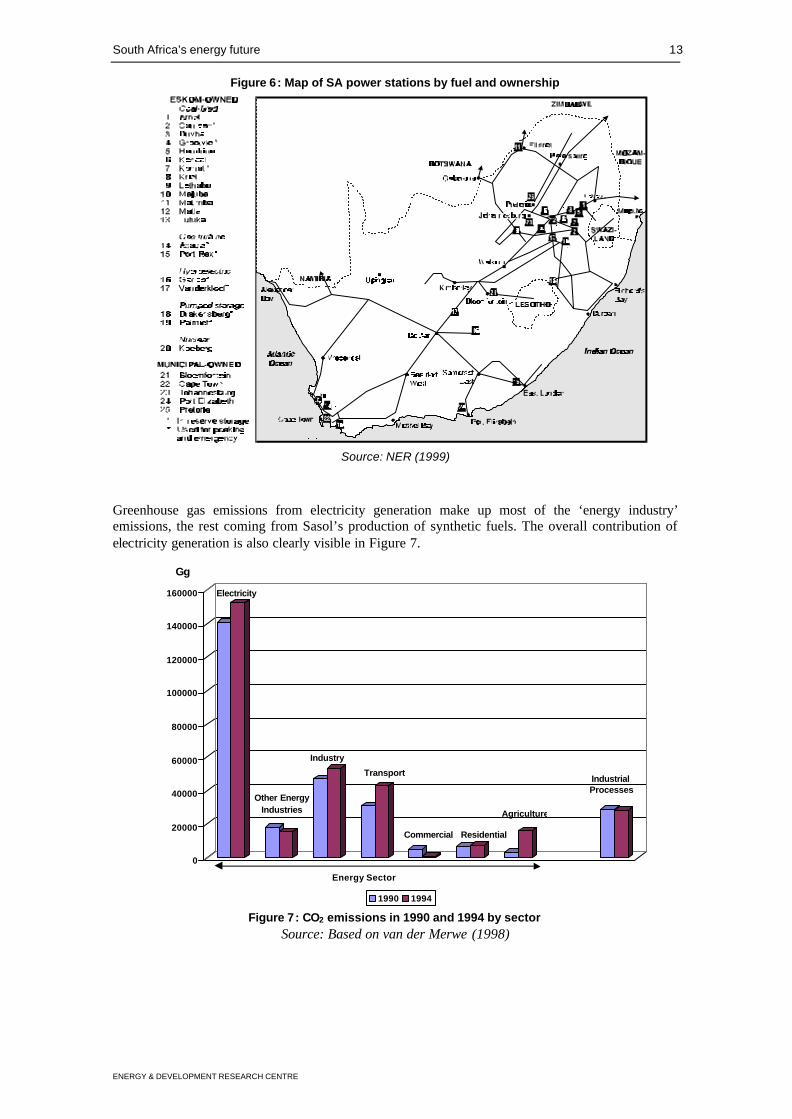
Electricity generation is particularly important for GHG emissions. The South African power sector is primarily owned and operated by Eskom with 92% of generation capacity, with municipalities and private generators owning 6% and 2% respectively. The total quantity of net electricity sent out in 2000 was 194.5 TWh (NER 2000b).
Energy Industries45%
Industrial energy14%
Transport11%
Other energy7%
Fugitive emissions2%
Industry8%
Agriculture9%
Waste4%
Non-energy emissions
Figure 5: SA’s GHG inventory by sector, 1994
Source: Van der Merwe & Scholes (1998)
1 One Gg equals 1 000 tons, so multiply Gg by 1 000 to get million tons. To adjust tons of CO2 to tons of carbon,
divide by a factor of 3.66. 2 The total does not deduct the uptake of CO2 by land use change and forestry activities, which was –18 616 Gg
of CO2-equivalent in 1994. Bunker fuels are also not counted here.
South Africa’s energy future 13
ENERGY & DEVELOPMENT RESEARCH CENTRE
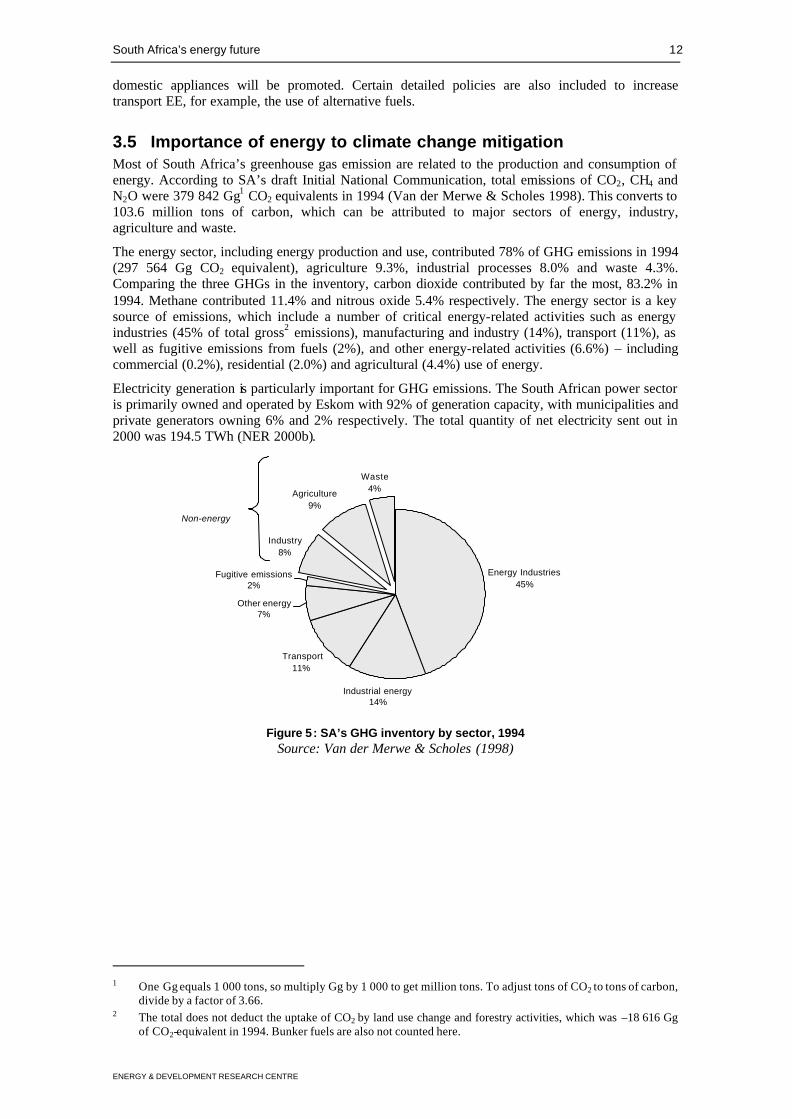
Figure 6: Map of SA power stations by fuel and ownership
Source: NER (1999)
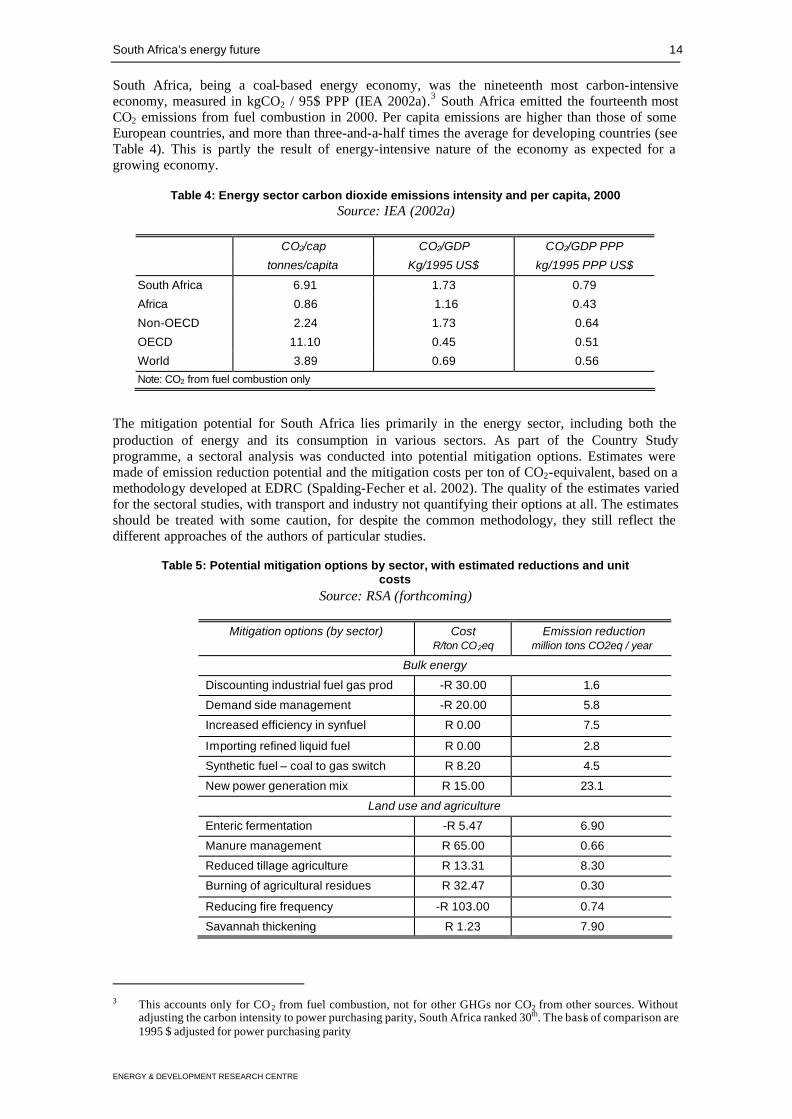
Greenhouse gas emissions from electricity generation make up most of the ‘energy industry’ emissions, the rest coming from Sasol’s production of synthetic fuels. The overall contribution of electricity generation is also clearly visible in Figure 7.
Figure 7: CO2 emissions in 1990 and 1994 by sector Source: Based on van der Merwe (1998)
0
20000
40000
60000
80000
100000
120000
140000
160000
Gg
1990 1994
Electricity
Other EnergyIndustries
Industry
Transport
Commercial Residential
Agriculture
IndustrialProcesses
Energy Sector
South Africa’s energy future 14
ENERGY & DEVELOPMENT RESEARCH CENTRE
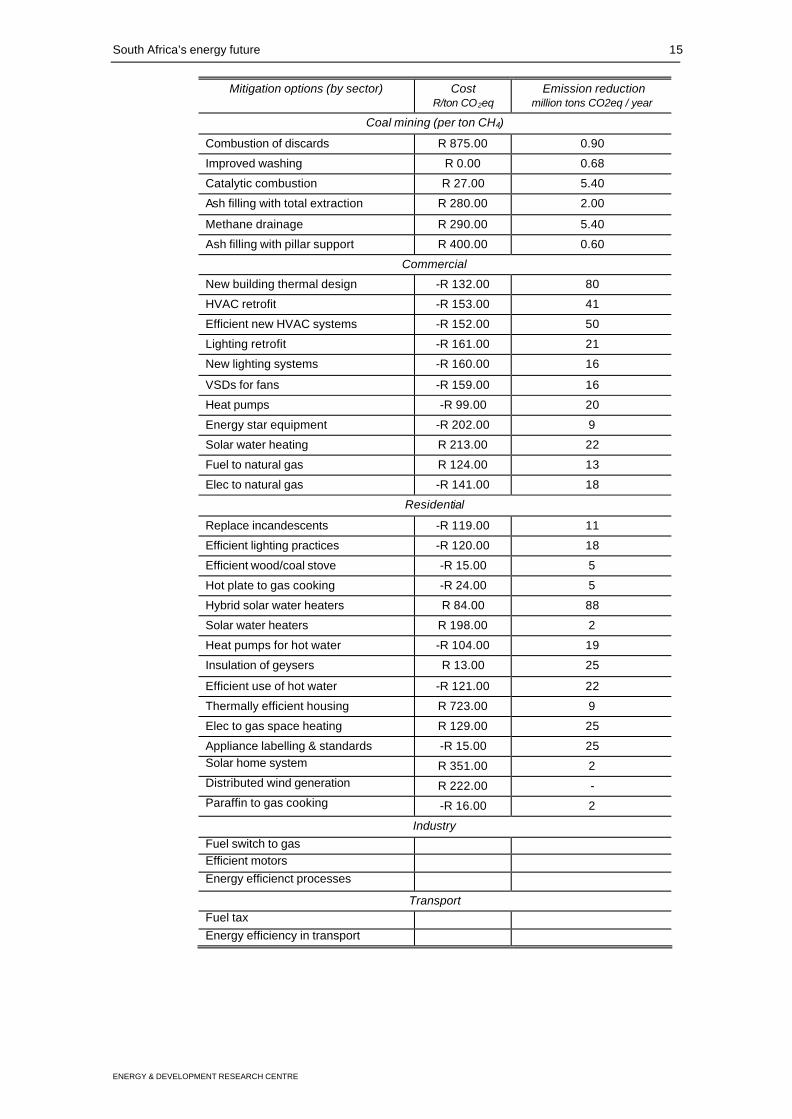
South Africa, being a coal-based energy economy, was the nineteenth most carbon-intensive economy, measured in kgCO2 / 95$ PPP (IEA 2002a).3 South Africa emitted the fourteenth most CO2 emissions from fuel combustion in 2000. Per capita emissions are higher than those of some European countries, and more than three-and-a-half times the average for developing countries (see Table 4). This is partly the result of energy-intensive nature of the economy as expected for a growing economy.
Table 4: Energy sector carbon dioxide emissions intensity and per capita, 2000 Source: IEA (2002a)
CO2/cap CO2/GDP CO2/GDP PPP
tonnes/capita Kg/1995 US$ kg/1995 PPP US$
South Africa 6.91 1.73 0.79
Africa 0.86 1.16 0.43
Non-OECD 2.24 1.73 0.64
OECD 11.10 0.45 0.51
World 3.89 0.69 0.56 Note: CO2 from fuel combustion only
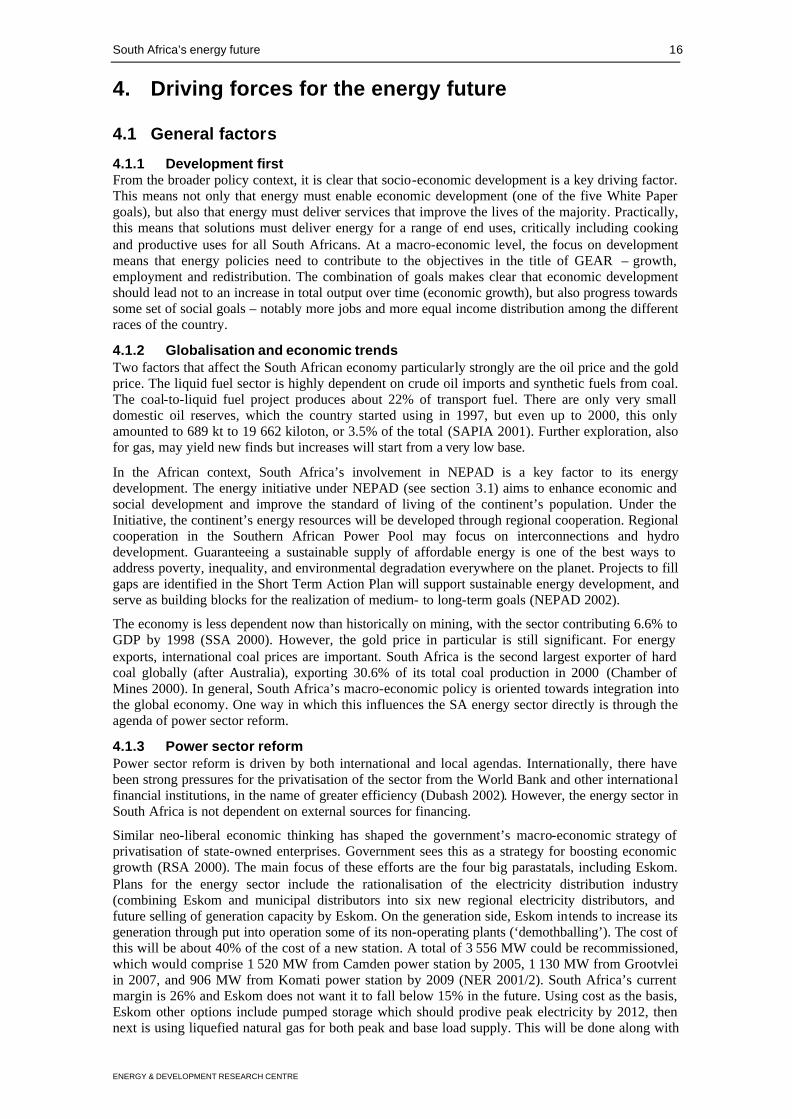
The mitigation potential for South Africa lies primarily in the energy sector, including both the production of energy and its consumption in various sectors. As part of the Country Study programme, a sectoral analysis was conducted into potential mitigation options. Estimates were made of emission reduction potential and the mitigation costs per ton of CO2-equivalent, based on a methodology developed at EDRC (Spalding-Fecher et al. 2002). The quality of the estimates varied for the sectoral studies, with transport and industry not quantifying their options at all. The estimates should be treated with some caution, for despite the common methodology, they still reflect the different approaches of the authors of particular studies.
Table 5: Potential mitigation options by sector, with estimated reductions and unit costs
Source: RSA (forthcoming)
Mitigation options (by sector) Cost R/ton CO2eq
Emission reduction million tons CO2eq / year
Bulk energy Discounting industrial fuel gas prod -R 30.00 1.6
Demand side management -R 20.00 5.8
Increased efficiency in synfuel R 0.00 7.5
Importing refined liquid fuel R 0.00 2.8
Synthetic fuel – coal to gas switch R 8.20 4.5
New power generation mix R 15.00 23.1
Land use and agriculture
Enteric fermentation -R 5.47 6.90
Manure management R 65.00 0.66
Reduced tillage agriculture R 13.31 8.30
Burning of agricultural residues R 32.47 0.30
Reducing fire frequency -R 103.00 0.74
Savannah thickening R 1.23 7.90
3 This accounts only for CO2 from fuel combustion, not for other GHGs nor CO2 from other sources. Without
adjusting the carbon intensity to power purchasing parity, South Africa ranked 30th. The basis of comparison are 1995 $ adjusted for power purchasing parity
South Africa’s energy future 15
ENERGY & DEVELOPMENT RESEARCH CENTRE
Mitigation options (by sector) Cost R/ton CO2eq
Emission reduction million tons CO2eq / year
Coal mining (per ton CH4)
Combustion of discards R 875.00 0.90
Improved washing R 0.00 0.68
Catalytic combustion R 27.00 5.40
Ash filling with total extraction R 280.00 2.00
Methane drainage R 290.00 5.40
Ash filling with pillar support R 400.00 0.60
Commercial
New building thermal design -R 132.00 80
HVAC retrofit -R 153.00 41
Efficient new HVAC systems -R 152.00 50
Lighting retrofit -R 161.00 21
New lighting systems -R 160.00 16
VSDs for fans -R 159.00 16
Heat pumps -R 99.00 20
Energy star equipment -R 202.00 9
Solar water heating R 213.00 22
Fuel to natural gas R 124.00 13
Elec to natural gas -R 141.00 18
Residential
Replace incandescents -R 119.00 11
Efficient lighting practices -R 120.00 18
Efficient wood/coal stove -R 15.00 5
Hot plate to gas cooking -R 24.00 5
Hybrid solar water heaters R 84.00 88
Solar water heaters R 198.00 2
Heat pumps for hot water -R 104.00 19
Insulation of geysers R 13.00 25
Efficient use of hot water -R 121.00 22
Thermally efficient housing R 723.00 9
Elec to gas space heating R 129.00 25
Appliance labelling & standards -R 15.00 25 Solar home system R 351.00 2 Distributed wind generation R 222.00 - Paraffin to gas cooking -R 16.00 2
Industry Fuel switch to gas Efficient motors Energy efficienct processes
Transport Fuel tax Energy efficiency in transport
South Africa’s energy future 16
ENERGY & DEVELOPMENT RESEARCH CENTRE
4. Driving forces for the energy future
4.1 General factors
4.1.1 Development first From the broader policy context, it is clear that socio-economic development is a key driving factor. This means not only that energy must enable economic development (one of the five White Paper goals), but also that energy must deliver services that improve the lives of the majority. Practically, this means that solutions must deliver energy for a range of end uses, critically including cooking and productive uses for all South Africans. At a macro-economic level, the focus on development means that energy policies need to contribute to the objectives in the title of GEAR – growth, employment and redistribution. The combination of goals makes clear that economic development should lead not to an increase in total output over time (economic growth), but also progress towards some set of social goals – notably more jobs and more equal income distribution among the different races of the country.
4.1.2 Globalisation and economic trends Two factors that affect the South African economy particularly strongly are the oil price and the gold price. The liquid fuel sector is highly dependent on crude oil imports and synthetic fuels from coal. The coal-to-liquid fuel project produces about 22% of transport fuel. There are only very small domestic oil reserves, which the country started using in 1997, but even up to 2000, this only amounted to 689 kt to 19 662 kiloton, or 3.5% of the total (SAPIA 2001). Further exploration, also for gas, may yield new finds but increases will start from a very low base.
In the African context, South Africa’s involvement in NEPAD is a key factor to its energy development. The energy initiative under NEPAD (see section 3.1) aims to enhance economic and social development and improve the standard of living of the continent’s population. Under the Initiative, the continent’s energy resources will be developed through regional cooperation. Regional cooperation in the Southern African Power Pool may focus on interconnections and hydro development. Guaranteeing a sustainable supply of affordable energy is one of the best ways to address poverty, inequality, and environmental degradation everywhere on the planet. Projects to fill gaps are identified in the Short Term Action Plan will support sustainable energy development, and serve as building blocks for the realization of medium- to long-term goals (NEPAD 2002).
The economy is less dependent now than historically on mining, with the sector contributing 6.6% to GDP by 1998 (SSA 2000). However, the gold price in particular is still significant. For energy exports, international coal prices are important. South Africa is the second largest exporter of hard coal globally (after Australia), exporting 30.6% of its total coal production in 2000 (Chamber of Mines 2000). In general, South Africa’s macro-economic policy is oriented towards integration into the global economy. One way in which this influences the SA energy sector directly is through the agenda of power sector reform.
4.1.3 Power sector reform Power sector reform is driven by both international and local agendas. Internationally, there have been strong pressures for the privatisation of the sector from the World Bank and other international financial institutions, in the name of greater efficiency (Dubash 2002). However, the energy sector in South Africa is not dependent on external sources for financing.
Similar neo-liberal economic thinking has shaped the government’s macro-economic strategy of privatisation of state-owned enterprises. Government sees this as a strategy for boosting economic growth (RSA 2000). The main focus of these efforts are the four big parastatals, including Eskom. Plans for the energy sector include the rationalisation of the electricity distribution industry (combining Eskom and municipal distributors into six new regional electricity distributors, and future selling of generation capacity by Eskom. On the generation side, Eskom intends to increase its generation through put into operation some of its non-operating plants (‘demothballing’). The cost of this will be about 40% of the cost of a new station. A total of 3 556 MW could be recommissioned, which would comprise 1 520 MW from Camden power station by 2005, 1 130 MW from Grootvlei in 2007, and 906 MW from Komati power station by 2009 (NER 2001/2). South Africa’s current margin is 26% and Eskom does not want it to fall below 15% in the future. Using cost as the basis, Eskom other options include pumped storage which should prodive peak electricity by 2012, then next is using liquefied natural gas for both peak and base load supply. This will be done along with
South Africa’s energy future 17
ENERGY & DEVELOPMENT RESEARCH CENTRE
imported hydropower as their costs are similar. Nuclear energy from the pebble bed will only be become operational after the options already discussed. Though South Africa is promoting independent power producers, Eskom is planning to act as insurance to them to avoid shortages as was reported recently in USA and Europe. The government is expected to include private participation in either demothballing or building new generating plants (Spicer 2003).
On the distribution side, an Electricity Distribution Industry (EDI) Holdings has been established and is controlled by Eskom and the 200 or more municipalities. EDI is working with different companies to assist smaller municipalities to cope with the demands and complexities of electricity distribution. It is expected that by mid 2005 the six regional electricity distribution companies should be operational.
The way in which restructuring happens in the electricity sector will have significant impact on the future of the energy sector. Public benefits are likely to be reduced significantly. One example is investment in energy efficiency, since private investors have little incentive to invest in measures that reduce revenue (Clark & Mavhungu 2000). Opportunities may exist for independent power producers to sell renewable energy, but entry into the market is difficult (Winkler & Mavhungu 2001). Funding of electrification will in future have to be financed from the Treasury, whereas previously it was cross-subsidised by Eskom. The implication is that funding for electrification will compete with other social expenditure for funds from a central pool, given the reluctance of the fiscus to ‘ring-fence’ budgets. The previous arrangement kept subsidy flows within the electricity sector. In each of these instances, a publicly-owned utility is more likely to promote interventions in public benefits than the private sector.
4.1.4 Local technology development An important priority for policy-makers is the development of technology locally or increasing the local content in technology development. For the energy sector, this is closely related to the imperative to develop local manufacturing capacity (see section 4.2.5), a particular priority of government. For renewable energy technologies, the ability to create local jobs and to avoid reliance on imported components is critical.
Renewable energy technologies are one example of the importance of developing local manufacturing capacity. Assuming international costs makes the industry extremely vulnerable to changes in exchange rates. South Africa saw a loss of some 40% in the value of the rand against the US dollar in 2001 (SARB 2002). Large manufacturers, however, are reluctant to develop manufacturing capacity for wind in a country installing capacity of less than 100MW per year (Oelsner 2001). This translates, for example, into 70 turbines of 1.5 MW each. Until there is local manufacturing capacity, it is assumed that it is realistic to use international costs, since renewable energy technologies will have to be fully imported.
Certain thresholds may be required to develop local manufacturing capacity. There are at least three examples in South Africa and the African Wind Energy project in Zimbabwe demonstrating manufacture of local machines of relatively small capacity (Schäffler 2000). These are relatively small turbines, in the 6-10kW range, and viable operations might require as little as a few hundred kW. A more differentiated approach, however, could consider local manufacture of specific components. For wind, promotion of local content could initially focus to towers, blades and assembly of the turbine, rather than complete machines (Martens et al. 2001: 28). Even for small installations, the manufacture of towers, site infrastructure (building and electrical) and operation and maintenance can be done locally. Manufacture of blades would be a next logical step, possible from 200 blades per annum, or about 70 turbines of the same type and size. Investment required to start a blade manufacturing facility, based on European experience, would be on the order of R20 million. The next step would be manufacturing of nacelle housing and assembly of turbine components.
4.1.5 Demographic trends The recent published census by Statistics SA gave the population of South Africa as 44.8 million at October 2001 (SSA 2002). South Africa is a diverse country with different races and extremes between rich and poor. The breakdown by race at 2001 was 79% black African, 8.9% Coloured (mixed race), 2.5% Indian/Asian, and 9.6% white (SSA 2002). Slightly more than half of the population (51.9%) were female. Urbanisation is increasing and stood at 53.7% in 1996 (SSA 2000); updates for electrification planning indicate that 6.503 million of 10.770 million households were urban at the end of 2001, i.e. 60.4% (NER 2001b).
South Africa’s energy future 18
ENERGY & DEVELOPMENT RESEARCH CENTRE
Income inequality is high, with the Gini coefficient index reported as the fourth worst of 105 countries in 1993, according to a World Bank survey (World Bank 2000). More recently, Finance Minister Trevor Manuel announced that South Africa had an income distribution even more unequal than Brazil, which was ranked more unequal in the World Bank survey (Anon. 2000). Poverty cannot be reduced to income, but gives a rough first impression. The lowest quintile of households had a monthly income of R291, while the highest earned an average R16 139 (UCT 2002). The two lowest quintiles are considered poor. Given the major emphasis in government policy on poverty reduction, understanding income inequalities is critical.
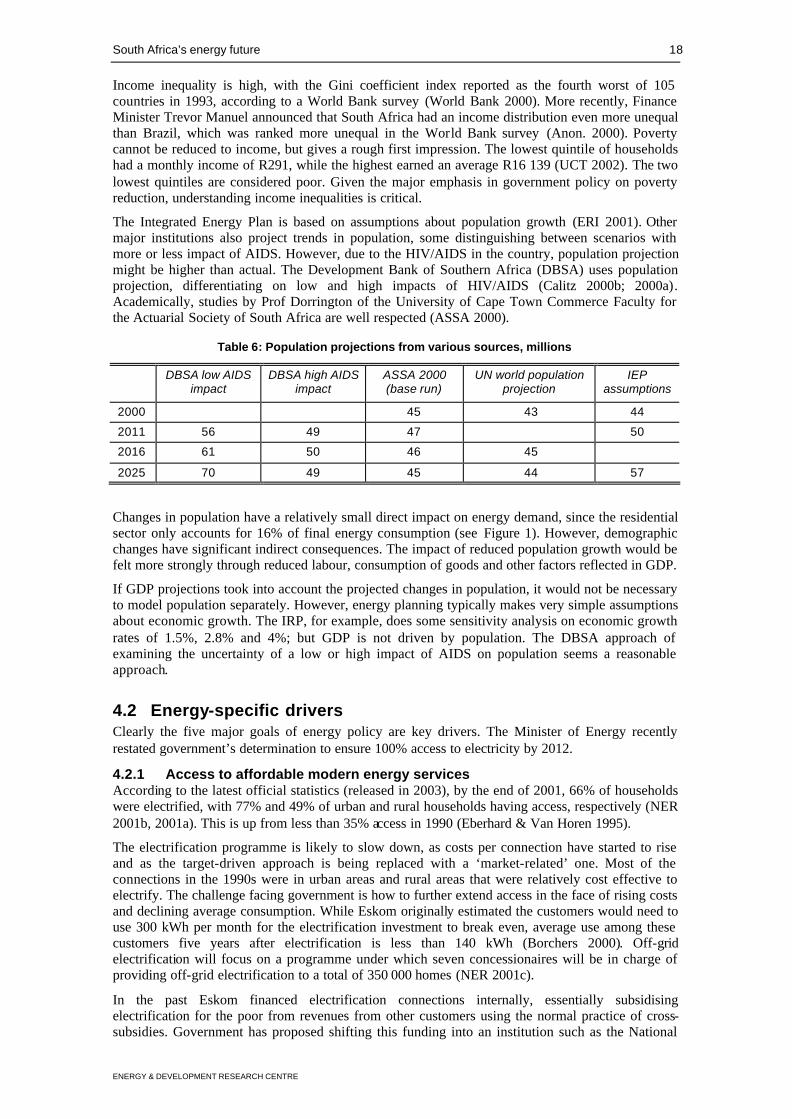
The Integrated Energy Plan is based on assumptions about population growth (ERI 2001). Other major institutions also project trends in population, some distinguishing between scenarios with more or less impact of AIDS. However, due to the HIV/AIDS in the country, population projection might be higher than actual. The Development Bank of Southern Africa (DBSA) uses population projection, differentiating on low and high impacts of HIV/AIDS (Calitz 2000b; 2000a). Academically, studies by Prof Dorrington of the University of Cape Town Commerce Faculty for the Actuarial Society of South Africa are well respected (ASSA 2000).
Table 6: Population projections from various sources, millions
DBSA low AIDS impact
DBSA high AIDS impact
ASSA 2000 (base run)
UN world population projection
IEP assumptions
2000 45 43 44
2011 56 49 47 50
2016 61 50 46 45
2025 70 49 45 44 57
Changes in population have a relatively small direct impact on energy demand, since the residential sector only accounts for 16% of final energy consumption (see Figure 1). However, demographic changes have significant indirect consequences. The impact of reduced population growth would be felt more strongly through reduced labour, consumption of goods and other factors reflected in GDP.
If GDP projections took into account the projected changes in population, it would not be necessary to model population separately. However, energy planning typically makes very simple assumptions about economic growth. The IRP, for example, does some sensitivity analysis on economic growth rates of 1.5%, 2.8% and 4%; but GDP is not driven by population. The DBSA approach of examining the uncertainty of a low or high impact of AIDS on population seems a reasonable approach.
4.2 Energy-specific drivers Clearly the five major goals of energy policy are key drivers. The Minister of Energy recently restated government’s determination to ensure 100% access to electricity by 2012.
4.2.1 Access to affordable modern energy services According to the latest official statistics (released in 2003), by the end of 2001, 66% of households were electrified, with 77% and 49% of urban and rural households having access, respectively (NER 2001b, 2001a). This is up from less than 35% access in 1990 (Eberhard & Van Horen 1995).
The electrification programme is likely to slow down, as costs per connection have started to rise and as the target-driven approach is being replaced with a ‘market-related’ one. Most of the connections in the 1990s were in urban areas and rural areas that were relatively cost effective to electrify. The challenge facing government is how to further extend access in the face of rising costs and declining average consumption. While Eskom originally estimated the customers would need to use 300 kWh per month for the electrification investment to break even, average use among these customers five years after electrification is less than 140 kWh (Borchers 2000). Off-grid electrification will focus on a programme under which seven concessionaires will be in charge of providing off-grid electrification to a total of 350 000 homes (NER 2001c).
In the past Eskom financed electrification connections internally, essentially subsidising electrification for the poor from revenues from other customers using the normal practice of cross-subsidies. Government has proposed shifting this funding into an institution such as the National
South Africa’s energy future 19
ENERGY & DEVELOPMENT RESEARCH CENTRE
Electricity Regulator or even the Development Bank of Southern Africa. Eskom would pay tax and dividends to government, which they have not in the past, and part of this funding would go into the National Electrification Fund, which would fund both Eskom and local authority connections.
4.2.2 Reducing local environmental impacts Energy-related local environmental impacts are likely to be more strictly regulated as DEAT moves towards legislation for air quality standards. DEAT initially published a technical paper focusing on standards for SO2 (RSA 2001). While not directly regulation GHG emissions, controls on local air pollutants will have some impact on mitigation.
4.2.3 Job creation The need for jobs means that the development of local manufacturing capacity is a critical aspect for energy technologies in South Africa. Technologies that have a high content of imported capital equipment or that create employment in other countries are less likely to be received favourable than those that promote local employment.
4.2.4 Black economic empowerment Government is committed to black economic empowerment. This is reflected also in the energy industry and particularly in plans to potentially privatise the electricity supply industry. The aim is that 10% of existing generation should be owned by black empowerment companies (Mlambo-Ngcuka 2002). In the petroleum industry, a target of 25% black empowerment has been set in a Charter for the South African petroleum and liquid fuels industry on empowering historically disadvantaged South Africans in the petroleum and liquid fuels industry. The Charter has been signed by government, the South African Petroleum Industry Association and its member companies (SAPIA 2001).
4.2.5 Building local manufacturing capacity For wind technologies, for example, building local manufacturing capacity might mean a focus on local machines of relatively small capacity (Schaffler 2002), as in three examples in South Africa and the African Wind Energy project in Zimbabwe. Another approach would be to consider local manufacture of specific components, e.g. for wind the towers, blades and assembly of the turbine, rather than complete machines (Martens et al. 2001: 28). The same concern would apply to other energy technologies, whether based on renewable energy sources or not.
The attempt to promote local versions of energy technologies has also been made with a high-temperature nuclear reactor, the Pebble Bed Modular Reactor (PBMR Ltd 2002). This particular project has been controversial, with concerns relating to non-proliferation, waste management and economics being raised. Nonetheless, the project is progressing. The ability to contribute to local manufacturing capacity would depend in particular on the economic viability (Auf der Heyde & Thomas 2002).
4.2.6 Coal exports South Africa is a major exporter of coal, as noted above. Coal markets in the North are potentially threatened by climate change mitigation. The National Economic Development and Labour Council (NEDLAC, a negotiating forum for government, business and labour) has commissioned an (unpublished) study into the impacts. Impacts on coal export revenues were found, but also a slight advantage for energy intensive sectors by gaining competitiveness.
4.2.7 Energy-intensive industry South Africa’s industrial sector is centred around a ‘mineral-energy’ complex (Fine & Rustomjee 1996). Mining and some industrial activities (aluminum smelting) are highly energy intensive, as is the synthetic fuels industry. As indicated in government’s outlook (section 4.3), investment in energy-intensive sectors is planned to continue as South Africa is a developing country. A development path that focused on less energy-intensive sectors would be difficult as this depends on the development status of the country.
4.2.8 Energy security through diversity of supply The context of energy security has changed dramatically in South Africa. In the apartheid years, energy security was concerned with ensuring the energy supply could withstand sanctions (a major driver of the coal-to-fuel industry) and the frontline states. With the re-integration of South Africa into the global and regional economy, energy security has been re-formulated in terms of diversity of supply and cooperation within the SAPP (DME 1998).
South Africa’s energy future 20
ENERGY & DEVELOPMENT RESEARCH CENTRE
The medium-term objectives in the White Paper on securing supply through diversity are to:
• utilise integrated resource planning methodologies to evaluate future energy supply options;
• reappraise coal resources and support the introduction of other primary energy carriers as appropriate.
4.3 Future energy sector outlook The DME will soon release an Integrated Energy Plan based on a commissioned study by Energy Research Institute of the University of Cape Town, to produce an ‘outlook’ of the South African energy system (ERI 2001).
4.3.1 Energy demand
Industry (including manufacture and mining) • The share of electricity used in mining is likely to increase.
• Iron and steel: It is likely in future that more steel will be produced in electric furnaces and that gas will be used instead of coal for making iron and steel. Overall, production is expected to grow more slowly than GDP.
• In the chemical sector, gas is likely to replace coal as a feedstock. This is already happening for Sasol. Sector growth may be higher than GDP.
• More energy-intensive titanium and aluminium smelters are being considered or are already in progress. Zinc smelters are also likely to be built.
• South Africa’s pulp and paper industry is likely to grow with GDP and to become more energy efficient in future.
Commercial • Demand is likely to grow more quickly than GDP. Electricity is likely to be a higher share of
energy for this sector in future.
• There is large scope for energy efficiency here including better design of buildings, more efficient lights (especially changing from incandescent to fluorescent lighting), more efficient air conditioning and heating, and better management of energy use.
Residential • Demand would grow with population (see discussion of demographic factors in section 4.1.5).
• In future the trend from traditional fuels through transitional to electricity is likely to continue. Electricity allows for more efficient energy use than coal, wood and paraffin but more energy will be consumed for water heating. There will be a growth in energy demand for non-essential appliances such as TVs.
Transport • Demand for private vehicles is likely to grow as GDP increases.
• In future, energy demand for land freight and sea transport is likely to grow at the same rate as GDP but energy demand for land passenger transport and air transport is likely to grow much more quickly.
4.3.2 Energy efficiency Overall, the National Electricity Regulator is using growth of between 2 and 3% per annum for its planning, within assumptions of 1.5%, 2.8% or 4% GDP growth (NER 2002). However, there is significant potential for moderating the growth in demand for energy through end-use energy efficiency and demand side management. For the electricity sector, the regulator has made estimates of the potential savings from such interventions, grouped under the following headings (note that interruptible supply agreements are not included in these estimates):
• industrial and commercial energy efficiency (ICEE);
• residential energy efficiency (REE);
• industrial and commercial load management (ICLM); and
• residential load management (RLM).
South Africa’s energy future 21
ENERGY & DEVELOPMENT RESEARCH CENTRE
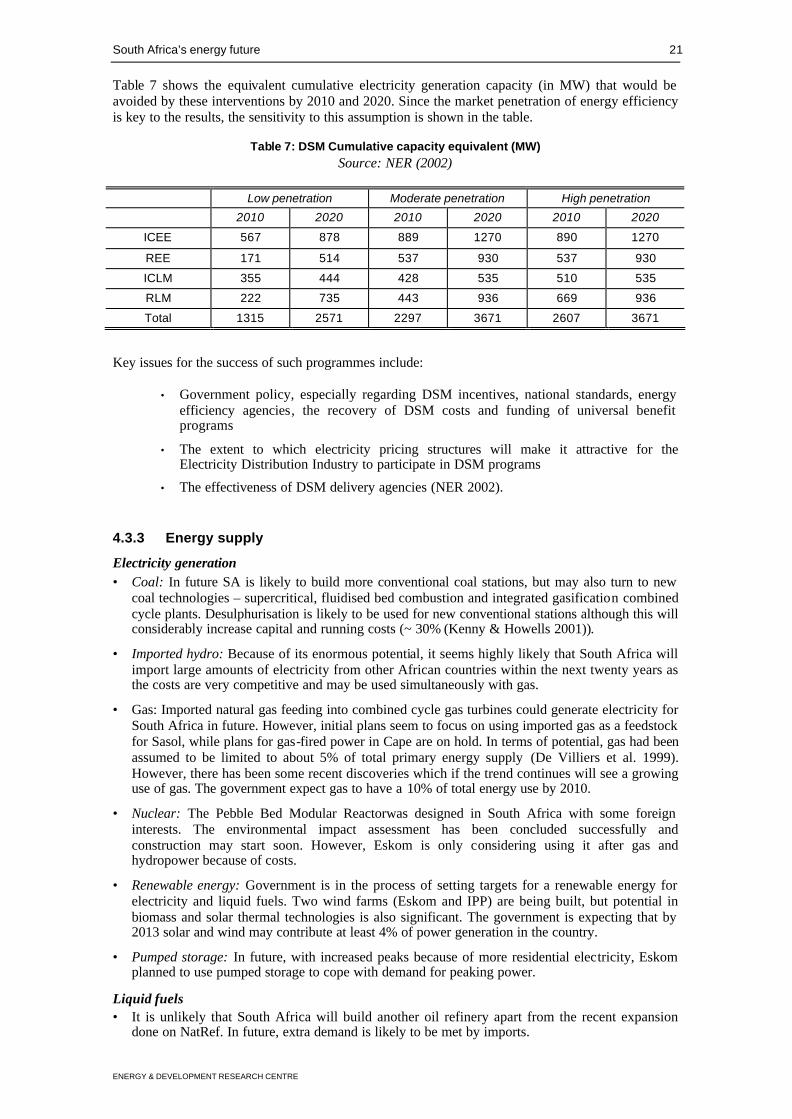
Table 7 shows the equivalent cumulative electricity generation capacity (in MW) that would be avoided by these interventions by 2010 and 2020. Since the market penetration of energy efficiency is key to the results, the sensitivity to this assumption is shown in the table.
Table 7: DSM Cumulative capacity equivalent (MW) Source: NER (2002)
Low penetration Moderate penetration High penetration
2010 2020 2010 2020 2010 2020
ICEE 567 878 889 1270 890 1270
REE 171 514 537 930 537 930
ICLM 355 444 428 535 510 535
RLM 222 735 443 936 669 936
Total 1315 2571 2297 3671 2607 3671
Key issues for the success of such programmes include:
• Government policy, especially regarding DSM incentives, national standards, energy efficiency agencies, the recovery of DSM costs and funding of universal benefit programs
• The extent to which electricity pricing structures will make it attractive for the Electricity Distribution Industry to participate in DSM programs
• The effectiveness of DSM delivery agencies (NER 2002).
4.3.3 Energy supply
Electricity generation • Coal: In future SA is likely to build more conventional coal stations, but may also turn to new
coal technologies – supercritical, fluidised bed combustion and integrated gasification combined cycle plants. Desulphurisation is likely to be used for new conventional stations although this will considerably increase capital and running costs (~ 30% (Kenny & Howells 2001)).
• Imported hydro: Because of its enormous potential, it seems highly likely that South Africa will import large amounts of electricity from other African countries within the next twenty years as the costs are very competitive and may be used simultaneously with gas.
• Gas: Imported natural gas feeding into combined cycle gas turbines could generate electricity for South Africa in future. However, initial plans seem to focus on using imported gas as a feedstock for Sasol, while plans for gas-fired power in Cape are on hold. In terms of potential, gas had been assumed to be limited to about 5% of total primary energy supply (De Villiers et al. 1999). However, there has been some recent discoveries which if the trend continues will see a growing use of gas. The government expect gas to have a 10% of total energy use by 2010.
• Nuclear: The Pebble Bed Modular Reactorwas designed in South Africa with some foreign interests. The environmental impact assessment has been concluded successfully and construction may start soon. However, Eskom is only considering using it after gas and hydropower because of costs.
• Renewable energy: Government is in the process of setting targets for a renewable energy for electricity and liquid fuels. Two wind farms (Eskom and IPP) are being built, but potential in biomass and solar thermal technologies is also significant. The government is expecting that by 2013 solar and wind may contribute at least 4% of power generation in the country.
• Pumped storage: In future, with increased peaks because of more residential electricity, Eskom planned to use pumped storage to cope with demand for peaking power.
Liquid fuels • It is unlikely that South Africa will build another oil refinery apart from the recent expansion
done on NatRef. In future, extra demand is likely to be met by imports.
South Africa’s energy future 22
ENERGY & DEVELOPMENT RESEARCH CENTRE
• Coal-to-oil synfuels: Gas will replace coal as the feed-stock at Sasol’s Secunda plant. It is unlikely that any more coal to oil plants will be built in South Africa.
• Domestic oil reserves are very small, even after recent finds. Oil is likely to be limited to replacing imports.
5. Assessment of existing energy scenarios The future energy outlook focuses on particular fuels and technologies. Intense effort is being made by DME to evaluate the energy resources in the country, especially coal. Energy scenarios combine information on demand and supply for different fuels and services into stories for the future.
There are a relatively small number of analytical scenarios and plans for the South African energy sector. The National Electricity Regulator has published an Integrated Resource Plan with a base plan for the power sector from 2001 to 2025 (NER 2001/2). The IRP draws heavily on Eskom’s Integrated Strategic Electricity Plan (ISEP), which is not in the public domain. The latest version an Integrated Energy Plan (IEP) to include not only electricity but other energy carriers as well, has not yet been published.
Other plans and scenarios have more specific focus. Electricity Market Scenarios have been developed to consider policy questions for power sector reform. In a different vein, policies for renewable energy and energy efficiency have been studied.
5.1 National Integrated Resource Plan (IRP) The National Integrated Resource Plan (NER 2001/2) is a decision-making tool for evaluating future electricity supply investments and retirement of old capital. The planning horizon starts in January 2001 and extends over the next 25 years; a discount rate of 11% is assumed (before tax); and exchange rate of R8/$1 is used for imported capital. 4 It focuses on electricity supply only. It is based on Eskom’s Integrated Strategic Electricity Plan (ISEP 8).5 The aim was to ‘optimise the supply-side and demand-side resources mix while ensuring reliable and secure electrical supply, and keeping the electricity price to consumers as low as possible’ (NER 2001/2: 2).
The IRP starts with a projection of electricity demand. It assumes a range of economic growth rates of 1.5%, 2.8% and 4%; and a low aggregate electricity demand growth of 2% per year and high at 3% (NER 2001/2: 7). Given fluctuations in daily demand suggest that more peaking plants are needed that would otherwise be the case. Demand-side initiatives are examined in both industrial and residential sectors, covering both load management and energy efficiency (for potential savings, see Table 7).
The existing Eskom system has capacity of 33 871 MWe of coal-fired and nuclear baseload; 2 326 MWe of peaking capacity (gas turbines, pumped storage and hydro); contract to purchase hydro-power from Cahora Bassa of 1071 MWe with a further 367 MWe from 2004; and imported peaking capacity of 100 MW from Zambia and 110 MWe from the DR Congo. Total Eskom existing, committed and imported net generation capacity from 2004, including imports, is 37 845 MWe (NER 2001/2: 10). Non-Eskom capacity adds municipal baseload (2 070 MWe) and peaking 545 MWe.
New supply-side options considered were return to service of Eskom mothballed coal-fired stations; building new pulverised fuel coal plants; new pumped storage schemes; new gas-fired plants; new nuclear pebble bed modular reactors; greenfield fluidised bed combustion (FBC) boilers; and regional power options. These options are considered ‘mainstream’, whilst others being researched are redox flow cells, biomass, high-head underground pumped storage, wind, solar thermal electric, solar dish / Stirling and ocean wave power.
Costs are reported in diagrammatic form only, comparing levelised costs (R/MWh) to load factor. Roughly speaking, coal and imported hydro are cheapest for baseload, followed by gas, fluidised bed
4 A discount rate of 11% is relatively high in the public sector, DBSA typically uses 8% and Eskom has in the
past used rates as low as 6%. The decision not to take into account a large drop in the Rand / dollar exchange rate seems justified with hindsight, as the rate returned to around R8 /1$ in 2003.
5 Eskom’s Integrated (strategic) electricity plans are not published; the IRP is the best indication in the public domain of the detailed modeling informing Eskom’s internal strategic planning.
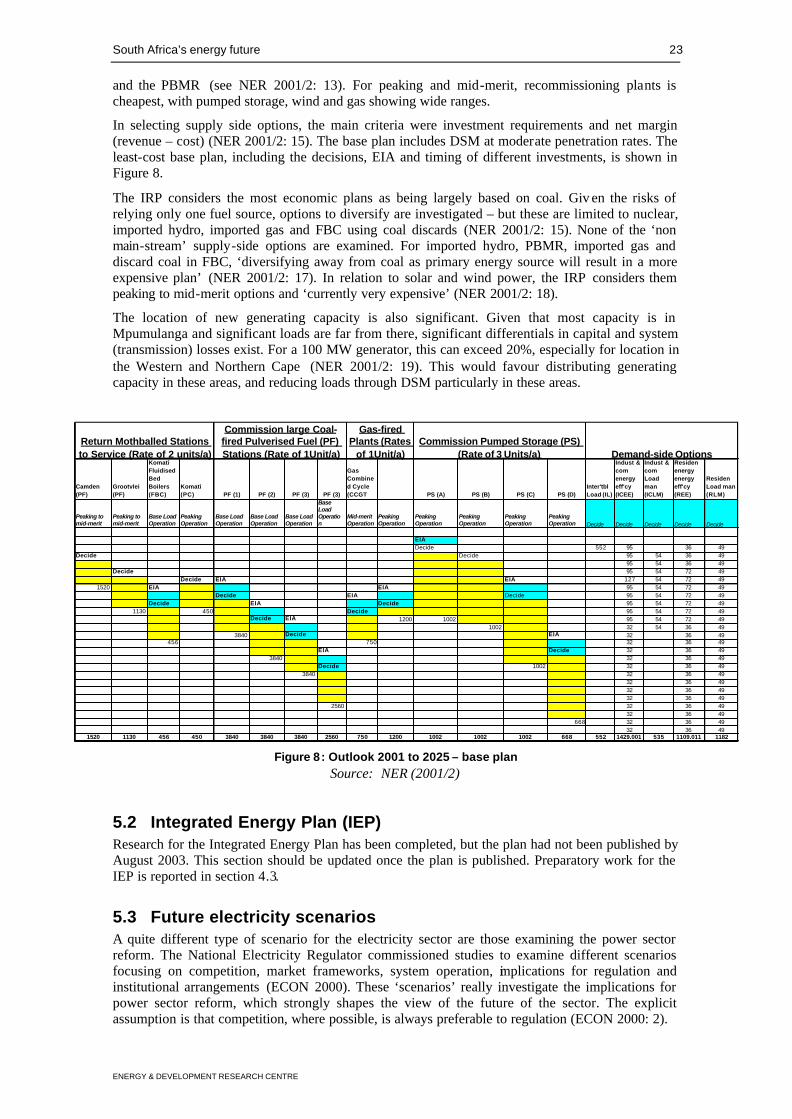
South Africa’s energy future 23
ENERGY & DEVELOPMENT RESEARCH CENTRE
and the PBMR (see NER 2001/2: 13). For peaking and mid-merit, recommissioning plants is cheapest, with pumped storage, wind and gas showing wide ranges.
In selecting supply side options, the main criteria were investment requirements and net margin (revenue – cost) (NER 2001/2: 15). The base plan includes DSM at moderate penetration rates. The least-cost base plan, including the decisions, EIA and timing of different investments, is shown in Figure 8.
The IRP considers the most economic plans as being largely based on coal. Giv en the risks of relying only one fuel source, options to diversify are investigated – but these are limited to nuclear, imported hydro, imported gas and FBC using coal discards (NER 2001/2: 15). None of the ‘non main-stream’ supply-side options are examined. For imported hydro, PBMR, imported gas and discard coal in FBC, ‘diversifying away from coal as primary energy source will result in a more expensive plan’ (NER 2001/2: 17). In relation to solar and wind power, the IRP considers them peaking to mid-merit options and ‘currently very expensive’ (NER 2001/2: 18).
The location of new generating capacity is also significant. Given that most capacity is in Mpumulanga and significant loads are far from there, significant differentials in capital and system (transmission) losses exist. For a 100 MW generator, this can exceed 20%, especially for location in the Western and Northern Cape (NER 2001/2: 19). This would favour distributing generating capacity in these areas, and reducing loads through DSM particularly in these areas.
Camden (PF)
Grootvlei (PF)
Komati Fluidised Bed Boilers (FBC)
Komati (PC) PF (1) PF (2) PF (3) PF (3)
Gas Combined Cycle (CCGT PS (A) PS (B) PS (C) PS (D)
Inter'tbl Load (IL)
Indust & com energy eff'cy (ICEE)
Indust & com Load man (ICLM)
Residen energy energy eff'cy (REE)
Residen Load man (RLM)
Peaking to mid-merit
Peaking to mid-merit
Base Load Operation
Peaking Operation
Base Load Operation
Base Load Operation
Base Load Operation
Base Load Operation
Mid-merit Operation
Peaking Operation
Peaking Operation
Peaking Operation
Peaking Operation
Peaking Operation Decide Decide Decide Decide Decide
EIADecide 552 95 36 49
Decide Decide 95 54 36 4995 54 36 49
Decide 95 54 72 49Decide EIA EIA 127 54 72 49
1520 EIA EIA 95 54 72 49Decide EIA Decide 95 54 72 49
Decide EIA Decide 95 54 72 491130 450 Decide 95 54 72 49
Decide EIA 1200 1002 95 54 72 491002 32 54 36 49
3840 Decide EIA 32 36 49456 750 32 36 49
EIA Decide 32 36 493840 32 36 49
Decide 1002 32 36 493840 32 36 49
32 36 4932 36 4932 36 49
2560 32 36 4932 36 49
668 32 36 4932 36 49
1520 1130 456 450 3840 3840 3840 2560 750 1200 1002 1002 1002 668 552 1429.001 535 1109.011 1182
Demand-side OptionsCommission Pumped Storage (PS)
(Rate of 3 Units/a)Return Mothballed Stations to Service (Rate of 2 units/a)
Commission large Coal-fired Pulverised Fuel (PF) Stations (Rate of 1Unit/a)
Commisson Gas-fired
Plants (Rates of 1Unit/a)
Figure 8: Outlook 2001 to 2025 – base plan
Source: NER (2001/2)
5.2 Integrated Energy Plan (IEP) Research for the Integrated Energy Plan has been completed, but the plan had not been published by August 2003. This section should be updated once the plan is published. Preparatory work for the IEP is reported in section 4.3.
5.3 Future electricity scenarios A quite different type of scenario for the electricity sector are those examining the power sector reform. The National Electricity Regulator commissioned studies to examine different scenarios focusing on competition, market frameworks, system operation, implications for regulation and institutional arrangements (ECON 2000). These ‘scenarios’ really investigate the implications for power sector reform, which strongly shapes the view of the future of the sector. The explicit assumption is that competition, where possible, is always preferable to regulation (ECON 2000: 2).
South Africa’s energy future 24
ENERGY & DEVELOPMENT RESEARCH CENTRE
The plan examines different market framework, comparing power pool and multi-market models. The choice of different models has implications for institutional and regulatory options. The study suggest that competitive elements (generation, trading and retail for contestable customers) should be unrestrained, while non-competitive elements (transmission and distribution, retail for captive customers) are more directly regulated (ECON 2000: 4-5). Generation should be de-linked from system and market operation to ensure independence. Generation is to be restructured to create a number of competing generation companies.
Scenarios that focus on markets and competition raise important policy questions. Theoretically, competition should promote economic efficiency and thus lower prices. However, experience of power sector reform in many developing countries has shown that tariffs – in particular for small customers – actually increase (Clark 2001; Dubash 2001; Edjekumhene et al. 2001; Reddy 2001). Given the large share of generation held by Eskom, a further policy question relates to the exercise of market power and to what extent this might distort a future market. Finally, concerns have been raised about the risks of existing assets and contracts being stranded (ECON 2000: 7).
5.4 Scenarios combining renewable energy and energy efficiency Analysis of scenarios that focus on renewables and efficiency were commissioned by Sustainable Energy and Climate Change Partnership, a partnership between Earthlife Africa Johannesburg and the World Wildlife Fund of Denmark. Policies and measures (PAMs) examined were grouped as market-based instruments, regulatory measures, institutional and legal measures, and voluntary measures and included:
Market-based instruments • Financing energy efficient housing and appliances (bonds and loans).
• Incremental housing subsidy for energy efficiency upgrade in low cost housing.
• Concessionary loans for incremental costs efficient equipment and combined heat and power.
• Production subsidies for renewable electricity generation.
• Pollution taxes.
• Wires charge and additional sources of financing.
Regulatory instruments – targets, codes and standards • Targets for renewable electricity generation.
• Strengthen commercial building codes.
• Residential building codes.
• Household appliance-labelling and mandatory energy performance standards.
• Commercial and industrial equipment labelling and mandatory energy performance standards.
• Government procurement standards for equipment and upgrading energy efficiency standards in government buildings.
• Compulsory fuel efficiency standards for corporate and institutional fleets.
• Particulate emission control and transport policy.
• Regulatory interventions to promote energy efficiency.
• Green tariffs, trading and renewable electricity.
Institutional and legal environment • Strengthen the institutional framework for energy efficiency.
• Renewable energy legislative framework.
• Research, development and demonstration
• Awareness and education.
d) Voluntary agreements on energy efficiency

South Africa’s energy future 25
ENERGY & DEVELOPMENT RESEARCH CENTRE
Because of the difficulty in conducting a detailed quantitative analysis on every policy and measures, the methodological approach to the analysis included grouping some of the PAMs into different scenarios viz.:
Base case Business as usual government policy, based on DME’s official projections and public domain data
Economic instruments Moderate; focus on economic instruments to correct market failures in relation to RE and EE
Policy reform Moderate; focus on meeting targets for RE and EE cost-effectively
Intensive policy Intensive; more focus on promoting RE and EE; stronger weighting of social and environmental concerns
These scenarios each present a different view of the future, and a different path that government policy could take in terms of emphasising certain kinds of policies. Quantitative analysis of these scenarios was conducted on the LEAP 2000 and MARKAL models and compared to the base case.
The three policy scenarios each have benefits and costs across a range of different indicators. Increased energy efficiency in the policy scenarios reduces energy demand while supporting the same economic activity level. The policy scenarios significantly increase the diversity of supply for the power sector, with intensive policy leading the most change due to higher renewable targets.
In all cases, the environmental performance of South Africa’s energy system was improved through RE and EE. The scenarios showed significantly lower local pollution (up to 10%), as well as reductions in GHG emissions (6-10%).
82%
84%
86%
88%
90%
92%
94%
96%
98%
100%
102%
Sulphur Particulates Nox
Em
issio
ns r
ela
tive t
o b
ase c
ase
Base CaseEconomic InstrumentsPolicy ReformIntensive Policy
Figure 9: Relative emissions of local pollutants (cumulative over 20 years)
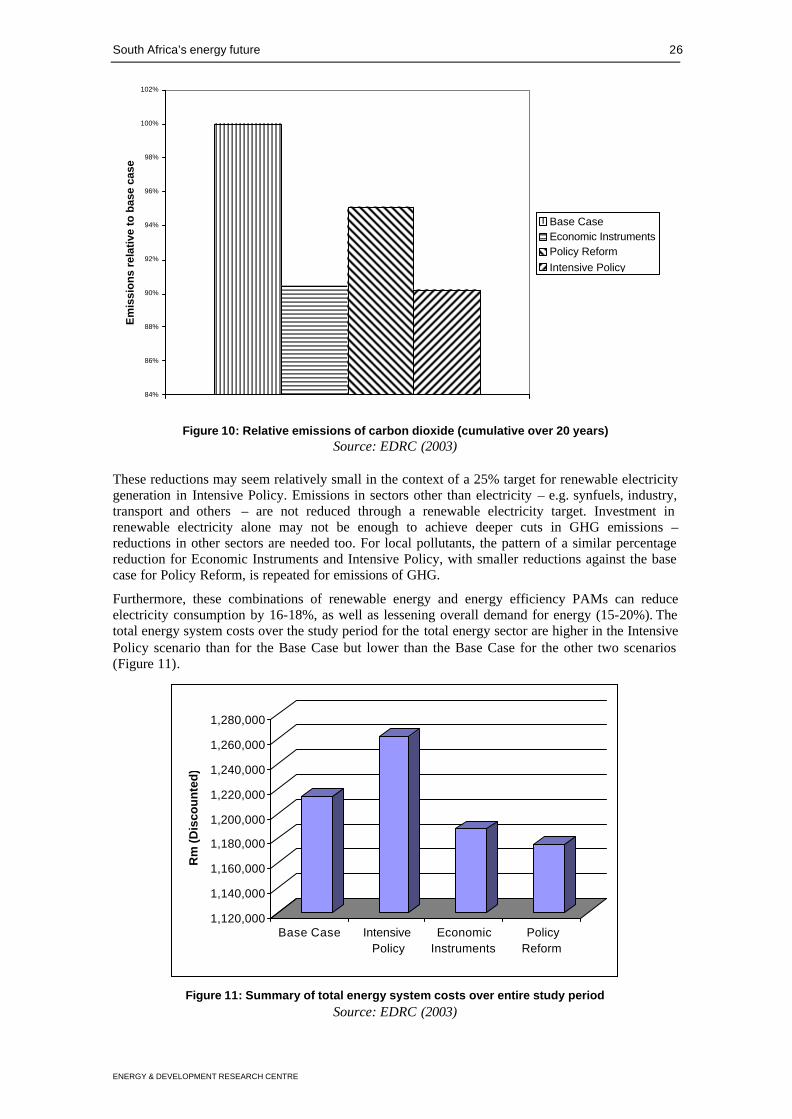
South Africa’s energy future 26
ENERGY & DEVELOPMENT RESEARCH CENTRE
84%
86%
88%
90%
92%
94%
96%
98%
100%
102%
Em
issi
on
s re
lati
ve t
o b
ase
case
Base CaseEconomic InstrumentsPolicy ReformIntensive Policy
Figure 10: Relative emissions of carbon dioxide (cumulative over 20 years)
Source: EDRC (2003)
These reductions may seem relatively small in the context of a 25% target for renewable electricity generation in Intensive Policy. Emissions in sectors other than electricity – e.g. synfuels, industry, transport and others – are not reduced through a renewable electricity target. Investment in renewable electricity alone may not be enough to achieve deeper cuts in GHG emissions – reductions in other sectors are needed too. For local pollutants, the pattern of a similar percentage reduction for Economic Instruments and Intensive Policy, with smaller reductions against the base case for Policy Reform, is repeated for emissions of GHG.
Furthermore, these combinations of renewable energy and energy efficiency PAMs can reduce electricity consumption by 16-18%, as well as lessening overall demand for energy (15-20%). The total energy system costs over the study period for the total energy sector are higher in the Intensive Policy scenario than for the Base Case but lower than the Base Case for the other two scenarios (Figure 11).
1,120,000
1,140,000
1,160,000
1,180,000
1,200,000
1,220,000
1,240,000
1,260,000
1,280,000
Rm
(Dis
cou
nte
d)
Base Case IntensivePolicy
EconomicInstruments
PolicyReform
Figure 11: Summary of total energy system costs over entire study period
Source: EDRC (2003)
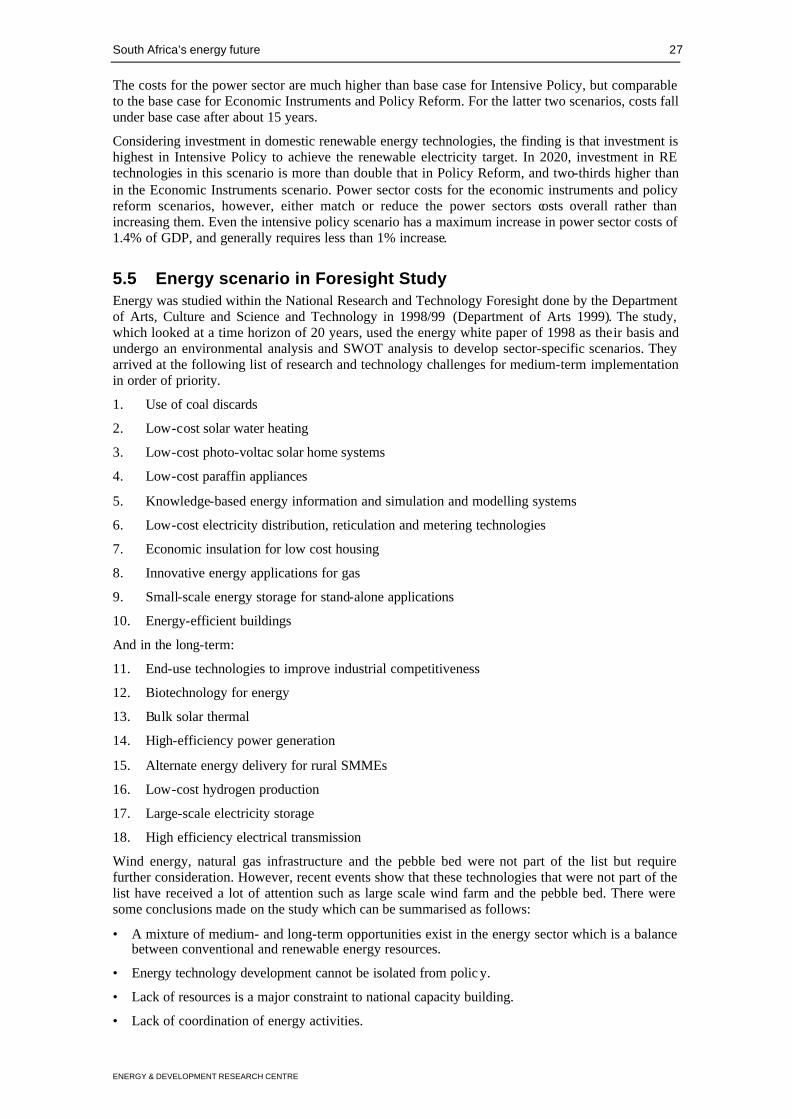
South Africa’s energy future 27
ENERGY & DEVELOPMENT RESEARCH CENTRE
The costs for the power sector are much higher than base case for Intensive Policy, but comparable to the base case for Economic Instruments and Policy Reform. For the latter two scenarios, costs fall under base case after about 15 years.
Considering investment in domestic renewable energy technologies, the finding is that investment is highest in Intensive Policy to achieve the renewable electricity target. In 2020, investment in RE technologies in this scenario is more than double that in Policy Reform, and two-thirds higher than in the Economic Instruments scenario. Power sector costs for the economic instruments and policy reform scenarios, however, either match or reduce the power sectors costs overall rather than increasing them. Even the intensive policy scenario has a maximum increase in power sector costs of 1.4% of GDP, and generally requires less than 1% increase.
5.5 Energy scenario in Foresight Study Energy was studied within the National Research and Technology Foresight done by the Department of Arts, Culture and Science and Technology in 1998/99 (Department of Arts 1999). The study, which looked at a time horizon of 20 years, used the energy white paper of 1998 as their basis and undergo an environmental analysis and SWOT analysis to develop sector-specific scenarios. They arrived at the following list of research and technology challenges for medium-term implementation in order of priority.
1. Use of coal discards
2. Low-cost solar water heating
3. Low-cost photo-voltac solar home systems
4. Low-cost paraffin appliances
5. Knowledge-based energy information and simulation and modelling systems
6. Low-cost electricity distribution, reticulation and metering technologies
7. Economic insulation for low cost housing
8. Innovative energy applications for gas
9. Small-scale energy storage for stand-alone applications
10. Energy-efficient buildings
And in the long-term:
11. End-use technologies to improve industrial competitiveness
12. Biotechnology for energy
13. Bulk solar thermal
14. High-efficiency power generation
15. Alternate energy delivery for rural SMMEs
16. Low-cost hydrogen production
17. Large-scale electricity storage
18. High efficiency electrical transmission
Wind energy, natural gas infrastructure and the pebble bed were not part of the list but require further consideration. However, recent events show that these technologies that were not part of the list have received a lot of attention such as large scale wind farm and the pebble bed. There were some conclusions made on the study which can be summarised as follows:
• A mixture of medium- and long-term opportunities exist in the energy sector which is a balance between conventional and renewable energy resources.
• Energy technology development cannot be isolated from polic y.
• Lack of resources is a major constraint to national capacity building.
• Lack of coordination of energy activities.
South Africa’s energy future 28
ENERGY & DEVELOPMENT RESEARCH CENTRE
5.6 Lessons on SA energy scenarios From the above review, it is clear that the major existing energy planning processes revolve around IEP for energy sector as a whole, and IRP focused on the electricity sector. Eskom’s detailed, in-house work feeds into the NER’s public -domain IRP. An evaluation of international and local experience of IEP and IRP was conducted to guide DME’s planning. The findings of this review are largely still relevant and the major recommendations are listed below: (Borchers 2000)
Some core conclusions for the way forward • The IEP implementation system chosen should target simplicity without over-simplifying to the
extent that outputs become questionable. Indications are that over-complex and over-demanding planning exercises compared with resources available have been instrumental in past unsustainable approaches both internationally and locally.
• Key staff involved in policy-making and implementation should commit time to participate and guide the scenario development, modelling, and policy development process. Lack of time by DME staff to participate has been a clear constraint in previous integrated planning attempts.
• DME, and other relevant stakeholders, need to make a long-term commitment of funds and other resources to data coordination and collection, modelling and other IEP related activities if IEP is to become a sustainable planning practice.
• Participation, and consensus where possible, of key stakeholders in the energy sector is an important component of effective IEP and IRP. Indications are that where such exercises do not include a broad consensus, planned developments take place slowly, if at all.
• Externalities, particularly environmental ones, have to be seriously included in IEP and IRP exercises.
6. Visions of energy futures There are a number of scenarios and plans for the South African energy sector, some focusing specifically on electricity. Based on these analyses, broad future options can be outlined – these could be termed ‘visions’ of South African energy futures. Relatively little of the strategic thinking around energy futures in South Africa is in the public domain. Details of Eskom’s plans are, however not published. Only more aggregate level plans are published through the use by the National Electricity Regulator of Eskom’s modelling and plans for the IRP (see section 5.1). The Reguilator is also establishing an advisory process for future planning.
6.1 Current development trends Historically, the energy sector has been driven mainly by energy security concerns, especially during the period of isolation. However, as the discussion of the report shows, the country has now moved to an era of fuel diversity but the extent of such diversity will depend on the resource endowment of the country and its immediate environs as imported fuels have major vulnerabilities that countries tend to avoid.
The energy sector will change in response to several factors. A number of trends indicate that even without new implicit energy policy, the future energy sector will differ from the present situation. In particular:
• The import of gas and exploration for gas off South Afric a’s coast make the introduction of gas very likely. The minister of energy has plans to make it contribute 10% of total energy and to introduce modern gas network infrastructure by 2010. This is already happening for synfuels and chemicals, and given the good prospects of further development of combined-cycle gas turbine system will become part of the power production system. Eskom has already mentioned their wish to do so. Costs and alternative uses of the gas are likely to limit the use of gas for electricity (see below).
• Increasing emphasis by the regulation for both demand-side and supply-side of the energy sector.
• Technology innovation will continue on several technologies including the nuclear pebble bed reactor, natural gas infrastructure, domestic energy appliances, etc..
South Africa’s energy future 29
ENERGY & DEVELOPMENT RESEARCH CENTRE
• The overall economic growth will continue to be strong and largely driven by energy intensive activities as being a developing country aspiring to improve the economic situation of the country.
There are some specific features that need elaboration which are discussed below.
6.2 Increased fuel diversity and energy efficiency The NER’s ‘base plan’ represents the plan chosen to minimise costs, assuming moderate growth in electricity demand and moderate penetration of DSM (NER 2002: 14). The base plan for 2001-2025 includes the following:
• The return to service of four mothballed coal-fired power stations or units within stations, mainly for peaking and mid-merit operation (total 3 556 MW). This would start from 2007, when demand forecasts are expected to exceed supply.
• Building four new pulverised coal plants from 2013 for base-load (14 080 MW).
• Gas-fired plants, simple from 2011 and one combined cycle from 2014 (1 950 MW). However, there are alternative uses for gas – chemicals and liquid fuels at Sasol; heat; reducing agent for iron. CCGT has been explored for converting Cape Town’s Athlone power station, but is relatively expensive (Kenny & Howells 2001).
• Pumped storage facilities from 2011 (3 674 MW).
• Demand side interventions (residential and industrial/ commercial; load management and end-use energy efficiency; interruptible load) distributed over the period (equivalent to 4 807 MW).
Modifications of this option might introduce new coal technologies, including supercritical plants, fluidised bed combustion and integrated gasification combined cycle. However, these are more expensive than conventional PF plants (Kenny & Howells 2001). Flue gas desulphurisation is one option for directly reducing pollution from coal-fired power plants, involving flue gases being scrubbed with lime. However, such systems are expensive and may affect tariffs in the future. Potential new technologies may result in the use of coal-bed methane in the Limpopo area which is yet to be tapped (Lloyd 2003). Also, introduction of carbon capture and storage technologies may offer new opportunities which may link in particular with gasification plants.
6.3 The SADC option South Africa already imports some hydroelectricity from Cahora Bassa in Mozambique (5294 GWh in 2000 (NER 2000b)). The potential exists in Southern Africa to extend this significantly. In this scenario, South Africa would become a large importer of hydro-electricity, reducing the need to build new coal-fired power stations. One site on the Congo River at Inga Falls has by itself got the potential for providing 40 GWe to 100 GWe (ERI 2001). Political stability in the DRC is an important – but highly uncertain – pre-requisite for using this option. In the Zambezi river basin, closer to South Africa, there is the potential for an additional 6000 MWe. Technical problems would be sufficient transmission capacity and line losses over long distances, but these could be overcome (Kenny & Howells 2001). More important are political uncertainties, and reaching agreement on contracts that promote the interests and development of all countries involved.
6.4 Renewable energy The government will soon publish a White Paper on renewable energy in South Africa. However, there are already several renewable energy projects in the country. Eskom and DBSA are investing in new large scale windfarms and solar thermal technologies. Also, interests in solar water heaters are growing, provided government embark on some specific polices (Lukamba-Muhiya & Davidson 2003). Solar home systems are yet to demonstrate positive results and the sustainability of the huge subsidy they are attracting is being questioned. However, recently the Minister of Energy said that South Africa has made a commitment to have at least 4% of its electricity generation based on renewable energy, mostly solar and wind by 2013 (Creamer 2003).
Planned imported electricity from hydro resources will also increase the renewable energy mix as well as using energy from bio-industries such as paper and pulp and sugar industries. Recent work
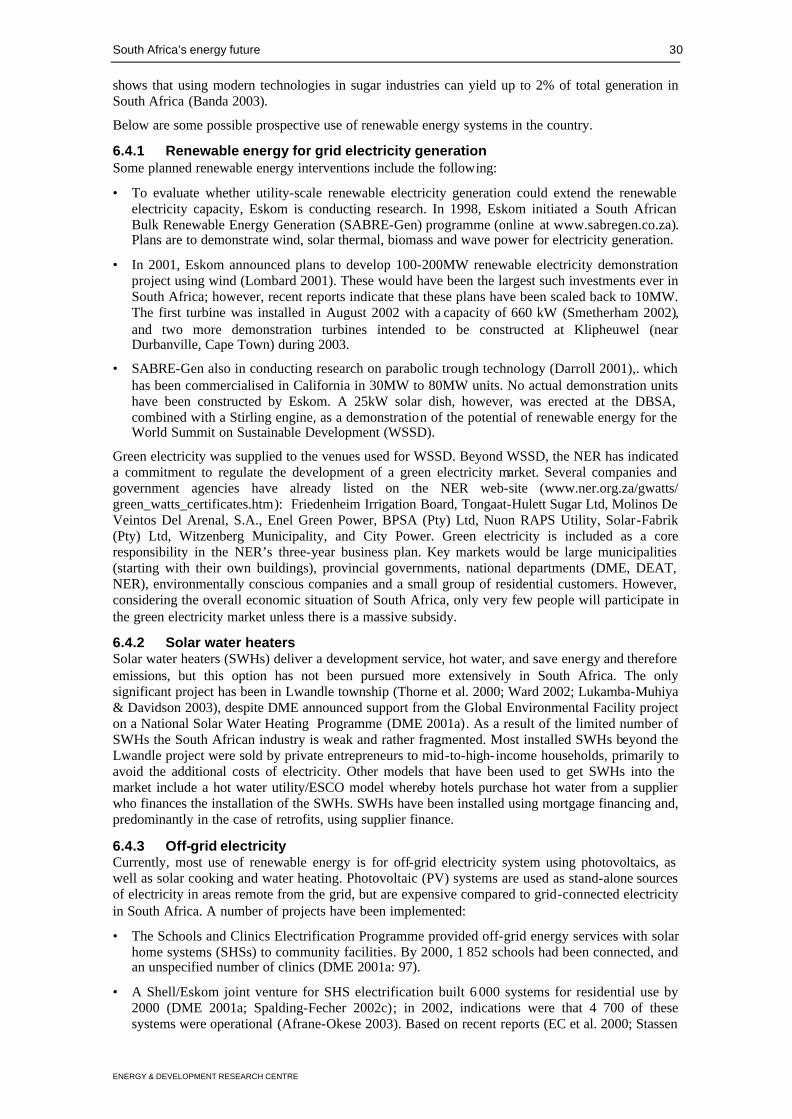
South Africa’s energy future 30
ENERGY & DEVELOPMENT RESEARCH CENTRE
shows that using modern technologies in sugar industries can yield up to 2% of total generation in South Africa (Banda 2003).
Below are some possible prospective use of renewable energy systems in the country.
6.4.1 Renewable energy for grid electricity generation Some planned renewable energy interventions include the following:
• To evaluate whether utility-scale renewable electricity generation could extend the renewable electricity capacity, Eskom is conducting research. In 1998, Eskom initiated a South African Bulk Renewable Energy Generation (SABRE-Gen) programme (online at www.sabregen.co.za). Plans are to demonstrate wind, solar thermal, biomass and wave power for electricity generation.
• In 2001, Eskom announced plans to develop 100-200MW renewable electricity demonstration project using wind (Lombard 2001). These would have been the largest such investments ever in South Africa; however, recent reports indicate that these plans have been scaled back to 10MW. The first turbine was installed in August 2002 with a capacity of 660 kW (Smetherham 2002), and two more demonstration turbines intended to be constructed at Klipheuwel (near Durbanville, Cape Town) during 2003.
• SABRE-Gen also in conducting research on parabolic trough technology (Darroll 2001),. which has been commercialised in California in 30MW to 80MW units. No actual demonstration units have been constructed by Eskom. A 25kW solar dish, however, was erected at the DBSA, combined with a Stirling engine, as a demonstration of the potential of renewable energy for the World Summit on Sustainable Development (WSSD).
Green electricity was supplied to the venues used for WSSD. Beyond WSSD, the NER has indicated a commitment to regulate the development of a green electricity market. Several companies and government agencies have already listed on the NER web-site (www.ner.org.za/gwatts/ green_watts_certificates.htm): Friedenheim Irrigation Board, Tongaat-Hulett Sugar Ltd, Molinos De Veintos Del Arenal, S.A., Enel Green Power, BPSA (Pty) Ltd, Nuon RAPS Utility, Solar-Fabrik (Pty) Ltd, Witzenberg Municipality, and City Power. Green electricity is included as a core responsibility in the NER’s three-year business plan. Key markets would be large municipalities (starting with their own buildings), provincial governments, national departments (DME, DEAT, NER), environmentally conscious companies and a small group of residential customers. However, considering the overall economic situation of South Africa, only very few people will participate in the green electricity market unless there is a massive subsidy.
6.4.2 Solar water heaters Solar water heaters (SWHs) deliver a development service, hot water, and save energy and therefore emissions, but this option has not been pursued more extensively in South Africa. The only significant project has been in Lwandle township (Thorne et al. 2000; Ward 2002; Lukamba-Muhiya & Davidson 2003), despite DME announced support from the Global Environmental Facility project on a National Solar Water Heating Programme (DME 2001a). As a result of the limited number of SWHs the South African industry is weak and rather fragmented. Most installed SWHs beyond the Lwandle project were sold by private entrepreneurs to mid-to-high-income households, primarily to avoid the additional costs of electricity. Other models that have been used to get SWHs into the market include a hot water utility/ESCO model whereby hotels purchase hot water from a supplier who finances the installation of the SWHs. SWHs have been installed using mortgage financing and, predominantly in the case of retrofits, using supplier finance.
6.4.3 Off-grid electricity Currently, most use of renewable energy is for off-grid electricity system using photovoltaics, as well as solar cooking and water heating. Photovoltaic (PV) systems are used as stand-alone sources of electricity in areas remote from the grid, but are expensive compared to grid-connected electricity in South Africa. A number of projects have been implemented:
• The Schools and Clinics Electrification Programme provided off-grid energy services with solar home systems (SHSs) to community facilities. By 2000, 1 852 schools had been connected, and an unspecified number of clinics (DME 2001a: 97).
• A Shell/Eskom joint venture for SHS electrification built 6 000 systems for residential use by 2000 (DME 2001a; Spalding-Fecher 2002c); in 2002, indications were that 4 700 of these systems were operational (Afrane-Okese 2003). Based on recent reports (EC et al. 2000; Stassen
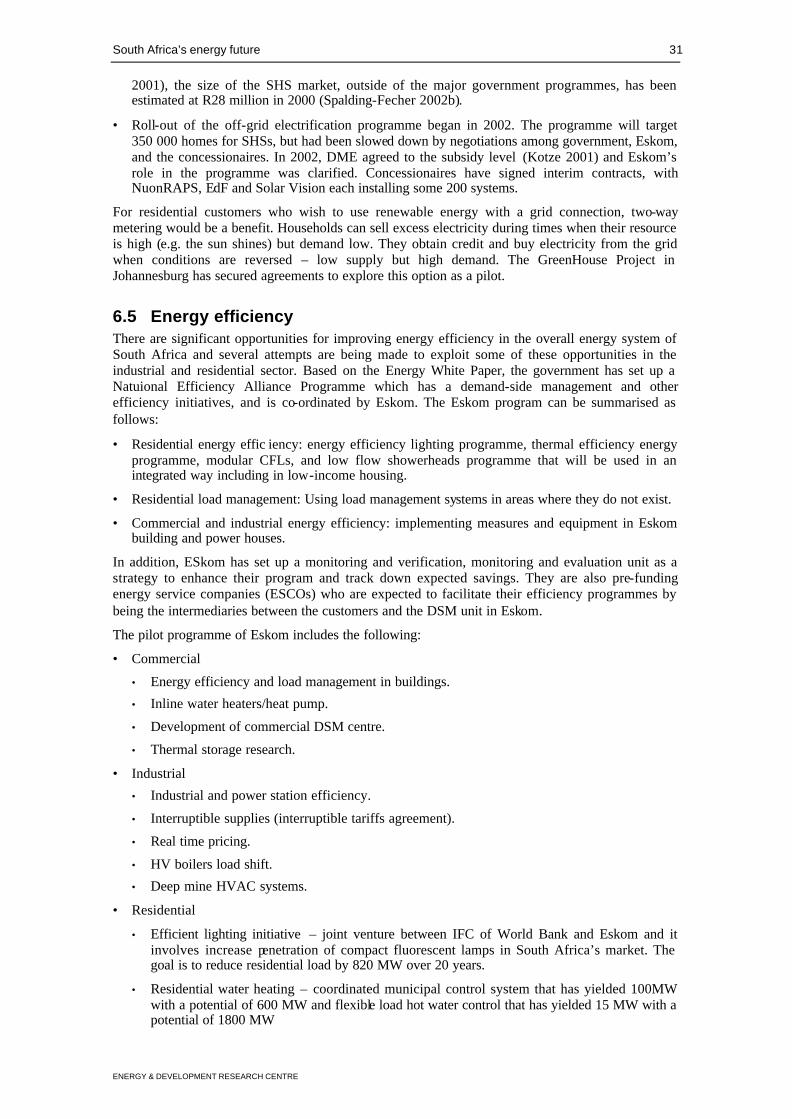
South Africa’s energy future 31
ENERGY & DEVELOPMENT RESEARCH CENTRE
2001), the size of the SHS market, outside of the major government programmes, has been estimated at R28 million in 2000 (Spalding-Fecher 2002b).
• Roll-out of the off-grid electrification programme began in 2002. The programme will target 350 000 homes for SHSs, but had been slowed down by negotiations among government, Eskom, and the concessionaires. In 2002, DME agreed to the subsidy level (Kotze 2001) and Eskom’s role in the programme was clarified. Concessionaires have signed interim contracts, with NuonRAPS, EdF and Solar Vision each installing some 200 systems.
For residential customers who wish to use renewable energy with a grid connection, two-way metering would be a benefit. Households can sell excess electricity during times when their resource is high (e.g. the sun shines) but demand low. They obtain credit and buy electricity from the grid when conditions are reversed – low supply but high demand. The GreenHouse Project in Johannesburg has secured agreements to explore this option as a pilot.
6.5 Energy efficiency There are significant opportunities for improving energy efficiency in the overall energy system of South Africa and several attempts are being made to exploit some of these opportunities in the industrial and residential sector. Based on the Energy White Paper, the government has set up a Natuional Efficiency Alliance Programme which has a demand-side management and other efficiency initiatives, and is co-ordinated by Eskom. The Eskom program can be summarised as follows:
• Residential energy effic iency: energy efficiency lighting programme, thermal efficiency energy programme, modular CFLs, and low flow showerheads programme that will be used in an integrated way including in low-income housing.
• Residential load management: Using load management systems in areas where they do not exist.
• Commercial and industrial energy efficiency: implementing measures and equipment in Eskom building and power houses.
In addition, ESkom has set up a monitoring and verification, monitoring and evaluation unit as a strategy to enhance their program and track down expected savings. They are also pre-funding energy service companies (ESCOs) who are expected to facilitate their efficiency programmes by being the intermediaries between the customers and the DSM unit in Eskom.
The pilot programme of Eskom includes the following:
• Commercial
• Energy efficiency and load management in buildings.
• Inline water heaters/heat pump.
• Development of commercial DSM centre.
• Thermal storage research.
• Industrial
• Industrial and power station efficiency.
• Interruptible supplies (interruptible tariffs agreement).
• Real time pricing.
• HV boilers load shift.
• Deep mine HVAC systems.
• Residential
• Efficient lighting initiative – joint venture between IFC of World Bank and Eskom and it involves increase penetration of compact fluorescent lamps in South Africa’s market. The goal is to reduce residential load by 820 MW over 20 years.
• Residential water heating – coordinated municipal control system that has yielded 100MW with a potential of 600 MW and flexible load hot water control that has yielded 15 MW with a potential of 1800 MW
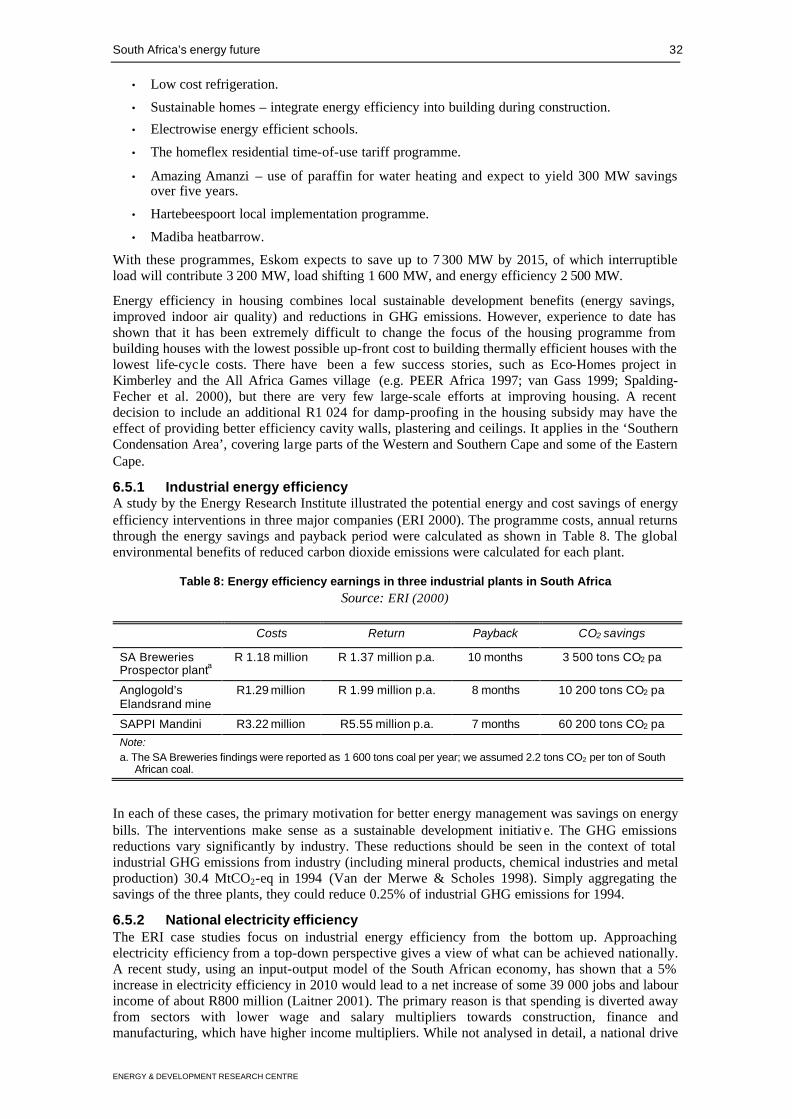
South Africa’s energy future 32
ENERGY & DEVELOPMENT RESEARCH CENTRE
• Low cost refrigeration.
• Sustainable homes – integrate energy efficiency into building during construction.
• Electrowise energy efficient schools.
• The homeflex residential time-of-use tariff programme.
• Amazing Amanzi – use of paraffin for water heating and expect to yield 300 MW savings over five years.
• Hartebeespoort local implementation programme.
• Madiba heatbarrow.
With these programmes, Eskom expects to save up to 7 300 MW by 2015, of which interruptible load will contribute 3 200 MW, load shifting 1 600 MW, and energy efficiency 2 500 MW.
Energy efficiency in housing combines local sustainable development benefits (energy savings, improved indoor air quality) and reductions in GHG emissions. However, experience to date has shown that it has been extremely difficult to change the focus of the housing programme from building houses with the lowest possible up-front cost to building thermally efficient houses with the lowest life-cycle costs. There have been a few success stories, such as Eco-Homes project in Kimberley and the All Africa Games village (e.g. PEER Africa 1997; van Gass 1999; Spalding-Fecher et al. 2000), but there are very few large-scale efforts at improving housing. A recent decision to include an additional R1 024 for damp-proofing in the housing subsidy may have the effect of providing better efficiency cavity walls, plastering and ceilings. It applies in the ‘Southern Condensation Area’, covering large parts of the Western and Southern Cape and some of the Eastern Cape.
6.5.1 Industrial energy efficiency A study by the Energy Research Institute illustrated the potential energy and cost savings of energy efficiency interventions in three major companies (ERI 2000). The programme costs, annual returns through the energy savings and payback period were calculated as shown in Table 8. The global environmental benefits of reduced carbon dioxide emissions were calculated for each plant.
Table 8: Energy efficiency earnings in three industrial plants in South Africa Source: ERI (2000)
Costs Return Payback CO2 savings
SA Breweries Prospector planta
R 1.18 million R 1.37 million p.a. 10 months 3 500 tons CO2 pa
Anglogold’s Elandsrand mine
R1.29 million R 1.99 million p.a. 8 months 10 200 tons CO2 pa
SAPPI Mandini R3.22 million R5.55 million p.a. 7 months 60 200 tons CO2 pa Note: a. The SA Breweries findings were reported as 1 600 tons coal per year; we assumed 2.2 tons CO2 per ton of South
African coal.
In each of these cases, the primary motivation for better energy management was savings on energy bills. The interventions make sense as a sustainable development initiativ e. The GHG emissions reductions vary significantly by industry. These reductions should be seen in the context of total industrial GHG emissions from industry (including mineral products, chemical industries and metal production) 30.4 MtCO2-eq in 1994 (Van der Merwe & Scholes 1998). Simply aggregating the savings of the three plants, they could reduce 0.25% of industrial GHG emissions for 1994.
6.5.2 National electricity efficiency The ERI case studies focus on industrial energy efficiency from the bottom up. Approaching electricity efficiency from a top-down perspective gives a view of what can be achieved nationally. A recent study, using an input-output model of the South African economy, has shown that a 5% increase in electricity efficiency in 2010 would lead to a net increase of some 39 000 jobs and labour income of about R800 million (Laitner 2001). The primary reason is that spending is diverted away from sectors with lower wage and salary multipliers towards construction, finance and manufacturing, which have higher income multipliers. While not analysed in detail, a national drive
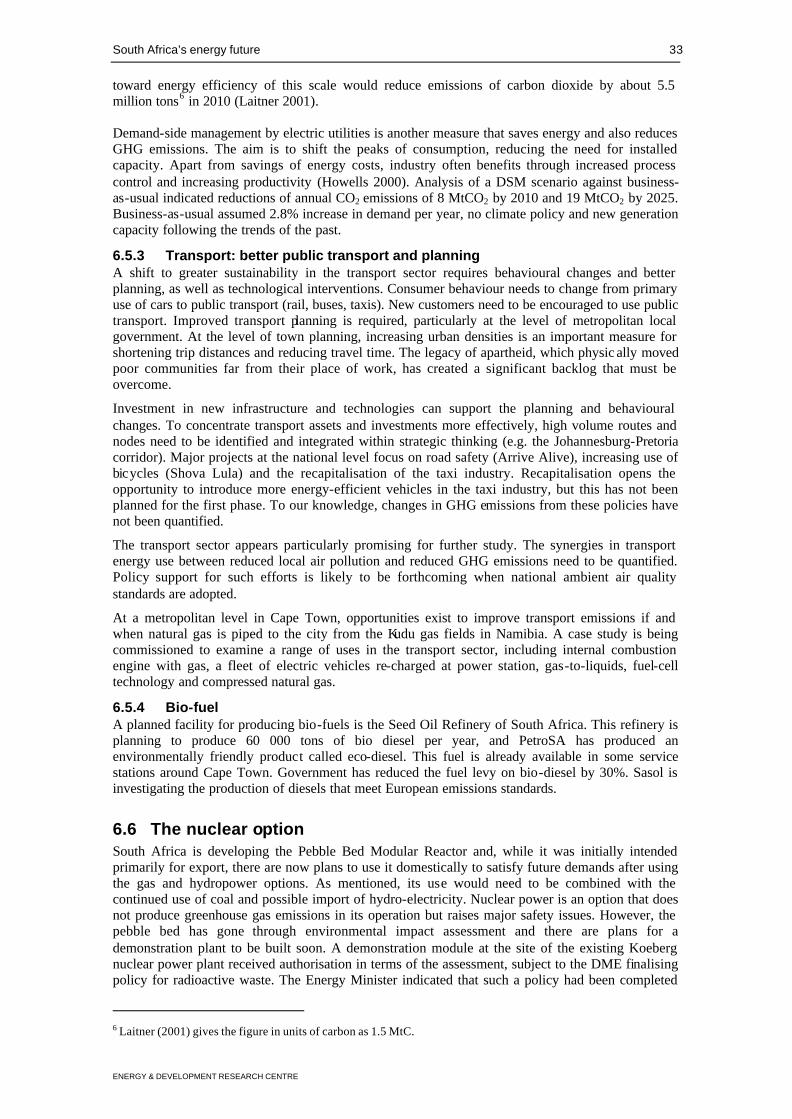
South Africa’s energy future 33
ENERGY & DEVELOPMENT RESEARCH CENTRE
toward energy efficiency of this scale would reduce emissions of carbon dioxide by about 5.5 million tons6 in 2010 (Laitner 2001). Demand-side management by electric utilities is another measure that saves energy and also reduces GHG emissions. The aim is to shift the peaks of consumption, reducing the need for installed capacity. Apart from savings of energy costs, industry often benefits through increased process control and increasing productivity (Howells 2000). Analysis of a DSM scenario against business-as-usual indicated reductions of annual CO2 emissions of 8 MtCO2 by 2010 and 19 MtCO2 by 2025. Business-as-usual assumed 2.8% increase in demand per year, no climate policy and new generation capacity following the trends of the past.
6.5.3 Transport: better public transport and planning A shift to greater sustainability in the transport sector requires behavioural changes and better planning, as well as technological interventions. Consumer behaviour needs to change from primary use of cars to public transport (rail, buses, taxis). New customers need to be encouraged to use public transport. Improved transport planning is required, particularly at the level of metropolitan local government. At the level of town planning, increasing urban densities is an important measure for shortening trip distances and reducing travel time. The legacy of apartheid, which physic ally moved poor communities far from their place of work, has created a significant backlog that must be overcome.
Investment in new infrastructure and technologies can support the planning and behavioural changes. To concentrate transport assets and investments more effectively, high volume routes and nodes need to be identified and integrated within strategic thinking (e.g. the Johannesburg-Pretoria corridor). Major projects at the national level focus on road safety (Arrive Alive), increasing use of bicycles (Shova Lula) and the recapitalisation of the taxi industry. Recapitalisation opens the opportunity to introduce more energy-efficient vehicles in the taxi industry, but this has not been planned for the first phase. To our knowledge, changes in GHG emissions from these policies have not been quantified.
The transport sector appears particularly promising for further study. The synergies in transport energy use between reduced local air pollution and reduced GHG emissions need to be quantified. Policy support for such efforts is likely to be forthcoming when national ambient air quality standards are adopted.
At a metropolitan level in Cape Town, opportunities exist to improve transport emissions if and when natural gas is piped to the city from the Kudu gas fields in Namibia. A case study is being commissioned to examine a range of uses in the transport sector, including internal combustion engine with gas, a fleet of electric vehicles re-charged at power station, gas-to-liquids, fuel-cell technology and compressed natural gas.
6.5.4 Bio-fuel A planned facility for producing bio-fuels is the Seed Oil Refinery of South Africa. This refinery is planning to produce 60 000 tons of bio diesel per year, and PetroSA has produced an environmentally friendly product called eco-diesel. This fuel is already available in some service stations around Cape Town. Government has reduced the fuel levy on bio-diesel by 30%. Sasol is investigating the production of diesels that meet European emissions standards.
6.6 The nuclear option South Africa is developing the Pebble Bed Modular Reactor and, while it was initially intended primarily for export, there are now plans to use it domestically to satisfy future demands after using the gas and hydropower options. As mentioned, its use would need to be combined with the continued use of coal and possible import of hydro-electricity. Nuclear power is an option that does not produce greenhouse gas emissions in its operation but raises major safety issues. However, the pebble bed has gone through environmental impact assessment and there are plans for a demonstration plant to be built soon. A demonstration module at the site of the existing Koeberg nuclear power plant received authorisation in terms of the assessment, subject to the DME finalising policy for radioactive waste. The Energy Minister indicated that such a policy had been completed
6 Laitner (2001) gives the figure in units of carbon as 1.5 MtC.
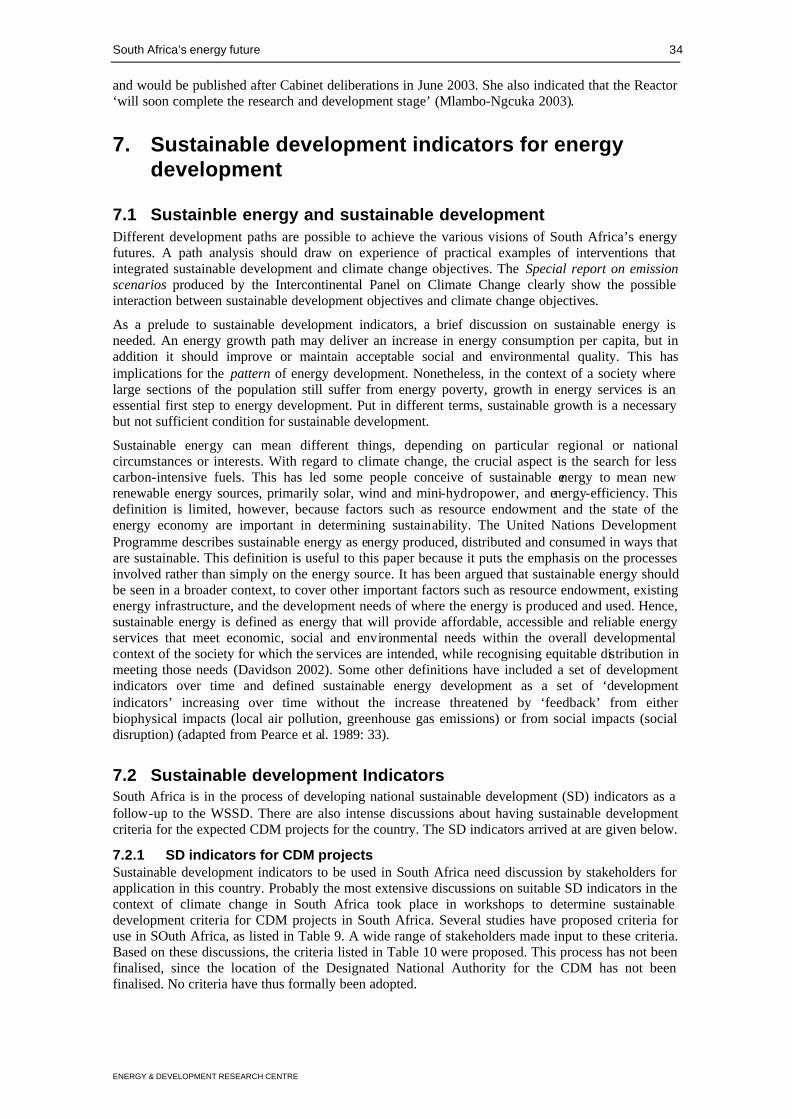
South Africa’s energy future 34
ENERGY & DEVELOPMENT RESEARCH CENTRE
and would be published after Cabinet deliberations in June 2003. She also indicated that the Reactor ‘will soon complete the research and development stage’ (Mlambo-Ngcuka 2003).
7. Sustainable development indicators for energy development
7.1 Sustainble energy and sustainable development Different development paths are possible to achieve the various visions of South Africa’s energy futures. A path analysis should draw on experience of practical examples of interventions that integrated sustainable development and climate change objectives. The Special report on emission scenarios produced by the Intercontinental Panel on Climate Change clearly show the possible interaction between sustainable development objectives and climate change objectives.
As a prelude to sustainable development indicators, a brief discussion on sustainable energy is needed. An energy growth path may deliver an increase in energy consumption per capita, but in addition it should improve or maintain acceptable social and environmental quality. This has implications for the pattern of energy development. Nonetheless, in the context of a society where large sections of the population still suffer from energy poverty, growth in energy services is an essential first step to energy development. Put in different terms, sustainable growth is a necessary but not sufficient condition for sustainable development.
Sustainable energy can mean different things, depending on particular regional or national circumstances or interests. With regard to climate change, the crucial aspect is the search for less carbon-intensive fuels. This has led some people conceive of sustainable energy to mean new renewable energy sources, primarily solar, wind and mini-hydropower, and energy-efficiency. This definition is limited, however, because factors such as resource endowment and the state of the energy economy are important in determining sustainability. The United Nations Development Programme describes sustainable energy as energy produced, distributed and consumed in ways that are sustainable. This definition is useful to this paper because it puts the emphasis on the processes involved rather than simply on the energy source. It has been argued that sustainable energy should be seen in a broader context, to cover other important factors such as resource endowment, existing energy infrastructure, and the development needs of where the energy is produced and used. Hence, sustainable energy is defined as energy that will provide affordable, accessible and reliable energy services that meet economic, social and environmental needs within the overall developmental context of the society for which the services are intended, while recognising equitable distribution in meeting those needs (Davidson 2002). Some other definitions have included a set of development indicators over time and defined sustainable energy development as a set of ‘development indicators’ increasing over time without the increase threatened by ‘feedback’ from either biophysical impacts (local air pollution, greenhouse gas emissions) or from social impacts (social disruption) (adapted from Pearce et al. 1989: 33).
7.2 Sustainable development Indicators South Africa is in the process of developing national sustainable development (SD) indicators as a follow-up to the WSSD. There are also intense discussions about having sustainable development criteria for the expected CDM projects for the country. The SD indicators arrived at are given below.
7.2.1 SD indicators for CDM projects Sustainable development indicators to be used in South Africa need discussion by stakeholders for application in this country. Probably the most extensive discussions on suitable SD indicators in the context of climate change in South Africa took place in workshops to determine sustainable development criteria for CDM projects in South Africa. Several studies have proposed criteria for use in SOuth Africa, as listed in Table 9. A wide range of stakeholders made input to these criteria. Based on these discussions, the criteria listed in Table 10 were proposed. This process has not been finalised, since the location of the Designated National Authority for the CDM has not been finalised. No criteria have thus formally been adopted.
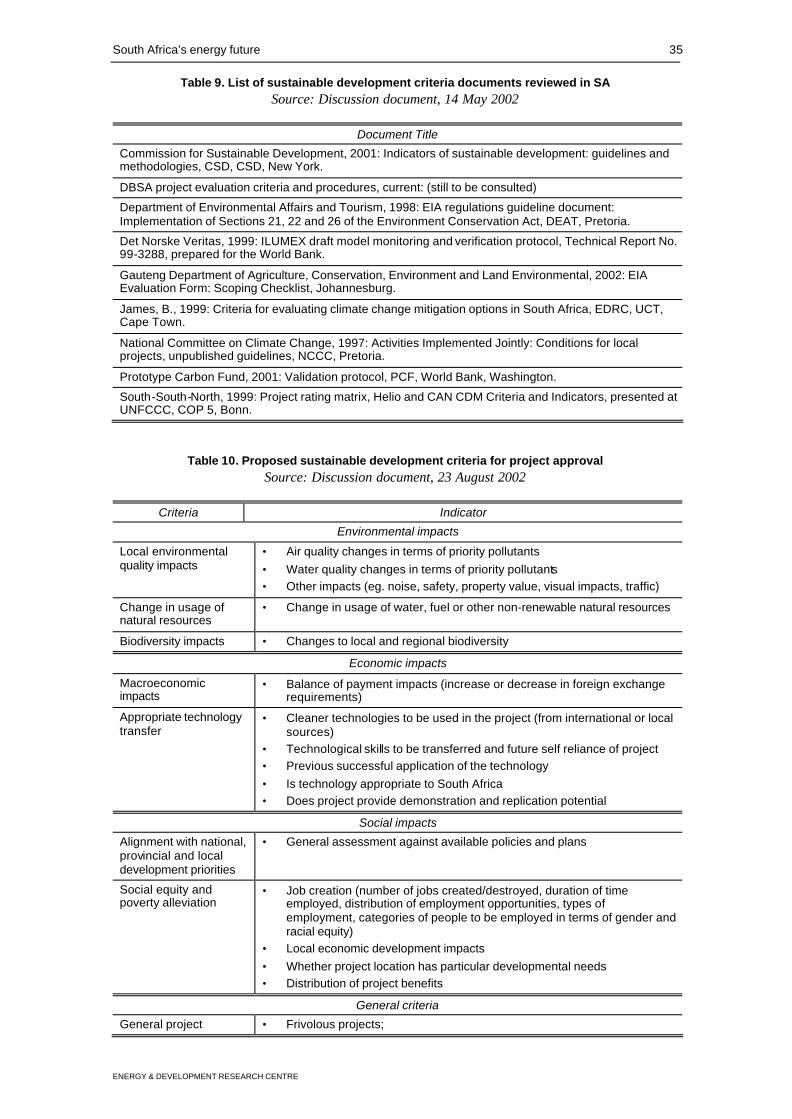
South Africa’s energy future 35
ENERGY & DEVELOPMENT RESEARCH CENTRE
Table 9. List of sustainable development criteria documents reviewed in SA Source: Discussion document, 14 May 2002
Document Title
Commission for Sustainable Development, 2001: Indicators of sustainable development: guidelines and methodologies, CSD, CSD, New York.
DBSA project evaluation criteria and procedures, current: (still to be consulted)
Department of Environmental Affairs and Tourism, 1998: EIA regulations guideline document: Implementation of Sections 21, 22 and 26 of the Environment Conservation Act, DEAT, Pretoria.
Det Norske Veritas, 1999: ILUMEX draft model monitoring and verification protocol, Technical Report No. 99-3288, prepared for the World Bank.
Gauteng Department of Agriculture, Conservation, Environment and Land Environmental, 2002: EIA Evaluation Form: Scoping Checklist, Johannesburg.
James, B., 1999: Criteria for evaluating climate change mitigation options in South Africa, EDRC, UCT, Cape Town.
National Committee on Climate Change, 1997: Activities Implemented Jointly: Conditions for local projects, unpublished guidelines, NCCC, Pretoria.
Prototype Carbon Fund, 2001: Validation protocol, PCF, World Bank, Washington.
South-South-North, 1999: Project rating matrix, Helio and CAN CDM Criteria and Indicators, presented at UNFCCC, COP 5, Bonn.
Table 10. Proposed sustainable development criteria for project approval Source: Discussion document, 23 August 2002
Criteria Indicator
Environmental impacts
Local environmental quality impacts
• Air quality changes in terms of priority pollutants • Water quality changes in terms of priority pollutants • Other impacts (eg. noise, safety, property value, visual impacts, traffic)
Change in usage of natural resources
• Change in usage of water, fuel or other non-renewable natural resources
Biodiversity impacts • Changes to local and regional biodiversity
Economic impacts
Macroeconomic impacts
• Balance of payment impacts (increase or decrease in foreign exchange requirements)
Appropriate technology transfer
• Cleaner technologies to be used in the project (from international or local sources)
• Technological skills to be transferred and future self reliance of project • Previous successful application of the technology • Is technology appropriate to South Africa • Does project provide demonstration and replication potential
Social impacts
Alignment with national, provincial and local development priorities
• General assessment against available policies and plans
Social equity and poverty alleviation
• Job creation (number of jobs created/destroyed, duration of time employed, distribution of employment opportunities, types of employment, categories of people to be employed in terms of gender and racial equity)
• Local economic development impacts • Whether project location has particular developmental needs • Distribution of project benefits
General criteria
General project • Frivolous projects;
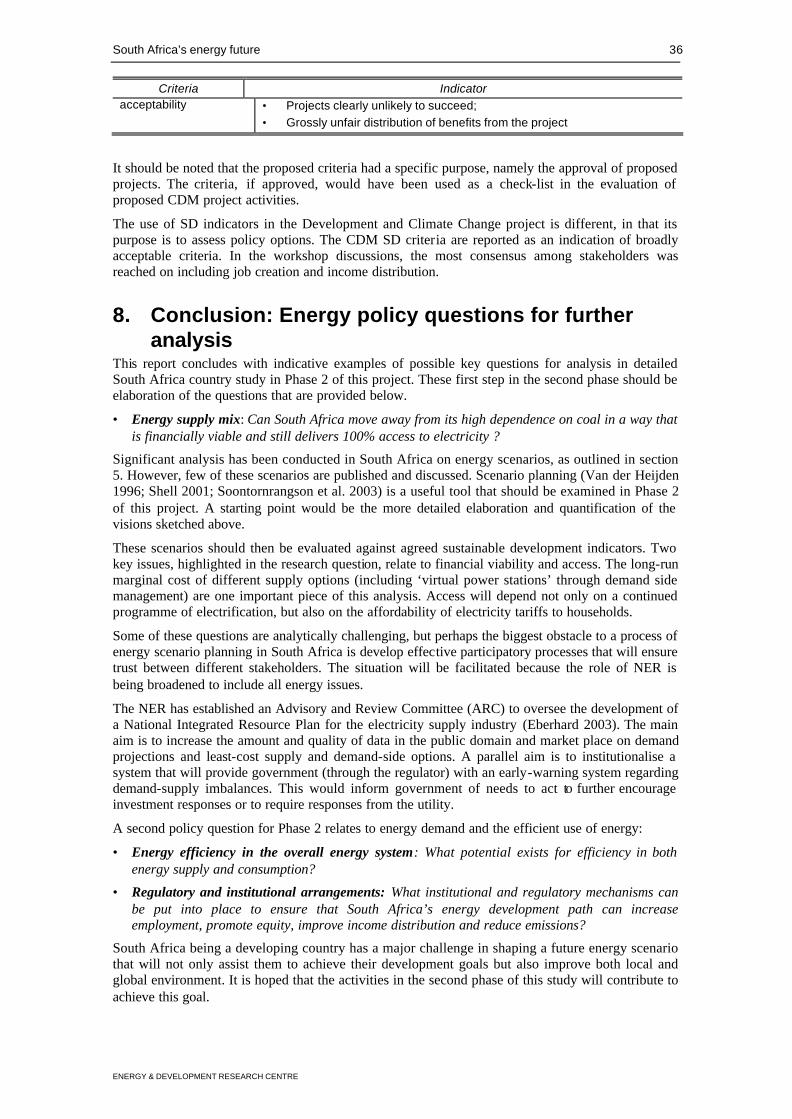
South Africa’s energy future 36
ENERGY & DEVELOPMENT RESEARCH CENTRE
Criteria Indicator acceptability • Projects clearly unlikely to succeed;
• Grossly unfair distribution of benefits from the project
It should be noted that the proposed criteria had a specific purpose, namely the approval of proposed projects. The criteria, if approved, would have been used as a check-list in the evaluation of proposed CDM project activities.
The use of SD indicators in the Development and Climate Change project is different, in that its purpose is to assess policy options. The CDM SD criteria are reported as an indication of broadly acceptable criteria. In the workshop discussions, the most consensus among stakeholders was reached on including job creation and income distribution.
8. Conclusion: Energy policy questions for further analysis
This report concludes with indicative examples of possible key questions for analysis in detailed South Africa country study in Phase 2 of this project. These first step in the second phase should be elaboration of the questions that are provided below.
• Energy supply mix: Can South Africa move away from its high dependence on coal in a way that is financially viable and still delivers 100% access to electricity ?
Significant analysis has been conducted in South Africa on energy scenarios, as outlined in section 5. However, few of these scenarios are published and discussed. Scenario planning (Van der Heijden 1996; Shell 2001; Soontornrangson et al. 2003) is a useful tool that should be examined in Phase 2 of this project. A starting point would be the more detailed elaboration and quantification of the visions sketched above.
These scenarios should then be evaluated against agreed sustainable development indicators. Two key issues, highlighted in the research question, relate to financial viability and access. The long-run marginal cost of different supply options (including ‘virtual power stations’ through demand side management) are one important piece of this analysis. Access will depend not only on a continued programme of electrification, but also on the affordability of electricity tariffs to households.
Some of these questions are analytically challenging, but perhaps the biggest obstacle to a process of energy scenario planning in South Africa is develop effective participatory processes that will ensure trust between different stakeholders. The situation will be facilitated because the role of NER is being broadened to include all energy issues.
The NER has established an Advisory and Review Committee (ARC) to oversee the development of a National Integrated Resource Plan for the electricity supply industry (Eberhard 2003). The main aim is to increase the amount and quality of data in the public domain and market place on demand projections and least-cost supply and demand-side options. A parallel aim is to institutionalise a system that will provide government (through the regulator) with an early-warning system regarding demand-supply imbalances. This would inform government of needs to act to further encourage investment responses or to require responses from the utility.
A second policy question for Phase 2 relates to energy demand and the efficient use of energy:
• Energy efficiency in the overall energy system: What potential exists for efficiency in both energy supply and consumption?
• Regulatory and institutional arrangements: What institutional and regulatory mechanisms can be put into place to ensure that South Africa’s energy development path can increase employment, promote equity, improve income distribution and reduce emissions?
South Africa being a developing country has a major challenge in shaping a future energy scenario that will not only assist them to achieve their development goals but also improve both local and global environment. It is hoped that the activities in the second phase of this study will contribute to achieve this goal.
South Africa’s energy future 37
ENERGY & DEVELOPMENT RESEARCH CENTRE
References Afrane-Okese, Y 2003. Operational Challenges of Large Scale Off-Grid Programme in South Africa. NER Quarterly
Journal (4).
African Energy 2001. Online at Africanenergy.co.za.
ANC (African National Congress) 1994. The Reconstruction and Development Programme: A policy framework. Johannesburg, Umanyano.
Anon. 2000. SA Failing To Cap Gini Figure. Africa News Service/Business Day. 30 March Johannesburg.
ASSA (Actuarial Society of South Africa) 2000. AIDS demographic model 2000lite. http://www.assa.org.za/aidsmodel.asp.
Auf der Heyde, T & Thomas, S 2002. The PBMR project: an assessment of its economic viability. South African Journal of Science 98 (Jan / Feb): 36-42.
Banda, A 2003. Electricity Production From Sugar Industries In Africa: A Case Of South Africa. Half Thesis. Energy and Development Research Centre. Cape Town, University of Cape Town.
Berger, D 2000. South Africa Yearbook 2000/2001 . Pretoria, Government Communication and Information System.
Biggs, R & Greyling, A 2001. Project energy. Report for the Paraffin Safety Association of Southern Africa. Cape Town, Markinor.
Borchers, M 2000. Review of international and local experience with Integrated Energy Planning (IEP) and Integrated Resource Planning (IRP). Pretoria, Department of Minerals and Energy.
Borchers, M, Qase, N, Gaunt, T, Mavhungu, J, Winkler, H, Afrane-Okese, Y & Thom, C 2001. National Electrification Programme evaluation: Summary report. Evaluation commissioned by the Department of Minerals & Energy and the Development Bank of Southern Africa. Cape Town, Energy & Development Research Centre, University of Cape Town.
Calitz, J M 2000a. Provincial population projections, 1996-2001: High HIV/AIDS impact. September. Johannesburg, Development Bank of Southern Africa.
Calitz, J M 2000b. Provincial population projections, 1996-2001: Low HIV/AIDS impact. August. Johannesburg, Development Bank of Southern Africa.
Chamber of Mines (Chamber of Mines of South Africa) 2000. South African mining industry – statistical tables 2000. Johannesburg.
Clark, A 2001. Implications of power sector reform in South Africa on poor people's access to energy: Lessons for Africa. Proceedings of the African high-level regional meeting on energy and sustainable development for the ninth session of the Commission on Sustainable Development, Nairobi, United Nations Environment Programme.
Clark, A & Mavhungu, J 2000. Promoting public benefit energy-efficiency investment in new power contexts in South Africa. Cape Town, Energy & Development Research Centre, University of Cape Town.
Creamer, T 2003. Mlambo-Ngcuka's natural gas prayer. Creamer Media's Engineering News October 24-30 2003. 23 (41): pp. 9.
Darroll, L 2001. Can solar energy serve South Africa's electricity needs? African Energy Journal 3 (4): pp. 14-16.
Davidson, O 2002. Sustainable energy and climate change: African perspectives. O Davidson and D Sparks (Eds). Developing energy solutions for climate change: South African research at EDRC , Energy & Development Research Centre, University of Cape Town : 145-152.
De Villiers, M, Howells, M & Kenny, A 1999. Sustainable energy for South Africa: Energy scenarios from 1995 to 2025. Report for Eskom and National Research Foundation. Energy Research Institute, University of Cape Town.
Department of Arts, c, Science and Technology 1999. Foresight – Energy. Pretoria. DME (Department of Minerals and Energy) 1998. White Paper on Energy Policy for South Africa. Pretoria, DME.
DME (Department of Minerals and Energy) 2000. Energy Balances for South Africa 1993-98. Pretoria, DME.
DME (Department of Minerals and Energy) 2001a. Annual Report 2000 – 2001. Pretoria.
DME (Department of Minerals and Energy) 2001b. South Africa National Energy Balance 1999. Microsoft Excel Spreadsheet. Pretoria, Received 22 August.
DME (Department of Minerals and Energy) 2002a. Draft white paper on the promotion of renewable energy and clean energy development – Part 1. 23 August. Pretoria.
DME (Department of Minerals and Energy) 2002b. South Africa National Energy Balance 2000. Pretoria, DME. Received 6 June.
DTI (Department of Trade and Industry) 1996. Growth, Employment and Redistribution: A macro -economic strategy. Pretoria. http://www.polity.org.za/html/govdocs/policy/gear-02.html.
Dubash, N 2001. The public benefits agenda in power sector reform. Energy for Sustainable Development V (2): 5-14.
Dubash, N (Ed) 2002. Power politics: Equity and environment in electricity reform. Washington DC, World Resources Institute.
South Africa’s energy future 38
ENERGY & DEVELOPMENT RESEARCH CENTRE
Eberhard, A & Van Horen, C 1995. Poverty and Power: Energy and the South African state. London, Pluto Press and UCT Press.
Eberhard, A A 2003. Personal communication. Member of the board of the National Electricity Regulator. 19 August. EC, DBSA & ISES (European Commission DG XVII, Development Bank of Southern Africa, International Solar
Energy Society) 2000. Renewable energy technologies in SADC – a guide for investors. Midrand, Development Bank of Southern Africa. January.
ECON 2000. Electricity market scenarios: Phase 1. Commissioned by the National Electricity Regulator. Oslo, ECON Centre for Economic Analysis.
Edjekumhene, I, Amadu, M B & Brew-Hammond, A 2001. Preserving and enhancing public benefits under power sector reform: the case of Ghana. Energy for Sustainable Development V (2): 39-47.
EDRC (Energy & Development Research Centre) 2003. Policies and measures for renewable energy and energy efficiency in South Africa. Prepared for the Sustainable Energy & Climate Change Partnership. Cape Town, EDRC, University of Cape Town.
ERI (Energy Research Institute) 2000. The 3E strategy: energy efficiency earnings. Management summary. University of Cape Town. September.
ERI (Energy Research Institute) 2001. Preliminary energy outlook for South Africa. 10 October. University of Cape Town. www.dme.gov.za.
Eskom 1997. Integrated Electricity Planning 6 (IEP6). Sandton, Eskom. Fine, B & Rustomjee, Z 1996. The political economy of South Africa : from minerals-energy complex to
industrialization . London, C. Hurst.
Howells, M I 2000. Baseline and greenhouse gas mitigation options for bulk energy supply. Energy Research Institute, University of Cape Town.
IEA (International Energy Agency) 2002a. Key World Energy Statistics from the IEA. Paris, IEA. IEA (International Energy Agency) 2002b. World Energy Outlook: Energy & Poverty. Paris, IEA.
IEA (International Energy Agency) 2003. Online at www.eia.doe.gov/emeu/cabs/safrica.html.
Kenny, A & Howells, M 2001. Energy futures: trends and options for the world and for South Africa, with emphasis on the generation of electricity. Energy Management News June. 7 (2): pp. 10-17. http://www.eri.uct.ac.za/Energy%20Managment%20News/June2001/01.pdf.
Kotze, I A 2001. Letter from DME to off-grid concessionaries on evaluation of business plans. Pretoria, Department of Minerals and Energy. 11 July.
Laitner, S 2001. Energy efficiency investments: A dynamic link between environmental quality and positive job benefits for South Africa. Proceedings of the ninth conference on Domestic Use of Energy Conference, Cape Town, 10-12 April. Cape Technikon.
Lloyd, P J D 2003. Supporting economic development through sustainable energy investment
Case study: Coal-bed methane potential of South African coal mines, EDRC, University of Cape Town.
Lombard, E 2001. Eskom to harness wind: multi-million rand project in Western Cape will investigate environmentally friendly, alternative energy source. Sunday Times . 25 February Johannesburg.
Lukamba-Muhiya, J M & Davidson, O R 2003. Dissemination of solar water heaters in South Africa: Policy Perspectives. Journal of Energy in Southern Africa 14 (3): 99-105. August 2003.
Marrs, D 2000a. Cape power station likely after gas find. Business Day . 3 April Johannesburg.
Marrs, D 2000b. Sasol takes over stakes in Temane gas field. Business Day. Business Day . 3 March Johannesburg.
Martens, J-W, De Lange, T J, Cloin, J, Szewczuk, S, Morris, R & Zak, J 2001. Accelerating the market penetration of renewable energy technologies in South Africa. Brussels, ECN, CSIR, UCCEE and RMA for the European Commission Synergy Programme. www.ecn.nl/unit_bs/resa/main.html.
Mlambo-Ngcuka, P 2002. Budget vote speech by Minister of Minerals and Energy, Ms. Phumzile Mlambo-Ngcuka. Cape Town. 7 May 2002.
Mlambo-Ngcuka, P 2003. Budget vote speech by Minister of Minerals and Energy, Ms. Phumzile Mlambo-Ngcuka. Minerals and energy: a catalyst in pushing back frontiers of poverty. Cape Town, Parliament. 15 May 2003.
NEPAD 2001. New Partnership for Africa's Development. October. www.gov.za/issues/nepad.htm.
NEPAD (New Partnership for Africa's Development) 2002. A summar of NEPAD action plans. Midrand and Ibadan.
NER (National Electricity Regulator) 1999. Electricity supply statistics for South Africa 1999. Sandton, NER.
NER (National Electricity Regulator) 2000a. Annual Report 2000-2001. Sandton, NER. NER (National Electricity Regulator) 2000b. Electricity supply statistics for South Africa 2000. Pretoria, NER.
NER (National Electricity Regulator) 2001a. Electricity supply statistics for South Africa 2001. Pretoria, NER.
NER (National Electricity Regulator) 2001b. Lighting up South Africa 2001. Pretoria.
NER 2001c. Non-grid electrification. Electricity Regulatory Journal February. pp. 4-5.
NER (National Electricity Regulator) 2001/2. National Integrated Resource Plan. Pretoria. NER (National Electricity Regulator) 2002. An integrated electricity outlook for South Africa. Pretoria, NER. March.
www.ner.org.za/publs.htm.

South Africa’s energy future 39
ENERGY & DEVELOPMENT RESEARCH CENTRE
Oelsner, H F W 2001. Harvesting the wind in Southern Africa. Darling, South African Wind Energy Association.
PBMR Ltd (Pebble Bed Modular Reactor (Proprietary) Limited) 2002. PBMR: Report on the proposed demonstration module and potential commercialization of the pebble bed modular reactor. 011252-160. Sandton.
Pearce, D, Markanda, A & Barier, E 1989. Blueprint for a green economy . London, Earthscan.
PEER Africa 1997. Housing as if people mattered. The story of Kutlawanong, South Africa. A no regrets case study. United Nations Framework Convention on Climate Change Third Conference of the Parties, Kyoto, November.
Petroleum Agency 2001. Online at www.petroleumagencysa.com/speeches/gas_resources.pdf. PWC (PriceWaterhouseCoopers) 2000. Consolidated emerging views. Electricity distribution industry restructuring
project: Working paper 7. Johannesburg.
Qase, N, Lloyd, P J D & Van Zyl, H 2000. Intervention potential for low smoke fuels in the coal distribution chain, final report. Cape Town, Energy & Development Research Centre.
Reddy, A K N 2001. Indian power sector reform for sustainable development: the public benefits imperative. Energy for Sustainable Development V (2): 74-81.
RSA (Republic of South Africa) 2000. An accelerated agenda towards the restructuring of state owned enterprises: Policy framework. Pretoria, Ministry of Public Enterprises. At www.dpe.gov.za/docs/policy/ policyframework01.htm.
RSA (Republic of South Africa) 2001. Technical Background Document for the Development of a National Ambient Air Quality Standard for Sulphur Dioxide. Government Gazette Vol 432, No. 22134, 1 June 2001. Pretoria, Department of Environmental Affairs & Tourism.
RSA (Republic of South Africa) forthcoming. South African country study on climate change. Mitigation options project. Draft. Pretoria, Department of Environmental Affairs & Tourism.
SADC (Southern African Development Community) 1996. SADC energy co-operation policy and strategy. Luanda, Angola, SADC Energy Sector Technical and Adminis trative Unit.
SADC 2001a. Key Priorities for SADC. SADC Sub Regional consultations in preparation for the WSSD, Mauritius.
SADC 2001b. SADC Progress report on the implementation of agenda 21 and sustainable development. A report submitted to the 2002 world Summit on sustainable development . Maseru.
SANEA 2003. South African Energy Profile 2003. Melville, South Africa.
SAPIA (South African Petroleum Industry Association) 2001. Annual Report. Cape Town, SAPIA.
SARB (South African Reserve Bank) 2002. Quarterly Bulletin March 2002. Pretoria.
Sasol 2002. Online at www.sasol.com/sasol_internet.
Schäffler, J L 2000. Distributed generation in South Africa: Economically sound or environmentally benign? Journal of Energy in Southern Africa 11 (2): 208-213.
Shell (Shell International) 2001. Energy needs, choices and possibilities: Scenarios to 2050. London.
Smetherham, J-A 2002. Eskom's latest study is blowing in the wind. Cape Times. 22 August: 4.
Soontornrangson, W, Evans, D G, Fuller, R J & Stewart, D F 2003. Scenario planning for electricity supply. Energy Policy 31: 1647 –1659.
Spalding-Fecher, R 2002a. Energy and energy policies in South Africa: an overview. NER Quarterly Journal 1 (1): 1-18. October.
Spalding-Fecher, R 2002b. Energy sustainability indicators for South Africa. Cape Town, Energy & Development Research Centre, University of Cape Town.
Spalding-Fecher, R, Clark, A & James, B 2002. Economic assessment and development evaluation of climate change mitigation projects in South Africa. O Davidson and D Sparks (Eds). Developing energy solutions for climate change: South African research at EDRC . Cape Town, Energy & Development Research Centre, University of Cape Town : 20-43.
Spalding-Fecher, R & Matibe, D K 2003. Electricity and externalities in South Africa. Energy Policy 31 (8): 721-734.
Spalding-Fecher, R, Williams, A & Van Horen, C 2000. Energy and environment in South Africa: charting a course to sustainability. Energy for Sustainable Development 4 (4): 8-17. December.
Spicer, D 2003. Keeping the lights burning. Creamer Media's Engineering News October 24-30 2003. 23 (41): pp. 16-17.
SSA (Statistics South Africa) 2000. Stats in brief. Pretoria, SSA.
SSA (Statistics South Africa) 2002. Statistical release P0302. Pretoria, Statistics South Africa. Stassen, D 2001. Personal communication. 1 March.
Thorne, S, Spalding-Fecher, R & Wamukonya, N 2000. Residential solar water heating as a potential CDM project: A South African case study. Paper presented at workshop on Forging New Links and Reinforcing National Capacities on Climate Change: Challenges and Opportunities for CDM in Africa, 8-10 May 2000, Cape Town.
Trollip, H 1996. Overview of the South African energy sector. Report No. EG9404. Pretoria, Department of Minerals & Energy.
South Africa’s energy future 40
ENERGY & DEVELOPMENT RESEARCH CENTRE
UCT (University of Cape Town) 2002. Options for a basic electricity support tariff: Analysis, issues and recommendations for the Department of Minerals & Energy and Eskom. Cape Town.
Van der Heijden, K 1996. Scenarios: the art of strategic conversation . Chichester, Wiley. Van der Merwe, M R & Scholes, R J 1998. South African Greenhouse Gas Emissions Inventory for the years 1990
and 1994. Pretoria, National Committee on Climate Change.
van Gass, I 1999. All Africa Games village: showcase for water- and energy efficiency. Energy Management News 5 (2): 1,6,9. June.
Venter, I 2001. Africa's big gas adventure begins. Engineering News October 5-11 pp. 16-17. Visser, M, Spalding-Fecher, R & Leiman, A 1999. Manufacturing and economic growth. Paper No. 10: World
Wildlife Fund Macroeconomic Reforms and Sustainable Development in Southern Africa Project. Cape Town, Energy & Development Research Centre, University of Cape Town.
Ward, S 2002. The Energy Book for urban development in South Africa . Cape Town, Sustainable Energy Africa.
Winkler, H & Mavhungu, J 2001. Green power, public benefits and electricity industry restructuring. Cape Town, Energy & Development Research Centre, University of Cape Town.
World Bank 2000. World Development Report 2000/2001 . Oxford, Oxford University Press.