South Africa Yearbook 2015/16 Economy€¦ · · 2017-01-06South Africa Yearbook 2015/16 107...
26
Economy South Aica Yearbook 2015/16
Transcript of South Africa Yearbook 2015/16 Economy€¦ · · 2017-01-06South Africa Yearbook 2015/16 107...
Economy
South Africa Yearbook 2015/16 107
Economy
South Africa Yearbook 2015/16 108
EconomySouth Africa Yearbook 2015/16
Economy
South Africa Yearbook 2015/16 107
Economy
South Africa Yearbook 2015/16 108
South Africa could take advantage of its growing working-age population to help accelerate its growth to 5,4% a year and double per capita incomes by 2030, according to the South Africa Economic Update released in August 2015 by the World Bank.
The report explores how the projected growth can be attained by creating a virtuous circle of job-intensive growth, improved productivity, higher savings and better education attainment, particularly for the youth who will drive the growth in the working age population in the coming decades.
The seventh edition of the report has found that South Africa is undergoing a profound demographic shift in which the share of its working-age population between 15 and 64 years has expanded substantially and will continue to grow for another five decades.
Since 1994, the working-age population expanded by 11 million and comprises 65% of South Africa’s population of 54,9 million in 2015.
By August 2015, about 60% of the 5,2 unemployed people in South Africa were between 15 and 34 years old, did not have matric (high school) qualification, and the youth unemployment rate was about 50%.
The National Development Plan (NDP), South Africa’s strategy for reducing unemployment, inequality and poverty by 2030, provides a strong platform for collaboration among business, government, labour and civil society.
The plan promotes enhanced competi-tiveness, expanded infrastructure, greater spatial efficiency in growing cities, and accelerated rural development. It prioritises measures to build a capable, effective state that delivers services to citizens while encouraging business investment and growth.
To counter unemployment levels, especially amongst young people, government aims to create six million work opportunities by 2019.
Economic indicatorsDomestic outputEconomic activity in South Africa increased at a slightly slower pace in the fourth quarter of 2015, according to the South African Reserve Bank’s (SARB) Quarterly Bulletin, released in March 2016.
Following a contraction in the second quarter of 2015, annualised growth in real gross domestic product (GDP) accelerated to 0,7% in the third quarter before slowing marginally to 0,6% in the fourth quarter.
The slower growth in the final quarter could
be attributed to a decline in the real value added by the secondary sector alongside steady, but slower, growth in the tertiary sector. The real value added by the primary sector declined further over the period albeit at a somewhat slower pace than in the third quarter. Excluding the contribution of the drought-affected agricultural sector, annualised growth in real
GDP decelerated marginally from 1,1% in the third quarter of 2015 to 0,9% in the final quarter.
Consistent with the sluggish quarter-to-quarter growth registered throughout the year, growth inreal gross domestic production moderated further from 1,5% in 2014 to a disappointing 1,3% in 2015 – with the exception of 2009, the slowest rate of expansion during the past 17 years. On average, annual growth amounted to 2,3% between 2010 and 2015 compared with an annual average rate of 4,0% in the 10 years prior to 2009.
The lacklustre performance of the South African economy in 2015 could, to an important extent, be attributed to subdued business and consumer confidence levels, muted demand conditions, ongoing supply-side constraints, a further decline in the prices of key export commodities, and the knock-on effects of the widespread drought conditions in many parts of the country.
Subsequent to a sharp contraction of 10,4% in the third quarter of 2015, the real value added by the primary sector declined further, albeit at a slower pace in the final quarter of the year. Agricultural output shrank at a faster pace, alongside an increase in the real output of the mining sector.
Activity in the agricultural sector contracted unabatedly throughout 2015. In addition to the devastating effect of dry weather conditions on field crops as well as animal and horticultural production, the country also experienced record-high temperatures in the final quarter of 2015, further scorching arable land.
Livestock production held up well over the period, mitigating the rate of contraction. Negative growth in all four quarters of 2015 accordingly culminated in an annual decline of 8,4% for the year as a whole.
Early indications do not bode well for the 2015/16 planting and production season. According to the February 2016 estimates of the Crop Estimate Committee, South African producers are expected to plant roughly a 26% smaller area than in the preceding year.
Preliminary estimates of the commercial
Economy
South Africa Yearbook 2015/16 109
Economy
South Africa Yearbook 2015/16 110
maize crop for the 2015/16 season amount to 7,3 million tons as opposed to 9,9 million tons in the 2014/15 season. Taking into account the available stock of white and yellow maize, the country might have to import white and yellow maize to meet annual domestic commercial consumption of roughly 9,6 million tons.
Mining production picked up in the final quarter of 2015; annualised growth in real output accelerated from -9,8% in the third quarter of 2015 to 1,5% in the final quarter, supported by the higher production of especially diamonds and nickel. The production volumes of coal, platinum-group metals and building materials increased at a more moderatepace despite further steps to enhance operational efficiencies, while the production of gold,manganese ore and other metallic minerals contracted over the period.
On an annual basis, growth in the real output of the mining sector turned around from -1,6% in 2014 to 3,0% in 2015, adding 0,2 percentage points to growth in aggregate GDP. Mining production in 2015 benefited mainly from the normalisation in platinum production following improved productivity and cost-containment measures introduced at a number of platinum mines after the protracted labour strike in the industry in 2014.
In addition, in some of the other domestic mining subsectors work disruptions as a result of wage disputes were less prevalent in 2015. Despite this improved performance, the industry continued to be adversely affected by infrastructural constraints, policy uncertainty, ongoing labour tension, declining commodity prices, rising operational costs, and a global oversupply of certain mining products.
Owing mainly to the disappointing performance of the manufacturing sector, the real value added by the secondary sector switched from an annualised increase of 3,3% in the third quarter of 2015 to a decline of 1,5% in the fourth quarter. Activity in the electricity, gas and water as well as in the construction sectors strengthened over the period.
The quarter-to-quarter pickup in the real value added by the manufacturing sector in the third quarter of 2015 was short-lived as real manufac-turing output contracted anew in the fourth quarter. Weighed down by lower production of primarily durable manufactured products, the real value added by the manufacturing sector contracted at an annualised rate of 2,6% over the period – subtracting 0,3 percentage points from overall economic growth in the final quarter
of 2015. Production volumes declined in the subsectors
supplying basic iron and steel; non-ferrous metal products and machinery; electrical machinery; and motor vehicles, parts and accessories and other transport equipment. The weaker demand for processed metals affected by, among other factors, the slowdown in economic activity in China probably weighed on the production of these products.
By contrast, the production of non-durable goods rose over the period in line with increased consumer demand for these products. Increases were mainly evident in the production of petroleum and chemical products and of food and beverages. Consistent with the somewhat higher production levels in a number of subsectors, the utilisation of production capacity in the manufac-turing sector increased from 80,1% in the third quarter of 2015 to 80,5% in the final quarter.
Annual growth in the real output of the manufacturing sector tapered off between 2010 and 2012, and thereafter remained virtually unchanged up to 2015; real output rose by only 0,1% in 2015. Activity in the South African manufacturing sector continued to be negatively affected by weak domestic and global demand, the slowdown in activity in the agricultural sector, declining commodity prices affecting the mining sector, and electricity-supply constraints.
Following two successive quarters of negative growth, the real output of the electricity, gas and water sector advanced at a rate of 0,9% in the fourth quarter of 2015. Scheduled maintenance done in preceding months at various plants together with additional electricity generated by independent power producers (IPPs) contributed to a more steady supply of electricity over the period.
Reduced demand, mainly from energy-intensive sectors such as mining and metal processing, as well as the implementation of alternative energy sources by businesses and consumers probably also reduced electricity demand in the final quarter of 2015.
Consistent with the overall slowdown in domestic economic activity, the real value added by the electricity, gas and water sector contracted by 1,0% in 2015, the sharpest rate of decline since 2009.
The real value added by the construction sector increased somewhat in the fourth quarter of 2015 as activity ticked up in essentially the non-residential building and civil construction segments. Residential building activity tapered off over the period.
Economy
South Africa Yearbook 2015/16 109
Economy
South Africa Yearbook 2015/16 110
In contrast to the usually more volatile goods-producing sectors, the services sector recorded relatively steady quarter-to-quarter growth throughout 2015. The pace of increase in the real value added by the tertiary sector, however, moderated somewhat in the final quarter of 2015, decelerating from 1,9% in the third quarter of 2015 to 1,5% in the fourth quarter.
Activity in the finance, insurance, real-estate and business services; and the general government sectors advanced at a slower pace in the final quarter of 2015, while activity in the trade sector increased somewhat over the period. Real value added by the transport sector declined over the period.
Growth in the real value added by the commerce sector increased at a faster pace in the fourth quarter of 2015, accelerating from an annualised rate of 2,5% in the third quarter of 2015 to 2,8% in the fourth quarter.
Retail trade activity remained firm notwith-standing the somewhat higher interest rate environment, the depreciation in the exchange value of the rand, and elevated debt levels of consumers. Retailers of non-durable and semi-durable products probably benefited from aggressive price promotions in an effort to boost trade volumes.
General dealers; retailers of textile, clothing, footwear and leather goods; specialised food, beverage and tobacco stores; and retailers of pharmaceutical goods, cosmetics and toiletries, in particular, registered increased sales over the period.
Consistent with the moderation in the domestic production of durable products, retail sales of household furniture, appliances and equipment decreased at a somewhat faster pace over the period. Activity in the wholesale trade subsector, however, declined in the fourth quarter of 2015.
In the fourth quarter of 2015, domestic sales of new vehicles increased marginally, probably on account of heightened expectations of price increases in the opening months of 2016 following the sustained depreciation in the exchange rate of the rand. By contrast, growth in the sales of used passenger vehicles decelerated in the fourth quarter of 2015. The real value added by the accommodation sector increased over the period.
Owing mainly to a decline in transport activity, the growth in real output of the transport,
storage and communication sector receded from 0,1% in the third quarter of 2015 to an annualised rate of -0,2% in the fourth quarter. However, real value added by the sector
benefited from uninterrupted growth in the communication subsector over the period.
Activity in the finance, insurance, real-estate and business services sector decelerated from
an annualised rate of 2,8% in the third quarter of 2015 to 1,9% in the fourth quarter. This slower pace of increase was, in particular, evident in the real value added by the commercial banking sector coinciding with a marked deceleration in activity in the equity and derivative markets. Overall growth in the real value added by the sector, however, accelerated from 2,2% in 2014 to 2,8% in 2015.
Employment by general government increased at a slower pace in the fourth quarter of 2015, bringing about a deceleration in growth in real value added by general government from 1,2% in the third quarter of 2015 to 1,0% in the final quarter.
Real gross domestic expenditure Notwithstanding the marginally slower growth in gross domestic production in the final quarterof 2015, growth in real gross domestic expenditure accelerated from an annualised rate of 1,4% in the third quarter of 2015 to 4,3% in the fourth quarter.
Expenditure on all three components of final demand increased at a faster pace over the period alongside a moderation in the pace of destocking in real inventory holdings. For the year 2015 as a whole, real gross domestic expenditure nevertheless advanced by only 0,3 % – the slowest annual rate of increase since 2009.
The change in real inventories made the largest contribution to the expansion in real GDP in the fourth quarter of 2015, adding 2,6 percentage points to overall economic growth. For the year2015 as a whole, however, real net exports and private consumption expenditure by households were the main drivers of growth, contributing 0,9 and 1,0 percentage points respectively to overall growth.
Private consumption expenditure by households Real final consumption expenditure by households increased at an annualised rate of 1,6% in the fourth quarter of 2015 – that is, at a somewhat faster pace than in the second and third quarters of the year.
Spending on durable and non-durable goods switched from negative to positive growth, while real outlays on services increased at a slower pace over the period.
Economy
South Africa Yearbook 2015/16 111
Economy
South Africa Yearbook 2015/16 112
Mainly underpinned by substantially higher real spending on services, growth in real consumption expenditure by households accelerated from 1,4% in 2014 to 1,6% in 2015. Relative to GDP, final consumption expenditure by households amounted to 60,9% in 2015.
Subsequent to a decline of 4,9% in the third quarter of 2015, real outlays on durable goods increased at an annualised rate of 3,5% in the fourth quarter. Spending on especially passenger vehicles – accounting for roughly 50% of real outlays on durable goods – increased in the final quarter of 2015, having declined in the third quarter of 2015.
Expenditure on this category was probably boosted by pre-emptive buying in anticipation of possible price increases in the first quarter of 2016, a practice which consumers have become accustomed to in recent years.
Spending on furniture and household appliances decreased somewhat while the pace of increase in real outlays on computers and related equipment slowed in the final quarter of 2015. On a calendar-year basis, the pace of increase in real spending on durable goods moderated notably from 5,3% in 2014 to 1,6% in 2015.
The moderate rise in household indebt-edness, amid a somewhat higher interest rate environment and an acceleration in durable goods price inflation following the sharp depreciation in the exchange value of the rand, is expected to hamper spending on this category in future.
EmploymentIn an environment characterised by slowing domestic economic growth and heightened global uncertainty, total formal non-agricultural employment advanced only marginally in the third quarter of 2015.
According to the Statistics South Africa (Stats
SA) Quarterly Employment Statistics (QES) survey, employment increased by 0,2% on a seasonally adjusted and annualised basis in the third quarter of 2015, with the total level of formal non-agricultural employment increasing by 5 100 job opportunities to an estimated 8,95 million. Employment levels in the public and private sectors rose by 0,4% and 0,2% respec-tively over the period.
Employment growth in the public sector slowed somewhat from the second to the third quarter of 2015. National departments, and to a lesser extent other public-sector enterprises, continued to increase their staff complement in the third quarter of 2015.
Similarly to the second quarter, the increase in employment by national departments resulted largely from the transfer of employees of technical vocational education and training colleges (former further education and training colleges) and community and education training colleges from provincial governments to the Department of Higher Education and Training (DHET).
These employment gains were partly countered by job-shedding at provincial level, at local government level, and in the public transport, storage and communication sector in the third quarter of 2015. Nevertheless, employment growth at provincial level has outpaced employment gains at national department and local authority level since 2005, as shown in the accompanying graph.
Employment growth in the public sector slowed somewhat from the second to the third quarterof 2015. National departments, and to a lesser extent other public-sector enterprises, continued to increase their staff complement in the third quarter of 2015.
Similarly to the second quarter, the increase in employment by national departments resulted largely from the transfer of employees of technical vocational education and training colleges (former further education and training colleges) and community and education training colleges from provincial governments to the DHET.
These employment gains were partly countered by job-shedding at provincial level, at local government level, and in the public transport, storage and communication sector in the third quarter of 2015. Nevertheless, employment growth at provincial level has outpaced employment gains at national department and local authority level since 2005, as shown in the accompanying graph.
iSouth Africa hosted a successful two-day Johannesburg Summit of the FOCAC at the Sandton Convention Centre, near Johannesburg, South Africa, from 4 to 5 December 2015 under the theme: “Africa-China Progressing Together: Win-Win Cooperation for Common Development.”
A total of 48 Heads of State and 38 Ministers from Africa and China attended the summit, and they shared the view that China and Africa had the responsibility and capability to play a bigger role in international affairs based on win-win cooperation.
China has worked with South Africa to make the FOCAC meeting a grand gathering for strengthening China-Africa solidarity and charting out the future of their cooperation.
This momentous event was characterised by various successful engagements, a cultural evening and exhibi-tions.
Economy
South Africa Yearbook 2015/16 111
Economy
South Africa Yearbook 2015/16 112
Private-sector employment growth remained sluggish. Following a decrease in the second
quarter of 2015, a mere 2 900 private-sector job opportunities were created in the third quarter.
Employment gains were registered in the private transport, storage and communication sector; the finance, insurance, real-estate and business services sector; the trade, catering and accommodation services sector; and the private community, social and personal services sector. Conversely, further job losses were recorded in the goods-producing sectors of the economy, with labour paring continuing in the mining, manufacturing and construction sectors in the third quarter of 2015.
Formal private-sector employment growth has been fairly pedestrian following the 2008-09 economic recession, particularly in the goods-producing sectors of the economy. In fact, the accompanying graph shows that the mining, manufacturing and construction sectors have collectively shed 128 000 jobs between the second quarter of 2012 and the third quarter of 2015 as a hostile labour relations environment, electricity-supply constraints, policy uncertainty, low business confidence, and more recently weak global and domestic demand adversely affected investment and employment in these sectors of the economy.
In addition, as output growth in the economy moderated gradually in recent years, employment growth in the tertiary sector slowed concomitantly, having initially grown fairly briskly following the 2008-09 recession.
Furthermore, given the most severe drought in decades and the continued unwinding of the commodity supercycle, the private sector is not expected to create meaningful employment opportunitiesin the short run. The recent sharp depreciation in the exchange rate of the rand will probably intensify upward cost pressures in the economy, particularly in the goods-producing sectors.
Employment in the domestic mining sector has decreased almost unabatedly from a recent peak in the second quarter of 2012 up to the third quarter of 2015. Throughout this period the domestic mining industry had to operate within an environment characterised by disruptive labour relations, often resulting in protracted labour strikes, as well as an escalation in operating costs.
In addition, international commodity prices have declined notably since 2011, as depicted in the accompanying graph. The drop in commodity
prices continued in 2015, owing to reduced demand from China and a global oversupply of many commodities.
The pace of job-shedding in the mining sector accelerated in the third quarter of 2015, partic-ularly in the non-gold mining sector which was affected by retrenchments in the platinum-mining sector as well as the closure and downscaling of some coal and chrome mines.
Employment levels in the gold-mining sector decreased only marginally in the third quarter of 2015, having remained unchanged in the previous quarter. The recent sharp depreciation in the exchange rate of the rand has to some extent compensated for the decline in interna-tional commodity prices, at least in the short term, providing a much-needed boost to the profitability of South African mining companies.
Employment levels in the manufacturing sector decreased at a roughly similar pace in both the second and third quarters of 2015, representing a cumulative loss of almost 12 000 job opportunities. Furthermore, the Manufac-turing Survey of Stellenbosch University’s Bureau for Economic Research (BER) indicated that business confidence among manufacturers remained unchanged at 34 index points in the fourth quarter of 2015; the index has remained below the neutral level of 50 since the third quarter of 2011.
The pessimistic sentiment was pervasive throughout the manufacturing sector, exacerbated by a renewed deceleration in production volume growth for durable goods in particular. Although the recent sharp depreciation in the exchange rate of the rand could improve the profitability of manufacturing exporters, domestic demand for manufactured goods remained fairly weak, aggravated by the severe drought conditions and the commodity price-driven restructuring in the mining sector. Employment prospects in the manufacturing sector thus remain bleak, as suggested by the sharp drop in the employment sub-index of the Barclays Manufacturing Purchasing Managers’ Index (PMI), from an average of 47,2 index points in the third quarter of 2015 to an average of 43,7 index points in the fourth quarter.
Construction-sector employment contracted at an accelerated pace in the third quarter of 2015, weighed down by disappointing government infrastructure spending on large projects and sluggish private-sector capital investment by the mining sector in particular.
In fact, the construction sector has shed a cumulative 27 400 job opportunities in the five
Economy
South Africa Yearbook 2015/16 113
Economy
South Africa Yearbook 2015/16 114
quarters up to the third quarter of 2015. Despite improving somewhat in the fourth quarter of 2015, confidence levels in the building and construction sector remained low; the First National Bank (FNB)/BER Building Confidence Index rose by 4 index points to 48 in the fourth quarter of 2015, while the FNB/BER Civil Confidence Index increased by 3 index points to 42 over the same period.
In addition, the real value of building plans passed decreased notably from the third to the fourth quarter of 2015. Contrary to developments in the primary and secondary sectors of the economy, employment levels increased in the tertiary sector of the economy in the third quarter of 2015. The finance, insurance, real-estate and business services sector created 11 700 employment opportunities in the third quarter, more than offsetting the losses recorded in the previous quarter.
In addition, the trade, catering and accommo-dation services sector continued to record fairly meaningful employment gains for a third successive quarter, supported by continued growth in household consumption expenditure. However, results from the BER’s Retail Survey for the fourth quarter of 2015 suggest that underlying consumer demand could be deterio-rating.
Business confidence among retailers, wholesalers and new vehicle dealers remained depressed in the fourth quarter of 2015, owing to low sales volume growth, rising input costs, and generally tough trading conditions. In addition, the FNB/BER Consumer Confidence Index plummeted to -14 in the fourth quarter of 2015 from -5 in the third quarter, suggesting that consumer spending on especially durable goods could come under increased pressure in the first half of 2016.
According to the Quarterly Labour Force Survey (QLFS) conducted by Stats SA, the number of persons employed in South Africa increased by 190 000 from the third quarter of 2015 to the fourth quarter, raising the total level of employment to roughly 16,02 million.5 Employment numbers are usually boosted in the fourth quarter of each year by seasonal workers employed in the trade, catering and accommodation services sector in particular. Although QLFS outcomes for 2015 are not strictly comparable to those of 2014, total employment nevertheless increased by 698 000 in the year to the fourth quarter of 2015. Notable employment gains were recorded in all the main QLFS sub-categories, largely due to enhanced
coverage following the introduction of the new master sample. Bearing this in mind, the formal non-agricultural sector and the informal sector added 269 000 and 236 000 employment opportunities respectively in the year to the fourth quarter of 2015.
The number of unemployed persons decreased by 225 000 from the third to the fourth quarter of 2015, aided by temporary seasonal job creation, but increased by a notable 284 000 in the year to the fourth quarter of 2015, bringing the total number of unemployed South Africans to around 5,19 million. However, Stats SA cautioned that following the introduction of the new master sample, quarterly unemployment trends have become rather unstable and should
be interpreted with circumspection. Encour-agingly, the number of discouraged job seekers-decreased by 124 000 in the year to the fourth quarter of 2015. As unemployment grew at a slightly faster pace than employment in the year to the fourth quarter of 2015, the official unemployment rate increased marginally to 24,5% from 24,3% a year earlier.
The seasonally adjusted unemployment rate decreased from 25,3% in the third quarter of 2015 to 25,1% in the fourth quarter. The youth unemployment rate rose to 50,4% in the fourth quarter of 2015, up from 48,8% a year earlier.
Price inflationThe sharp decline in international commodity prices in 2015 led to a subdued global inflationary environment and contributed meaningfully to a more benign domestic inflation outcome than initially anticipated.
In addition, domestic demand and output growth slowed throughout the year, reducing inflationary pressures further. Consequently, headline consumer price inflation moderated from an annual average of 6,1% in 2014 to 4,6% in 2015 – the first moderation in annual average headline consumer price inflation in four years.
Despite the decline in crude oil and other international commodity prices, consumer price inflation accelerated gradually from a recent low of 3,9% in February 2015 to 4,8% in November, affected by the gradual depreciation in the exchange rate of the rand throughout the first eleven months of the year.
However, inflationary pressures intensified towards the end of 2015 and in the opening months of 2016 as food price inflation quickened in response to the severe drought conditions and as the exchange rate of the rand depreciated sharply. As such, consumer price inflation
Economy
South Africa Yearbook 2015/16 113
Economy
South Africa Yearbook 2015/16 114
quickened to 6,2% in January 2016.Driven largely by falling international
commodity prices, most measures of domestic producer price inflation moderated markedly in 2015. Producer price inflation for mining products decelerated substantially from an annual average of 4,2% in 2014 to an annual average of -4,1% in 2015. Likewise, producer price inflation for final manufactured goods more than
halved from an annual average of 7,5% in 2014 to 3,6% in 2015, while producer price inflation for intermediate manufactured goods moderated from an annual average of 8,2% in 2014 to a mere 0,8% in 2015, as price inflation slowed across a broad range of product categories. When measured as an annual average, producer price inflation for agriculture, forestry and fishing products moderated from 5,3% in 2014 to 4,7% in 2015.
However, producer price inflation for electricity and water – both administered prices – remained elevated throughout 2015, accelerating somewhat from an annual average of 9,9% in 2014 to 11,1% in 2015.
Notwithstanding the slowing annual average rates of inflation, most measures of producer price inflation accelerated in recent months; producer price inflation for final manufactured goods and intermediate manufactured goods amounted to 7,6% and 3,8% respectively in January 2016.
Driven largely by steep drought-induced agricultural price increases, producer price inflation for agriculture, forestry and fishing products accelerated markedly in the closing months of 2015, amounting to 23,6% in January 2016.
Throughout 2015, headline consumer price inflation outcomes were primarily shaped by movements in consumer goods price inflation, in particular that of non-durable goods.
Consumer goods price inflation accelerated from a recent low of 3,6% in September 2015 to 6,5% in January 2016, as non-durable goods price inflation – representing 71% of the total consumer goods price basket – quickened from 3,8% to 7,7% over the same period, in turn driven largely by movements in petrol price inflation and to a lesser extent by food price inflation.
The acceleration in petrol price inflation occurred despite falling international crude oil prices and was driven by the depreciation in the exchange rate of the rand as well as the dissipation of favourable base effects in recent months.
Suppressed by relatively weak domestic demand conditions, durable and semi-durable goods price inflation has remained fairly subdued in recent months; semi-durable goods price inflation slowed from 4,3% in June 2015 to 3,4% in December, largely due to a slow pace of increase in the prices of clothing and footwear, while durable goods price inflation accelerated marginally from 2,2% to 3,0% over the same period, despite the depreciation in the exchange rate of the rand.
Consumer services price inflation remained steady around the upper limit of the inflation target range of 6,0% for a prolonged period up to the middle of 2015. Thereafter, it slowed somewhat to 5,7% in December 2015, as moderations in transport, restaurant and hotel services price inflation outweighed a quickening in housing and utility services price inflation.
International food prices declined for a fourth consecutive year in 2015, with the international food price index of the United Nations Food and Agriculture Organization (FAO) averaging 19,1% below its level in 2014 on account of abundant global food supplies and an appreciating US dollar. However, when expressed in rand terms, the year-on-year change in the FAO international food price index accelerated notably from July 2015 onwards, amounting to 19,1% in January 2016 following the marked depreciation in the exchange rate of the rand in recent months.
Abundant supplies and high inventory levels following, among others, the removal of export taxes in Argentina and continued good crop prospects, resulted in international cereals prices falling further in 2015 with the FAO international cereals price index being 15,4% lower than in 2014.
However, despite lower international cereal prices, the dramatically reduced 2015 domestic maize crop following the most severe drought in decades resulted in domestic maize and wheat prices soaring to all-time high levels and occasionally trading above import parity levels.
Domestic agricultural producer food price inflation accelerated notably from -3,0% in January 2015 to 25,9% a year later. The quickening in agricultural producer food price inflation resulted almost entirely from a marked acceleration in price inflation for cereals and other crops, from -17,5% in January 2015 to 79,2% in January 2016, as the severe drought conditions ravaged crops in South Africa’s primary maize- and wheat-producing areas.
The rise in domestic maize prices was exacerbated by expectations that South Africa
Economy
South Africa Yearbook 2015/16 115
Economy
South Africa Yearbook 2015/16 116
might have to import roughly four million tons of maize in the wake of the drought. Conversely, producer price inflation for live animals moderated notably from 11,5% in May 2015 to 1,0% in January 2016 due to the increased selling and slaughtering of herds in drought-stricken areas.
Producer food price inflation at the manufactured level has not fully responded to the pickup in agricultural food price inflation, decelerating to 5,0% in July and August 2015 beforequickening to 7,8% in January 2016. However, in recent months some pass-through from the notable acceleration in inflation for agricultural crops and cereals became visible in price inflation for grain mill, starch and animal feed products, as well as for bakery products.
Nevertheless, similarly to the price movements for live animals, price inflation for manufactured-producer meat products slowed markedly to a mere 0,8% in January 2016.
Consumer food price inflation responded to the acceleration in agricultural and manufactured producer food price inflation with a time lag, initially moderating to 4,3% in June 2015 before accelerating to 7,0% in January 2016.
Nonetheless, the impact of the prolonged drought was evident in the quickening of price inflation for bread and cereals from 2,4% in April 2015 to 8,4% in January 2016 and a concomitant slowdown in meat price inflation from 6,4% to 4,3% over the same period, offsetting each other to some extent.
The acceleration in consumer food price inflation has become more broad-based in recent months, as price inflation for especially vegetables quickened notably in January 2016 due the increased need for irrigation following the extreme temperatures experienced during the month.
Within an environment of fairly limited pricing power in the domestic economy on account of weak consumer demand, most measures of underlying inflation have moderated throughout 2015 before accelerating in December 2015 and January 2016.
Subtracting the impact of the more volatile food, non-alcoholic beverages and petrol prices from the calculation of targeted headline consumer price inflation, underlying inflation slowed from 5,9% in February 2015 to 5,5% in November before accelerating to 5,9% in January 2016.
Similarly, when further excluding the impact of electricity prices from the calculation, the resultant underlying measure of inflation moderated from
5,8% to 5,1% before quickening to 5,6% over the same period. However, the sharp depreciation in the exchange rate of the rand in December 2015 and January 2016 is expected to add to underlying inflationary pressures in coming months, irrespective of weak domestic demand.
An analysis of price changes based on the classification of individual consumption by purpose (COICOP) categories suggests a slight slackening in inflationary pressures from 2014 to 2015.
As such, annual consumer price inflation in 2015 exceeded the upper limit of the inflation targetrange in four of the twelve COICOP categories (as opposed to six categories in 2014), while four categories recorded price increases within the inflation target range (the same as in 2014) and four categories registered rates of change below the lower limit of the inflation target range (compared to two categories in 2014).
The accompanying graph shows that the housing and utilities category remained the main contributor to annual consumer price inflation in 2015 (increasing its contribution notably), followed by the miscellaneous goods and services category, which moved up from fourth position in 2014.
Consistent with extremely benign petrol price inflation following the decline in international crude oil prices, coupled with relatively subdued motor vehicle price inflation throughout 2015, the transport category subtracted from annual consumer price inflation in 2015 after contributing meaningfully to consumer price inflation in 2014.
Driven largely by movements in petrol price inflation, administered price inflation accelerated from a recent low of -4,5% in February 2015 to 8,8% in January 2016. Even though domestic petrol prices fell somewhat in the three months to January 2016 – the inland price of unleaded 95-octane petrol decreased by a cumulative 24 cents per litre over the three-month period – the year-on-year rate of change in consumer petrol price inflation accelerated markedly from -8,0% in October 2015 to 10,0% in January 2016, largely due to unfavourable base effects.
Furthermore, when excluding the effect of petrol prices from the calculation of administered prices, the rate of increase accelerated from 6,3% in February 2015 to 8,5% in December 2015 and January 2016, driven largely by acceler-ations in price inflation for electricity, water and assessment rates. When excluding electricity prices from the calculation of administered prices as well, the rate of increase quickened from
Economy
South Africa Yearbook 2015/16 115
Economy
South Africa Yearbook 2015/16 116
6,2% in June 2015 to 7,4% in December, before moderating to 7,1% in January 2016. In early March 2016, the National Energy Regulator of South Africa (NERSA) awarded Eskom a 9,4% increase for 2016/17.
Average inflation expectations, as measured in the Inflation Expectations Survey conducted by the BER in the fourth quarter 2015, shifted higher over the whole forecast period. The average headline inflation expectations of financial analysts, business representatives and trade unions increased marginally by 0,1 percentage points to 5,6% and 6,2% for 2015 and 2016 respectively, but increased by a more substantial 0,3 percentage points to 6,2% for 2017.
Analysts and business representatives revised their 2017 forecasts slightly upwards to 5,6% (up by 0,2 percentage points) and 6,6% (up by 0,1 percentage points) respectively. In contrast, trade union officials raised their forecast by a noticeable 0,4 percentage points to 6,3%.
Analysts expect inflation to quicken notably to 5,9% in 2016 before moderating to 5,6% in 2017. Business representatives and trade unions, in turn, expect inflation to accelerate in 2016 and 2017, from 6,4% in 2016 to 6,6% in 2017 in the case of business representatives, and from 6,2% to 6,3% over the same period in the case of trade union officials.
After edging lower to 5,9% in the third quarter of 2015, average five-year inflation expectations rebounded to 6,1% in the fourth quarter. While business representatives kept their five-year inflation expectations unchanged at 6,5%, those of analysts and trade-union officials rose by 0,1 percentage points to 5,5% and by 0,3 percentage points to 6,2%, respectively.
Average household inflation expectations for the next 12 months increased somewhat from 6,7% in the third-quarter 2015 survey to 6,9% in the fourth-quarter survey.
Exchange ratesThe South African rand depreciated sharply against most major currencies in the fourth quarter of 2015 as both global and domestic developments negatively affected the currency.
Whereas the weighted average exchange rate of the rand increased, on balance, marginally by 0,2% in October 2015, it declined by 2,1% and 8,3% in November and December respectively.
On balance, the nominal effective exchange rate of the rand declined by 10,0% in the fourth quarter of 2015 compared with a decline of 9,0% in the third quarter.
The weighted exchange rate of the rand declined by no less than 19,7% from 31 December 2014 to 31 December 2015, the sharpest fall since the 23,5% decline in 2008.
Like the currencies of many other emerging-market economies, the performance of the randwas affected by the normalisation of US monetary policy, declining international commodity prices as well as concerns about global economic growth.
Domestic factors – such as sluggish economic growth, a widening of the current-account deficit, concerns regarding the sustainability of the fiscal projections as well as multi-year low business and consumer confidence levels – negatively affected the performance of the domestic currency in especially the second half of 2015. The rand was one of the world’s worst-performing currencies in 2015.
In January 2016, the South African rand continued its downward trend, weighed down by a strong US dollar and lingering concerns about the outlook for the Chinese economy. The US dollar was supported by solid US labour market data, which may justify further tightening of policy rates by the Fed.
By contrast, the growth projections for South Africa were revised further downwards by the IMF in its January 2016 World Economic Outlook (WEO), adding to the pressure on the rand. The rand stabilised somewhat in February 2016, depreciating by only 0,3% against the dollar from the end of January.
While the rand reached all-time lows against most major currencies on a nominal basis in December 2015, the real effective exchange rate of the rand also edged lower, but without matching the all-time low recorded in 2001.
Although the current exchange value of the rand is supportive of domestic-export growth, the probability of higher domestic input costs and slower economic growth in South Africa’s main export trading-partner countries may erode potential gains from the depreciation in the domestic currency.
Economic Development Department (EDD)The EDD has assumed responsibilities relating to the creation of decent employment through inclusive economic growth, including the
iIn 2015 for the first time, other African countries became South Africa’s single biggest regional market, overtaking Asia. The country exported R303-billion worth of goods to other African countries, supporting about a quarter million South African jobs.
Economy
South Africa Yearbook 2015/16 117
Economy
South Africa Yearbook 2015/16 118
implementation of certain aspects of the NDP, the New Growth Path (NGP) and the national infrastructure plan as captured in outcomes 4, 6 and 7 of government’s 2014-2019 Medium Term Strategic Framework (MTSF).
The department is also responsible for five public entities, comprising three regulatory bodies and two development finance institutions. These are: the Competition Commission, the Competition Tribunal, the International Trade Administration Commission of South Africa (ITAC), the Industrial Development Corporation (IDC) of South Africa and the Small Enterprise Finance Agency (Sefa).
In line with these responsibilities, the depart-ment’s mandate includes the administration of the following legislation:• Industrial Development Act, 1940 (Act 22 of
1940)• Competition Act, 1998 (Act 89 of 1998)• International Trade Administration Act, 2002 (Act
71 of 2002)• Infrastructure Development Act, 2014 (Act 23 of
2014).
Budget and fundingThe EDD aims to drive government’s priorities of job creation, inclusive economic growth andindustrialisation, and to support the alignment of the State in implementing policies. The department focuses its work in relation to outcome 4 (decent employment through inclusive growth) of government’s 2014-2019 MTSF.
The department’s 2009 NGP for creating the jobs that South Africa needs aims for the collective achievement of a more developed and equitable economy and society over the medium term, in the context of sustained growth.
It sets out critical markers for employment creation and growth, and identifies where viable changes in the structure and character of production can generate a more inclusive and greener economy over the medium to longer term.
To that end, it combines macroeconomic and microeconomic interventions. Over the medium term, the department will make interventions aimed at integrating its NGP, including: interventions in infrastructure initiatives, support to provinces on economic planning, and strategic support to development finance institutions and regulatory bodies.
Cabinet has approved reductions of R8,3 million for 2017/18 and R13,5 million for 2018/19 to the department’s compensation of employees budget. The reductions are part
of Cabinet’s decision to lower the national aggregate expenditure ceiling. The department’s operational expenditure is largely on compen-sation of employees for the skilled personnel required to drive its policy and coordination interventions.
A reduction in personnel will be mitigated through partnerships with higher education institutions to provide technical expertise as it is required. After consultation with the Department of Public Service and Administration and National Treasury, the department will develop and implement a plan to manage its personnel expenditure within its reduced personnel budget.
The department’s goods and services budget has been reduced, by R1,2 million for 2016/17, R1,2 million for 2017/18 and R1,4 million for 2018/19, particularly in travel and subsistence. The department plans to mitigate the impact of the reductions by shifting expenditure from nonperforming areas.
Interventions in infrastructure initiativesThe EDD continues its work as secretariat to the Presidential Infrastructure Coordi-nating Commission (PICC), which focuses on 18 national strategic integrated projects. The secretariat’s work is budgeted for in the Investment, Competition and Trade programme. R51,5 million over the medium term is allocated to compensation of employees in this programme.
The department will provide 60 annual progress reports to Cabinet on the strategic integrated projects, and unblock, fast-track and facilitate other infrastructure projects. The focus includes unblocking water use licence applications and environmental impact assessments so that projects can commence.
As the chair of the Saldanha-Northern Cape development corridor (strategic integrated project 5), the department will drive the corridor’s implementation over the medium term. The Saldanha-Northern Cape development corridor promotes integrated rail and port expansion and back-of-port industrial capacity, strengthens maritime support capacity for oil and gas along the African West Coast, and expands iron ore mining production and beneficiation.
Support to provinces on economic planningThe department was expected to continue supporting provinces on economic planning through a number of spatial, local and provincial economic initiatives. By end of 2015, support was being provided to the Free State, Eastern Cape, Northern Cape, North West, Limpopo and
Economy
South Africa Yearbook 2015/16 117
Economy
South Africa Yearbook 2015/16 118
KwaZulu-Natal. Over the medium term, the department was
expected to use 30 economic development initiatives to promote employment, empowerment and development in all the provinces. Support to provinces on economic planning is budgeted for in the Growth Path and Social Dialogue programme, and the increase in activities over the medium term drives expenditure to grow at an average annual rate of 12,4%, from R27,9 million in 2015/16 to R39,6 million by 2018/19.
Strategic support to development finance institutions and regulatory bodiesThe EDD continues to oversee and provide strategic direction to the development finance institutions and regulatory bodies reporting to it. This work accounts for 81% of total depart-mental spending over the medium term, or R1,7 billion, in the Investment, Competition and Trade programme.
The department will evaluate development finance institutions’ performance on the impact of jobs. The department expects to have fourstrategic engagements per year with development finance institutions over the medium term, to improve administrative efficiencies and decrease turnaround times for project approvals.
The department will also undertake 14 engagements with the trade and competition regulatory bodies to improve administrative efficiencies and ensure that the competition authorities address the abuse of market power and support government’s employment, industri-alisation and development objectives.
To further support the work of the competition authorities, the allocation over the medium term to the Competition Tribunal has been increased to strengthen its capacity.
Regulatory and development finance institutions Competition CommissionThe Competition Commission is a statutory body constituted in terms of the Competition Act of 1998. It is empowered to investigate, control and evaluate restrictive business practices, including the abuse of dominant positions and mergers; and to promote the advocacy of competition issues to achieve equity and efficiency in the South African economy. The commission’s total budget for 2016/17 is R268,7 million.
Competition TribunalThe Competition Tribunal was established in
terms of the Competition Act of 1998. All large corporate mergers and allegations of restrictive practices are brought before the tribunal by the Competition Commission and interested parties for adjudication. The tribunal’s total budget for 2016/17 is R41,4 million.
International Trade Administration Commission of South AfricaThe ITAC is mandated to manage an efficient and effective trade administration system. It was established in terms of the International Trade Administration Act of 2002. The commission’s total budget for 2016/17 is R88,7 million.
The ITAC is mandated to foster economic growth and development to raise incomes and promote investment and employment, in South Africa and within the Common Customs Union Area.
This is done by establishing an efficient and effective system for the administration of inter- national trade, subject to this Act and the Southern African Customs Union Agreement.
The core functions are customs tariff investi-gations, trade remedies, and import and export control.
Industrial Development Corporation of South AfricaThe IDC is a national development finance institution established in terms of the Industrial Development Act of 1940 with the objective of leading industrial capacity development.
This entails aligning its priorities with those identified in terms of government policies and programmes related to industrial development, including relevant elements of the NDP, the NGP and the Industrial Policy Action Plan (IPAP).
In August 2015, it was announced that the IDC would channel R23 million towards black indstri-alists.
Small Enterprise Development Agency (SEDA)The SEDA was established in 2012 and combines the operations of Khula Enterprise Finance, the South African Micro-Finance Apex Fund and the IDC’s small business operations.
The SEDA provides non-financial business-development and support services for small enterprises.
This is in partnership with other role players ensuring their growth, sustainability and enhancing their competitiveness and capabilities through coordinated services, programmes and projects.
Economy
South Africa Yearbook 2015/16 119
Economy
South Africa Yearbook 2015/16 120
The agency’s total budget for 2016/17 is R581,5 million.
New Growth PathThe NGP is government’s vision to place jobs and decent work at the centre of economic policy. It sets a target of five million new jobs to be created by 2020.
It sets out the key jobs drivers and the priority sectors that we will focus on over the next few years. It is based on strong and sustained, inclusive economic growth and the rebuilding of the productive sectors of the economy.
Infrastructure development in particular is a foundation for more jobs and addressing rural under-development.
Green economySouth Africa is committed to pursuing and exploring opportunities in its transition to an inclusive, low-carbon, resource-efficient green economy.
Government aims to use all opportunities in the green economy to create jobs and cut carbon emissions. High-tech innovations will help employment grow over the long term, as new technology spreads throughout the economy and transforms other, larger sectors. South Africa’s chemical industry is of substantial economic significance, contributing around 5% to the GDP and approximately 25% of manufac-turing sales.
The Green Fund is budgeted for in the Environ-mental Programmes programme, receiving 3,8% or R290,5 million of the programme’s budget over the medium term. Established in 2011, the Green F a national fund providing catalytic finance for investment in green initiatives that will support South Africa’s transition towards a green economy.
The fund is additional and complementary to existing fiscal allocations, focusing on innovative projects that need to cover a funding or financing gap. The fund is managed by the Development Bank of Southern Africa on behalf of the Department of Environmental Affairs.
By end of 2015, the Green Fund had a portfolio of 20 active and two completed investment projects, representing an investment commitment totalling R679,8 million.
By end of 2015, the financial contribution from private sector participants amounted to R91 million and was expected to exceed R500 million over the medium term.
Department of Trade and Industry (the dti)The work of the dti supports outcome 4 (decent employment through inclusive growth), Outcome 7 (comprehensive rural development and land reform) and outcome 11 (create a better South Africa, a better Africa and a better world) of government’s 2014-2019 MTSF.
The department is also committed to implementing the Nine-Point Plan to ignite growth and create jobs. The department plays a critical role in facilitating three of the nine priority interventions: Beneficiation through adding value to mineral resources; A more effective implemen-tation of a higher impact IPAP; and encouraging private sector investment.
These national priorities inform the depart-ment’s spending priorities over the medium term, which are: increased investment facilitation, manufacturing incentives, supporting exports, and industrial spatial development.
The department will also focus on developing a programme to promote the long term sustainable development of black industrialists. The programme will accelerate the participation of black industrialists in the national economy, both in terms of their numbers and their influence.
The department will create multiple, diverse instruments for black industrialists to enter targeted industrial sectors and value chains that are aligned with government developmental priorities and specifically the IPAP.
By mid-2016, more than 22 black industrialists had been supported to the value of more than R1.5 billion, mainly in agro-processing; plastic and pharmaceuticals; electro technical equipment; and metals sectors. More than 2 000 jobs were created across the sectors.
A related medium-term priority for the department is the establishment of a Broad-Based Black Economic Empowerment (B-BBEE)Commission to enforce the BEE regulatory framework. The commission will strengthen and foster collaboration between the public and private sector in safeguarding the objectives of the B-BBEE Amendment Act of 2013.
By mid-2016, the IDC had provided R28 billion to black-owned businesses, and more than R53 billion for B-BBEE.
Legislation, policies and strategiesThe dti develops and reviews regulatory systems in the areas of competition, consumer protection, company and intellectual property, as well as public interest regulation.
Economy
South Africa Yearbook 2015/16 119
Economy
South Africa Yearbook 2015/16 120
It also oversees the work of national and provincial regulatory agencies mandated to assist the department in providing competitive and socially responsible business and consumer regulations, for easy access to redress and efficient markets.
The department’s work is governed by a broad legislative framework. These include the: • BBBEE Act, 2003 (Act 53 of 2003) • Consumer Protection Act, 2008 (Act 68 of 2008)• Cooperatives Amendment Act, 2013 (Act 6 of
2013), which amended the Co-operatives Act, 2005 (Act 14 of 2005)
• Copyright Act, 1978 (Act 98 of 1978)• Intellectual Property Laws Rationalisation Act,
1996 (Act 107 of 1996) • Liquor Act, 2003 ( Act 59 of 2003) • Patents Act, 1978 (Act 57 of 1978)• Small Business Development Act, 1981
(Act 112 of 1981)• Trade Marks Act, 1993 (Act 194 of 1993).• Preferential Procurement Policy Framework
Act, 2000 (Act 5 of 2000) as amended• The BBBEE Amendment Act, 2013 (Act 46
of 2013), aims to strengthen the implemen-tation of BBBEE and its reporting across the economy, as well as to put in place mechanisms to deal with non-compliance.
The Act has several objectives, including aligning it with other legislation that deals with BBBEE and the Codes of Good Practice.
It also seeks to establish the BBBEE Commission to create an institutional environment for monitoring and evaluating BBBEE.Some of the key material amendments in the Act refer to: • aligning the Act and the codes, which comprises
an interpretation clause extended to include a trumping provision that stipulates that the BBBEE Amendment Act will trump any law that was in force prior to the commencement date of the Act.
• establishing the BBBEE Commission as an entity within the administration of the dti, headed by a commissioner appointed by the Minister; the commission will be responsible for overseeing, supervising and promoting adherence to the act, as well as the monitoring and evaluation of BBBEE
• setting clear penalties, which include a minimum penalty of 10 years imprisonment (and/or a fine) or if the offender is not a natural person, a fine of 10% of its annual turnover.
Role playersPresidential Infrastructure Coordinating Commission The PICC has the following 18 strategic integrated projects (SIPs): • Durban- Free State Gauteng Logistics and
Industrial Corridor• South Eastern node and corridor development• Unlocking the economic opportunities in North
West• Saldanha-Northern Cape Development
Corridor• Integrated Municipal Infrastructure Project• Integrated Urban Space and Public Transport
Programme• Green Energy in support of the South African
economy• Electricity Generation to support socio-
economic development• Electricity Transmission and Distribution for all• Agri-Logistics and Rural Infrastructure• Revitalisation of public hospitals and other
health facilities• National school build programme• Higher Education Infrastructure• Expanding access to communication
technology• SKA and MeerKat• Regional Integration for African cooperation
and development• Water and Sanitation Infrastructure Master
PlanThe main objective of the PICC awareness campaign is to promote infrastructure development initiatives across the country, whilst showcasing the tangible benefits in terms of job creation and mainstreaming access to social services.
Business Partners LimitedBusiness Partners Limited is a specialist risk-finance company that provides customised financial solutions, sectoral knowledge, mentorship, business premises and other added-value services for formal small and medium enterprises in South Africa and selected African countries. The company is passionate about funding, supporting and mentoring entrepreneurs.
Business Partners Limited considers financing applications up to R50 million in all sectors of the economy — with the exception of on-lending activities, direct farming operations, underground mining and non-profit organisations — to those formal small and medium businesses whose gross assets are under R100 million, where
Economy
South Africa Yearbook 2015/16 121
Economy
South Africa Yearbook 2015/16 122
annual turnover does not exceed R200 million and/or employees are less than 500 in number.
Applications for financing below R500 000 are usually not considered; and the company does not operate in the informal or micro enterprise sectors.
National Empowerment Fund The NEF was established by the NEF Act, 1998 (Act 105 of 1998), to promote and facilitate black economic equality and transformation.
It provides finance and financial solutions to black businesses across a range of sectors.
It also structures accessible retail savings products for previously disadvantaged people based on state-owned equity investments.
Its mandate and mission is to be government’s funding agency in facilitating the implementation of BBBEE, in terms of the BEE codes of good practice.
The fund has five core divisions: small and medium enterprises, rural development, venture capital, corporate finance, and women empowerment funds.
South African Women Entrepreneurs’ Network (SAWEN)SAWEN is a South African national network that facilitates and monitors the socio-economic advancement of women entrepreneurs and their positive impact on the country’s economy.
The obejctives of SAWEN are to: • provide a national vehicle that brings women
and women’s groups together to address the challenges faced by them.
• lobby government, public and private institutions on such issues, but not limited to policy, legislation and/or proposed legislation affecting either directly and indirectly the trade and commerce activities of women entrepreneurs.
• align SAWEN with other bodies or organi-zations with similar business interests at both national and international level, and to leverage the relationships arising out of these alignments for the benefit of its members.
• facilitate access to business resources, information and opportunities for South African women entrepreneurs in a way that promotes their effective participation in the global economy.
• profile and affirm women in business leadership positions in both public and private sectors.
To buttress government’s intent of strategic intervention in women’s economic empowerment, the dti has been using vehicles such as SAWEN, the Isivande Women’s Fund (IWF), Bavumile
and Technology for Women in Business (TWIB).The Ligugu Lami Awards acknowledge women
entrepreneurs and encourages them to take pride in their achievements.
Isivande Women’s Fund IWF is an exclusive fund that aims to accelerate women’s economic empowerment by providing more affordable, usable and responsive finance than is currently available. The IWF assists with support services to enhance the success of businesses. It pursues deals involving start-up funding, business expansion, business rehabili-tation, franchising and bridging finance.
The fund is managed by the IDC on behalf of the dti through a development fund manager.
IDF Managers is an SME financier aimed at supporting the creation of self-sustaining black and women owned businesses in South Africa by providing primarily financial and non-financial support to our investee companies.
The IDF Managers is responsible for reviewing eligible business plans requiring funding of R30 000 to R2 million.
The women enterprises have to meet the following criteria:• At least six months in operation• Requires early stage, expansions and growth
capital;• 50% plus one share owned and managed by
women;• Have potential for growth and commercial
sustainability; and• Improved social impact in the form of job
creation.
Small Business Finance Agency (Sefa)The Sefa was established on 1 April 2012 following the merger of South African Micro Apex Fund, Khula Enterprise Finance Ltd and the small business activities of the IDC.
Sefa’s mandate is to foster the establishment, survival and growth of SMMEs and contribute towards poverty alleviation and job creation.
Sefa has a regional footprint of nine offices around the country and it lends between R500 and R5 million to SMMEs.
The target market is survivalists, SMMEs, including cooperatives falling in the following funding gap:• Survivalists and microenterprises – loans
between R500 and R50 000• Small enterprises – loans between R50 000
and R1 million• Medium enterprises – loans between R1
million and R5 million.
Economy
South Africa Yearbook 2015/16 121
Economy
South Africa Yearbook 2015/16 122
Sefa has since its inception increased its total approvals to R3.6 billion and disbursed into the economy over R3.2 billion to over 200 000 small businesses.
For the 2015/16 financial year alone, Sefa approved R1.1 billion of loan facilities and disbursed R1.08 billion to 45 263 SMMEs and cooperatives through its various loan distribution channels.
Sixty-one youth-owned enterprises have been funded to the tune of R17.9 million through the Cooperatives Incentive Scheme, while R35.9 million has gone to 117 women enterprises. Some R45.2 million has funded 325 women-owned enterprises through the Black Business Support Development Programme.
ResourcesTechnology supportThe dti implements skills development, economic infrastructure, and innovation and technology programmes to support priority sectoral and regional industrial development plans.
Some of the key programmes include the Technology and Human Resource for Industry Programme (THRIP), the Support Programme for Industrial Innovation (SPII) and the Centre for Entrepreneurship and Technology Programme.
Provision is also made for transfer payments and subsidies to:• SEDA’s Technology Programme, which is
managed by SEDA, to finance and support early, seed and start-up technology-based ventures
• THRIP, which is managed by the National Research Foundation, to support research and technology development
• the SPII, which is managed by the IDC, to support a wide group of enterprises that promote technological development through financial assistance
• the Workplace Challenge Programme, which finances and supports world-class manufacturing and value-chain efficiency improvements in South African companies.
Black Economic EmpowermentBEE is not only a political and social necessity for redressing the wrongs of the past, but will also help broaden economic participation, which will contribute to economic growth.
Programmes and projectsBlack Business Supplier Development ProgrammeThe Black Business Supplier Development
Programme is a cost-sharing grant offered to black-owned small enterprises to help them improve their competitiveness and sustainability, to become part of the mainstream economy and create employment.
The programme provides grants to a max- imum of R1 million: R800 000 for tools, machinery and equipment on a 50:50 cost-sharing basis; and R200 000 for business development and training interventions per eligible enterprise to improve their corporate governance, management, marketing, productivity and use of modern technology.
The objectives of the incentive scheme are to:• draw existing Small, medium and micro
enterprises (SMMEs) exhibiting potential for growth into the mainstream economy
• grow black-owned enterprises by fostering linkages between black SMMEs and corporate and public-sector enterprises
• complement current affirmative procurement and outsourcing initiatives of corporate and public-sector enterprises
• enhance the capacity of grant-recipient enterprises to successfully compete for corporate and public-sector tenders and outsourcing opportunities.
Industrial Policy Action Plan The IPAP 2016/17 – 2018/19 is informed by the vision set out for South Africa’s development provided by the NDP. The IPAP is a key pillar of the Nine-Point Plan, which seeks to ignite economic growth and create much-needed jobs.
AutomotivesThe automotive industry remained the largest and leading manufacturing sector in the domestic economy.
The automotives sector has performed exceptionally well. For example, R7.8 billion in government incentives has yielded R28.5 billion worth of investments by Original Equipment Manufacturers. At the same time, exports grew to R151.5 billion in 2015, while 113 360 jobs were being supported in the sector by the beginning of 2016.
The dti has established a team of technical experts to develop a post-2020 Automotives Master Plan.
The mandate of the team is to examine the entire automotive sector and not just the existing Automotive Policy Development Plan, which will include light, medium and heavy vehicles and motorcycles.
The purpose is to ensure that in the context
Economy
South Africa Yearbook 2015/16 123
Economy
South Africa Yearbook 2015/16 124
of long-term policy certainty, a post-2020 Master Plan will create a framework to secure even higher levels of investment and production, higher exports, deepening localisation and expanding employment.
The dti initiated the Medium and Heavy Commercial Vehicles Automotive Investment Scheme (MHCV-AIS), a sub-component of the Automotive Investment Scheme (AIS), an incentive designed to grow and develop the automotive sector through investment in new and/or replacement models and components that will increase plant production volumes, sustain employment and/or strengthen the automotive value chain.
The MHCV-AIS provides for a non-taxable cash grant of 20% of the value of qualifying investment in productive assets by medium and heavy commercial vehicle manufactures and 25% of the value of qualifying investment in productive assets by component manufactures and tooling companies for MHCV’s as approved by the dti.
Some of the conditions are that the applicant must: • be a registered legal entity in South Africa in
terms of the Companies Act, 2008 (Act 71 of 2008 (as amended); Companies Act, 1973 (as amended); or the Close Corporations Act, 194 (as amended), and must undertake manufac-turing in South Africa.
• be a taxpayer in good standing and must, in this regard, provide a valid tax clearance certificate before the MHCV-AIS grant is disbursed. The grant will only be applicable to investment in assets that will be used in the entity’s South African operations.
• submit a business plan with a detailed marketing and sales plan, a production plan, budget and projected financial income statement, cash flow statement and balance sheet, for a period of at least three (3) years for the project.
• submit a B-BBEE certificate, ITAC Registration certificate, projected financial income statement, cash flow statement and balance sheet for a period of at least three years of the relevant division, cost centre or branch where the project is located, if applicable.
• submit a cost benefit analysis for the project in cases where it cannot provide information in respect of a cost centre.
Clothing and textilesClothing, Textiles, Leather and Footwear, after government has set a 100% local content
requirement, has seen the reintroduction of products where local production had been discontinued.
These include technical fabrics, protective footwear, protective fabrics and chambray fabrics.
The value of public procurement of locally produced clothing and textile products recorded by National Treasury increased from R264 million in 2013/14 to R479 million in 2015/16, an increase of 82%.
This intervention, supported also by the Clothing and Textile Competitiveness Improvement Programme, has contributed to turning the sector around. In response to the flood of cheap clothing imports, government has increased the import duty on clothing to 45% in line with World Trade Organisation regulations
Business process services (BPS)South Africa’s BPS sector continued to maintain its status as a leading global outsourcing destination, whilst steadily moving up the value chain in terms of service offerings.
BPS already accounts for 200 000 jobs nationally and is one of the country’s fastest growing sectors, with double digit growth over the past five years.
By the end of 2015, a further 18 000 jobs had been created as a direct result of the BPS incentive, representing a growth rate of 26% per annum.
Special Economic Zones The South African Government, in an effort to reposition itself in the world economy, established the Industrial Development Zones (IDZ) programme.
SEZs are geographically designated areas of a country set aside for specifically targeted economic activities, supported through special arrangements (that may include laws) and systems that are often different from those that apply in the rest of the country.The purpose of the SEZ programme is to:• expand the strategic industrialisation focus
to cover diverse regional development needs and context;
• provide a clear, predictable and systemic planning framework for the development of a wider array of SEZs to support industrial policy objectives, the IPAP and the NGP;
• clarify and strengthen governance arrangements, expand the range and quality of support measure beyond provision of infrastructure; and
Economy
South Africa Yearbook 2015/16 123
Economy
South Africa Yearbook 2015/16 124
• provide a framework for a predictable financing framework to enable long term planning.
There are currently five operating IDZs in South Africa, namely:• The Coega IDZ is the largest IDZ in Southern
Africa. It was designated in 2001 and became South Africas first IDZ. It is located in the Nelson Mandela Bay Metropolitan Munici-pality in the Eastern Cape and it is strate-gically located on the east-west trade route to service both world and African markets. The Coega IDZ leverages public sector investment to attract foreign and domestic direct investment in the manufacturing sector with an export orientation. The IDZ has attracted investment in the agro-processing,automotive, aquaculture, energy, metals logistics and business process services sectors. This has advanced socio-economic development in the Eastern Cape region through skills development, technology transfer and job creation.
• The Richards Bay IDZ is a purpose built and secure industrial estate on the North-Eastern South African coast. The N2 business corridor links the province’s two major ports, Durban and Richards Bay, and connects with Maputo in Mozambique and, ultimately, areas of East Africa. It is linked to an interna-tional sea port of Richards Bay, tailored for manufacturing and storage of minerals and products to boost beneficiation, investment, economic growth and, most importantly, the development of skills and employment. First-world infrastructure allows for the full exploitation of the areas’ natural and strategic advantages. Through the superb industrial infrastructure, well-established network of shipments, tax and duty-free incentives, the IDZ aims to encourage international competi-tiveness and the attraction of export-orientated manufacturing investment.
• The East London IDZ has become a prime industrial park in South Africa, renowned for its customised solutions for various industries including automotive, agro-processing and aqua-culture. The IDZ offers growth oriented companies a specialised manufacturing platform, innovative industrial and business solutions access to new markets and strategic industry networks. The IDZ, one of the country’s leading specialised industrial parks, is located in Buffalo City, the municipal area which also incorporates Bhisho, the province’s capital and King William’s Town. It is one of the first IDZs in South Africa to be operational
and represents an ideal choice for the location of exported manufacturing and processing. Its location provides investors with connections to major markets, locally and across the globe.
• The Saldanha Bay IDZ in the Western Cape is expected to serve as the primary oil, gas and Marine Repair engineering and logistics services complex in Africa, servicing the needs of the upstream Oil Exploration Industry and Production service companies operating in the oil and gas fields off Sub-Saharan Africa. Situated approximately two hours north of Cape Town, the IDZ will include logistics, repairs and maintenance, and fabrication activities.
• The Dube TradePort is a catalyst for global trade and a portal between KwaZulu-Natal and the world. It is the only facility in Africa that brings together an international airport, a cargo terminal, warehousing, offices, a retail sector, hotels, and an agricultural area. Located 30km north of Durban, Dube TradePort is positioned between the two biggest sea ports in Southern Africa, and linked to the rest of Africa by road and rail. Areas that have been designated as the IDZ are the Dube TradeZone and the Dube AgriZone. The Dube TradeZone aims to focus on manufacturing and value-addition primarily for automotive, electronics and fashion garments. The facility involves warehousing, manufacturing, assembling real estate resource, complete with a single facility in which all freight forwarders and shippers are located (Dube TradeHouse), which enjoys a direct link to the adjacent Dube Cargo Terminal via an elevated cargo conveyor system. The Dube AgriZone – a high-tech, future farming facility and host to the continent’s largest climate-controlled growing area under glass – will focus on high-value, niche agricultural and horticultural products. The AgriLab will look into specialised tissue culture, greenhouses, flowers and plants, all of which require swift air transportation.
South African Emerging Black Filmmakers Incentive SchemeBetween 2008 and 2013, the number of South African film productions have increased from 49 projects to 398 projects of which 256 were South African productions, 77 co-productions and 65 foreign productions with an expenditure of R8 billion.
Since the launch of the South African Emerging Black Filmmakers Incentive Scheme in September 2014 until the end of April 2015, the
Economy
South Africa Yearbook 2015/16 125
Economy
South Africa Yearbook 2015/16 126
dti approved 15 pojects with an incentive value of R42.7 million with production expenditure of R93.8 million.
Business process outsourcing and offshoringBusiness process outsourcing and offshoring is a major global trend, with a significant positive impact on developing countries with the required skills, cost advantages and infrastructure. Under the Monyetla 2 Programme, 3 400 recruits were trained, of which 70% have been guaranteed employment by the business process outsourcing consortium.
African Growth and Opportunity Act (Agoa)In September 2013, a high-level government and business delegation visited the USA to present South Africa’s case for the extension of the Agoa beyond its 30 September 2015 expiry date, as well as the continued inclusion of Africa’s largest economy as a beneficiary of the scheme.
South African Premier Business Awards The South African Premier Business Awards is hosted annually by the the dti in partnership with Proudly South African and Brand South Africa.
The awards recognise business excellence and honours enterprises that promote the spirit of success and innovation as well as job creation, good business ethics and quality. These awards bring together all single sectored awards, among others technology, manufacturing and women in business. The awards are as follows: Lifetime Achievement Award; Manufacturers Award; Exporters Award; Enterprise Development Support Award; Women-Owned Businesses Award; Investor of the Year Award; Proudly South African Enterprise Award; Play your Part Award; SMME Award; Young Entrepreneur Award, and Black Industrialist Award.
International cooperationThe Investment and Trade Initiative (ITI) is part of the dti’s objective to create market penetration for South African value-added products and services, and to promote South Africa as a trade and investment destination.
In February 2016, the dti participated in the 7thITI to India. In March 2016, the dti lead a delegation of businesspeople on an ITI in Porto Alegre and Sao Paulo, Brazil. The objective of the ITI to Brazil was to increase exports of value-added products to the Brazilian market.
South African companies have made inroads
into the Brazilian market, with select products being marketed by companies with a strategic and long-term perspective of the Brazilian market which have been able to penetrate and unlock long-term and sustainable exports.
The ITI focuses on showcasing South Africa’s diverse range of capabilities to produce world-class products and services in the targeted sectors, which include agro-processing (rooibos tea, dried fruits, spices, sauces, frozen fish and sparkling 100% fruit juice), industrial chemicals and automotive components.
South African companies have developed highly specialised skills and products and there are various opportunities for South African companies to market their expertise and collaborate in projects with their Brazilian counterparts.
The programme of the ITI includes trade and investment seminar, business-to-business meetings and sector-specific business site visits to companies in São Paulo and Porto Alegre.
Department of Public Enterprises (DPE)The mandate of the DPE is to ensure that the state-owned companies (SOCs) in its portfolio are directed to serve government’s strategic objectives, as articulated in the NDP, the NGP and the IPAP.
In the current economic climate, SOCs have emerged as key instruments for the State to drive its developmental objectives of creating jobs, and for enhancing equity and transfor-mation.
The SOCs in the department’s portfolio form the cornerstone of the economy and their capacity would be strategically used to support the delivery of the NDP’s outcomes, making the strengthening of oversight tools for the SOCs crucial to socio-economi transformation.
The department does not directly execute programmes but seeks to leverage off state ownership in the economy to support the delivery of key outcomes outlined in the NDP and government’s 2014-2019 MTSF.
The DPE oversees the six SOCs in its portfolio: Alexkor, Denel, Eskom, the South African Forestry Company (SAFCOL), South African Express Airways and Transnet. The department aims to ensure that they are financially sound and pursuing government’s national development objectives, in particular Outcome 6 (an efficient, competitive and responsive economic infrastructure network) of

Economy
South Africa Yearbook 2015/16 125
Economy
South Africa Yearbook 2015/16 126
the 2014-2019 MTSF. Over the medium term, the department
was expected to focus on strengthening its oversight functions, increasing the public sector’s investment in the economy, reducing SOCs’ reliance on the fiscus, and ensuring their financial sustainability.
Role playersAlexkorAlexkor was established in terms of the Alexkor Limited Act of 1992 to mine marine and land diamonds in Alexander Bay. In line with Outcome 6 (an efficient, competitive and responsive economic infrastructure network) of government’s 2014-2019 MTSF, the company is exploring opportunities in energy through coal and limestone mining opportunities, which will require the organisation to expand its operations beyond the Northern Cape.
Alexkor has further commissioned and started a study into non-mining activities in the Northern Cape that the Richtersveld community could pursue from the proceeds of the pooling and sharing joint venture.
The land mining rights and 49% of the mining operations were ceded to the Richtersveld community following the conclusion of the land restitution agreement with government in 2007. Alexkor remains the owner of the sea mining rights and 51% of the mining operations.
The mining operations with the land and sea mining rights have been pooled into an unincor-porated entity called the Alexkor Pooling and Sharing Joint Venture. The mining operations employ 250 people.
The settlement agreement included, among other things, the restoration of land and mineral rights, the formation of the pooling and sharing joint venture, environmental rehabilitation, and the establishment and development of the town at Alexander Bay.
As a result, since November 2013, the town has been made official and now forms part of the Richtersveld Municipality. Progress to date includes the upgrade of residential properties’ electrical and water reticulation systems, and the transfer of the mine operations restored with the land mining rights to the Richtersveld Mining Company. The implementation of the plan to rehabilitate mining areas has also begun.
The company has also undertaken an initial study to explore alternative revenue streams to improve its financial position. Alexkor will continue to work towards improved sustainability over the medium term.
South African Forestry CompanySAFCOL is government’s forestry company conducting timber harvesting, timber processing and related activities, both domestically and internationally.
The company also contributes to education and health care infrastructure through maintaining its commitment to support the growth and transfor-mation of the communities in which it operates and promoting socio-economic development.
It provides almost 5 000 permanent and contractual jobs in rural areas in Mpumalanga, Limpopo and KwaZulu-Natal.
Broadband InfracoBroadband Infraco is an SOC that operates within specific focus areas of the country’s telecommunications sector.
It is intended to improve market efficiency in the long-distance connectivity segment by increasing available long-distance network infrastructure.
Broadband Infraco provides long-distance national and international connectivity to licensed private sector partners, licence-exempt projects of national importance and previously underserviced areas.
Broadband Infraco also provides strategic international connectivity to operators in the South African Development Community (SADC) region and on the west coast of Africa.
Broadband Infraco fibre optic network currently comprises approximately 14 000 km of fibre and 158 Pops Points of Presence (PoPs) countrywide.
DenelDenel is the largest manufacturer of defence equipment in South Africa and operates in the military aerospace and landward defence environment.
It is an important defence contractor and a key supplier to the South African National Defence Force (SANDF), both as a manufacturer of original equipment and service provider for the overhaul, maintenance, repair, refurbishment and upgrade of equipment in the SANDF’s arsenal.
Denel supplies systems and consumables to end-users, as well as sub-systems and components to its industrial client base.
It also has a number of equity partnerships, joint ventures and cooperation agreements with international players in the defence industry.
Economy
South Africa Yearbook 2015/16 127
Economy
South Africa Yearbook 2015/16 128
EskomEskom’s mandate is to generate, transmit and distribute electricity to industrial, mining, commercial, agricultural and residential customers and redistributors.
It contributes to the realisation of Outcome 6 (an efficient, competitive and responsive economic infrastructure network) of govern-ment’s 2014-2019 MTSF.
Eskom generates 95% of the electricity used in South Africa and 45% of the electricity used in Africa.
To stabilise the company’s liquidity, Cabinet approved a R23 billion equity injection to Eskom in 2015 which was enabled through the Eskom Special Appropriation Act of 2015, and converted a R60 billion subordinated loan into equity to strengthen the company’s balance sheet.
This will enable Eskom to borrow in financial markets to fund its infrastructure build programme. The first R10 billion tranche of funding was transferred to Eskom in July 2015 and a further R5 billion was transferred in December 2015.
South African AirwaysSAA is South Africa’s national airline and operates from OR Tambo International Airport in Johannesburg, Gauteng. Its principal activities include providing scheduled air services for the transportation of passengers, freight and mail to international, regional and domestic destinations. In fulfilling its mission to be an African airline with global reach, it operates to 38 destinations worldwide and provides a competitive, quality air transport service within South Africa and to major cities worldwide.
South African ExpressSouth African Express Airways was established in 1994 as a regional carrier operating domestic and regional flights, serving secondary routes in South Africa and the continent, including regional routes to Botswana, Namibia, Democratic Republic of the Congo, Zimbabwe and Zambia.
It also provides feeder air services that connect with the South African Airways network.
TransnetTransnet’s mandate is to contribute to lowering the cost of doing business in South Africa, enable economic growth, and ensure security of supply through providing appropriate port, rail and pipeline infrastructure in a cost-effective and efficient manner.
This is in line with Outcome 6 (an efficient, competitive and responsive economic
infrastructure network) of government’s 2014-2019 MTSF.
Considering the economic climate, the company is reviewing its investment programme to ensure that it is optimised and remains affordable, which may necessitate an extension in planned capital programme expenditure from 7 to 10 years, due to a decrease in export demand for commodities.
Notwithstanding these challenges, over the medium term and beyond, Transnet will continue with a number of key infrastructure and equipment projects.
These include the rollout of the manganese expansion project, the berth deepening and reconstruction of Durban Container Terminal Pier 2, the doubling in size of the Overvaal Tunnel, the delivery of the 1 064 locomotives, and delivery on Operation Phakisa initiatives, which relate to the oceans economy.
Government Employees Pension Fund (GEPF)The GEPF is Africa’s largest pension fund, with more than 1,2 million active members, in excess of 400 000 pensioners and beneficiaries, and assets worth more than R1.6 trillion.
State workers and retirees, including depart-mental bureaucrats, teachers, nurses and members of the police force are among its members.
Department of Small Business Development (DSBD) The mission of the DSBD is to create a conducive environment for the development and growth of small businesses and cooperatives through the provision of enhanced financial and non-financial support services.
The DSBD creates a conducive environment for the development and growth of small businesses and cooperatives through the provision of:• enhanced financial and non-financial support services, • competitiveness, market access, • promotion of entrepreneurship, advancing
localisation • leveraging on public and private procurement.The department leads an integrated approach on the promotion and development of small businesses and cooperative, focusing on the economic and legislative drivers that would stimulate entrepreneurship to contribute to radical economic transformation.
According to the Goldman Sachs 2015 Report on Small Business, the South African economy
Economy
South Africa Yearbook 2015/16 127
Economy
South Africa Yearbook 2015/16 128
can grow by 5% over the next five years if government and the private sector invest R12 billion in 300 000 small businesses.
During the 2015/16 financial year, the DSBD continued with the roll-out of red tape reduction guidelines at municipal level with 81 munici-palities.
By end of 2015, the DSBD and its partners were implementing the National Informal Business Upliftment Strategy (NIBUS), which hinges on three pillars: • Building capacity of local traders;• Promoting partnerships between locals and
foreign nationals; and,• Ensuring an effective regulatory environment,
such as by-laws enforcement, addressing migration issues, etc.
The NIBUS seeks to uplift informal businesses and render support to local chambers/business associations and Municipal Local Economic Development offices to deliver and facilitate access to upliftment programmes.
The focus will mainly be on designated groups – women, youth and people with disabilities – in townships and rural areas of South Africa. The strategy advances government’s priorities of speeding up growth and transforming the economy to create decent work and sustainable livelihoods through inclusive growth.
The strategy specifically targets entrepreneurs in the informal economy. This sector has been identified as critical in addressing the key developmental goals of the government, namely sustainable livelihoods (poverty), job creation (unemployment) and equality (inequality). More than two million South Africans are making means in the informal economy, mostly as survivalist enterprises. There are also vibrant economic business activities that need support to graduate from survival to sustainability and performance.
Department of Public Works (DPW)The DPW is mandated to be the custodian and portfolio manager of national government’s immovable assets.
Following the operationalisation of the Property Management Trading Entity in 2015/16, the department’s role will now be policy formulation, coordination, regulation and oversight relating to the provision of accommodation and expert built environment services to client departments at the national government level; as well as, through the Property Management Trading Entity, the planning, acquiring, managing and disposing of immovable assets in the department’s custody.
The department is further mandated to coordinate and provide strategic leadership in job creation initiatives through the implemen-tation of the Expanded Public Works Programme (EPWP). Public works is constitutionally designated as a concurrent function exercised by both the national and provincial spheres of government.
As articulated in government’s 2014-2019 MTSF and the NDP, slow economic growth and the associated unemployment are expected to characterise South Africa’s economic performance over the medium term.
Against this background, the DPW is expected to contribute to providing labour intensive work opportunities and income support to low skilled or unskilled unemployed people by coordinating the EPWP.
The department enables participating government and non-government bodies to identify and bring into the programme labour intensive projects with a significant capacity to absorb low skilled work seekers.
Legislation and policiesThe DPW is governed by: • The State Land Disposal Act, 1961 (Act 48 of
1961)• Occupational Health and Safety (OHS) Act,
1993 (Act 85 of 1993), compels the DPW to prepare health and safety specifications for any intended construction project and contractors making a bid, or appointed to perform construction work with the specifi-cations.
Responsibility for OHS and workers’ compen-sation in South Africa resides in three government departments:• The Department of Labour is responsible
for workers’ compensation, in terms of the Compensation for Occupational Injuries and Diseases Act, 1993 (Act 130 of 1993), and for OHS, in terms of the OHS Act of 1993.
• The Department of Mineral Resources is responsible for OHS in mines and mining areas, in terms of the Mine Health and Safety Act, 1996 (Act 29 of 1996).
• The Department of Health is responsible for compensating mine workers, in terms of the Occupational Diseases in Mines and Works Act, 1993 (Act 208 of 1993).
Role playersConstruction Industry Development Board (CIDB)The CIDB provides leadership to stakeholders; stimulates the growth, reform and improvement
Economy
South Africa Yearbook 2015/16 129
Economy
South Africa Yearbook 2015/16 130
of the construction sector; and enhances the industry’s role in the South African economy. The board’s total budget for 2016/17 is R126 million.
Council for the Built Environment (CBE)The CBE is an overarching body that coordinates the six built-environment profes-sional councils – architecture, engineering, landscape architecture, project and construction management, property valuation and quantity surveying – to promote good conduct within the professions, transform them and advise government on built- environment related issues.
The CBE is also an appeal body to ensure protection of the public interest. As such, the CBE and the six councils for the professions maintain, and apply, standards for built-environment professionals’ conduct and practice to effectively protect the interests of the public. The council’s total budget for 2016/17 is R45 million.
Programmes and projectsExpanded Public Works ProgrammeThe EPWP is one of government’s key programmes aimed at providing poverty and income relief through temporary work for the unemployed.
The EPWP is a nationwide programme cover- ing all spheres of government and SOEs.
The programme provides an important avenue for labour absorption and income transfers to poor households, in the short to medium-term.
EPWP projects employ workers on a temporary or ongoing basis with government, contractors, or other non-governmental organi-sations under the Ministerial Conditions of Employment for the EPWP or learnership employment conditions.
The EPWP creates work opportunities in four sectors, namely infrastructure, non-State, environment and culture and social, by:• increasing the labour intensity of government-
funded infrastructure projects • creating work opportunities through the
Non-Profit Organisation programme and Community Work Programme
• creating work opportunities in public environment and culture programmes
• creating work opportunities in public social programmes.
The EPWP also provides training and enterprise development support, at a sub-programme level.Since 2012/13, the EPWP has created 4 185 426 work opportunities, and targets creating an additional 4 205 730 work opportunities by the end of 2018/19.
As the coordinator of the programme, the DPW will monitor the quality of the programme’s delivery of infrastructure and services to the poor (including training), and it will encourage greater participation in the programme and community ownership of it.
Spending on transfers and subsidies for the EPWP was set to increase from R1.7 billion in 2015/16 to R2.3 billion in 2018/19, at an average annual rate of 11%.
For coordinating the programme, the department projects spending R1 billion over the medium term, specifically on compensation of employees and goods and services; including R622 million for personnel providing support at the provincial level for administering the programme grants.
Department of LabourThe mandate of the Department of Labour is to regulate the labour market through policies and programmes developed in consultation with social partners, which are aimed at: • improving economic efficiency and produc-
tivity• facilitating decent employment creation • promoting labour standards and fundamental
rights at work • providing adequate social safety nets to
protect vulnerable workers • promoting and enforcing sound labour
relations• eliminating inequality and discrimination in the
workplace • enhancing occupational health and safety
awareness and compliance in the workplace• giving value to social dialogue in the formulation
of sound and responsive legislation and policies to attain labour market flexibility for competi-tiveness of enterprises that is balanced with the promotion of decent employment.
Legislation and policyThe department administers the following legislation:• The Labour Relations Act, 1995 (Act 66 of
1995), applies to all workers and employers, and aims to advance economic development, social justice, labour peace and the democracy of the workplace.
• The Employment Equity Act, 1998 (Act 55 of 1998), applies to all employers and workers and protects workers and job seekers from unfair discrimination, and also provides a framework for implementing affirmative action.
• The Unemployment Insurance Act, 1996
Economy
South Africa Yearbook 2015/16 129
Economy
South Africa Yearbook 2015/16 130
(Act 30 of 1996), provides security to workers, when they become unemployed.
• The OHS Act, 1993 (Act 85 of 1993), provides and regulates health and safety at the workplace for all workers.
• National Economic Development and Labour Council (NEDLAC) Act, 1994 (Act 35 of 1994).
• Skills Development Act, 1998 (Act 97 of 1998 as amended), develops and improves the skills of the South African workforce.
• Employment Services Act, 2014 (Act 4 of 2014), promotes employment, growth and workplace productivity.
Labour Policy and Industrial RelationsThe Labour Policy and Industrial Relations Branch supervises policy research, labour market information and statistical services.
This includes regulation of labour and employer organisations and bargaining councils, dealing with all the department’s responsibilities and obligations in relation to the International Labour Organisation and other international and regional bodies with which the South African Government has formal relations, as well as the effective functioning of the Commission for Conciliation, Mediation and Arbitration (CCMA) and NEDLAC.
The CCMA is an independent dispute-resolution body created in 1996, in terms of the Labour Relations Act of 1995.
It does not belong to, nor is it controlled by, any political party, trade union or business.
The CCMA was established to provide South Africans with an accessible, user-friendly and affordable labour dispute resolution system.
Workers who have allegedly been unfairly dismissed, or are the victims of various unfair labour practices, are able to approach the CCMA alone or with certain categories of recognised representatives to seek redress for workplace wrongs.
The Labour Policy and Industrial Relations programme receives R9.1 million in 2017/18 and R9.7 million in 2018/19 to establish a national minimum wage fixing mechanism, to adjust the level of the wage periodically, and to review the impact of the national minimum wage.
Role playersUnemployment Insurance Fund (UIF)The UIF is a public entity of the Department of Labour that contributes to alleviating poverty in South Africa by providing effective short-term unemployment insurance to all workers who qualify for unemployment and related benefits.
The Unemployment Insurance Amendment
Act, 2003 (Act 32 of 2003) deals with the administration of the fund and the payment of benefits.
It also provides for the commissioner to maintain a database to pay benefits to benefi-ciaries.
The South African Revenue Service (SARS) continues to administer the Unemployment Insurance Contributions Act, 2002 (Act 4 of 2002).
The fund is financed through contributions from employees and employers, as legislated in the Unemployment Insurance Contributions Act of 2002, as well as return on investments.
SARS collects contributions from all employers whose workers pay employees’ tax. The collection of contributions from all other employers is delegated to the Unemployment Insurance Commissioner.
The fund’s mandate and job creation initiatives contribute to three core elements identified in the NDP (social protection through the provision of unemployment insurance to all workers in the country; employment through investment in job creation projects; and quality education and skills development through training initiatives) that aim to provide unemployed beneficiaries with various artisan skills.
In addition to improving benefits, the fund aims to improve its efficiency by improving the rate at which claims are processed and paid from five weeks in 2015/16 to four weeks in 2017/18, and then to three weeks in 2018/19.
The fund also aimed to save an estimated 35 000 jobs over the medium term by assisting distressed companies through an allocation of R229.1 million to Productivity South Africa’s turnaround solutions programme.
The training lay-off scheme is an alternative to retrenchment for companies in distress. Partici-pation in this scheme will ensure that benefi-ciaries of the fund do not lose their jobs, and are reskilled to remain active in the labour market
Compensation Fund (CF)The department administers the CF, which compensates workers who are victims of occupational disability, occupational disease and fatal work incidents.
The services of the Compensation for Occupa-tional Injuries and Diseases Act, 1993 (Act 130 of 1993) were extended and are rendered at provincial level.
To further strengthen social protection, the fund is working on amendments to the Compen-sation for Occupational Injuries and Diseases Act of 1993 to include domestic workers as
Economy
South Africa Yearbook 2015/16 131
Economy
South Africa Yearbook 2015/16 132
beneficiaries; develop a rehabilitation, reinte-gration and return to work policy for injured and diseased workers; and increase benefits.
The CF will work towards the continual enhancement and improvement of its claims registration, payments and automated adjudi-cation systems to improve service delivery, and the marketing and promotion of its online claims registration portal.
These initiatives are expected to lead to an increase in spending over the medium term in the administration programme from R827.4 million in 2015/16 to R1.1 billion in 2018/19.
The Umehluko integrated claims management enables employers and medical service providers to report accidents and submit medical reports online. Using this system, the fund’s clients can track the status of their claims at any time, and it is set to improve the percentage of medical claims finalised per year within a three month period from 60% or 199 476 in 2015/16 to 80% or 313 783 in 2018/19.
In an effort to strengthen social protection and alleviate poverty, the fund’s board reviewed the existing compensation and pension benefits, and increased the minimum payout by 7 per cent from R3 878 to R4 151 per month. The fund also planned to increase the number of employers registered with the fund from 592 972 in 2015/16 to 719 126 in 2018/19 in order to increase the number of workers covered.
The fund’s main source of revenue is the levies payable by employers based on a determined percentage of the annual earnings of their employees and the risk category of the employer.
Total revenue collected in 2015/16 amounts to R11.3 billion, and is estimated to grow to R20.3 billion in 2018/19. It is used to pay benefits and cover the cost of administering the fund.
National Economic Development and Labour CouncilNEDLAC requires organised labour, organised business, community-based organisations and government to work as a collective to promote the goals of economic growth, and social and economic equity. The council’s total budget for 2016/17 is R30.9 million.
Organised business is represented by Business Unity South Africa, which brings together the Black Business Council and Business South Africa.
Organised labour is represented by the three main labour federations in South Africa: the Congress of South African Trade Unions, the Federation of Unions of South Africa and the
National Council of Trade Unions.
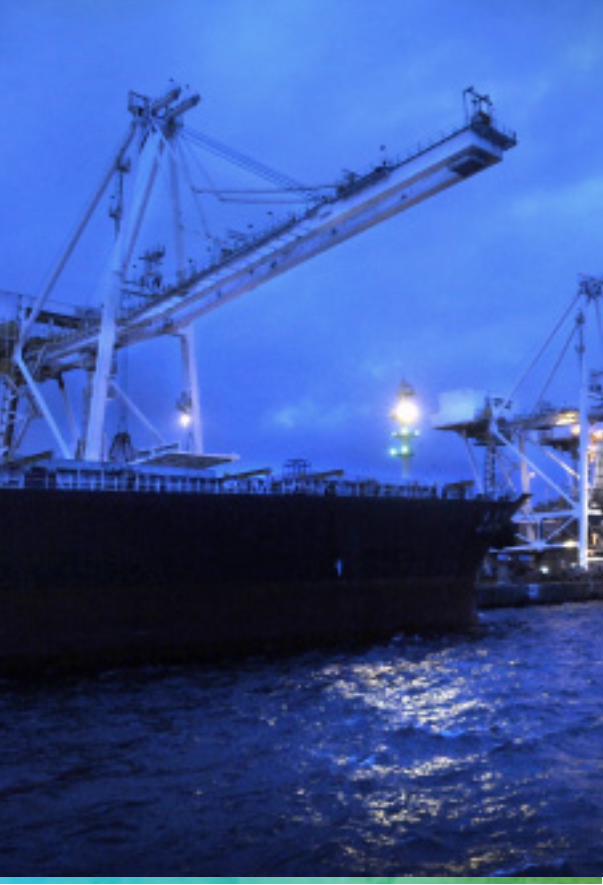
Economy
South Africa Yearbook 2015/16 131
Economy
South Africa Yearbook 2015/16 132