South Africa - Republic of The South African Wine … GAIN Publications/Wine...Page 2 Executive...
14
THIS REPORT CONTAINS ASSESSMENTS OF COMMODITY AND TRADE ISSUES MADE BY USDA STAFF AND NOT NECESSARILY STATEMENTS OF OFFICIAL U.S. GOVERNMENT POLICY Date: GAIN Report Number: Approved By: Prepared By: Report Highlights: Post forecasts that the South Africa grape crop for wine production will decrease by two percent to 1.490 million tons in 2015, from the peak production of 1.520 million tons in 2014. Post forecasts that South Africa wine exports will increase by 4 percent to 500 million liters in 2015. South Africa wine exports to the United States have grown from 12,971,841 liters in 2011 to 24,460,215 liters in 2014. South Africa`s wine imports from the United States have grown steadily from 14,359 liters in 2012 to 38,552 liters in 2014. On September, 4, 2014, the Minister of Health, proposed amendments to the regulations relating to health messages on container labels of alcohol beverages, which could impact the exports of wines to South Africa. Wellington Sikuka Justina Torry The South African Wine Industry: Production, Consumption and Trade Wine Annual South Africa - Republic of 3/10/2015 Required Report - public distribution
Transcript of South Africa - Republic of The South African Wine … GAIN Publications/Wine...Page 2 Executive...

THIS REPORT CONTAINS ASSESSMENTS OF COMMODITY AND TRADE ISSUES MADE BY
USDA STAFF AND NOT NECESSARILY STATEMENTS OF OFFICIAL U.S. GOVERNMENT
POLICY
Date:
GAIN Report Number:
Approved By:
Prepared By:
Report Highlights:
Post forecasts that the South Africa grape crop for wine production will decrease by two percent to
1.490 million tons in 2015, from the peak production of 1.520 million tons in 2014. Post forecasts that
South Africa wine exports will increase by 4 percent to 500 million liters in 2015. South Africa wine
exports to the United States have grown from 12,971,841 liters in 2011 to 24,460,215 liters in 2014.
South Africa`s wine imports from the United States have grown steadily from 14,359 liters in 2012 to
38,552 liters in 2014. On September, 4, 2014, the Minister of Health, proposed amendments to the
regulations relating to health messages on container labels of alcohol beverages, which could impact the
exports of wines to South Africa.
Wellington Sikuka
Justina Torry
The South African Wine Industry: Production, Consumption
and Trade
Wine Annual
South Africa - Republic of
3/10/2015
Required Report - public distribution

Page 2
Executive Summary
Post forecasts that the South Africa grape crop for wine production will decrease marginally by two
percent to 1.490 million tons in 2015, following the peak production of 1.520 million tons in 2014. The
2013 grape crop for wine production was 1.498 million tons as per industry data. Post forecasts that
South Africa will produce about 1.150 billion liters of wine in the 2015 calendar year, two percent less
than the estimated wine production of 1.172 billion liters in 2014, based on the available grape crop.
The 2013 wine production was published by industry at 1.157 billion liters.
Post forecasts that South Africa will export 500 million liters of wine in 2015, based on the available
wine production of 1.150 billion liters and the weakening exchange rate. Europe will continue to be the
major export market for South African wine. The growth in South African bulk wine exports is
forecasted to continue, at the back of the global trend of bulk wine export growth and the economic
slowdown of some countries in the EU. Bulk wine exports are forecasted at 350 million liters in 2015
(70% of total exports). The 2014 bulk wine exports are estimated at 322 million liters (67% of total
exports), and the 2013 bulk wine exports were 342 million liters (65% of total exports).
While South Africa`s imports from the United States were only two percent of the total imports in 2014,
they have grown steadily from 14,359 liters in 2012 to 38,552 liters in 2014.
On September, 4, 2014, the Minister of Health, proposed amendments to the regulations relating to
health messages on container labels of alcohol beverages, which could impact the cost and exports of
wines to South Africa. Post is aware that industry in South Africa and the United States have raised
concern and submitted comments on the proposed amendment to the regulation.

Page 3
Production
The first wine in South Africa was pressed in 1659 in the Cape from imported France cuttings, seven
years after the founding of a Dutch settlement by Jan van Riebeeck. Today, viticulture is still practiced
predominately in the Western Cape Province at a latitude of 34° south, in an area with a mild
Mediterranean climate (see Figure 1). However, there is also production taking place in the Northern
Cape Province alongside the Orange River and a small amount in the province of KwaZulu-Natal. The
Western Cape enjoys a cooler climate than its latitude might suggest due to cooling breezes from the
cold Benguela current that flows northwards from Antarctica into the Atlantic Ocean, which moderate
the summer temperatures. With excellent growing conditions and different soil types, a wide range of
grape varieties for winemaking can be produced in South Africa’s wine producing areas.
Figure 1: Wine producing areas in South Africa
Source: Wines of South Africa (WOSA)
The South African 2015 grape crop for wine production is forecasted to decrease by two percent to
1.490 million tons from the 2014 peak production estimated at 1.520 million tons as per industry data.
The final 2013 grape crop for wine production was 1,498,702 tons as per industry publication. The 2015
season started two weeks earlier than normal, and according to some wineries the wine grape berries are
Page 4
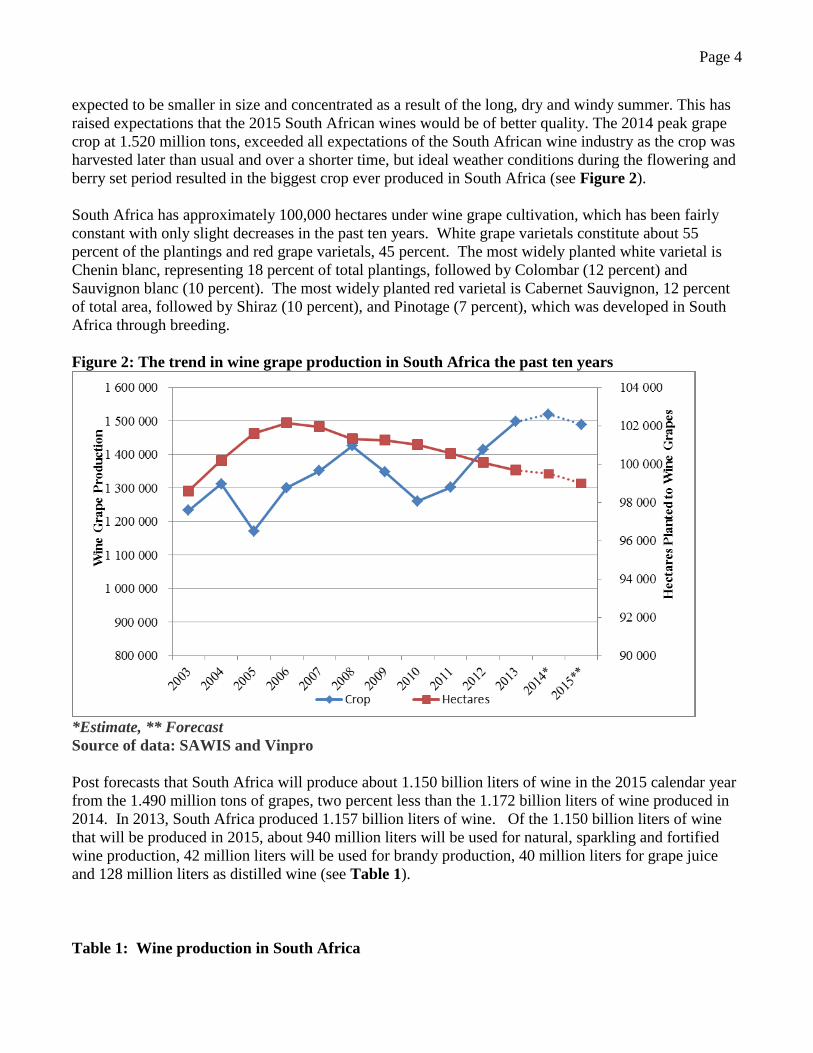
expected to be smaller in size and concentrated as a result of the long, dry and windy summer. This has
raised expectations that the 2015 South African wines would be of better quality. The 2014 peak grape
crop at 1.520 million tons, exceeded all expectations of the South African wine industry as the crop was
harvested later than usual and over a shorter time, but ideal weather conditions during the flowering and
berry set period resulted in the biggest crop ever produced in South Africa (see Figure 2).
South Africa has approximately 100,000 hectares under wine grape cultivation, which has been fairly
constant with only slight decreases in the past ten years. White grape varietals constitute about 55
percent of the plantings and red grape varietals, 45 percent. The most widely planted white varietal is
Chenin blanc, representing 18 percent of total plantings, followed by Colombar (12 percent) and
Sauvignon blanc (10 percent). The most widely planted red varietal is Cabernet Sauvignon, 12 percent
of total area, followed by Shiraz (10 percent), and Pinotage (7 percent), which was developed in South
Africa through breeding.
Figure 2: The trend in wine grape production in South Africa the past ten years
*Estimate, ** Forecast
Source of data: SAWIS and Vinpro
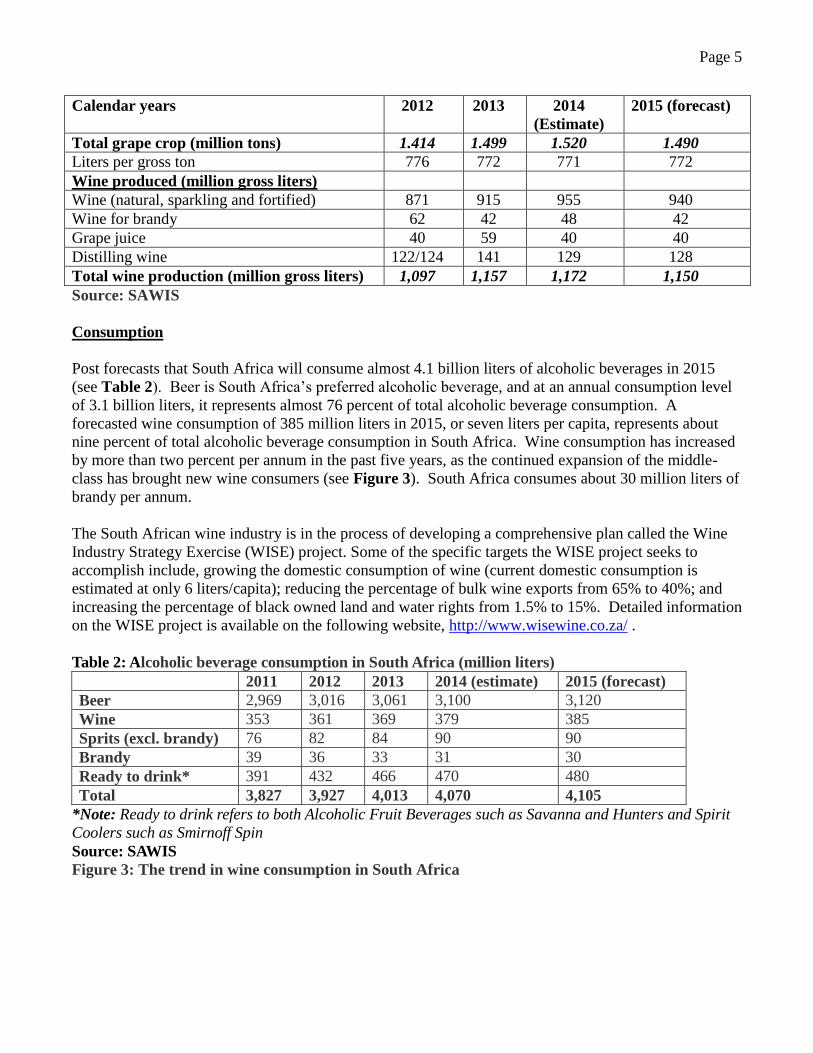
Post forecasts that South Africa will produce about 1.150 billion liters of wine in the 2015 calendar year
from the 1.490 million tons of grapes, two percent less than the 1.172 billion liters of wine produced in
2014. In 2013, South Africa produced 1.157 billion liters of wine. Of the 1.150 billion liters of wine
that will be produced in 2015, about 940 million liters will be used for natural, sparkling and fortified
wine production, 42 million liters will be used for brandy production, 40 million liters for grape juice
and 128 million liters as distilled wine (see Table 1).
Table 1: Wine production in South Africa
Page 5
Calendar years 2012 2013 2014
(Estimate)
2015 (forecast)
Total grape crop (million tons) 1.414 1.499 1.520 1.490
Liters per gross ton 776 772 771 772
Wine produced (million gross liters)
Wine (natural, sparkling and fortified) 871 915 955 940
Wine for brandy 62 42 48 42
Grape juice 40 59 40 40
Distilling wine 122/124 141 129 128
Total wine production (million gross liters) 1,097 1,157 1,172 1,150
Source: SAWIS
Consumption
Post forecasts that South Africa will consume almost 4.1 billion liters of alcoholic beverages in 2015
(see Table 2). Beer is South Africa’s preferred alcoholic beverage, and at an annual consumption level
of 3.1 billion liters, it represents almost 76 percent of total alcoholic beverage consumption. A
forecasted wine consumption of 385 million liters in 2015, or seven liters per capita, represents about
nine percent of total alcoholic beverage consumption in South Africa. Wine consumption has increased
by more than two percent per annum in the past five years, as the continued expansion of the middle-
class has brought new wine consumers (see Figure 3). South Africa consumes about 30 million liters of
brandy per annum.
The South African wine industry is in the process of developing a comprehensive plan called the Wine
Industry Strategy Exercise (WISE) project. Some of the specific targets the WISE project seeks to
accomplish include, growing the domestic consumption of wine (current domestic consumption is
estimated at only 6 liters/capita); reducing the percentage of bulk wine exports from 65% to 40%; and
increasing the percentage of black owned land and water rights from 1.5% to 15%. Detailed information
on the WISE project is available on the following website, http://www.wisewine.co.za/ .
Table 2: Alcoholic beverage consumption in South Africa (million liters)
2011 2012 2013 2014 (estimate) 2015 (forecast)
Beer 2,969 3,016 3,061 3,100 3,120
Wine 353 361 369 379 385
Sprits (excl. brandy) 76 82 84 90 90
Brandy 39 36 33 31 30
Ready to drink* 391 432 466 470 480
Total 3,827 3,927 4,013 4,070 4,105
*Note: Ready to drink refers to both Alcoholic Fruit Beverages such as Savanna and Hunters and Spirit
Coolers such as Smirnoff Spin
Source: SAWIS
Figure 3: The trend in wine consumption in South Africa

Page 6
*Estimate, ** Forecast
Source of data: SAWIS
Trade
Exports
Posts forecasts that South Africa will export 500 million liters of wine (natural, sparkling and fortified
wine) in 2015, based on the total wine production of 1,150 million liters (including wine, wine for
brandy, distilled wine, grape juice) and the prevailing weak rand exchange rate (R11.60/US$). Post
estimates the South African wine exports at 480 million liters in 2014, down from the peak exports of 526
million liters in 2013, based on Global Trade Atlas (GTA) data.
Post forecasts that the growing trend in bulk wine exports from South Africa will continue to 350 million
liters (70% of total exports) in 2015. The 2014 bulk wine exports are estimated at 322 million liters (67%
of total exports) based on the available wine production, and the 2013 bulk wine exports were 342 million
liters (65% of total exports) based on industry data. A long term comparison shows that the growth in
bulk wine exports is much more significant, as bulk wine exports were only 69 million liters (29 percent
of total exports) in 2003. The growth in bulk wine exports is a global trend driven largely by cost
reduction measures, demand for lower priced wines, and competition. This trend is expected to continue.
The European Union, which is the biggest markets for South African wine, is the leading importer for
bulk wine, in addition, some EU countries are undergoing an economic slowdown. As a result, unless
South Africa diversifies its export markets from Europe significantly, its bulk wine exports are projected
to continue increasing in the coming years at the back of the above factors and an increase in production.
Page 7
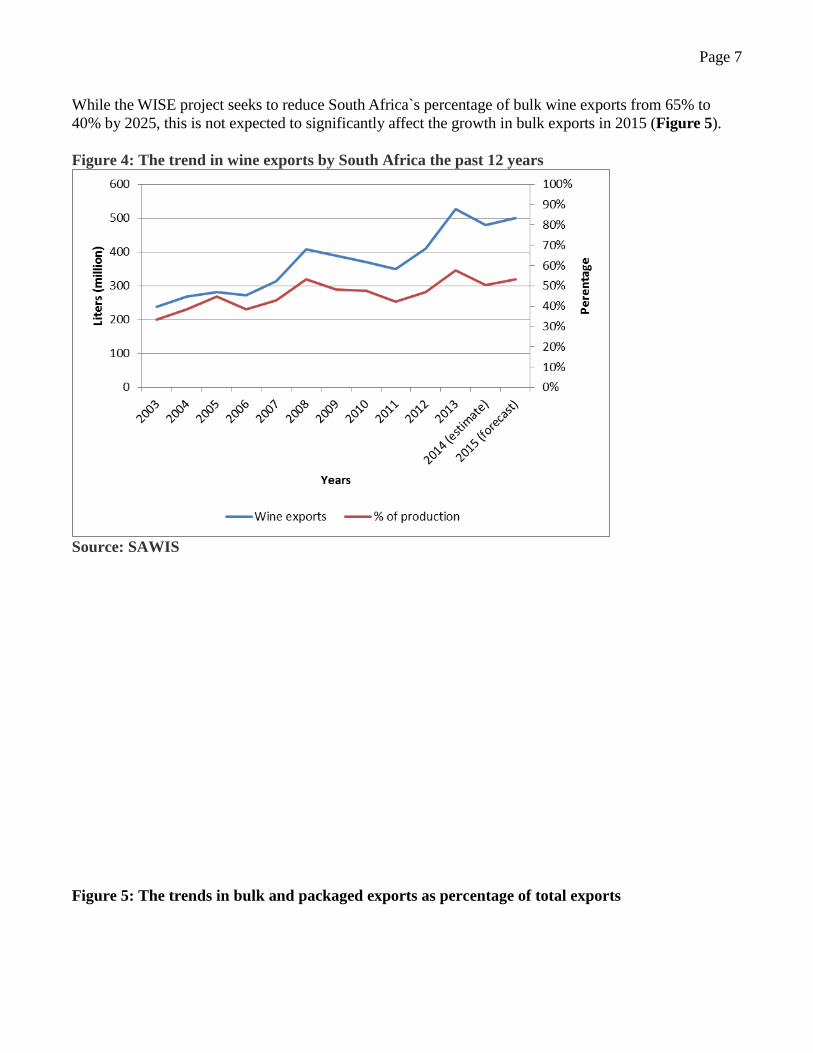
While the WISE project seeks to reduce South Africa`s percentage of bulk wine exports from 65% to
40% by 2025, this is not expected to significantly affect the growth in bulk exports in 2015 (Figure 5).
Figure 4: The trend in wine exports by South Africa the past 12 years
Source: SAWIS
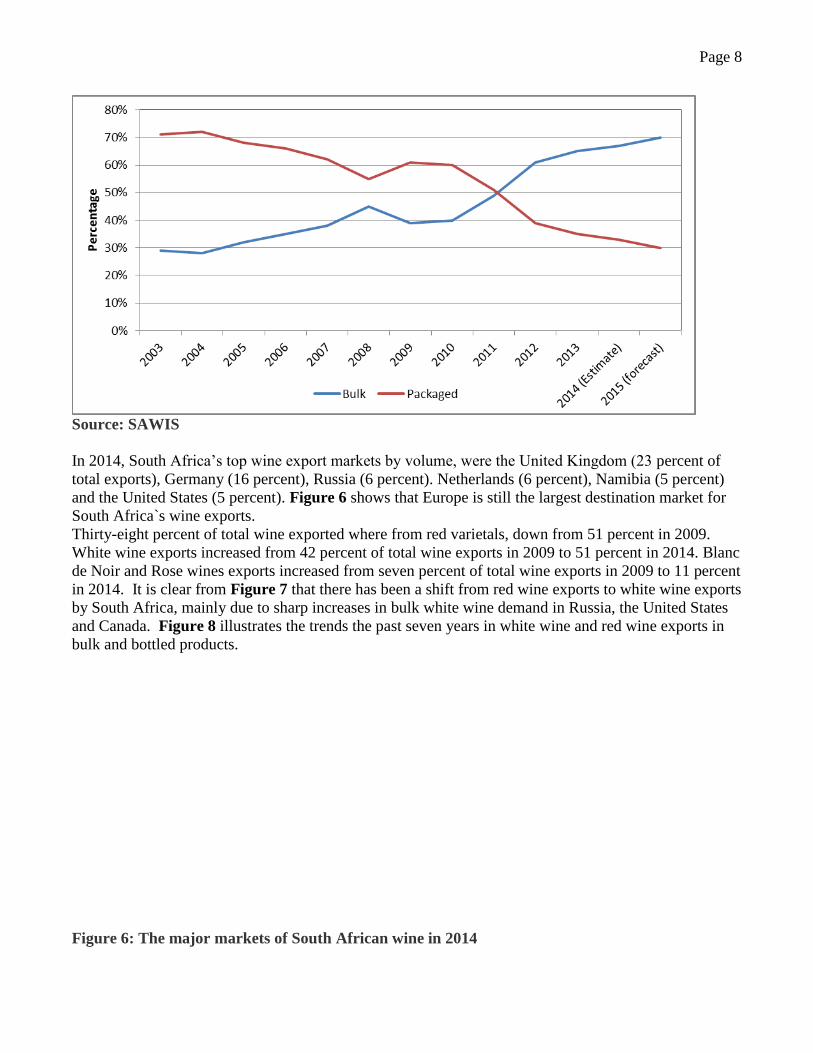
Figure 5: The trends in bulk and packaged exports as percentage of total exports
Page 8
Source: SAWIS
In 2014, South Africa’s top wine export markets by volume, were the United Kingdom (23 percent of
total exports), Germany (16 percent), Russia (6 percent). Netherlands (6 percent), Namibia (5 percent)
and the United States (5 percent). Figure 6 shows that Europe is still the largest destination market for
South Africa`s wine exports.
Thirty-eight percent of total wine exported where from red varietals, down from 51 percent in 2009.
White wine exports increased from 42 percent of total wine exports in 2009 to 51 percent in 2014. Blanc
de Noir and Rose wines exports increased from seven percent of total wine exports in 2009 to 11 percent
in 2014. It is clear from Figure 7 that there has been a shift from red wine exports to white wine exports
by South Africa, mainly due to sharp increases in bulk white wine demand in Russia, the United States
and Canada. Figure 8 illustrates the trends the past seven years in white wine and red wine exports in
bulk and bottled products.
Figure 6: The major markets of South African wine in 2014

Page 9
Source: Global Trade Atlas (GTA)
Figure 7: The trend in white wine and red wine exports as percentage of total exports
Source: SAWIS
Figure 8: The trends in white wine and red wine exports as bulk or bottled products

Page 10
Source: SAWIS
South Africa’s wine exports to the United States
According to GTA data, the 2014 South Africa`s wine exports to the United States decreased by 25
percent to 25 million liters, from the record high exports to the United States of 32 million liters. South
Africa industry contacts indicated that they are still looking into the reasons for the decrease in exports
to the United States. However, in general, wines priced under US$9.00/bottle underperformed in the
United States and the total United States wine imports decreased by 4 percent in 2014. A long term
comparison shows that South Africa wine exports to the United States have grown from 12,971,841
liters in 2011 to 24,460,215 liters in 2014 (see Figure 9). Wine exports to the United States are mainly
in bulk and represent 68 percent of total exports. Red wine exports to the United States increased by
240 percent in 2013, and represents now 43 percent of total exports. In 2012, red wine exports to the
United States only represented 17 percent of total exports.
Figure 9: South Africa’s wine exports to the United States

Page 11
Source: GTA
Imports
South Africa imported about 2.2 million liters of wine, or 0.2 percent of production in 2014, down five
percent from the 2.3 million liters imported in 2013. Major import countries in 2014 included France (36
percent of total imports), Italy (21 percent) and Portugal (14 percent). South Africa imported limited
quantities of wine from the United States (2% of total imports), primarily due to South Africa’s relatively
high import duty of 25 percent on United States wines compared with European wines, where the import
tariff is zero percent, due to South Africa’s Free Trade Agreement with the European Union (see also
Table 3). However, South Africa`s imports from the United States have grown steadily from 14,359
liters in 2012 to 38,552 liters in 2014.
Table 3: Import duties of wine to South Africa
Item Description Unit General EU EFTA SADC
2204.10 Sparkling wine liter 25% Free 25% Free
2204.21.30 Grape must with fermentation prevented or
arrested by the addition of alcohol liter 25% Free 25% Free
2204.21.40 Unfortified wine liter 25% Free 25% Free
2204.21.50 Fortified wine liter 25% Free 25% Free
2204.29.30 Grape must with fermentation prevented or
arrested by the addition of alcohol liter 25% Free 25% Free
2204.29.40 Unfortified wine liter 25% Free 25% Free
2204.29.50 Fortified wine liter 25% Free 25% Free
2204.30 Other grape must liter 25% Free 25% Free
Source: South African Revenue Services (SARS)
Stocks

Page 12
Wine stock levels are estimated to increase by 11% to approximately 447 million liters in 2014 from
401.9 million liters in 2013, mainly due to the increase in production and decreases in exports, which
were partially offset by increases in consumption. The 2015 wine stock levels are forecasted to remain
flat at 450 million liters. At the end of 2012, South Africa’s wine stock was at 433 million liters.
The Regulatory Environment
Proposed amendment to the Regulations relating to health messages on container labels of alcohol
beverages
On September, 4, 2014, the Minister of Health, in terms of Section 15 of the Foodstuffs, Cosmetics and
Disinfectants Act, 1972 (Act No. 54 of 1972), proposed amendments to the regulations relating to health
messages on container labels of alcohol beverages. The post GAIN report on the proposed amendment
can be downloaded on the following link,
http://gain.fas.usda.gov/Recent%20GAIN%20Publications/Regulation%20amendment%20on%20contain
er%20labels%20of%20alcoholic%20beverages_Pretoria_South%20Africa%20-%20Republic%20of_1-
30-2015.pdf .
Post is aware that industry in South Africa and the United States raised concerns and submitted
comments on the proposed amendment to the regulation.
Existing Regulations
Detailed explanations and links to the agencies and regulations governing the import regulations and
standards can be obtained from the following Post FAIRS GAIN Report,
http://gain.fas.usda.gov/Recent%20GAIN%20Publications/Food%20and%20Agricultural%20Import%20
Regulations%20and%20Standards%20-%20Narrative_Pretoria_South%20Africa%20-
%20Republic%20of_12-31-2014.pdf.
The specific laws and regulations governing the wine industry in South Africa are listed below:
- Biodiversity Act, No. 10 of 2004
National Veld and Forest Fire Act (No 101 of 1998)
Protected Areas Act (No 57 of 2003)
Subdivision of Agricultural Land Act (No 70 of 1970)
Western Cape Nature Conservation Laws Amendment Act (No 3 of 2000)
- Competition Act, No 89 of 1998
This legislation impacts on all businesses generally and provides for the investigation, control and
evaluation of restrictive practices, abuse of dominant positions and mergers.
- Consumer Protection Act 68 of 2008

Page 13
On April 1, 2011, the South African Department of Trade and Industry (DTI) published
regulations that brought the Consumer Protection Act (68/2008) into force. The regulation came
into effect six months (October 1, 2011) after the commencement of the act. The primary purpose
of the act is to prevent exploitation or harm to consumers and to promote the social well-being of
consumers. The Act includes a significant change to product liability, where a consumer no
longer has to demonstrate that a producer was negligent before receiving compensation for injury.
The new legislation puts the burden of proof on the producer or supplier, meaning that a consumer
can sue almost any producer or supplier for harm or injury that is the result of a failed, defective,
or unsafe product.
- Environmental legislation includes:
Conservation of Agricultural Resources Act (No 43 of 1983)
Environment Conservation Act (No 73 of 1998)
Cape Nature and Environmental Conservation Act (No 19 of 1974)
National Water Act (No 36 of 1998)
National Environmental Management Act (No 107 of 1998)
Health Act (No 63 of 1977)
Occupational Health and Safety Act (No 85 of 1993)
Atmospheric Pollution Prevention Act (No 45 of 1965)
Fertilizer, Farm Feeds, Agricultural Remedies and Stock Remedies Act (No 36 of 1947)
Conservation of Agricultural Resources Act (no 43 of 1983)
- The Liquor Products Act No. 60 of 1989
Regulates the import and export of liquor products
http://www.westerncape.gov.za/Text/2003/liquor_products_act_no60_1989.pdf .
- The Liquor Act No 59 of 2003
Regulates the large scale manufacture and the distribution of liquor and requires all large scale
manufacturers and distributors to be registered with the National Liquor Authority. The act can be
accessed at: http://www.thedti.gov.za/nla/acts/act2003.pdf.
- The Marketing of Agricultural Products no.47 of 1996
Statutory levies are collected to fund the collection and dissemination of industry information and
statistics, research and development, generic export promotion campaigns and certain empowerment
objectives.
- Labelling Requirements
Wines sold in South Africa, whether certified or not, must comply with a number of mandatory label
requirements which must refer to class designations, alcohol content, name and full address, Wine of
Origin, cultivar and vintage.
- Labor Legislation includes:
Labor Relations Act (no 66 of 1995)
Page 14
Basic Conditions of employment Act (No 75 of 1997)
Employment Equity Act (No 55 of 1998)
Skills Development Act (No 97 of 1998)
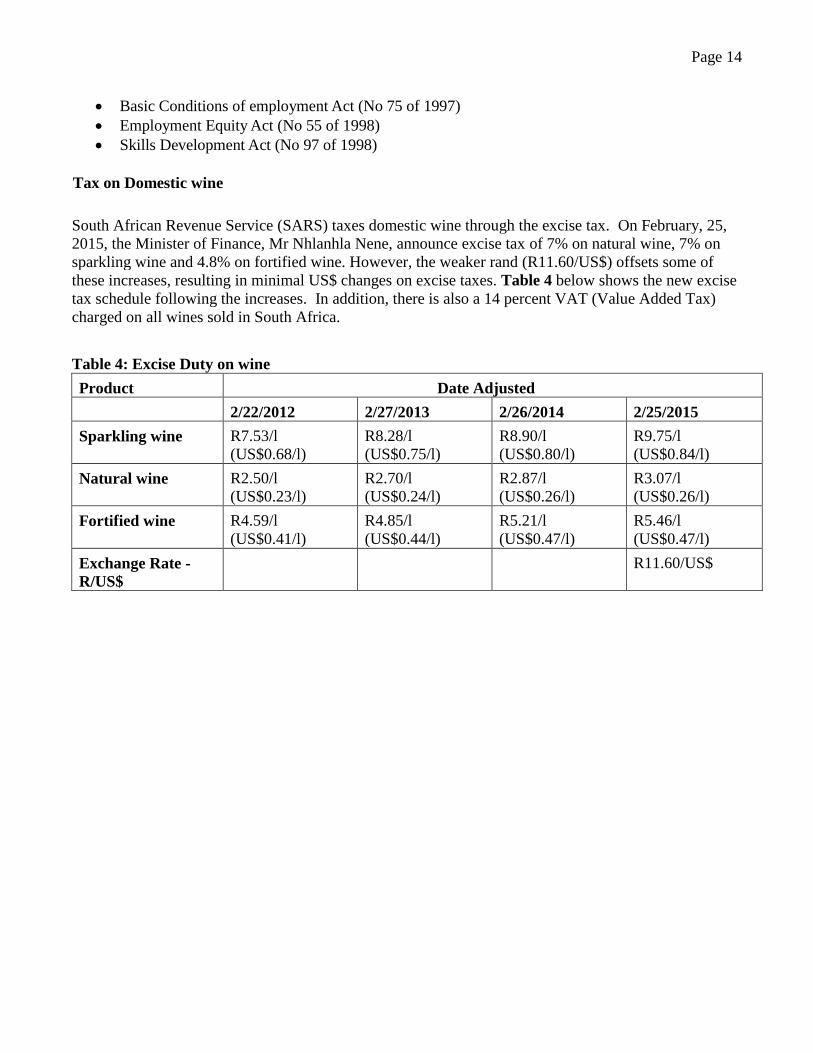
Tax on Domestic wine
South African Revenue Service (SARS) taxes domestic wine through the excise tax. On February, 25,
2015, the Minister of Finance, Mr Nhlanhla Nene, announce excise tax of 7% on natural wine, 7% on
sparkling wine and 4.8% on fortified wine. However, the weaker rand (R11.60/US$) offsets some of
these increases, resulting in minimal US$ changes on excise taxes. Table 4 below shows the new excise
tax schedule following the increases. In addition, there is also a 14 percent VAT (Value Added Tax)
charged on all wines sold in South Africa.
Table 4: Excise Duty on wine
Product Date Adjusted
2/22/2012 2/27/2013 2/26/2014 2/25/2015
Sparkling wine R7.53/l
(US$0.68/l)
R8.28/l
(US$0.75/l)
R8.90/l
(US$0.80/l)
R9.75/l
(US$0.84/l)
Natural wine R2.50/l
(US$0.23/l)
R2.70/l
(US$0.24/l)
R2.87/l
(US$0.26/l)
R3.07/l
(US$0.26/l)
Fortified wine R4.59/l
(US$0.41/l)
R4.85/l
(US$0.44/l)
R5.21/l
(US$0.47/l)
R5.46/l
(US$0.47/l)
Exchange Rate -
R/US$
R11.60/US$