South Africa - Republic of Citrus Annual South Africa ... GAIN Publications/Citrus Annual... ·...
30
THIS REPORT CONTAINS ASSESSMENTS OF COMMODITY AND TRADE ISSUES MADE BY USDA STAFF AND NOT NECESSARILY STATEMENTS OF OFFICIAL U.S. GOVERNMENT POLICY Date: GAIN Report Number: Approved By: Prepared By: Report Highlights: South Africa`s production of grapefruit, oranges and lemons/limes is forecast to increase in the 2017/18 MY, based on the increase in area planted and normal weather conditions in the main growing regions of Limpopo, Eastern Cape and Mpumalanga. The current drought conditions and low winter rainfall received in the Western Cape is expected to severely restrict the availability of irrigation water in the 2017/18 MY, constraining the production of tangerines/mandarins, lemons/limes and oranges in the Western Cape. Nonetheless, South Africa citrus exports to the United States are expected to continue growing, spurred by the continued market access through the African Growth Opportunity Act (AGOA). Wellington Sikuka Kyle Bonsu South Africa Citrus Supply and Demand Report Citrus Annual South Africa - Republic of 12/15/2017 Required Report - public distribution
Transcript of South Africa - Republic of Citrus Annual South Africa ... GAIN Publications/Citrus Annual... ·...

THIS REPORT CONTAINS ASSESSMENTS OF COMMODITY AND TRADE ISSUES MADE BY
USDA STAFF AND NOT NECESSARILY STATEMENTS OF OFFICIAL U.S. GOVERNMENT
POLICY
Date:
GAIN Report Number:
Approved By:
Prepared By:
Report Highlights:
South Africa`s production of grapefruit, oranges and lemons/limes is forecast to increase in the 2017/18
MY, based on the increase in area planted and normal weather conditions in the main growing regions
of Limpopo, Eastern Cape and Mpumalanga. The current drought conditions and low winter rainfall
received in the Western Cape is expected to severely restrict the availability of irrigation water in the
2017/18 MY, constraining the production of tangerines/mandarins, lemons/limes and oranges in the
Western Cape. Nonetheless, South Africa citrus exports to the United States are expected to continue
growing, spurred by the continued market access through the African Growth Opportunity Act
(AGOA).
Wellington Sikuka
Kyle Bonsu
South Africa Citrus Supply and Demand Report
Citrus Annual
South Africa - Republic of
12/15/2017
Required Report - public distribution

Page 2
Commodities:
Exchange rate: Rand/US$ Exchange = 14
Executive Summary
South Africa’s production of grapefruit is forecast to increase by nine percent to 400,000 MT in the
2017/18 MY. This is due to the increase in area planted and normal weather conditions in the main
growing regions of Limpopo and Mpumalanga which account for about eighty-one percent of the
grapefruit production in South Africa. This is expected to result in an eight percent increase in grapefruit
exports to 250,000 MT in the 2017/18 MY.
The production of oranges in the 2017/18 MY is forecast to increase by two percent to 1.43 Million MT.
This is due to normal rainfall, no hail damage and an increase in area planted in the main growing
regions of Limpopo, Eastern Cape and Mpumalanga, which account for about eighty-two percent of the
total orange production. The export of oranges is forecast to increase by one percent to 1.18 Million MT
in the 2017/18 MY, based on the available production and on South Africa`s efforts in addressing
uncertainty in the EU market due to the ongoing Citrus Black Spot (CBS) challenges.
The production of tangerines/mandarins is forecast to decrease by nine percent to 230,000 MT in the
2017/18 MY. This is due to the impact of the drought in the Western Cape, partially offset by increases
in production in other growing regions such as the Eastern Cape, Limpopo and Mpumalanga. The South
African 2017/18 MY exports of tangerines/mandarins is forecast to decrease by fifteen percent to
180,000 MT, based on the lower production.
The production of lemons/limes is forecast to increase by six percent to 420,000 MT in the 2017/18 MY.
This is due to the normal weather conditions and increase in area planted and yields in the main
production areas of Eastern Cape and Limpopo, which account for about eighty percent of the
production. These increases are forecast to be partially offset by the losses in the drought stricken
growing regions in the Western Cape, which produces about ten percent of the country’s total lemons/
limes.
The current drought conditions and low winter rainfall received in the Western Cape is expected to
severely restrict the availability of irrigation water in the 2017/18 MY. This will likely constrain the
production of tangerines/mandarins, lemons/limes and oranges in the Western Cape.
Orange Juice
Lemons, Fresh
Tangerines/Mandarins, Fresh
Oranges, Fresh
Grapefruit, Fresh
Citrus, Other, Fresh

Page 3
Background
The total area planted to citrus increased by seven percent to 70,055 Hectares (Ha) in the 2015/16 MY,
from 65,596 Ha in the 2014/15 MY. This is due to the increase in investment mainly in
tangerine/mandarin and lemon orchards, largely driven by the growth in export revenue. The Limpopo,
Western Cape, Mpumalanga, Eastern Cape, KwaZulu-Natal and Northern Cape provinces are the main
citrus growing regions in South Africa. Figure 1 below shows the map of the citrus growing areas in
South Africa. Figure 2 shows that Limpopo has the largest area planted, followed by Eastern Cape,
Mpumalanga and Western Cape. The Western Cape and Eastern Cape have a cooler climate, which is
suited for the production of the navel oranges, lemons and easy peelers such as Clementines and
Satsumas. The Mpumalanga, Limpopo and KwaZulu-Natal provinces have a warmer climate which is
better suited to the cultivation of grapefruit and Valencia oranges.
Figure 1: Citrus Growing Areas in South Africa.
Source: Citrus Growers Association (CGA)
Figure 2: Citrus Production Regions by Area

Page 4
Source: CGA
Figure 3 shows that oranges are the biggest citrus type produced in South Africa and accounted for 62
percent of the total citrus area planted in the 2015/16 MY.
Figure 3: Distribution of Citrus Production by Type of Citrus
Source: CGA
There are at least 210 commercial citrus varieties being planted in South Africa. Table 1 shows the most
common citrus varieties planted in South Africa. Star Ruby is the most planted grapefruit variety due to
its high global demand. Producers prefer Valencia oranges over Navels as Valencia’s have a longer shelf
life and produce higher yields than Navels. Nardocott is one of the most popular soft citrus cultivars in
South Africa. In 2016, the Tango citrus variety which was developed by the University of California
Riverside’s Citrus Breeding Program, was granted a plant breeders right in South Africa and is expected
to provide competition to the Nardocott variety.
Table 1: Citrus Varieties
Citrus Variety

Page 5
Grape fruit Star Ruby, Marsh, Rose, Flame,
Nelspruit Ruby (Nelruby), Flamingo
Oranges Valencias - Delta, Midknight, Turkey (Juvalle), Oukloon (Olinda, Late), Du Roi ,
Benny.
Navels - Palmer, Bahianinha, Washington, Robyn, Navelina, Lane Late, Newhall,
Cambria, Cara Cara, Rustenburg, Autumn Gold
Mandarins/
Tangarines
Clementine - Nules, Marisol, SRA, Oroval, Esbal, Clemenpons, Oronules
Mandarin - Nadorcott (Afourer), Nova, Or (Orri), Minneola, Mor ,
B17, Tambor , Naartjie, Thoro Temple, Sonet, B24 (African Sunset)
Satsuma - Miho Wase, Owari, Kuno, Miyagawa Wase, Okitsu Wase, Aoshima.
Lemons/Lime Eureka, Eureka SL, Lisbon, Limoneira, Genoa
Source: CGA
Table 2: South Africa Harvest Period for Citrus
Citrus Harvest Period
Marsh Grapefruit April to June
Star Ruby Grapefruit April to September
Navel Oranges June to July
Valencia Oranges July to September
Mandarins/Tangarines July to August
Lemons/Lime July to September
Source: CGA
Table 3 shows the summary of citrus production statistics in South Africa. The balance of the citrus
production after satisfying the export and fresh domestic consumption is delivered for processing.
Table 3: Summary of Fresh Citrus Production, Supply and Distribution
Citrus
2016/2017 MY 2017/2018 MY
Production Domestic
Consumption Exports Production
Domestic
Consumption Exports
MT MT MT MT MT MT
Oranges 1,400,000 72,000 1,170,000 1,430,000 75,000 1,180,000
Grapefruit 366,000 6,000 232,000 400,000 7,000 250,000
Lemons 397,000 17,000 300,000 420,000 18,000 310,000
Soft
Citrus 252,000 28,000 211,000 230,000 28,000 180,000
Total 2,415,000 123,000 1,913,000 2,480,000 128,000 1,920,000
Source: CGA, Global Trade Atlas (GTA) and Post forecasts

Page 6
Grapefruit, Fresh
Production
Post forecasts that the production of grapefruit will increase by nine percent to 400,000 MT in the
2017/18 MY, from 366,000 MT in the 2016/17 MY. This is due to the increase in area plated and
normal weather conditions in the main growing regions of Limpopo and Mpumalanga. About eighty-one
percent of the grapefruit in South Africa is produced in the Limpopo and Mpumalanga regions. The
most predominant variety produced is the Star Ruby accounting for at least eighty-four percent of the
production, followed by the Marsh variety at thirteen percent.
Figure 4 below illustrates that the area planted to grapefruit is estimated to increase by four percent to
7,900 ha in the 2017/18 MY, from 7,600 ha in the 2016/17 MY. This is due to the industry responding to
the increasing global market demand and prices for grapefruit in the past three seasons.
Figure 4: Area Planted to Grapefruit
*Estimate, ** Forecast.
Source: CGA
Consumption
Post forecasts that the grapefruit domestic consumption will increase to 7,000 MT in the 2017/18 MY,
from 6,000 MT in the 2016/17 MY. This is due to the increase in production, and the grapefruit health
trend that is starting to grow in the domestic market. Grapefruit consumption is still relatively low
domestically compared to other types of citrus mainly due to the younger generation that have not
acquired the taste for grapefruit.
Processing

Page 7
Post forecasts that the grapefruit delivered for processing will increase by fourteen percent to 147,000
MT in the 2017/18 MY, from 129,000 MT in the 2016/17 MY, based on the increase in production.
Grapefruit is processed to juice, the majority of which is exported to Europe. The left-over pulp
following commercial juice extraction is an important source of grapefruit oil which is used as a
flavoring in many soft drinks. The inner peel is a source of pectin and citric acid, which are both used by
the food industry to preserve fruits, jams, and marmalades. Naringin is also extracted from grapefruit
peel, and gives tonic-water its distinctive bitter flavor. Finally, the grapefruit peel oil is used in scented
fragrances.
Exports
Post forecasts that grapefruit exports will increase by eight percent to 250,000 MT in the 2017/18 MY,
from 232,000 MT in the 2016/17 MY. This is due to the increase in production and strong demand in
global markets especially Europe and Asia. The 2016/17 MY exports of grapefruit were slightly revised
downward based on the pace of exports up to October 2017, and the decision by South Africa in October
2017 to suspend further exports of grapefruit to Europe in the 2016/17 MY due to risks of Citrus Black
Spot (CBS) interceptions.
South Africa is still faced with the challenges of citrus black spot (CBS) in the European Union (EU)
market. Industry estimates that it is costing South Africa almost R1 Billion (US$77 Million) to address
and comply with the CBS requirements in the EU market. The South African industry is also avoiding
problematic ports with higher CBS interceptions especially in Spain. There is also a growing emphasis
to increase exports to the Middle East and Africa markets. While volumes are still low, grapefruit
exports to the United States have been growing exponentially, from 76 MT in the 2012/13 MY, to 1,802
MT in the 2014/15 MY and 3,737 in the 2015/16 MY. Grapefruit exports to the United States are
expected to continue growing based on the continuation of duty free access through the African Growth
and Opportunity Act (AGOA). South Africa also has a free trade agreement with Europe providing for
duty free access for citrus exports.
Table 4: South African Fresh Grapefruit Exports
South Africa Export Statistics

Page 8
Commodity: 080540, Grapefruit, Fresh Or Dried
Year Ending: December
Partner Country Unit
Quantity
2014 2015 2016 2017*
World T 217,368 220,956 202,527 230,588
Netherlands T 49,217 53,416 59,237 63,867
Japan T 48,222 44,802 31,155 39,505
China T 14,007 19,971 17,462 20,254
Russia T 18,008 18,124 15,842 19,186
United Kingdom T 9,812 11,415 9,966 11,990
Korea South T 5,928 9,104 9,760 10,635
Italy T 10,095 11,976 9,365 9,532
Hong Kong T 4,559 5,011 5,827 7,163
Canada T 8,803 7,136 5,022 6,658
Portugal T 2,979 4,367 5,991 6,232
Swaziland T 15,908 3,576 3,228 4,459
United States T 1,052 1,803 3,736 4,293
United Arab Emirates T 4,828 4,625 4,239 3,966
Taiwan T 3,392 3,257 2,012 3,344
France T 4,198 5,816 3,183 3,251
Germany T 1,378 1,819 5,015 2,386
Ukraine T 1,268 1,123 1,016 1,494
Greece T 1,116 1,318 1,127 1,326
*Exports up to October 2017.
Source: Global Trade Atlas (GTA)
Imports
South Africa is not a major importer of grapefruit. Imports mainly originate from Swaziland, Spain,
Turkey and Israel to fill the small demand gap towards the end of the season. The increase in local
production over the past five years has resulted in a steady decline in grapefruit imports.
Table 5: South African Fresh Grapefruit Imports
South Africa Import Statistics

Page 9
Commodity: 080540, Grapefruit, Fresh Or Dried
Year Ending: December
Partner Country Unit
Quantity
2014 2015 2016 2017*
World T 11,506 7,047 3,808 428
Spain T 95 424 474 175
Israel T 116 55 137 163
Swaziland T 10,898 6,356 2,863 66
Turkey T 46 167 275 21
Zimbabwe T 330 0 0 0
China T 0 21 19 0
*Imports up to October 2017.
Source: GTA
Prices
Table 6 shows the local, export and processed market prices for grapefruit since 2005. Grapefruit prices
for the export and local markets have increased over the past five years based on the weakening rand to
the US dollar. Processed prices tend to fluctuate based on supply. Export prices continue to provide the
highest prices for South African grapefruit which explains` why the industry is export oriented.
Table 6: Grapefruit Prices
Local Market Export Market Processed
Average Price Gross Price Gross Price
Rand/Ton Rand/Ton Rand/Ton
2005 1,487 925 325
2006 1,493 1,764 386
2007 1,796 2,712 237
2008 2,283 3,658 152
2009 1,839 1,846 240
2010 1,437 4,351 268
2011 2,107 3,723 383
2012 2,275 4,371 377
2013 2,352 5,060 376
2014 3,020 5,247 401
2015 3,866 5,737 310
2016 5,154 7,898 409
Source: Citrus Growers Association (CGA)
Table 7: PSD Grapefruit, Fresh Grapefruit, Fresh 2015/2016 2016/2017 2017/2018 Market Begin Year Jan 2016 Jan 2017 Jan 2018
South Africa USDA Official New Post USDA Official New Post USDA Official New Post
Area Planted 7161 7161 7600 7600 0 7900
Area Harvested 6445 6445 6900 6900 0 7000

Page 10
Bearing Trees 6800 6800 7000 7000 0 7100
Non-Bearing Trees 350 350 600 600 0 650
Total No. Of Trees 7150 7150 7600 7600 0 7750
Production 315 315 363 366 0 400
Imports 4 4 4 1 0 4
Total Supply 319 319 367 367 0 404
Exports 203 203 235 232 0 250
Fresh Dom. Consumption 5 5 5 6 0 7
For Processing 111 111 127 129 0 147
Total Distribution 319 319 367 367 0 404
(HECTARES) ,(1000 TREES) ,(1000 MT)

Page 11
Oranges, Fresh
Production
The production of oranges in the 2017/18 MY is forecast to increase by two percent to 1.43 Million MT,
from 1.40 Million MT in the 2016/17 MY. This is due to normal rainfall, no hail damage, and an
increase in area planted in the main growing regions of Limpopo, Eastern Cape and Mpumalanga, which
account for about eighty-two percent of the total orange production. These increases were partially
offset by the drought conditions in the Western Cape, which will severely restrict the availability of
irrigation water in the 2017/18 MY. The Western Cape growing region accounts for about fifteen
percent of the total orange production.
The area planted with oranges is forecast to grow marginally by about one percent to 42,500 hectares
(ha) in the 2017/18 MY, from 42,100 hectares (ha) in the 2016/17 MY, based on the increases in area
planted to seedless orange varieties, especially in the Limpopo region. This rise was partially offset by
the industry shift from orange production to soft citrus in the Western Cape. Figure 5 below shows the
trend in the area planted to oranges since 2007.
Figure 5: Area Planted to Oranges
*Estimate, ** Forecast.
Source: CGA
Consumption
Post estimates that the 2017/18 MY consumption of oranges will increase by four percent to 75,000 MT,
from 72,000 MT in the 2016/17 MY, based on the increase in production. Fresh oranges are the most
popular citrus consumed in South Africa.

Page 12
Exports
The export of oranges is forecast to increase by one percent to 1.18 Million MT in the 2017/18 MY,
from 1.17 Million MT in the 2016/17 MY, based on the available production and South Africa`s efforts
in addressing the CBS challenges and uncertainty in the EU market. South Africa prioritizes supplying
export markets, and thereafter supplying the domestic fresh and processed markets. Europe remains
South Africa’s largest export market for oranges, accounting for approximately forty percent of the total
export market. However, exports to Asia and the Middle East have grown steadily over the years due to
the focus being placed by industry in growing these markets. Exports to the United States are expected
to continue growing based on the duty free access under the African Growth and Opportunity Act
(AGOA). A gradual shift from oranges to soft citrus exports is expected, as South African farmers
supplying the United States market have been switching their orchards from oranges to soft citrus in
response to market preferences and the higher premium received in the United States market.
Table 8: South African Fresh Orange Exports
South Africa Export Statistics
Commodity: 080510, Oranges, Fresh
Year Ending: December
Partner Country Unit
Quantity
2014 2015 2016 2017*
World T 1,143,815 1,159,630 1,064,089 1,157,952
Netherlands T 206,526 232,027 221,672 258,244
United Arab Emirates T 121,056 116,092 99,483 84,420
Saudi Arabia T 92,866 86,906 93,194 80,946
Russia T 125,781 89,416 68,333 78,879
China T 33,871 44,318 48,643 78,291
United Kingdom T 66,546 67,339 60,205 72,767
Hong Kong T 34,556 43,383 49,893 68,251
Portugal T 39,938 54,840 57,824 67,515
Bangladesh T 40,023 38,861 32,603 43,417
United States T 39,225 44,721 40,416 39,837
Italy T 36,430 36,385 33,516 38,065
Canada T 33,943 37,875 32,507 31,835
Malaysia T 28,581 28,242 28,936 28,190
Kuwait T 51,347 47,246 25,943 22,539
Singapore T 12,293 11,338 9,083 12,272
India T 4,721 11,128 4,266 11,474
Oman T 8,186 7,511 5,266 10,832
Germany T 4,070 3,556 10,796 10,696
Bahrain T 4,062 4,614 4,810 8,755
Qatar T 6,963 6,713 4,123 8,448
France T 18,149 25,613 17,075 6,636

Page 13
Sweden T 4,908 7,008 7,046 6,382
Taiwan T 985 3,781 3,918 5,195
Ukraine T 13,648 4,928 6,742 4,838
Mozambique T 6,857 11,328 4,487 4,588
Korea South T 4,431 5,246 3,628 4,177
Ireland T 3,697 3,777 4,749 3,676
Indonesia T 3,318 880 2,980 3,484
Mauritius T 3,093 2,784 3,583 3,452
Vietnam T 3,258 3,964 3,029 3,408
Namibia T 4,643 5,104 3,665 3,209
Zambia T 8,886 7,356 4,386 3,075
Botswana T 1,851 3,365 3,007 2,998
Swaziland T 4,271 4,692 13,688 2,914
*Exports up October 2017.
Source: Global Trade Atlas (GTA)
Imports
The import of oranges is forecast to increase to 10,000 MT in the 2017/18 MY, based on imports from
Swaziland that will resume following their recovery from the drought. Oranges are imported into South
Africa in November and December to close supply gaps and satisfy year-end demand.
Table 9: South African Fresh Orange Imports
South Africa Import Statistics
Commodity: 080510, Oranges, Fresh
Year Ending: December
Partner Country Unit
Quantity
2014 2015 2016 2017*
World T 12,390 12,704 1,180 1,880
Spain T 275 361 531 900
Swaziland T 8,360 11,891 349 806
Egypt T 0 139 46 121
Saudi Arabia T 0 0 0 26
Turkey T 11 0 26 24
Israel T 168 0 11 6
Zimbabwe T 3,450 0 0 0
United Kingdom T 0 20 0 0
*Imports up to October 2017.
Source: GTA
Prices
Page 14
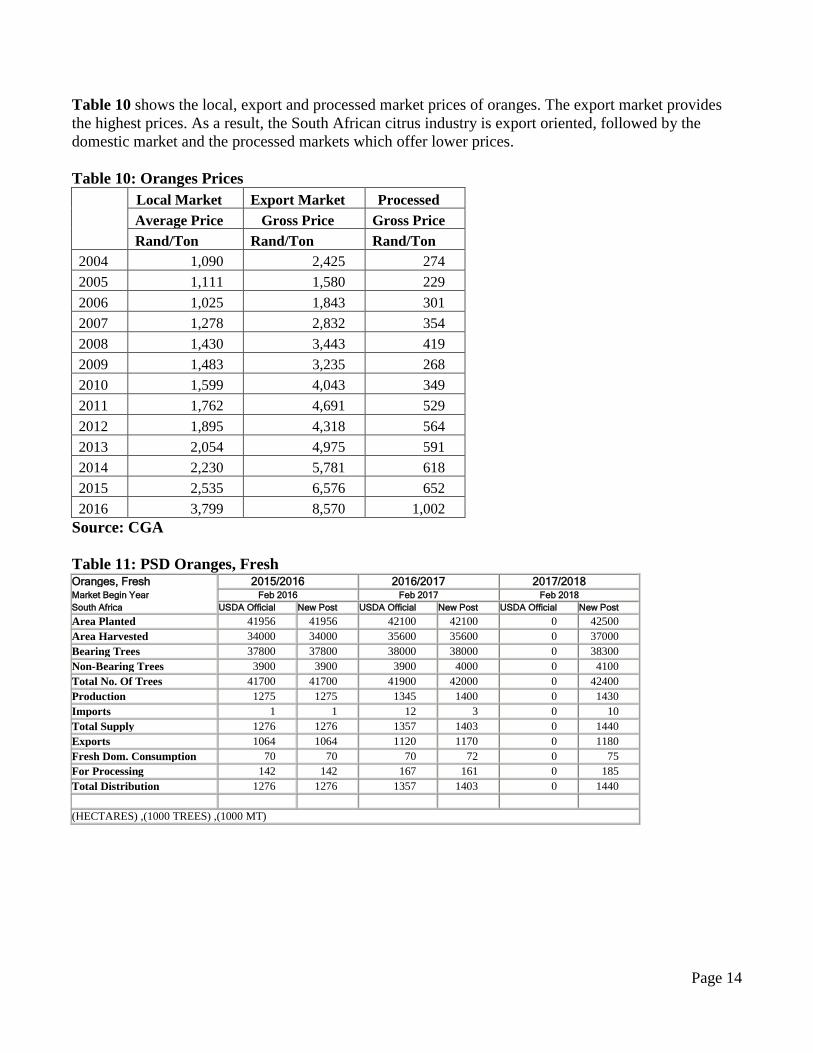
Table 10 shows the local, export and processed market prices of oranges. The export market provides
the highest prices. As a result, the South African citrus industry is export oriented, followed by the
domestic market and the processed markets which offer lower prices.
Table 10: Oranges Prices
Local Market Export Market Processed
Average Price Gross Price Gross Price
Rand/Ton Rand/Ton Rand/Ton
2004 1,090 2,425 274
2005 1,111 1,580 229
2006 1,025 1,843 301
2007 1,278 2,832 354
2008 1,430 3,443 419
2009 1,483 3,235 268
2010 1,599 4,043 349
2011 1,762 4,691 529
2012 1,895 4,318 564
2013 2,054 4,975 591
2014 2,230 5,781 618
2015 2,535 6,576 652
2016 3,799 8,570 1,002
Source: CGA
Table 11: PSD Oranges, Fresh Oranges, Fresh 2015/2016 2016/2017 2017/2018 Market Begin Year Feb 2016 Feb 2017 Feb 2018
South Africa USDA Official New Post USDA Official New Post USDA Official New Post
Area Planted 41956 41956 42100 42100 0 42500
Area Harvested 34000 34000 35600 35600 0 37000
Bearing Trees 37800 37800 38000 38000 0 38300
Non-Bearing Trees 3900 3900 3900 4000 0 4100
Total No. Of Trees 41700 41700 41900 42000 0 42400
Production 1275 1275 1345 1400 0 1430
Imports 1 1 12 3 0 10
Total Supply 1276 1276 1357 1403 0 1440
Exports 1064 1064 1120 1170 0 1180
Fresh Dom. Consumption 70 70 70 72 0 75
For Processing 142 142 167 161 0 185
Total Distribution 1276 1276 1357 1403 0 1440
(HECTARES) ,(1000 TREES) ,(1000 MT)

Page 15
Tangerines/Mandarins, Fresh - Soft Citrus
Production
The production of tangerines/mandarins is forecast to decrease by nine percent to 230,000 MT in the
2017/18 MY, from 252,000 MT in the 2016/17 MY. This is due to the impact of the drought in the
Western Cape, partially offset by increases in production in other growing regions such as the Eastern
Cape, Limpopo and Mpumalanga. About forty-two percent of tangerines/mandarins are produced in the
Western Cape, thirty-one percent in the Eastern Cape and twenty-one percent in Limpopo. The Western
Cape is a winter rainfall region and is currently undergoing a severe drought. The below average rainfall
received in 2017 and the low dam levels (about thirty percent) in the Western Cape will severely impact
the availability of irrigation water in the 2017/18 MY. In the short term, farmers in the Western Cape
are expected to prioritize irrigation of higher yielding varieties and orchards, while the remaining
orchards would be irrigated just to keep the trees alive. There are also indications that some farmers
could cut down some trees to reduce costs. These measures are expected to prolong the recovery of
tangerines/mandarins production once normal rainfall and weather patterns returns in the Western Cape.
Figure 6 shows that initially, the area planted with tangerines/mandarins was flat from the 2006/07 MY
to the 2010/11 MY. However, there has been a significant increase in area planted since the 2010/11
MY due to growers responding to the increasing global demand for seedless tangerines/mandarins and
the increased investment which was driven by high revenue as a result of the weaker rand. The 2017/18
MY area planted to tangerines/mandarins is forecast to reduce by one percent to 12,400 hectares, from
12,500 Ha in the 2016/17 MY, due to the impact of the drought in the Western Cape.
Figure 6: Area Planted to Tangerines/Mandarins
*Estimate, ** Forecast.
Source: CGA
Consumption
Page 16
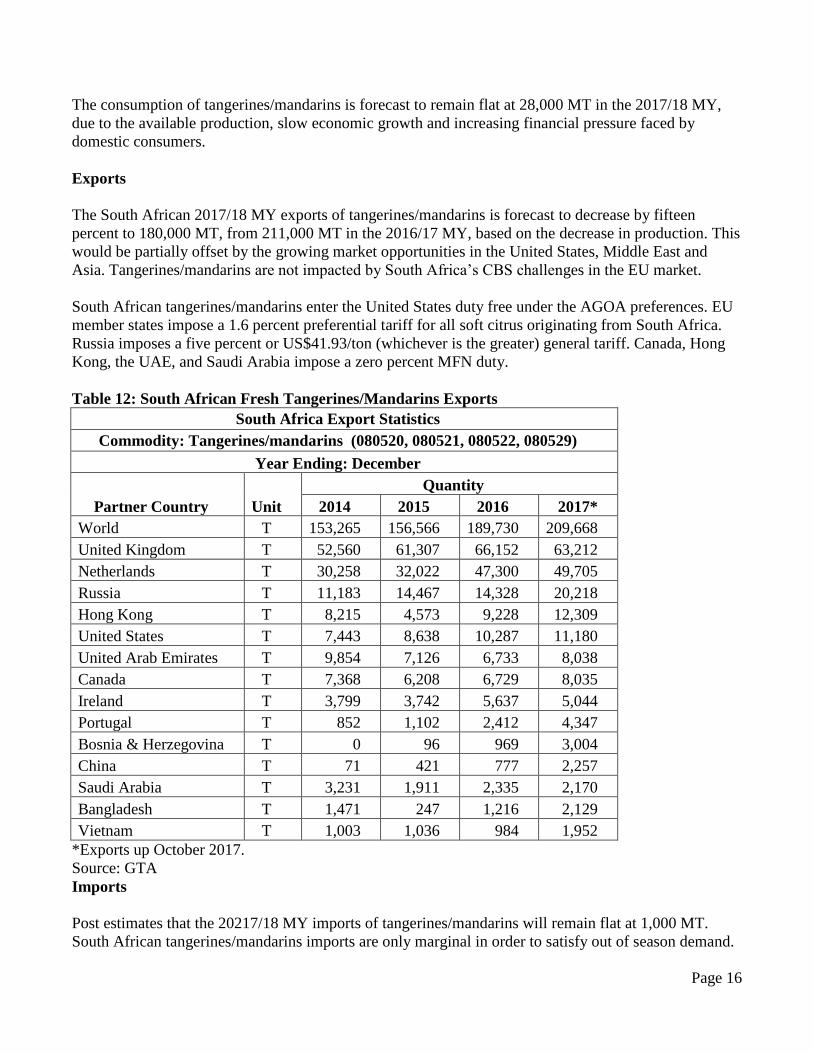
The consumption of tangerines/mandarins is forecast to remain flat at 28,000 MT in the 2017/18 MY,
due to the available production, slow economic growth and increasing financial pressure faced by
domestic consumers.
Exports
The South African 2017/18 MY exports of tangerines/mandarins is forecast to decrease by fifteen
percent to 180,000 MT, from 211,000 MT in the 2016/17 MY, based on the decrease in production. This
would be partially offset by the growing market opportunities in the United States, Middle East and
Asia. Tangerines/mandarins are not impacted by South Africa’s CBS challenges in the EU market.
South African tangerines/mandarins enter the United States duty free under the AGOA preferences. EU
member states impose a 1.6 percent preferential tariff for all soft citrus originating from South Africa.
Russia imposes a five percent or US$41.93/ton (whichever is the greater) general tariff. Canada, Hong
Kong, the UAE, and Saudi Arabia impose a zero percent MFN duty.
Table 12: South African Fresh Tangerines/Mandarins Exports
South Africa Export Statistics
Commodity: Tangerines/mandarins (080520, 080521, 080522, 080529)
Year Ending: December
Partner Country Unit
Quantity
2014 2015 2016 2017*
World T 153,265 156,566 189,730 209,668
United Kingdom T 52,560 61,307 66,152 63,212
Netherlands T 30,258 32,022 47,300 49,705
Russia T 11,183 14,467 14,328 20,218
Hong Kong T 8,215 4,573 9,228 12,309
United States T 7,443 8,638 10,287 11,180
United Arab Emirates T 9,854 7,126 6,733 8,038
Canada T 7,368 6,208 6,729 8,035
Ireland T 3,799 3,742 5,637 5,044
Portugal T 852 1,102 2,412 4,347
Bosnia & Herzegovina T 0 96 969 3,004
China T 71 421 777 2,257
Saudi Arabia T 3,231 1,911 2,335 2,170
Bangladesh T 1,471 247 1,216 2,129
Vietnam T 1,003 1,036 984 1,952
*Exports up October 2017.
Source: GTA
Imports
Post estimates that the 20217/18 MY imports of tangerines/mandarins will remain flat at 1,000 MT.
South African tangerines/mandarins imports are only marginal in order to satisfy out of season demand.

Page 17
Table 13: South African Fresh Tangerines/Mandarins Imports
South Africa Import Statistics
Commodity: Tangerines/mandarins (080520, 080521, 080522, 080529)
Year Ending: December
Partner Country Unit
Quantity
2014 2015 2016 2017*
World T 940 849 941 666
Spain T 557 530 562 348
Israel T 370 285 308 200
Swaziland T 0 31 0 0
Thailand T 3 5 0 0
Turkey T 0 0 22 46
United Kingdom T 0 0 21 49
Angola T 9 0 0 0
Canada T 0 0 0 22
Germany T 0 0 25 0
*Imports up to October 2017.
Source: GTA
Prices
Export markets provide the highest prices for South African soft citrus as shown in Table 14.
Table 14: Tangerines/Mandarins Prices
Local Market Export Market Processed
Average Price Gross Price Gross Price
Rand/Ton Rand/Ton Rand/Ton
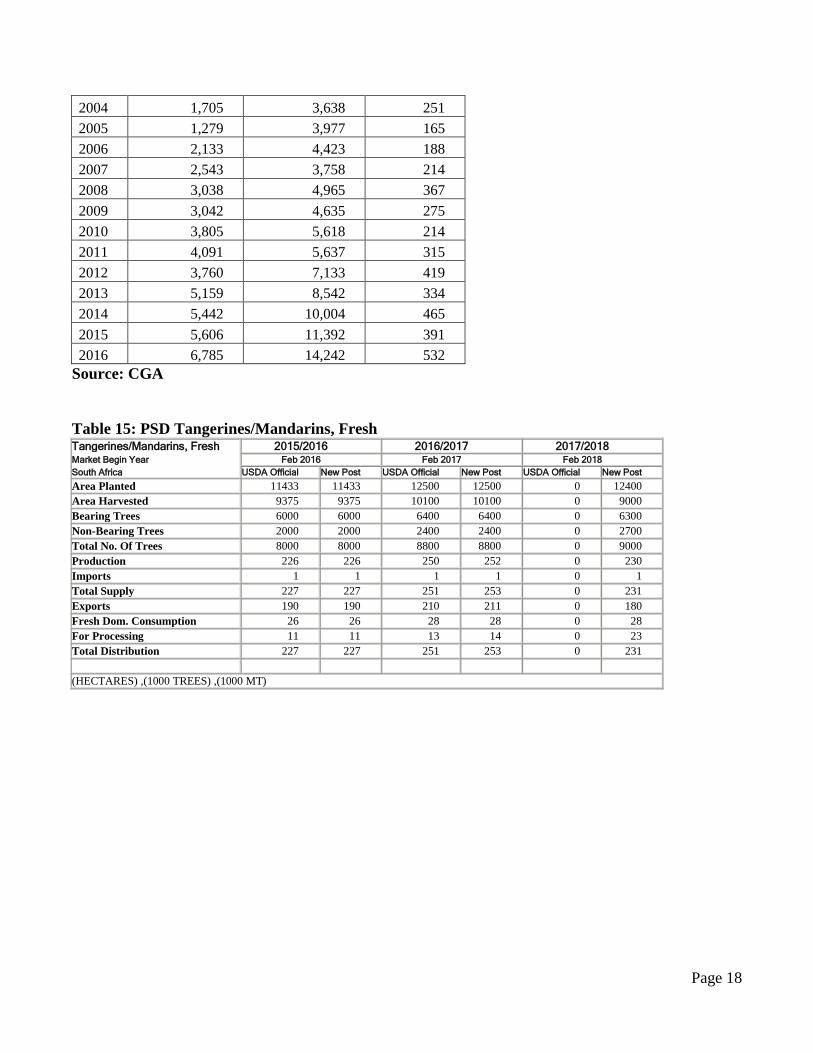
Page 18
2004 1,705 3,638 251
2005 1,279 3,977 165
2006 2,133 4,423 188
2007 2,543 3,758 214
2008 3,038 4,965 367
2009 3,042 4,635 275
2010 3,805 5,618 214
2011 4,091 5,637 315
2012 3,760 7,133 419
2013 5,159 8,542 334
2014 5,442 10,004 465
2015 5,606 11,392 391
2016 6,785 14,242 532
Source: CGA
Table 15: PSD Tangerines/Mandarins, Fresh Tangerines/Mandarins, Fresh 2015/2016 2016/2017 2017/2018 Market Begin Year Feb 2016 Feb 2017 Feb 2018
South Africa USDA Official New Post USDA Official New Post USDA Official New Post
Area Planted 11433 11433 12500 12500 0 12400
Area Harvested 9375 9375 10100 10100 0 9000
Bearing Trees 6000 6000 6400 6400 0 6300
Non-Bearing Trees 2000 2000 2400 2400 0 2700
Total No. Of Trees 8000 8000 8800 8800 0 9000
Production 226 226 250 252 0 230
Imports 1 1 1 1 0 1
Total Supply 227 227 251 253 0 231
Exports 190 190 210 211 0 180
Fresh Dom. Consumption 26 26 28 28 0 28
For Processing 11 11 13 14 0 23
Total Distribution 227 227 251 253 0 231
(HECTARES) ,(1000 TREES) ,(1000 MT)

Page 19
Lemons/ Limes, Fresh
Production
The production of lemons/limes is forecast to increase by six percent to 420,000 MT in the 2017/18 MY,
from 397,000 MT in the 2016/17 MY. This is due to the normal weather conditions and increase in area
planted and yields in the main production areas of Eastern Cape and Limpopo, which account for about
eighty percent of the production. These increases are forecast to be partially offset by the lower
production in the drought stricken production areas in the Western Cape, which produces about ten
percent of the total lemons/ limes.
Figure 7 shows that the area planted with lemons/limes was initially flat from the 2006/07 MY to the
2009/10 MY. However, the area planted increased gradually from 4,667 hectares in the 2010/11 MY, to
11,500 hectares in the 2017/18 MY, in response to increases in demand and higher prices in the export
market.
Figure 7: Area Planted to Lemons/ Lime
*Estimate, ** Forecast.
Source: CGA
Consumption
The domestic consumption of lemons is forecast to increase by six percent to 18,000 MT in the 2017/18
MY, from 17,000 MT in the 2016/17 MY, based on the available production. Lemon juice is used as
flavoring for poultry and fish dishes, and a flavor agent in cakes, tarts, biscuits, candies, ice creams and
salad dressings. In the beverage industry lemons/limes are used to make lemonade, smoothies and

Page 20
liquors. In the cleaning industry, lemon juice is used as a degreaser and disinfectant, due to its high
concentration of citric acid which can inhibit the proliferation of some molds and bacteria.
Exports
The exports of lemons and limes is forecast to increase by three percent to 310,000 MT in the 2017/18
MY, from 300,000 MT in the 2016/17 MY, based on the increase in production. The increase in
lemons/limes exports is also due to strong demand and growth in the Asian and Middle East market.
Table 16: South African Fresh Lemons/Limes Exports
South Africa Export Statistics
Commodity: 080550, Lemons And Limes, Fresh Or Dried
Year Ending: December
Partner Country Unit Quantity
2014 2015 2016 2017*
World T 219,617 246,291 237,129 298,513
United Arab Emirates T 40,183 48,773 49,116 52,497
Netherlands T 22,311 23,582 34,205 33,986
Saudi Arabia T 19,807 25,812 28,952 31,925
Russia T 30,679 31,435 18,019 30,548
Hong Kong T 31,077 20,474 15,397 26,039
United Kingdom T 12,585 16,174 20,428 22,702
Kuwait T 7,337 12,465 14,540 18,909
Canada T 9,523 10,636 9,224 12,454
Italy T 5,589 5,168 8,656 10,455
Malaysia T 6,575 7,006 6,857 8,382
Vietnam T 1,535 4,000 2,944 6,209
Portugal T 829 1,572 3,308 5,880
Singapore T 3,964 7,699 3,826 4,053
Bahrain T 2,026 2,920 2,993 3,463
Qatar T 2,098 3,218 1,768 3,449
Iraq T 0 0 0 2,599
Oman T 576 548 608 2,345
France T 540 690 771 2,183
Germany T 5,776 7,310 2,975 2,104
Greece T 1,146 1,206 1,135 1,639
*Exports up to October 2017.
Source: GTA
Imports
Page 21
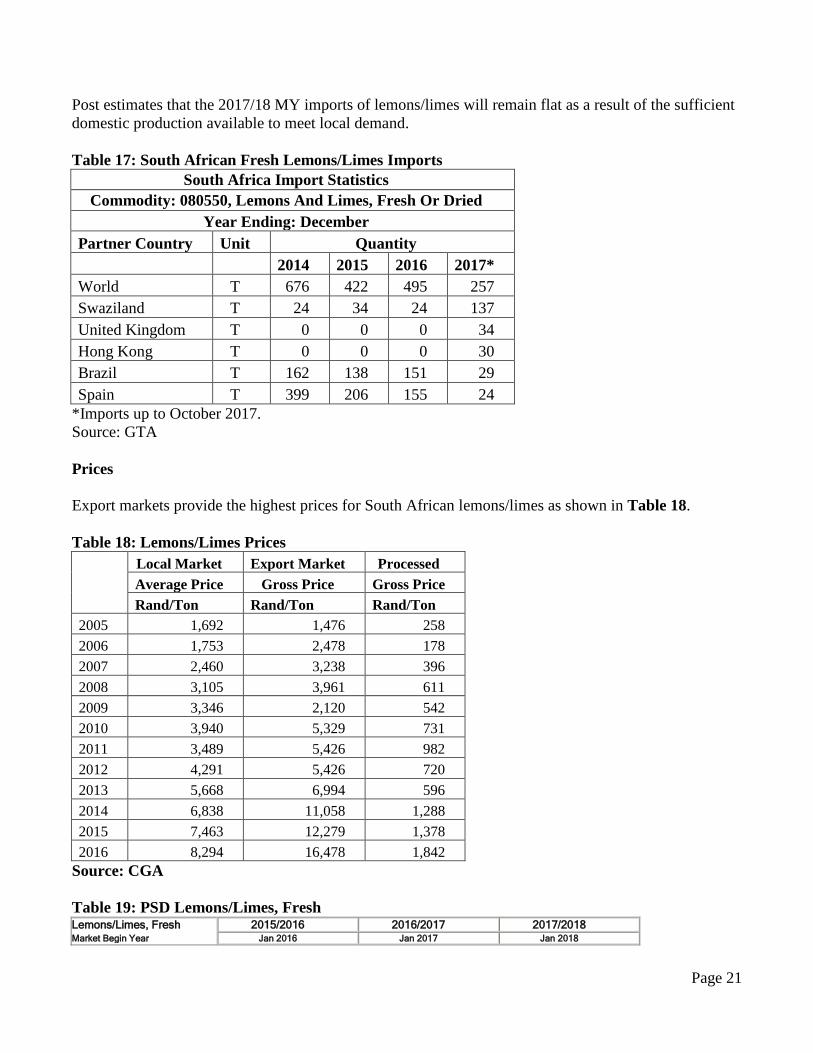
Post estimates that the 2017/18 MY imports of lemons/limes will remain flat as a result of the sufficient
domestic production available to meet local demand.
Table 17: South African Fresh Lemons/Limes Imports
South Africa Import Statistics
Commodity: 080550, Lemons And Limes, Fresh Or Dried
Year Ending: December
Partner Country Unit Quantity
2014 2015 2016 2017*
World T 676 422 495 257
Swaziland T 24 34 24 137
United Kingdom T 0 0 0 34
Hong Kong T 0 0 0 30
Brazil T 162 138 151 29
Spain T 399 206 155 24
*Imports up to October 2017.
Source: GTA
Prices
Export markets provide the highest prices for South African lemons/limes as shown in Table 18.
Table 18: Lemons/Limes Prices
Local Market Export Market Processed
Average Price Gross Price Gross Price
Rand/Ton Rand/Ton Rand/Ton
2005 1,692 1,476 258
2006 1,753 2,478 178
2007 2,460 3,238 396
2008 3,105 3,961 611
2009 3,346 2,120 542
2010 3,940 5,329 731
2011 3,489 5,426 982
2012 4,291 5,426 720
2013 5,668 6,994 596
2014 6,838 11,058 1,288
2015 7,463 12,279 1,378
2016 8,294 16,478 1,842
Source: CGA
Table 19: PSD Lemons/Limes, Fresh Lemons/Limes, Fresh 2015/2016 2016/2017 2017/2018 Market Begin Year Jan 2016 Jan 2017 Jan 2018

Page 22
South Africa USDA Official New Post USDA Official New Post USDA Official New Post
Area Planted 9485 9485 10000 11000 0 11500
Area Harvested 7967 7967 8300 8900 0 9200
Bearing Trees 5700 5700 6000 6200 0 6300
Non-Bearing Trees 2000 2000 2050 2000 0 2100
Total No. Of Trees 7700 7700 8050 8200 0 8400
Production 308 308 355 397 0 420
Imports 1 1 1 1 0 1
Total Supply 309 309 356 398 0 421
Exports 237 237 270 300 0 310
Fresh Dom. Consumption 16 16 17 17 0 18
For Processing 56 56 69 81 0 93
Total Distribution 309 309 356 398 0 421
(HECTARES) ,(1000 TREES) ,(1000 MT)

Page 23
Orange Juice
Production
The production of orange juice is forecast to increase by eighteen percent to 26,000 MT in the 2017/18
MY, from 22,000 MT in the 2016/17 MY. This is due to the increase in the quantity of fresh oranges
delivered for processing and the higher juice extraction achieved as a result of the better quality of
oranges.
Industry coordinated statistics for orange juice are largely unavailable in South Africa. The production,
consumption and stock levels represent Posts` forecast of the South African orange juice supply and
distribution statistics is based on information extracted from various sources, contacts and calculations
of extractions from fresh oranges delivered for processing.
Consumption
The domestic consumption of orange juice is forecast to increase by three percent to 6,400 MT in the
2017/18 MY, from 6,200 MT in the 2016/17 MY, based on the increase in production and supply
availability. The relatively high food price inflation has resulted in restricted growth in the domestic
consumption of fresh fruit juices especially the one hundred percent fruit juice, and the shift in demand
to orange juice concentrates.
Export
Post forecast that the 2017/18 MY exports of orange juice will increase by about six percent to 25,500
MT, from 24,000 MT in the 2016/17 MY, based on the available supply and increase in production. The
2016/17 MY exports of orange juice were revised upwards to 24,000 MT, based on the higher than
expected year to date exports up to October 2017. Post adjusted the orange juice export data to the
equivalent of 65 Degrees Brix based on the respective conversion factors shown on the export tables
below.
Producers in South Africa prefer to export fresh oranges rather than to sell to processors as export prices
are eight times higher than prices achieved from processors. Netherlands, Botswana, Mozambique,
Mauritius, Zambia and Zimbabwe are the biggest markets for South African orange juice exports.
Table 20: South African Orange Juice Exports – HS200919

Page 24
South Africa Export Statistics
Commodity: 200919, Orange Juice, Other Than Frozen, Whether Or Not Sweetened
Year Ending: December
Partner Country Unit
Quantity
2014 2015 2016 2017*
World T 30,500 37,516 30,666 19,395
Botswana T 5,633 7,065 7,227 5,466
Namibia T 1,939 3,210 4,937 3,728
Swaziland T 2,554 3,229 3,463 2,452
Zimbabwe T 3,408 3,516 1,920 1,924
Zambia T 1,312 1,370 1,014 983
Lesotho T 1,812 2,512 1,893 922
Mozambique T 1,974 2,893 1,316 719
Ethiopia T 68 1,061 789 522
Netherlands T 7,815 7,450 3,556 318
Malawi T 62 91 290 244
Angola T 272 177 84 186
Italy T 330 507 533 171
Congo Dem. Rep. T 17 77 181 124
*Exports up to October 2017.
Source: GTA and Post adjustments to 65 Degrees Brix (Conversion Factor 1.02).
Table 21: South African Orange Juice Exports – HS200911
South Africa Export Statistics
Commodity: 200911, Orange Juice, Frozen, Whether Or Not Sweetened
Year Ending: December
Partner Country Unit
Quantity
2014 2015 2016 2017*
World T 7,176 6,242 3,766 2,577
Netherlands T 4,646 4,669 2,361 2,150
Botswana T 382 373 553 166
Hong Kong T 0 0 0 78
United Kingdom T 0 31 60 70
Spain T 580 89 68 29
Mozambique T 56 224 47 23
Namibia T 21 11 22 21
Mauritius T 63 38 0 16
*Exports up to October 2017.
Source: GTA and Post adjustments to 65 Degrees Brix (Conversion Factor 1.00).
Table 22: South African Orange Juice Exports – HS200912
South Africa Export Statistics

Page 25
Commodity: 200912, Orange Juice, Not Frozen, Of A Brix Value Not Exceeding 20
Year Ending: December
Partner Country Unit Quantity
2014 2015 2016 2017*
World T 1,336 1,662 310 420
Philippines T 55 55 8 51
Mozambique T 366 214 85 45
Botswana T 27 4 43 26
Mauritius T 60 760 20 25
United Arab Emirates T 61 57 9 24
Taiwan T 10 0 16 23
Angola T 65 19 5 20
Madagascar T 42 36 9 16
Congo T 114 141 0 15
Ghana T 18 18 1 13
Ethiopia T 2 4 9 12
Tanzania T 40 28 3 11
Reunion T 38 28 1 10
*Exports up to October 2017.
Source: GTA and Post adjustments to 65 Degrees Brix (Conversion Factor 0.18).
Imports
The imports of orange juice is forecast to increase significantly to 5,000 MT in the 2017/18 MY, from
2,700 MT in the 2016/17 MY, based on the anticipated low orange juice supply in South Africa
following the previous two seasons’ low orange production. Zimbabwe, Brazil and Spain are the main
suppliers of orange juice to South Africa. Post also adjusted the orange juice import data to the
equivalent of 65 Degrees Brix based on the respective conversion factors shown on the import tables
below.
Table 23: South African Orange Juice Imports – HS200919
South Africa Import Statistics
Commodity: 200919, Orange Juice, Other Than Frozen, Whether Or Not Sweetened

Page 26
Year Ending: December
Partner Country Unit
Quantity
2014 2015 2016 2017*
World T 179 1,313 1,043 1,641
Zimbabwe T 18 706 692 698
Brazil T 0 0 232 439
Spain T 0 0 0 408
Pakistan T 0 28 5 20
Botswana T 0 0 4 19
*Imports up to October 2017.
Source: GTA and Post adjustments to 65 Degrees Brix (Conversion Factor 1.02).
Table 24: South African Orange Juice Imports – HS200911
South Africa Import Statistics
Commodity: 200911, Orange Juice, Frozen, Whether Or Not Sweetened
Year Ending: December
Partner Country Unit
Quantity
2014 2015 2016 2017*
World T 0 1 51 514
Argentina T 0 0 0 422
Brazil T 0 0 51 73
Israel T 0 0 0 19
*Imports up to October 2017.
Source: GTA and Post adjustments to 65 Degrees Brix (Conversion Factor 1.00).
Table 25: South African Orange Juice Imports – HS200912
South Africa Export Statistics
Commodity: 200912, Orange Juice, Not Frozen, Of A Brix Value Not Exceeding 20
Year Ending: December
Partner Country Unit Quantity
2014 2015 2016 2017*
World T 0 0 5 11
Other Countries T 0 0 0 11
Zimbabwe T 0 0 5 0
*Imports up to October 2017.
Source: GTA and Post adjustments to 65 Degrees Brix (Conversion Factor 0.18).
Table 26: PSD Orange Juice Orange Juice 2015/2016 2016/2017 2017/2018 Market Begin Year Apr 2016 Apr 2017 Apr 2018
South Africa USDA Official New Post USDA Official New Post USDA Official New Post
Deliv. To Processors 142000 142000 167000 161000 0 185000

Page 27
Beginning Stocks 29003 29003 8679 8679 0 3179
Production 19317 19317 22717 22000 0 26000
Imports 1101 1101 4000 2700 0 5000
Total Supply 49421 49421 35396 33379 0 34179
Exports 34742 34742 22000 24000 0 25500
Domestic Consumption 6000 6000 6200 6200 0 6400
Ending Stocks 8679 8679 7196 3179 0 2279
Total Distribution 49421 49421 35396 33379 0 34179
(MT)

Page 28
Policy Issues:
United States Cold-sterilization Protocol
The Western Cape Province is the major growing region which exports to the United States under the
cold treatment schedule to address False Codling Moth (FCM). The United States Animal Plant Health
Inspection Service (APHIS) has reduced the cold treatment schedule from 24 to 22 days, which has been
hugely beneficial to South Africa in preventing losses estimated to be between six and fifteen percent
due to cold damage and reduction in shipping costs. Exports to the United States are through the ports of
Newark, Philadelphia, Houston and New Orleans.
South African Citrus Exports from Citrus Black Spot (CBS) Areas to the United States
Currently, South Africa can only export citrus to the United States from official CBS free areas. The
CBS free areas are found in the Western Cape and Northern Cape regions, including the magisterial
districts of Hartswater and Warrenton, as well as relevant districts of the Free State and North West. On
August, 28, 2014, the United States APHIS, issued a notice proposing to amend the fruits and vegetables
regulations to allow the importation of several varieties of fresh citrus fruit, as well as Citrus hybrids,
into the United States from areas in the Republic of South Africa where citrus black spot has been
known to occur. This proposal can be found on the following link;
http://www.regulations.gov/#!documentDetail;D=APHIS-2014-0015-0001. The deadline for submitting
comments closed on October, 27, 2014. The final regulation is still to be finalized.
Citrus Black Spot Challenges in the European Union Market
As reported in the June 2015 GAIN report, (Click here to read the report.) South Africa still faces
challenges in the European Union (EU) Market as a result of the stringent CBS requirements. In October
2017, South Africa voluntarily suspended citrus exports to the EU, as a precaution and risk mitigation
measure to prevent the banning of citrus exports to the EU. The citrus industry has in the past suspended
citrus exports to the EU to avoid any further detections of CBS which could threaten market access.
While South Africa has put in place measures to comply with the EU requirements, the industry still
believes that the EU measures are intentional trade barriers as other countries such as Argentina and
Uruguay have higher CBS interceptions than South Africa. Industry contacts have complained that the
costs to comply with the current EU requirements are too high and there are capacity constraints
especially from government. In the interim, it is reported that South Africa has also been addressing this
challenge by avoiding problematic ports with high interceptions and also by not exporting directly to
Spain. Industry estimates that the cost of complying with the EU CBS requirements is around R1 Billion
(US$77 Million) and may not be sustainable in the long run.
Custom Duties

Page 29
Table 27 indicates the applicable custom duties when exporting citrus to South Africa
Table 27: Custom Duties Applicable to Exports to South Africa
HS Code Article description Unit Rate of Duty
General EU EFTA SADC MERCOSUR
08.05 Citrus fruit, fresh or dried:
0805.10 Oranges
0805.10.10 Fresh kg 4% free 4% free 4%
0805.10.90 Other kg 4% free 4% free 4%
0805.2 Mandarins (including tangerines and satsumas); clementines, wilkings and similar citrus
hybrids:
0805.21 Mandarins (including tangerines and satsumas)
0805.21.10 Fresh kg 4% free 4% free 4%
0805.21.90 Other kg 4% free 4% free 4%
0805.22 Clementines:
0805.22.10 Fresh kg 4% free 4% free 4%
0805.22.90 Other kg 4% free 4% free 4%
0805.29 Other:
0805.29.10 Fresh kg 4% free 4% free 4%
0805.29.90 Other kg 4% free 4% free 4%
0805.40 Grapefruit, including pomelos:
0805.40.10 Fresh kg 4% free 4% free 4%
0805.40.90 Other kg 4% free 4% free 4%
0805.50 Lemons (CitrusLimon, Citrus Limonium) and limes (Citrus aurantifolia, Citrus latifolia):
0805.50.10 Fresh kg 4% free 4% free 4%
0805.50.90 Other kg 4% free 4% free 4%
0805.90 Other:
0805.90.10 Fresh kg 4% free 4% free 4%
0805.90.90 Other kg 4% free 4% free 4%
2009.1 Orange juice
2009.11 Frozen kg 25% free 25% free 25%
2009.12 Not frozen, of Brix
value not exceeding 20 kg 25% free 25% free 25%
2009.19 Other kg 25% free 25% free 25%
Source: South African Revenue Services (SARS)
South African Import Regulation

Page 30
The following links provide useful resources and regulations pertaining to importing fruit into South
Africa:
Procedures to be followed when Exporting Fresh Citrus to South Africa.
http://www.nda.agric.za/doaDev/sideMenu/plantHealth/docs/importProcedure.pdf.
Maximum Residue Limits
http://www.nda.agric.za/doaDev/sideMenu/foodSafety/doc/South%20African%20Citrus%20MRLs%20
2013.pdf
Agriculture Product Standards Act No 119 of 1990
http://www.nda.agric.za/doaDev/sideMenu/Food%20Import%20&%20Export%20Standard/docs/Agric
%20Product%20Standards%20Act%20No%20119%20%20of%201990.pdf
Agricultural Pests Amendment Act, 9 of 1992
http://www.nda.agric.za/doaDev/sideMenu/APIS/doc/Agricultural%20Pests%20Act.pdf
Foodstuffs, Cosmetics and Disinfectants Act 54 of 1972
http://www.nda.agric.za/vetweb/Legislation/Other%20acts/Act%20-
%20Foodstuffs,%20Cosmetics%20and%20Disinfectants%20Act-54%20of%201972.pdf