Sources of the Problems—Industry Case Studies of …aciar.gov.au/files/node/594/pr85-part2.pdf ·...
67
81 Seeking agricultural produce free of pesticide residues edited by I.R. Kennedy, J.H. Skerritt, G.I. Johnson and E. Highley ACIAR Proceedings No. 85e (printed version published in 1998) Sources of the Problems—Industry Case Studies of Chemical Use and Residue Dissipation
Transcript of Sources of the Problems—Industry Case Studies of …aciar.gov.au/files/node/594/pr85-part2.pdf ·...

81Seeking agricultural produce free of pesticide residues
edited by I.R. Kennedy, J.H. Skerritt, G.I. Johnson and E. Highley ACIAR Proceedings No. 85e
(printed version published in 1998)
Sources of the Problems—Industry Case Studies of Chemical Use and Residue Dissipation
83Seeking agricultural produce free of pesticide residues
edited by I.R. Kennedy, J.H. Skerritt, G.I. Johnson and E. Highley ACIAR Proceedings No. 85e
(printed version published in 1998)
PHILIPPINE rice production has climbed steadily during the past five years, growing by an average of over 4% annually. In 1997, the country produced 11.4 Mt of rice and 4.5 Mt of maize. In spite of this, however, the Philippines remains in a deficit position, failing to meet growing local demand. Thus, 655 000 t of rice and 145 659 t of maize were also imported last year.
Unfortunately, the shortfall in production is made worse by the enormous postharvest losses. Insect infestation remains a major source of loss in storage. Based on a nationwide survey by Maranan et al. (1996), storage loss in rice which can be attributed mainly to pests is in the range 0.35–5.2% for a storage period of up to 151 days. On the other hand, losses in maize range from 2.8 to 3.3% over 17 days of storage. Other grains such as mungbean and soybean also suf-fer from the ravages of pests, which cause similar if not greater levels of loss. This situation necessitates the use of pesticides and attendant concerns about their effect on health and the environment.
The Grain Trade and Storage Practices
Farmers usually dispose of their entire grain produc-tion immediately after harvest. There are one to two
cropping seasons a year in rainfed areas but irrigated farms manage two or more sales annually. The grain is sold to local merchants, agents of rice and maize millers, central warehouses, or the NFA (National Food Authority), a government agency that provides a ready market for the farmers’ produce and main-tains security reserve stocks for the country. It absorbs about 1–3% of the rice produced and less than 1% of maize and owns the biggest national net-work of warehouses and mills. A significant portion of its maize inventory is imported.
The main bulk of the farmers’ produce is procured by the private merchants. Grain traders and proces-sors are situated in major trading centres in the urban and rural areas.
Storage practices in the country have changed little over the last decade. About 80–90% of the harvested produce is stored in rural areas, with the rest in urban warehouse facilities (Picar 1986). There are three lev-els of storage namely: farm, commercial/cooperative, and government level.
Farm-level storage
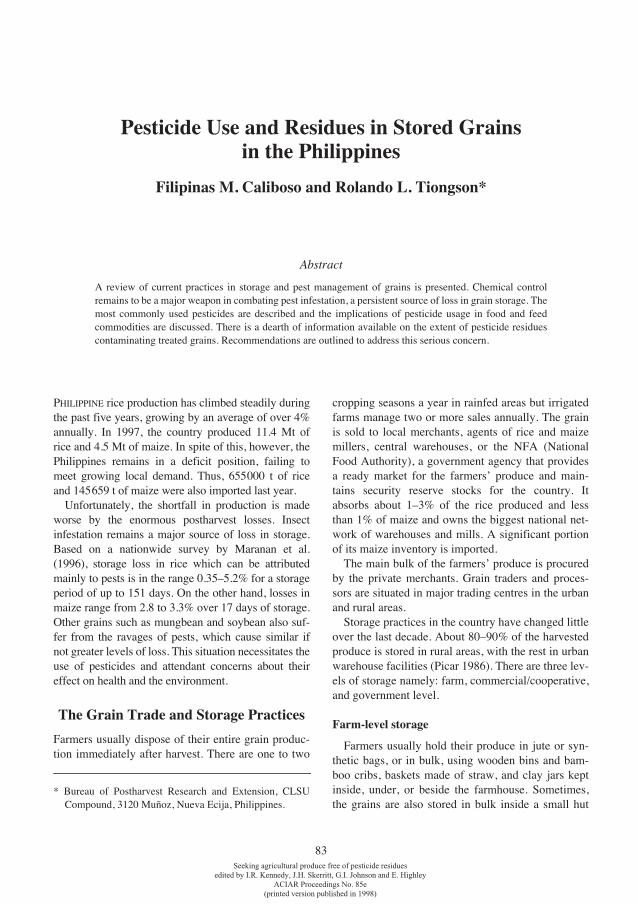
Farmers usually hold their produce in jute or syn-thetic bags, or in bulk, using wooden bins and bam-boo cribs, baskets made of straw, and clay jars kept inside, under, or beside the farmhouse. Sometimes, the grains are also stored in bulk inside a small hut
Pesticide Use and Residues in Stored Grainsin the Philippines
Filipinas M. Caliboso and Rolando L. Tiongson*
* Bureau of Postharvest Research and Extension, CLSU Compound, 3120 Muñoz, Nueva Ecija, Philippines.
Abstract
A review of current practices in storage and pest management of grains is presented. Chemical control remains to be a major weapon in combating pest infestation, a persistent source of loss in grain storage. The most commonly used pesticides are described and the implications of pesticide usage in food and feed commodities are discussed. There is a dearth of information available on the extent of pesticide residues contaminating treated grains. Recommendations are outlined to address this serious concern.

84Seeking agricultural produce free of pesticide residues
edited by I.R. Kennedy, J.H. Skerritt, G.I. Johnson and E. Highley ACIAR Proceedings No. 85e
(printed version published in 1998)
raised above the ground and made of indigenous materials such as bamboo or tree bark. Typically, the storage capacities are small (3–100 bags of 50 kg each). Almost all of the produce is sold within a week after harvest; the remaining few bags, which are for household consumption, are kept for about 3 months, or until the next harvest. The level of hygiene and sanitation in these structures is low, minimal inspec-tion is carried out, and sound storage management principles are absent. Most of these traditional struc-tures are usually not rodent-proof or gastight, but they are well-ventilated (Caliboso and Acda 1992).
Grains intended for seed also form the bulk of grains stored by the farmers. Legume seeds are stored for 4–9 months (Tiongson et al. 1997) in sacks or in large metal cans or in covered plastic containers. Farmers need to resort to long storage to make sure they have seed for the next cropping season. The absence of commercial seed producers, particularly for peanuts, mungbeans, and soybeans, is a serious problem confronting farmers. Peanut growers find it difficult to maintain the viability of seed during long storage. Peanut farmers are therefore obliged to plant a second crop during the rainy season primarily for seed production. Legumes for human consumption are held for 1–3 months days. Most farmers store about 1–4 bags of unshelled peanuts for seed and 1–10 bags of mungbeans for seed.
Commercial/cooperative-level storage
Rural traders and processors store bagged com-modities in poorly-ventilated warehouses made of concrete or galvanised-iron sheets with wooden or iron frames. A concrete drying pavement is usually built next to the building. Ricemills seldom stock more than a few weeks supply of milled rice; com-monly, paddy and maize are stored for from a few days to 3 months (Gonzales 1986; Paz et al. 1991). However, due to the shift in government policy wherein the private sector must equally share the mandatory provision of a 90-day buffer stock, storage periods have gradually lengthened in private mills. Capacities of storage structures in local traders and farmer-cooperatives range from 200 to 24 000 bags of 50 kg each, while wholesalers and processors have huge capacities of 100 000 bags or more. Tiongson et al. (1997) reported that while the turnover of legumes is generally rapid, there are instances when these crops are stored for longer. For mungbean and soy-bean, the storage period noted was 1–2 months, while peanuts were kept for 1–8 months.
Most of the yellow maize produced and imported goes into the warehouses and silos of feed manufac-turers, while white maize is bagged and stored in warehouses. It is milled to corngrits for human con-sumption and also processed into other food products such as baby food, snack items (corn chips, etc.), corn oil, and cornstarch. Yellow maize comprises 50% of livestock feed. The feed millers stock several months supply.
Wheat is also imported, and is stored in concrete silos by flour mills for a few months before process-ing. Flour is frequently unloaded immediately after milling.
Government-level storage
Storage structures owned and maintained by the government have steel frames, concrete floors and corrugated iron walls and roofs. Because of its man-date, the NFA holds grains in storage for extended periods. This averages from 3 months to 1 year but may extend to 3 years. Prolonged storage exposes the grain to an extremely high risk of damage due to pest attack. Warehouse capacity is generally huge ranging from 100 000 to 200 000 bags, of 50 kg each.
Pest Control Practices
Grains stored on-farm, although exposed to insect infestation, seldom receive any kind of protective treatment. This can be attributed to the rapid disposal of the stocks and also an inadequate understanding and appreciation of the pest problem. Some farmers employ indigenous materials for insect control, such as ash, wood shavings, and plants that have a repel-lent effect on insects. In legumes, other natural meth-ods include mechanical agitation, stepping on the pods, and repeated washing and drying. A few farm-ers soak their sacks in insecticides (Tiongson et al. 1997). Unavailability of the appropriate pesticides and the cost involved in pesticide application are major constraints to pesticide use at farm level. When farmers apply pesticides to grain, it is usually for the protection of seed material. Some farmers admix car-baryl or malathion with mungbean seeds to control bruchids, using an improvised inclined sieve. Others use whatever insecticides are left after the crop is har-vested. Often these are insecticides that are not regis-tered for use in stored grains. Although directly treated grains are intended to be sold as seed materi-als, whatever quantity is left after marketing is also
85Seeking agricultural produce free of pesticide residues
edited by I.R. Kennedy, J.H. Skerritt, G.I. Johnson and E. Highley ACIAR Proceedings No. 85e
(printed version published in 1998)
sold later for food. This leaves the consumer open to the twin risk of exposure to highly toxic chemicals and excessive residues, and emphasises the need to educate the farmers on the selection of appropriate insecticides.
To equip farmers with advanced technologies, the government through the Gintong Ani (‘Golden Har-vest’) Program implemented by the Department of Agriculture and with the postharvest component undertaken by the Bureau of Postharvest Research and Extension (BPRE), distributed Volcani cubes to 150 farmer cooperatives throughout the country. The program is designed to intensify rice and maize pro-duction and covers activities from growing to market-ing. The cube makes use of the hermetic storage principle and is made of tailored PVC, 0.8 mm thick. The technology resulted from a collaboration between BPRE and the Agricultural Research Orga-nization (ARO) of Israel with funding support from the United States Agency for International Develop-ment (USAID)-Cooperative Development Research (CDR) Project . It is also planned to introduce the sealed plastic technology for outdoor storage devel-oped jointly by the BPRE and CSIRO (Common-wealth Scientific and Industrial Research Organisation) of Australia with funding assistance from ACIAR.
Rice millers generally do not pay much attention to pest abatement owing to the fast turn-over of their rice stocks. On the other hand, some wholesalers who handle huge inventories, particularly of maize, employ a pest control technician (in-house) or secure the services of a commercial pest exterminator. Warehouse spraying and fumigation is resorted to in case of infestations.
Food processors, feed millers, and flour millers who have to maintain high quality food and feeds for considerable periods also apply pest control treat-ments by contracting commercial pest control appli-cators or by employing in-house pest control technicians to fumigate or apply residual sprays. Aside from yellow maize, warehouses of feed millers contain a variety of feed ingredients such as bran, fishmeal, and soybean meal which are highly suscep-tible to pest damage. In addition, these warehouses are seldom emptied, leaving pockets of residual infestation in hard-to-reach places. Warehouse fumi-gation is frequently resorted to under this situation.
The warehouse is made airtight by covering all holes and gaps with polyethylene plastic strips pasted to the surface using packaging or masking tapes. The
windows and doors are closed and then sealed using the same material. Obviously, this manner of sealing does not conform with the minimum requirement for gastightness; gas leakage is likely to be high, expos-ing people and animals within the immediate vicinity to great danger, not to mention the likelihood of a fumigation failure. Because of its ease of application, phosphine is the most commonly used fumigant. Methyl bromide, on the other hand, is only applied when it is so specified, as in fumigation of grain con-signments in ships and barges. In food and feed mills, the entire warehouse and silo are kept under fumiga-tion for 72–96 hours, after which they are ventilated for another 24–48 hours. About 1.5–2 g/m3 of phos-phine in aluminium or magnesium phosphide formu-lation is applied. The walls, floors, and the outer layers of the bag stacks are sprayed with a layer of 1% malathion or pirimiphos-methyl, or 0.4% cyfluthrin applied at 1 L/20 m2. For stack fumigation, the same dosage of phosphine gas is applied. Stacks are covered with 0.2 mm thick plastic sheets, held to the floor by masking or packaging tape, or using sand snakes and/or chains. Fogging of the warehouse is also practiced, using 2% pirimiphos-methyl or 0.5% deltamethrin. Furthermore, rodent baiting is done using coumatetralyl, brodifacoum, or zinc phosphide.
The pest control system in government warehouses has remained basically the same, comprising of stack fumigation, residual spraying of warehouse fabric and bag stacks, and fogging. Similarly, the insecti-cides, dosages, and rates of application in current usage have not changed over the past decade (see Caliboso et al. 1986, Semple 1986). Malathion, per-methrin, fenithrothion, pirimiphos-methyl, and dichlorvos are applied for fabric treatment of walls and floors of the warehouse, while malathion and dichlorvos are used for fogging. NFA maintains its own pest control services unit which carry out regular monitoring and inspection of stocks and periodic application of pesticides. Recently, however, the Authority has adopted the controlled atmosphere storage technique for extended storage of milled rice developed jointly by CSIRO and BPRE under the auspices of ACIAR. Whole bag stacks are covered with tailored plastic envelopes glued together using chemical adhesives. Phosphine is released inside the stack at a rate of 1 g/m3. This is part of a strategy for maximising warehouse space by the long-term stor-age of milled rice rather than paddy and addressing temporal distribution requirements of the govern-ment.

86Seeking agricultural produce free of pesticide residues
edited by I.R. Kennedy, J.H. Skerritt, G.I. Johnson and E. Highley ACIAR Proceedings No. 85e
(printed version published in 1998)
NFA is a heavy user of pesticides. Based on its pesticide procurement of 1996, it consumed around 353 kg of active ingredient (a.i.) of insecticides and rodenticides and 180 kg a.i. of phosphine fumigants. The agency spent over US$200 000 on pesticides in 1996 alone.
Pesticide Residues
Monitoring of pesticide residues in raw grains is vested mainly in the Bureau of Plant Industry (BPI). Unfortunately, due to lack of facilities, equipment, and trained personnel, and the high cost involved in analysis, BPI cannot enforce regulatory standards. At present, the Bureau’s facilities have been strengthened to monitor pesticide contamination in fruits and vege-tables alone. For this reason, most of the information available in the literature is for perishables. Data on the extent of pesticide residues remaining in treated grains are restricted to the results of a few laboratory studies on degradation of insecticides applied directly to grains (Varca et al. 1988; Gragasin et al. 1993, 1994). Perhaps the most useful insight into residual contamination in grain commodities arising from sim-ulations of grain industry pesticide application prac-tices can be gained from the investigations of Sayaboc et al. (1992) and Tejada et al. (1992). Results of these studies indicate that residue levels in treated materials remain below the MRLs established by FAO. It is worth mentioning that residues in all imports of rice, wheat, and maize are checked by NFA and so far have never been found to exceed the safe limit.
Summary and Recommendation
In general, storage and pest control practices of the grains industry do not lead to serious pesticide con-tamination of the grain commodities. An exception, however, is in seed grain stocks which are often admixed with insecticides—these commodities may eventually find their way on the dinner table. Another concern is the direct grain treatment practiced by some feed millers, food processors, and flour millers. Information is not available on residues in maize and wheat from these processors. Regulatory agencies must be trained on residue analysis and must have access to relatively cheap and rapid methods of resi-due analysis to be able to check and monitor food safety. Twenty-three years ago, three major areas of concern were already identified by Magallona (1975)
in the monitoring of pesticide residues: (1) lack of trained personnel; (2) lack or inadequacy of equip-ment; and (3) high cost of equipment, supplies and reagents. These remain valid today.
References
Caliboso, F.M. and Acda, M.A. 1992. Pests of stored prod-ucts and their control in the Philippines. Biotrop Special Publication No. 45, 45–61.
Caliboso F.M., Sayaboc, P.D. and Amoranto, M.A. 1986. Pest problems and the use of pesticides in grain storage in the Philippines. In: Champ, B.R. and Highley, E., ed., 1986. Pesticides and humid tropical grain storage sys-tems: proceedings of an international seminar, Manila, 27–30 May 1985. Canberra, ACIAR Proceedings No. 14, 17–29.
Gonzales, J.C. 1986. Industry perspectives in pest control in the humid tropics. In: Champ, B.R., and Highley, E., ed., 1986. Pesticides and humid tropical grain storage sys-tems: proceedings of an international seminar, Manila, 27–30 May 1985. Canberra, ACIAR Proceedings No. 14, 121–123.
Gragasin, M.C.B., Gibe, A.J.G., Acda, M.A. and Sayaboc, P.D. 1993. Degradation of selected organophosphates and pyrethroids in maize during storage. In: Naewbanij, J.O. and Manilay, A.A., ed. 1993., Proceedings of the 14th ASEAN Technical Seminar on Grain Postharvest Technology, Manila, 5–8 November 1991. Bangkok, ASEAN Grains Postharvest Programme, 261–266.
Gragasin, M.C.B., Acda, M.A., Gibe, A.J.G. and Sayaboc, P.D. 1994. Residues of grain protectants on paddy. In: Highley, E., Wright, E.J., Banks, H.J. and Champ, B.R., ed., 1994. Proceedings of the 6th International Working Conference on Stored-product Protection, Canberra, 17–23 April 1994. Wallingford, U.K., CAB International, 782–784.
Magallona, E.D. 1975. Monitoring of residues due to agri-cultural pesticides in the Philippines. Paper presented at the FAO/UNEP expert consultation on impact monitoring of residues due to use of agricultural pesticides, Rome, 29 September–3 October 1975, 12 p.
Maranan, C.A., Paz, R.R., Cachuela, R.L., R.S. Rapusas and Sabio, G.C. 1996. National grain postharvest loss assess-ment project. Terminal report, National Postharvest Insti-tute for Research and Extension (NAPHIRE), Muñoz, Nueva Ecija, Philippines, 214 p.
Paz, R.R., Tiongson, R.L., Dayanghirang, D.D. and Rod-riguez, A.C. 1991. Control of aflatoxin in maize (Philip-pines), Phase 1. In: Naewbanij, J.O., ed., 1991. Grain postharvest research and development: priorities for the nineties. Proceedings of the 12th ASEAN Technical Seminar on Grain Postharvest Technology, Surabaya, Indonesia, 29–31 August 1989. Bangkok, ASEAN Grains Postharvest Programme, 89–109.

87Seeking agricultural produce free of pesticide residues
edited by I.R. Kennedy, J.H. Skerritt, G.I. Johnson and E. Highley ACIAR Proceedings No. 85e
(printed version published in 1998)
Picar, G.D. 1986. Integration of new pest control technolo-gies into the postharvest grain sector by developing coun-tries. Paper presented at the International Working Conference on Stored Product Protection, Israel, August 1986.
Sayaboc, P.D., Acda, M.A., Gibe, A.J.G., Gragasin, M.C.B. and Villanueva, R.R. 1992. Bag stack spraying and fumi-gation of milled rice. In: Naewbanij, J.O., ed., 13th ASEAN Technical Seminar on Grains Postharvest Tech-nology, 4–7 September 1990. Bangkok, ASEAN Grains Postharvest Programme, 445-456.
Semple, R.L. 1986. Problems relating to pest control and use of pesticides in grain storage. In: Champ, B.R. and Highley, E., ed., 1986. Pesticides and humid tropical grain storage systems: proceedings of an international seminar, Manila, 27–30 May 1985. Canberra, ACIAR Proceedings No. 14, 45–75.
Tejada, A.W., Calumpang, S.M.F. and Gambalan, N.B. 1992. Effect of processing on residues of chlorpyrifos in stored corn and rice. In: Naewbanij, J.O., ed., Proceed-ings of the 13th ASEAN Seminar on Grains Postharvest Technology, Brunei Darussalam, 4–7 September 1990. Bangkok, ASEAN Grains Postharvest Programme, 222–235.
Tiongson, R.L., Manaloto, A.R., dela Cruz, M.T. and Dava-los, E.Z. 1997. Survey of stored product pests associated with legumes. Terminal Report, Bureau of Postharvest Research and Extension (BPRE), Muñoz, Nueva Ecija, Philippines, 24 p.
Varca, L.M., Sanchez, T.E. and Magallona, E.D. 1988. Iso-topic tracer-aided studies on fenvalerate residues in stored rice. Philippine Agriculturist, 71, 381–386.

88Seeking agricultural produce free of pesticide residues
edited by I.R. Kennedy, J.H. Skerritt, G.I. Johnson and E. Highley ACIAR Proceedings No. 85e
(printed version published in 1998)
Integrated Monitoring and Dissipation Studies for Development of Best Practice Management
of Chemicals Used in Cotton Farming
I.R. Kennedy,* F. Sanchez-Bayo,* S.W.L. Kimber,* N. Ahmad,†H. Beasley,§ N. Lee,*§ S. Wang,* and S. Southan*
* Cooperative Research Centre for Sustainable Cotton Pro-duction, Department of Agricultural Chemistry and Soil Science, University of Sydney, New South Wales 2006, Australia.
† NSW Agriculture, Rydalmere, New South Wales 2116, Australia.
§ CSIRO Plant Industry, P.O. Box 7, North Ryde, New South Wales 1670, Australia.
Abstract
In recent years the Australian cotton industry has been the focus of significant research on pesticide management with a view to reducing its impact on the riverine systems and reducing the extent of contamination of agricultural produce such as beef. In this research, pesticides such as endosulfan, pyrethroids and benzoylphenylureas such as chlorfluazuron have been examined for aerial transport in drift, erosion of cotton fields in surface run-off and their rate of dissipation. The outcome sought from this research is the development of best practices for the cotton industry that will minimise the impact of the 30–40 different insecticides and herbicides used in production.
From an integrated program of on-field monitoring of the fate of endosulfan as a case study, the following conclusions can be made:• Apart from about 5% aerial drift at application, the dissipation of α- and β-endosulfan (half-lives 4–30
days) from cotton fields occurs mainly by volatilisation in the first 2–3 weeks after application, particularly of the α-isomer (70%); β-endosulfan was more strongly sorbed to plant and soil materials,
• Endosulfan residues on cotton plants, including the metabolic product endosulfan sulfate, is quickly metabolised, with a composite half-life of 3–4 days. In two weeks only 2–3 % of the amount applied in one spraying remains in the foliage. This contrasted strongly with the comparative persistence of chlorfluazuron, with 70% remaining after 47 days,
• Unfortunately, some persistence of endosulfan in the field occurs because of the formation of endosulfan sulfate—a toxic oxidation product—with a ‘half-life’ in soil of about 110 days. However, by the start of the new growing season only about 2% of the endosulfan applied (2.25 kg/ha) remained on field as endosulfan sulfate, so there is little or no long-term accumulation,
• Run-off waters contain 1–2% of the total endosulfan applied to cotton fields in the season, with major storms accounting for up to half of this amount,Based on this data set, field testing of new chemicals and farming best practices that help limit the future
impact of pesticides on produce and the environment can be recommended.

89Seeking agricultural produce free of pesticide residues
edited by I.R. Kennedy, J.H. Skerritt, G.I. Johnson and E. Highley ACIAR Proceedings No. 85e
(printed version published in 1998)
�� �
���
� �
�
����
��
��
��
�
�
�
�
�
�
�
�
��
��
�
�
�
�
��
��
��������
�
�����������������
��
End
osul
fan
(µg/
L)
0.16
0.14
0.12
0.10
0.08
0.06
0.04
0.02
0.00
15/0
8/93
14/0
9/93
14/1
0/93
13/1
1/93
13/1
2/93
12/0
1/94
11/0
2/94
13/0
3/94
12/0
4/94
12/0
5/94
11/0
6/94
Date
sulfatealphabeta
Figure 1. Endosulfan residues in river water; replotted from data collected by the Department of Land and Water Conservation, NSW, Australia obtained in the North-West Rivers Water Quality Program (Cooper 1996).
IN the development of farming practices to minimise the extent of contamination of produce and the envi-ronment with chemical pesticides, knowledge of the environmental fate of particular chemicals following application is essential. In this paper, the results of integrated monitoring studies for several pesticides in Australian cotton production systems, focusing on endosulfan will be described, illustrating possible outcomes and their role in decision making. This study was performed as part of a major research pro-gram (‘Minimising the impact of pesticides on the riverine environment using the cotton industry as a model’), funded by the Land and Water Resources Research and Development Corporation (LWR-RDC), the Cotton Research and Development Corpo-ration (CRDC) and the Murray–Darling Basin Commission (MDBC).
The monitoring of river systems used to provide irri-gation water for cotton growing has shown significant contamination of river water by endosulfan residues (Fig. 1). The maximum levels of contamination shown in the Figure 1 are related to the cotton growing season in summer, following several aerial applications of endosulfan on crops in the late November–January period in response to insect pressure.
The physicochemical characteristics of a particular chemical and its susceptibility to biodegradation will
determine whether it is transported to other sites and its degree of persistence in soil and water. Persistence and dissipation are commonly measured with refer-ence to the half-life the time necessary for half the amount of chemical applied to disappear from a site. Although simple in principle, the field half-life possi-bly results from several processes acting simulta-neously and may be difficult to estimate with accuracy. The same chemical applied under different weather or soil conditions, for instance, can have quite different half-lives. For this reason, half-life fig-ures are normally referred to particular environments, or given as a range and they should be used as an indicative guide only.
From time course data it is possible to calculate half-lives (Fig. 2) according to the following mathe-matical model:
dC/dt = kC
where C is concentration, t time and k a constant.For a first-order reaction, the rate constant for this
equation is k = ln(Co/Ct)/t and the half-life (t1/2) is calculated as
t1/2 = ln(0.5)/k = –0.693/k
The field half-life of a particular chemical is strongly determined by its physicochemical proper-

90Seeking agricultural produce free of pesticide residues
edited by I.R. Kennedy, J.H. Skerritt, G.I. Johnson and E. Highley ACIAR Proceedings No. 85e
(printed version published in 1998)
ties and can vary according to the medium: air, water, soil and organic matter. For example, endosulfan is stable at neutral pH but undergoes chemical break-down in water (hydrolysis) under alkaline conditions (Cotham and Bidleman 1989; Singh et al. 1991; Peterson and Batley 1993; Southan and Kennedy 1995), forming the less toxic product endosulfan diol.
Figure 2. Decay curves for chemicals in the environment. To compute the half-life, logarithmic plots are prepared and the half-life estimated from the resultant linear plot.
Experimental Plan
Full details of the experimental methods used in this study will be published elsewhere (Kennedy et al. 1997a, preliminary report). However, for the illustra-tive purposes of this paper, the following information on methods is supplied.
Description of field sites
Farms at Narrabri and Warren in the Namoi and Macquarie river valleys of New South Wales were chosen for the three consecutive years of this study.
In the first year (1993–94 season), field 21 (82 ha) at Auscott, Narrabri, was selected for study. In the sec-ond year, the 1994–95 season, because of severe drought in the Namoi valley, the study was continued in the Macquarie valley on the Auscott, Warren farm on field 4 (57 ha) near Nevertire. Comprehensive studies of irrigation run-off were also carried out for the Warren field site, including hydrological mea-surement of flows off the field. Soil pH values were measured in the range 7.5–8.2, with only minor varia-tions over the field. A similar range of values was found in the Narrabri soils.
Sampling design
In the first year, a stratified design of 90 regular blocks was chosen for field 21 at Auscott, Narrabri, for convenience of both sampling of soil and plant material, and to allow methodological analysis of sampling intensity and spatial-temporal variability in soil residues. To investigate the effect of furrow aspect on spatial distribution of pesticide, separate sets of samples were taken from the top, edge and bottom of the furrows. Following intensive baseline soil samples of the strata on field 21, sampling sched-ules were determined by the date of three endosulfan sprayings—December 13, 23 and January 4—and physical conditions on-field, as a result of irrigation or rainfall. In addition, two flumes were set for sam-pling of water during irrigation events.
Similarly, at the Warren field site, another strati-fied design of 18 blocks on field 4 was chosen for soil and foliage sampling, so as to statistically detect the spatial and temporal variability of residues in the field. Sediment samples from the tail drain were also taken throughout the season. Based on the experience of the previous year, sampling was more intensive immediately after the endosulfan sprayings. At some aerial sprayings, sampling was coordinated with inte-grated studies on volatilisation and aerial drift, in col-laboration with NSW Agriculture (V. Edge and N. Ahmad) and the University of Queensland (N. Woods and I. Craig). To estimate the amount of pesti-cide falling on both soil and canopy immediately after spraying, a set of filter paper strips on wooden slats and another set on aluminium plates 1 m above the canopy were placed in the field (Fig. 3). Plant cover of soil by the foliage of cotton plants was cal-culated using a shadow technique to measure hori-zontal cover near noon, also measuring the height and width of plants on 1 m long sections of 10 furrows.
00
25
25
50
50
75
75
100 125
Time (days)
B
A
A t1/2
A t1/2 = 13 days
B t1/2
B t1/2 = 65 days
100
Con
cent
ratio
n (C
)
�
�
�
�
��
��
�
�
�
�
�
�
�
�
�
�
�

91Seeking agricultural produce free of pesticide residues
edited by I.R. Kennedy, J.H. Skerritt, G.I. Johnson and E. Highley ACIAR Proceedings No. 85e
(printed version published in 1998)
Data collection
Soil sampling was done in accordance with the standard sampling protocols (Kennedy et al. 1995). This involved combining 6–10 cores (5 × 4.5 cm) from the top layer, which were crushed and thor-oughly mixed on a glass tray, the resulting sample representing a single stratum of the field. In the first year, 20 cores were used for each composite soil sam-ple but statistical analysis showed little improvement in the variance of averaged data from more than 6–10 soil cores in composite samples. A simple statistical test of the results showed that no significant differ-ences in the mean values and their variance could be obtained by using half that number of cores (Fig. 4). Subsequently, in the second year each soil sample was a composite of only six cores taken on a logarith-mic basis along a transect. However, no difference was observed between separate soil samples taken at close or wider separation within a block on a particu-lar field. Thus, in the final year of the study, compos-ite soil sample for analysis was made up of ten cores chosen at random throughout the field.
Foliage sampling also experienced some variations through the program. In the first year, leaves from a number of plants within the same stratum were col-lected in glass jars, with residue analysis conducted on a surface area basis (µg/cm2). In the second year,
foliage was sampled on each occasion as nine whole plants, thus allowing the calculation of a pesticide load per plant and a chemical balance for the whole field. As the season proceeded and the size of cotton plants increased, plants were separated for analysis into outer and inner leaves, stems and bolls. A similar procedure was followed in the third year, by taking whole plants within a 1 m section along a furrow from random points on the field.
To estimate initial deposition of endosulfan on soil, paper strips (placed on field during sprayings 2 and 3 at field 4) were removed from the wooden slats and plates within one hour of spraying. Each paper strip was transferred to a glass jar for storage in the deep-freeze and acetone was added to extract the pesticide for further analysis by immunoassay and gas chroma-tography. Volatilisation of endosulfan was measured by the application of carbon filters placed above the crop through which air was pumped at a measured rate (Ahmad and Edge 1996).
Water run-off samples were taken in 1 L amber glass bottles closed with teflon seals during irrigation or storm events. Information on the total run-off via the return drain exiting from fields through a ‘drop-box’ was obtained using stage height indicators recording on data loggers, and also by equipment installed by the NSW Department of Land and Water
Figure 3. Plates and slats used to verify chemical application and deposition rates on cotton fields. Filter papers were extracted with acetone, and endosulfan estimated by GLC and ELISA analyses.

92Seeking agricultural produce free of pesticide residues
edited by I.R. Kennedy, J.H. Skerritt, G.I. Johnson and E. Highley ACIAR Proceedings No. 85e
(printed version published in 1998)
Conservation (Tuite 1996). In the second year of the study, three storms produced sufficient discharge to take run-off samples, one being of very large volume of less than 1 in 25 years probability.
Analytical methods and quality assurance
As part of the research program, a validation of immunoassays (ELISAs) for soil and water samples using CSIRO immunoassay kits for endosulfan (Lee et al. 1995a,b, 1997) has been of particular impor-tance, since it has allowed the analysis of a much larger number of field samples than possible by GLC. The main advantages of the technique are its speed and the relatively low cost, each analysis being less than 10% of the cost by solvent extraction and gas chromatography. The compromise is a loss of speci-
ficity (all cyclodienes yield positives) and some loss of accuracy, with a total detection limit of 0.2 ppb in soil and a practical range of 0.2–50 ppb in water, without the possibility to distinguish between the three toxic forms of endosulfan.
A separate project on quality assurance has shown that the three main analytical centres involved in this research program produced gas–liquid chromatogra-phy (GLC) data following solvent extraction of water and soil samples within acceptable limits of quality assurance (Kennedy 1995). Analytical work by three different laboratories (the Biological and Chemical Research Institute at Rydalmere, the NSW Depart-ment of Water Resources at Arncliffe and Depart-ment of Natural Resources at Indooroopilly in Queensland) proved that confidence in the accuracy
Figure 4. Mean values (filled symbols) and standard deviations (hollow symbols) of analyses for α-endosulfan, β-endosulfan and endosulfan sulfate for repeated soil cores (6 January 1994—all blocks: B, D, F, H). Five cm cores were analysed separately and the results calculated for 1 to n samples selected at random.
�
�
�
�
�
�
� �
� �� � � � � � � � � � � � �
�
� � � � � � � � � � � � � � � ��
� � � � �� � � � � � � �
� � � �
�
� � � � � � � � � � �
�
�
��������������
�
��
� � � �
��
�
�
� � � � � � � � � � � � � � � �
�
500400300200100
0
150
100
50
0
150
100
50
0
150
100
50
0
–2 0 2 4 6 8 10 12 14 16 18 20
Number of samples
(6 January 1994 – all blocks: B,D,F,H)
End
osul
fan
(g/h
a)TotalS.D.
SulfateS.D.
BetaS.D.
AlphaS.D.

93Seeking agricultural produce free of pesticide residues
edited by I.R. Kennedy, J.H. Skerritt, G.I. Johnson and E. Highley ACIAR Proceedings No. 85e
(printed version published in 1998)
of the analytical results obtained during this program was justified.
Analytical methods and quality assurance
Agreement between results obtained by gas chro-matography and immunoassay for soil and run-off water (see Fig. 5) was excellent (r2 = 0.9), but at least 10 g of well-mixed soil was required for reliable anal-yses using methanol extraction. However, immunoas-say sometimes gave greater values for residues in run-off samples than analysis by GLC. This may indicate real differences at the time of analysis, since immunoassays are conducted soon after being col-lected, before inevitable losses occur by volatilisation or hydrolysis of the α- and β-isomers during trans-portation (processes with half-lives of only 1–2 days at ambient temperature of 25°C and pH 8.5).
Figure 5. Comparison of endosulfan analyses in run-off water by solvent extraction and gas-liquid chromatography (GLC) or by immunoassay (ELISA) (Lee et al. 1997). Analyses shown are for the sum of both isomers and endosulfan sulfate.
Agreement between the two methods is much bet-ter when the more stable endosulfan sulfate is the main residue in run-off several weeks after spraying. It was also found preferable to freeze water samples for immunoassay, or to add acetate buffer (pH 5.5), if analysis could not be conducted immediately.
Data was studied using relevant statistical proce-dures. They helped improve the precision in calculat-
ing pesticide loads in run-off using the Cotton Farm Simulation Model developed by John Tuite (1996). Also, extensive validation using the GLEAMS mod-elling program was performed in collaboration with Robin Connolly (Queensland Department Natural Resources, Toowoomba) on predictions made of risk factors concerning impacts on the riverine environ-ment.
Results and Discussion
Dissipation of pesticides in cotton production systems using endosulfan as a model
Although pesticides may be transported away from the site of application, as indicated earlier, degradation takes place in situ, by chemical, biolog-ical or photodegradative processes. The time course for dissipation of endosulfan in cotton fields at the Warren field site is shown in Figure 6 (foliage) and Figure 7 (soil). These profiles indicate multiple applications and the subsequent transport processes such as volatilisation, run-off in surface water from soil as well as degradation on leaves and in soil in situ. However, most of the dissipation observed in the first few days has been shown in this study to be by the physical process of volatilisation rather than degradation.
The patterns for foliage and soil are similar, although soil can be seen to stabilise β-endosulfan and endosulfan sulfate so that these compounds per-sist there much longer. Unlike previous organochlo-rines such as DDT, endosulfan dissipates rapidly, with the formation of endosulfan sulfate as a major degradation product. Unfortunately, endosulfan sul-fate is also toxic to fish and some other biota.
Dissipation patterns
Baseline data from soil taken from the field sites showed a low endosulfan concentration at the start of the study: the concentration observed before spray-ing on field 21 was less than 0.08 mg/kg (equivalent to 60 g/ha), occurring mostly in the sulfate form (0.06 mg/kg, ppm). Three sprayings with endosulfan raised the maximum total residue concentration recovered in soil to 0.7 mg/kg (or 530 g/ha). In the first month following the final application, this value fell rapidly, mainly because of the disappearance of the α-isomer by volatilisation. A more stable period followed for about two months with complete disappearance of α-endosulfan, some retention of the β-isomer in soil
��
��
��
� � � � � ��
�
�� �
� ��
����
�
���
� ��
��
�
�
�
�
��
��
100
80
60
40
20
0
End
osul
fan
by E
LIS
A (
µg/
L)
Endosulfan by GLC (µg/L)
0 20 40 60 80 100

94Seeking agricultural produce free of pesticide residues
edited by I.R. Kennedy, J.H. Skerritt, G.I. Johnson and E. Highley ACIAR Proceedings No. 85e
(printed version published in 1998)
Figure 6. Rapid decline of endosulfan residues in cotton foliage at Warren, NSW, Australia in 1994–95. Even endosulfan sulfate, a metabolic product of endosulfan, particularly the α-isomer, is degraded rapidly.
�
�
�
�
�
��
��
��
��
�
��
��
���
��
�
�
�
�
���
��
�����
�
��
�
�
� �
�
� �
����
���
End
osul
fan
(µg/
cm2 )
6
4
2
00 10 20 30 40 50
Days since 2nd spraying (21/12/94)
Endosulfan sulfateβ–endosulfanα–endosulfan
3rd spraying7/1/95
2nd spraying21/12/94
Figure 7. Dissipation of endosulfan from soil on a cotton field at Warren, NSW, Australia in 1995–96. Endosulfan sulfate, probably mainly formed by fungi in soil, is the most persistent residue.
�
��
�
�
���
�
��
��
�
�
�
�
��
�
���
�
�
��
�
�
�
�
��
��
�
�
�
��
�
�
��
�
End
osul
fan
in s
oil (
g/ha
)
800
600
200
400
0
1Dec 31Dec 30Jan 29Feb 30Mar 29Apr 29May
Date
SulfateBetaAlpha
2nd spraying18/12/95
1st spraying6/12/95
3rd spraying27/12/95

95Seeking agricultural produce free of pesticide residues
edited by I.R. Kennedy, J.H. Skerritt, G.I. Johnson and E. Highley ACIAR Proceedings No. 85e
(printed version published in 1998)
and an increasing amount of the sulfate form. Eight months later, residues had fallen steadily to reach the same concentration as in the year before. This result indicates there was no build up of endosulfan resi-dues in these alkaline grey-cracking soils (vertisols). from one season to the next (Fig. 6). This lack of accumulation is consistent with another preliminary study (Kimber et al. 1995a,b) conducted on several farms in the Namoi Valley, showing that cotton farm-ing systems have the capacity to dissipate endosulfan residues, even where there is continuous growth of cotton for up to five applications annually.
A low baseline concentration of pesticide residues, below the detection limit of 0.05 mg/kg for endosul-fan sulfate, was also obtained in the 1994–95 season on field 4. A maximum peak of residue in soil was reached at 0.86 mg/kg (440 g/ha) on the day of the second spraying, when field plant cover was 25%. Another spraying 16 days later showed a lower peak of 0.68 mg/kg (345 g/ha) when the plant cover was 50%. More intensive sampling after the three spray-ing events revealed detailed information on the rapid disappearance of α-endosulfan and the slower disap-pearance of β-isomer.
Thus, it is apparent that there is a complex pattern of dissipation of endosulfan in soil: in the first stage, the two parent isomers (α- and β-endosulfan) dissi-pate quickly but at different rates coincident with a build up of endosulfan sulfate, the latter reaching a maximum (0.2 mg/kg or 100 g/ha) about two weeks after the final spraying.
The faster dissipation of endosulfan in the first phase could be explained as a loss of the parent iso-mers by volatilisation, the extent of which is depen-dent upon environmental conditions such as temperature, wind and soil moisture (Southan and Kennedy 1995). This was confirmed by direct mea-surements using air from above the crop filtered through carbon filters. In the second phase the slower rate of dissipation seems to reflect the degra-dation in soil of the more stable product endosulfan sulfate as well as dissipation of remaining β-endosulfan.
Persistence of endosulfan in soil: half-life
Apparent half-lives for each of these two phases have been estimated from a large number of data points (Table 1), with crude mean values of about 4 days and about 140 days for total endosulfan residues in each of the two phases. However, these values are approximate only and more careful analysis of this data will be described elsewhere (Southan and Kennedy 1995). The half-life in soil also varied from field to field as the environmental conditions (time of day, temperature, wind speed, etc.) varied for each spraying. In general, the decline in α-endosulfan con-centration in soil was much faster than that for β-endosulfan, whilst endosulfan sulfate was formed quickly as α-endosulfan disappeared and afterwards degraded relatively slowly. On one field, the peak quantity of endosulfan sulfate represented about half the α-endosulfan plus β-endosulfan deposited on soil
Table 1. Estimated half-lives (days) for total endosulfan in soil of cotton growing areas
Year Field Phase α-endosulfan β-endosulfan E. sulfate(days)
Total endosulfan
1993–94 21 1 5.5 6.8 – 4
2 10.5 103 120 180
1994–95 4 1 1.8 4.1 – 2
2 65 86 152 105
1995–96 20 1 5.7 – – 6
2 35.7 40.2 63 129
1995–96 7 1 3.7 4 – 5.2
2 7.8 119 105 137
Average 1 4.2±1.8 4.9±1.6 – 4.3±1.7
2 29.7±26.6 87±34 110±36.9 137.7±31.3

96Seeking agricultural produce free of pesticide residues
edited by I.R. Kennedy, J.H. Skerritt, G.I. Johnson and E. Highley ACIAR Proceedings No. 85e
(printed version published in 1998)
35
30
25
20
15
10
5
00 10 20 30 40 50 60
Days after spraying
End
osul
fan
in r
un-o
ff (µ
g/L)
�
���
� �
�� �
��
�
���� �
�����
��� �
����
���
�
�
���
��
+
+ +
or one-fifth the total endosulfan applied in the three aerial sprayings.
Difficulties in estimating half-lives under field conditions can arise from several causes, the main being the frequency of sampling immediately after the spraying.
Spatial uniformity
Statistical analysis (ANOVA) of the data for the stratified design by rows and columns on fields 21 and 4 indicates that there was no significant differ-ence in concentrations of endosulfan residues
between strata. There was no evidence of significant redistribution of the pesticide downfield (i.e. in irri-gation run-off water). Thus, aerial application pro-vides an even spread of pesticide on the field, and the rate of conversion to endosulfan sulfate also seems to occur evenly across the field, at least dur-ing the first weeks when the concentrations are highest.
Movement through soil layers
At field 21, a special set of four cores from the field, tail-drain slope, tail-drain scow, and return
Table 2. Transport of endosulfan residues in run-off water (Field 4, 1994–95)
a ML = megalitres.
Event Date Days since last spraying
Discharge (MLa/ha)
Endosulfan in water (mg/L)
Endosulfan removed (g/ha)
% endosulfan washed off
Irrigation 1 8/12/94 8 0.97 7.65 7.42 4.3
Irrigation 2 28/12/94 7 0.84 6.98 5.86 2.9
Storm 1 5/1/95 15 0.037 6.11 0.23 0.1
Irrigation 3 13/1/95 6 0.69 6.96 4.8 2.7
Storm 2 19/1/95 12 2.35 8.85 20.8 9.9
Storm 3 28/1/95 21 0.022 6.09 0.13 0.07
Irrigation 4 6/2/95 30 1.03 1.62 1.67 0.9
Irrigation 5 20/2/95 44 0.73 0.75 0.55 0.3
Irrigation 6 4/3/95 56 0.75 0.15 0.11 0.08
Total 7.42 41.57 1.9
Figure 8. Endosulfan residues in run-off from 19 cotton fields at Warren, NSW, Australia in 1995–96. The decline in residue concentration in irrigation run-off in several return drains is well correlated with the declining concentration in soil (see Fig. 7).

97Seeking agricultural produce free of pesticide residues
edited by I.R. Kennedy, J.H. Skerritt, G.I. Johnson and E. Highley ACIAR Proceedings No. 85e
(printed version published in 1998)
drain was taken for analysis of endosulfan residues in soil layers. As observed in a previous CRDC-funded study (Kimber et al. 1995a,b), most of the endosulfan was present in the top surface layer, its concentration declining with depth and being negligible beyond 8–10 cm. All samples showed similar residue con-centrations, but residues from return drain were sig-nificantly lower. Given the low solubility of endosulfan and its high affinity for organic matter, leaching seems improbable, particularly in these ver-tisols; rather, any presence of endosulfan below sur-face layers may be explained by soil and contaminated dust falling into the wide and deep cracks often appearing in this type of soils.
Endosulfan in run-off water
There was significant pesticide contamination of all irrigated run-off water after the first spray application. The residues found were generally in the range 1–30 µg/L in run-off at the drop-box, depending on the number of days from the previous aerial application. Values declined to about 2 µg/L one month after spraying, corresponding with the decline in on-field soil residue concentration (see Fig. 8 and Table 2).
In Table 6, the calculated amounts of endosulfan residues for different levels of measured run-off are shown. This data indicates that 2–4% of the residues on-field are typically washed off the field in an irriga-tion event, with up to 10% leaving the field through the drop-box during a major storm. Normally, resi-dues in irrigation run-off are recirculated in the farm-ing system, and do not enter riverine systems except in major storms.
Conclusions
From data such as these, a chemical balance for pesti-cides like endosulfan can be prepared. As a result of these field analyses, the following conclusions were made:
Develop strategies to minimise the pesticide load on cotton fields.
In general, retaining pesticide residues at the site of application in soil and cotton plants or trash where they may dissipate in situ is desirable and reduces vulnerability to further run-off. Strategies that should be considered to minimise loads include:• minimise the number of pesticide applications.
This may be achieved by careful attention to moni-toring of pest pressure, and by choices related to
time of spraying (e.g. volatility of endosulfan is greater in hotter conditions, reducing effectiveness and requiring more frequent spraying),
• use band spraying where possible, minimising the contamination of soil by focusing the application of insecticides on plants where efficacy is greater and breakdown faster,
• apply the principles of integrated pest management and encouragement of beneficial predators, to reduce insect pest pressure (e.g. food-sprays, plant buffer zones to grow beneficials) and so reduce the need for pesticide application.For endosulfan, frequent sprayings lead to fur-
ther building-up residues in the soil, since the intervals normally used (10–15 days) are not suffi-ciently long to allow for a substantial degradation in soil. But with late spray applications with 60% or more of plant cover, the residues added to soil were shown to be smaller in magnitude. Reducing total pesticide load on soil can be achieved if the actual spraying schedules are changed: given the half-lives and degradation times of endosulfan it is evident that the main potential for contamination is given by the early aerial sprayings with 85–95% of the field surface exposed. In these conditions very little endosulfan goes onto the plants where it could dissipate more rapidly. While the require-ments for pest control may limit flexibility, this principle could be kept in mind where alternative strategies for pest control exist. The introduction of transgenic Ingard cotton, shown in the 1996–97 season to reduce the need for early season spraying with endosulfan, will allow this benefit to be gained. The availability of transgenic Ingard cotton now provides an opportunity to reduce endosulfan application, particularly early when soil exposure is greatest, and in sensitive areas near stock routes, wetlands and rivers.
Minimise run-off and sediments in run-off and the possibility of contaminated return-drain water join-ing the rivers.
Obviously, from the concentrations of endosulfan residues found in run-off from cotton fields in this study, irrigation tail water should never be made available to livestock, even just before defoliation. Operation of the Farm Simulation Model (Tuite 1996) using data from the NSW Fieldsite at Warren suggests that the strategy of quantifying flows and transport of pesticide residues on individual farms can help provide very useful results regarding the

98Seeking agricultural produce free of pesticide residues
edited by I.R. Kennedy, J.H. Skerritt, G.I. Johnson and E. Highley ACIAR Proceedings No. 85e
(printed version published in 1998)
benefits of reducing run-off, particularly by increas-ing on-farm storage, thus allowing the quarantining of more pesticide residues on-farm.
The relevant strategies are:• recirculate all tail waters on farms and provide the
maximum capacity for their retention in ponds or depressions during storms. Sediment traps where the velocity of water flow is significantly reduced provide an opportunity to minimise transport of pesticide residues to rivers.
• schedule irrigations by careful monitoring of soil moisture conditions. Irrigations just before storms provide conditions for more run-off than usual, so attention should be paid to weather forecasts in irri-gation scheduling where possible.
• reduce erosion by using flat furrow gradients par-ticularly near and in tail drains. Sediment load is directly related to velocity of flow. Cultivation of soil increases erodibility in storms and should be used sparingly or replaced by minimum tillage her-bicide treatments that should also be carefully monitored for environmental impacts.
• reduce erosion by retaining stubble and other vege-tation on cotton fields. Such techniques (as shown in this study in 1994–95) prevent sealing of the soil surface by reducing the impact of rain water, improving infiltration into soil and reducing run-off during irrigations and in storms (Silburn 1996).
• develop farm environmental plans, including ame-lioration practices such as strategic location of fal-low fields to retain and receive storm waters, particularly near outlet points on farms, directing storm run-off away from sensitive wetlands and streams as part of a storm water management plan. Such farm environmental plans, possibly prepared by a specialist consultant, could include applica-tion of models such as the Simulation Model or other models, tailored to provide a user-friendly output to form a reliable basis for recommenda-tions and providing an analysis that incorporates the specific features of the particular farm and the neighbouring locality.
• conduct more research to further define the capac-ity to limit pesticide transport and to remediate soil and water.A knowledge of likely pesticide loadings could
help make prudent decisions regarding controlling run-off and recycling of water in the farm system. For instance, up to 60 g of endosulfan was removed from field 20 during the peak of the flow (1.5 ML/hour) after the two first sprayings, but in the irrigation fol-
lowing the last spraying the amounts of endosulfan residues removed were four times lower despite showing a similar flow.
New strategies to reduce pesticide loading in run-off, such as the use of flocculants in irrigation water, are still subject to investigation; it may be premature to recommend their application until their capacity to retain residues on-field has been evaluated, and any environmental impacts assessed. However, there is no doubt of the ability of small amounts of polyacry-lamide to substantially reduce sediment loads in run-off.
Ponding of water as such does not encourage endosulfan dissipation, as the half-lives of this pesticide in the pond experiment were found to be similar to those in soil, and there was a 50% deposition as sulfate on the bottom floor (S.W.L. Kimber and I.R. Kennedy, unpublished data). However, hydrolysis in ponds could be fostered by alkaline treatment, since endosulfan is quickly degraded under high pH (Southan and Kennedy 1995), or by bioremediation with mixed microbial cultures or enzyme preparations, possibly including cyanobacteria (Kennedy et al. 1997b). In part, the technology required for such approaches has been developed during this study such as the validation of an endosulfan immunoassay for field analysis, allowing the time for quarantine of run-off waters in storage. However, these new solutions demand the development of new technology, which is also recom-mended as part of an on-going process of reducing the environmental impact from pesticides used in cotton farming. Any such new procedures can readily be incorporated into the farm environmental plan.
Acknowledgments
Research funding support was provided by the Land and Water Resources Research and Development Corporation, the Cotton Research and Development Corporation and the Murray–Darling Basin Commis-sion. The cooperation of Dr John Skerritt, CSIRO Plant Industry, for ELISA analysis and reagents is gratefully acknowledged.
References
Ahmad, N. and Edge, V. 1996. Volatilisation of endosulfan. Minimising the Impact of Pesticides on the Riverine Environment, LWRRDC/CRDC/MDBC Workshop, Brisbane, 15–18 August 1996.

99Seeking agricultural produce free of pesticide residues
edited by I.R. Kennedy, J.H. Skerritt, G.I. Johnson and E. Highley ACIAR Proceedings No. 85e
(printed version published in 1998)
Cooper, B. 1996. Central & North West regions water qual-ity program— 1995/96 report on pesticide monitoring. Sydney, NSW, Australia, Department of Land & Water Conservation, Water Quality Unit.
Cotham, W.E. and Bidleman, T.F. 1989. Degradation of malathion, endosulfan and fenvalerate in seawater and seawater/sediment microcosms. Journal of Agricultural and Food Chemistry, 37, 824–828.
Kennedy, I.R. 1995. Minimising the impact of pesticides on the riverine environment using the cotton industry as a model. Canberra, LWRRDC, Quality Assurance Mile-stone Report, 17p.
Kennedy, I.R., Ahmad, N., Simpson, B. and Woods, N. 1995. Manual for sampling and analytical protocols. Min-imising the impact of pesticides on the riverine environ-ment using the cotton industry as a model. University of Sydney.
Kennedy, I.R., Ahmad, N., Tuite, J., Kimber, S., Sanchez-Bayo, F., Southan, S., Hugo, L., Wang, S., Lee, A., Beas-ley, H. and Wronski, E. 1997a. Transport and fate of pes-ticides in cotton production systems. NSW fieldsite and degradation study. Final Milestone Report, Land and Water Resources Research and Development Corpora-tion, 50p.
Kennedy, I.R., Harris, R., Sanchez-Bayo, F., Kimber, S., Southan, S., Hugo, L., Lee, N.J., Wang, S. and Caldwell, R.A. 1997b. Cotton pesticides in perspective. Sydney, CRC for Sustainable Cotton Production, Department of Agricultural Chemistry and Soil Science, University of Sydney.
Kimber, S.W.L., Ahmad, N. and Kennedy, I.R. 1995a. The fate of endosulfan sprayed on cotton for insect control (US2C/US15C). Final Report. CRDC, Narrabri, NSW.
Kimber, S.W.L., Southan, S.K., Ahmad, N. and Kennedy, I. R. 1995b. The fate of endosulfan sprayed on cotton. In: Constable, G.A. and Forrester, N.W., ed., Challenging the future, proceedings of the World Cotton Research Conference 1, Brisbane, Australia, 589-594.
Lee, N., Skerritt, J.H. and Kennedy, I.R. 1995a. Chemistry protecting the environment: field testing for pesticide res-idues. Chemistry in Australia, 62,14-17.
Lee, N, Skerritt, J.H., Kennedy, I.R., McAdam, D.P., Beas-ley H.L. and Hill, A.S. 1995b. Development of laboratory and field ELISA tests for the detection of endosulfan in water and soil. In: Constable, G.A. and Forrester, N.W., ed., Challenging the future, proceedings of the World Cotton Research Conference 1, G.A. Constable and N. Forrester, eds., pp. 595-599.
Lee, N., Beasley, H.L., Kimber, S.W.L., Silburn, M., Woods, N., Skerritt, J.H. and Kennedy, I.R. 1997. Appli-cation of immunoassays to studies of the environmental fate of endosulfan. Journal of Agricultural and Food Chemistry, 45, 4147-4155.
Peterson, S.M. and Batley, G.E. 1993. The fate of endosul-fan in aquatic ecosystems. Environmental Pollution, 2,143-152.
Silburn, M. 1996. Rainulator studies of pesticide movement from cotton production systems. Minimising the Impact of Pesticides on the Riverine Environment, LWR-RDC/CRDC/MDBC Workshop, Brisbane, 17–18 Sep-tember 1996.
Singh, P.P., Battu, R.S., Singh, B. and Kalra, R.L. 1991. Fate and interconversion of endosulfan I, II and sulfate on gram crop (Cicer arietinum Linn) in subtropical environ-ment. Bulletin of Environmental Contamination and Tox-icology, 47, 711-716.
Southan, S. and Kennedy, I.R. 1995. Dissipation of the pes-ticide endosulfan from cotton field runoff water using an improved apparatus for the simulation of field conditions. Proceedings 4th RACI Environmental Chemistry Confer-ence, E022-1-5, 9–14 July, Darwin, Australia.
Tuite, J. 1996. Cotton farm simulation model. Minimising the impact of pesticides on the riverine environment. LWRRDC/CRDC/MDBC Workshop, Brisbane, 15–18 August 1996.

100Seeking agricultural produce free of pesticide residues
edited by I.R. Kennedy, J.H. Skerritt, G.I. Johnson and E. Highley ACIAR Proceedings No. 85e
(printed version published in 1998)
NEW Zealand has an agricultural based economy, heavily reliant on exports of primary produce. Wool production contributes significantly to the gross domestic product, but because it is a commodity that is subject to the vagaries of supply and demand and fluctuating currencies, this contribution is inconsis-tent. Recently, Wools of New Zealand has introduced a global marketing strategy based on a country of ori-gin brand, the Fernmark™, in order to differentiate New Zealand wool from that supplied by other coun-
tries. The Fernmark™ strategy relies heavily on the ‘clean green’ imagery associated with New Zealand. Wools of New Zealand and the Wool Research Organisation of New Zealand (WRONZ) have embarked on a significant program to understand and manage pesticide (ectoparasiticide) use on New Zealand sheep farms to ensure that this image is soundly based.
Ectoparasiticide use is essential in sheep farming to protect stock from the ravages of the sheep blowfly and lice. Blowflies lay their eggs on live sheep, and the hatched maggots burrow into the skin, causing large lesions. Heavy infestations may be fatal. In contrast, lice are obligate parasites of sheep. Problems occur
Residue Monitoring in Wool, and theEnvironmental Impacts of Pesticide Residues
P.W. Robinson, H.L. Boul, N.I. Joyce, and T.C. Reid*
* Wool Research Organisation of New Zealand (WRONZ) Private Bag 4749, Christchurch, New Zealand.
Abstract
Pesticide (ectoparasiticide) residue analysis has become a vital tool for improving farmer practices and demonstrating the overall cleanliness of New Zealand’s wool and wool production. Demonstration of this cleanliness is imperative for protecting market access. This paper reviews residue issues and solutions throughout the wool production and processing chain, and the development of analytical techniques for residue testing.
Results are presented for on-farm soil contaminations as a result of sheep dipping and the disposal of excess dip wash. Contamination with historical compounds such as arsenic, dieldrin, and carbophenothion is evident at some sites. Low-level soil residues are apparent with most modern dips but significant contamination can result following use of some water-soluble compounds. Soil degradation, however, results in little or no long-term contamination from these compounds. Chemical methods for the treatment of excess dip wash before land disposal have potential to reduce soil contamination, but filtration, using a wool-based filter, may offer a cheaper and more robust long-term solution.
Ectoparasiticide residues are removed from wool during wool scouring. Removal of these compounds can result in highly toxic effluents. Treatment of these waste waters is essential to minimise environmental impacts. High rate anaerobic destabilisation allows for the removal of pesticides from wool processing effluents. The resultant sludge may be composted or pelletised before land spreading or landfill disposal.
International environmental legislation restricts the discharge of pesticides in textile processing effluents. Compliance with this legislation offers the possibility of some wool importing countries to use ectoparasiticide residues as a technical barrier to trade. Taken to their ultimate extent, these legislative restrictions could result in a ban on certain organophosphate or pyrethroid-based compounds. The implications of this to the New Zealand farmer are discussed.
101Seeking agricultural produce free of pesticide residues
edited by I.R. Kennedy, J.H. Skerritt, G.I. Johnson and E. Highley ACIAR Proceedings No. 85e
(printed version published in 1998)
when lice numbers rapidly multiply. High numbers of lice affect the pelt and may cause wool to become cot-ted (entangled) and discoloured due to the animal rub-bing itself to ease discomfort. An increased incidence of mycotic dermatitis may also occur.
Despite the need for ectoparasiticides, their poten-tial affect both on the environment and trade means that their use is subject to intense scrutiny. Com-pounds must be used in a sustainable manner and, as with the production of other agricultural products, transparency within the farm-to-fabric (pasture-to-plate) pipeline is essential. The dipping of sheep may result in the contamination of soil and may produce significant quantities of excess dip wash for disposal. In addition, residues remaining on the wool may be transferred to processing liquors when the wool is scoured (washed) or dyed. The transfer of ectopara-siticide residues to processing effluents may render these toxic to receiving waters. This toxicity may be overcome by suitable treatment technologies. How-ever, wool residues have potential to become a tech-
nical barrier to trade under the terms of the General Agreement on Trade and Tariffs.
Analysis of Ectoparasiticides on Wool and Wool Products
Sheep dipping may be carried out in a plunge pool or shower (where the whole animal is soaked to the skin) or by hand-jetting, which applies less chemical to selected parts of the sheep. Pour-on treatments for lice may be applied as a narrow strip along the spine or as a spot between the shoulders.
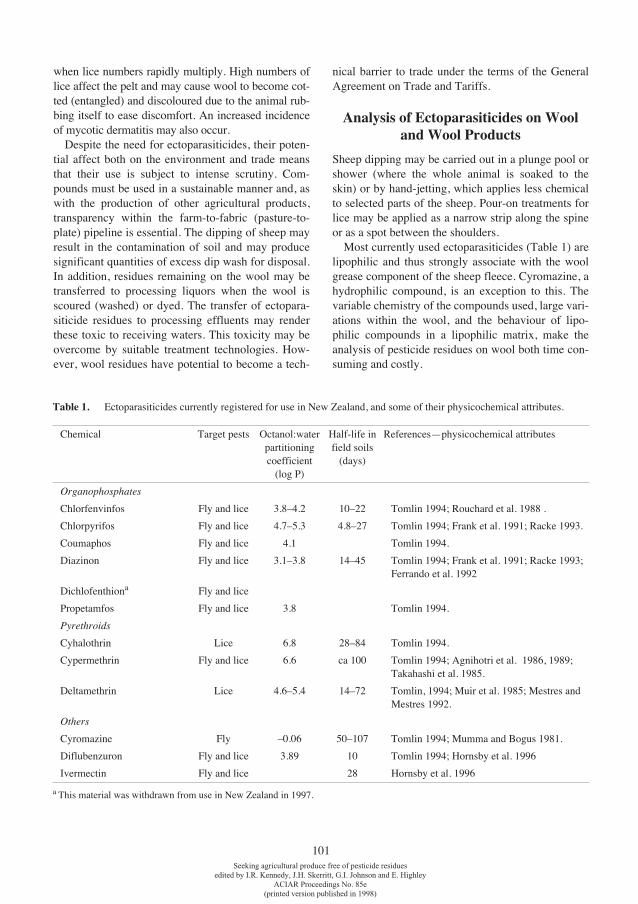
Most currently used ectoparasiticides (Table 1) are lipophilic and thus strongly associate with the wool grease component of the sheep fleece. Cyromazine, a hydrophilic compound, is an exception to this. The variable chemistry of the compounds used, large vari-ations within the wool, and the behaviour of lipo-philic compounds in a lipophilic matrix, make the analysis of pesticide residues on wool both time con-suming and costly.
Table 1. Ectoparasiticides currently registered for use in New Zealand, and some of their physicochemical attributes.
a This material was withdrawn from use in New Zealand in 1997.
Chemical Target pests Octanol:water partitioning coefficient
(log P)
Half-life in field soils
(days)
References—physicochemical attributes
Organophosphates
Chlorfenvinfos Fly and lice 3.8–4.2 10–22 Tomlin 1994; Rouchard et al. 1988 .
Chlorpyrifos Fly and lice 4.7–5.3 4.8–27 Tomlin 1994; Frank et al. 1991; Racke 1993.
Coumaphos Fly and lice 4.1 Tomlin 1994.
Diazinon Fly and lice 3.1–3.8 14–45 Tomlin 1994; Frank et al. 1991; Racke 1993; Ferrando et al. 1992
Dichlofenthiona Fly and lice
Propetamfos Fly and lice 3.8 Tomlin 1994.
Pyrethroids
Cyhalothrin Lice 6.8 28–84 Tomlin 1994.
Cypermethrin Fly and lice 6.6 ca 100 Tomlin 1994; Agnihotri et al. 1986, 1989; Takahashi et al. 1985.
Deltamethrin Lice 4.6–5.4 14–72 Tomlin, 1994; Muir et al. 1985; Mestres and Mestres 1992.
Others
Cyromazine Fly –0.06 50–107 Tomlin 1994; Mumma and Bogus 1981.
Diflubenzuron Fly and lice 3.89 10 Tomlin 1994; Hornsby et al. 1996
Ivermectin Fly and lice 28 Hornsby et al. 1996

102Seeking agricultural produce free of pesticide residues
edited by I.R. Kennedy, J.H. Skerritt, G.I. Johnson and E. Highley ACIAR Proceedings No. 85e
(printed version published in 1998)
Sampling of wool for analysis
It has been estimated that there is a 36–42% varia-tion in pesticide residues levels between sheep and a similar level of variability on a single animal, even when compounds are applied using a shower or plunge dip (Rammell et al. 1988). It might be expected that this variability would be greater where compounds are applied using a jetting system or as a pour-on. For most survey work, where farm lots or composite farm samples are required, standardised core sampling in accordance with International Wool Textile Organisation (IWTO) Core Test Regulations 1996 is used. Under these regulations core samples of wool are taken from each bale within a lot, the num-ber of cores being dictated by the size of the lot. Where individual animals are to be tested, a hoop sample is shaved from the middle of the animal, blended, and then analysed.
All samples received are blended in an air blender. A 50 g subsample is then selected from the bulk sam-ple. This subsample is cut into 5–8 mm lengths, using steel cutting blades which can be cleaned between samples. After cutting, the samples are further air blended before being stored in clean glass containers. Opened sample containers are placed in a controlled temperature and humidity room (20°C, 65% r.h.) for 24 hours before weighing and extraction.
Extraction of wool samples for analysis
In traditional solvent-extraction methods for wool residue analysis, wool is Soxhlet extracted with dichloromethane (DCM) or ethyl-acetate/hexane. Soxhlet extraction is relatively slow, with extractions taking from 4–18 hours (Greene 1993; Greene and Wimbush 1995); but multiple extractions can be per-
formed simultaneously. Unfortunately, it is our expe-rience that these extractions do not fully recover all compounds, and also provide extracts that are hard to clean up before GC analysis. This latter observation is believed to result from the high amounts of internal wool lipids these techniques extract. The extraction method of choice at WRONZ is supercritical fluid extraction (SFE) for all compounds except cyro-mazine, for which methanol extraction is used. Table 2 compares the merits of Soxhlet extraction and SFE. WRONZ uses a Dionex SFE 703 which is capable of taking 8 extraction cells simultaneously. Extractions can be performed in 30 minutes but extra time is required to clean and set up the apparatus for the next extraction. Although SFE provides cleaner extracts than solvent extraction, subsequent clean-up is still required.
Clean-up of extracts
Sweep co-distillation has found favour in the past for the clean-up of samples containing high levels of wool grease (Peaker et al. 1991a,b). However, Jones (1992) suggested that this method had a number of deficiencies, including: pesticide recoveries are not quantitative, particularly for some pyrethroids (although our experience suggests that this may be a function of extraction rather than clean-up); and the analyte solutions from the method contain small amounts of volatile wool grease components and non-volatile woolgrease esters that produce signifi-cant background noise, peak broadening, and drifts in retention times.
Jones (1992) and Greene (1993) suggested gel per-meation chromatography (GPC, or size exclusion chromatography) as the method of choice for analysis
Table 2. Relative merits of Soxhlet extraction versus supercritical fluid extraction (SFE) for the analysis of wool residues
Factor Soxhlet SFE
Cost Low cost with many labs having access to equipment
High capital cost—may be offset by lower operator charges
Time Relatively slow (4–18 hours), but fast turn-around
Fast (30 mins), but more time is required for set-up
Recoveries Generally good, although lower for some pyrethroids
Excellent, although thermally labile compounds such as diazinon may cause problems
Reproducibility Good Fair, can be improved using trapping techniques
Environmental High volumes of solvents require disposal No solvents to dispose of

103Seeking agricultural produce free of pesticide residues
edited by I.R. Kennedy, J.H. Skerritt, G.I. Johnson and E. Highley ACIAR Proceedings No. 85e
(printed version published in 1998)
of samples containing woolgrease (i.e. extracts of wool and wool scouring waste waters). Jones (1992) claimed recoveries ranging from about 70 to 110% for all pesticides likely to be found in woolgrease (but did not analyse for cyromazine). Greene (1993) attempted to repeat this work on both greasy wool and wool scouring effluents. Results suggested some-what lower (and more variable) recoveries for some of the later-eluting compounds, such as cypermethrin and deltamethrin. Greene also indicated that contami-nation of the GC, especially the electron capture detector (ECD), may be a significant problem. Both Greene and Jones processed limited samples, and the broad applicability of their results is therefore hard to ascertain.
Work carried out on this method at WRONZ sug-gested that, because of the problems identified by Greene, it was not robust enough for routine analysis of a large number of samples (Robinson and Joyce, unpublished data). Significant amounts of wool-grease components carry over into the analyte solu-tion, resulting in GC column contamination, peak broadening, a drift in retention times, and loss of sen-sitivity. Such results are not surprising when it is con-sidered that woolgrease is a complex mixture of compounds with molecular weights ranging from about 200 to 1000, and that the pesticides of interest have molecular weights in the range 280–510. Sepa-ration by size, or molecular weight, is unlikely to be very efficient.
Building on earlier work by Gillespie and Walters (1986, 1989), WRONZ developed a clean-up process based on reverse-phase high performance liquid chro-matography (HPLC). Sample preparation time was similar to GPC but cleaner samples were produced, reducing GC down time. This method has now been used successfully for four years, processing many hun-dreds of samples. The current system at WRONZ uses standard 4.6 mm diameter HPLC columns, and while these restrict sample volumes they can be operated much more rapidly than the preparative columns used by Jones (1992) and Greene (1993). Experience to date indicates that GC column and precolumn life may be twice that achieved using GPC clean-up. In addition, it is likely, but not quantified, that less contamination of the detector occurs, further reducing down time.
Final analysis of samples
All ectoparasiticides listed in Table 1, with the pos-sible exception of ivermectin, may be analysed by GC. However, for convenience both cyromazine and
diflubenzuron are analysed by HPLC. Cyromazine and its degradation product, melamine, appear to interfere with GC columns and or detectors when large numbers of samples are analysed (Robinson 1995), while diflubenzuron requires derivatisation before GC analysis. All pesticide GC analyses at WRONZ are performed on Shimadzu QP5050A or QP5000 GC/MS instruments. The use of a mass spec-trometric detector provides greater confidence in results and eliminates the risk of false positives. To allow simultaneous analysis of all the organophos-phates and pyrethroids listed in Table 1 (plus a large number of organochlorine compounds), injections are performed using a cold on-column injector. This injector prevents degradation of thermally labile compounds, such as diazinon, occurring in the injec-tion port.
Contamination of Soils On-farm
Saturation dipping techniques, such as plunge and shower dips, generally require large volumes of sur-plus dip to be disposed of at the end of the day. Plunge dips may possess sumps of 1000–10 000 L capacity, whereas shower dips typically have a sump volume of 500– 1000 L. In addition to the disposal of this liquor, the ground adjoining the dip site may become contaminated with pesticides by splashing and fleece drainage.
Compounds no longer used
Soil contamination in localised areas around sheep dipping sites was analysed on a group of 15 farms on New Zealand’s south island. Ten farms were sampled in each of two years, with five farms common to both samplings. Soil samples were taken from the splash zone adjoining the dip site, in the drainage area (pas-ture close to the exit of the dip), and in the area where dip wash was disposed of by land spreading after dip-ping. Samples were taken using standard cores from both 0–7.5 cm and 7.5–15.0 cm depths at several localities in each of these areas and pooled. Samples were also taken on three separate occasions: immedi-ately before any dipping for a season; within two days of dipping; and two months after dipping.
Soil samples were initially analysed for contamina-tion by dipping compounds such as arsenic and orga-nochlorines which are no longer used. Arsenic levels were significantly higher in areas next to dipping sites than in control areas on the same farm (Table 3:

104Seeking agricultural produce free of pesticide residues
edited by I.R. Kennedy, J.H. Skerritt, G.I. Johnson and E. Highley ACIAR Proceedings No. 85e
(printed version published in 1998)
p < 0.05, Student t-test). Arsenic concentrations were also higher on farms operating permanent shower type dips than on farms using mobile showers (Table 3: p <0.05, Student t-test); this result despite similar periods of operation in some cases. Two sites where dipping had occurred for less than 7 years showed no difference between background and dip site levels of arsenic.
Levels of DDT and its metabolites were similar to typical levels for farms in the region, and did not sig-nificantly differ between dip sites and their respective controls. Levels up to 2.6 mg/kg were recorded for total DDT residues (including DDE), but values were generally less than 0.8 mg/kg. This is close to the estimated mean DDT levels of 0.44 mg/kg for farms in the Canterbury region (Roberts et al. 1996). Lin-dane residues were below the limit of detection of the method in all soil samples, although traces were occasionally observed. Dieldrin was associated with many dipping sites and very high levels were recorded in soil samples taken from two farms. Lev-els up to 45 mg/kg were found in the splash zone of a dip and in areas where surplus dip had been disposed of. These residues are consistent with the use of dieldrin as an ectoparasiticide until about 1970. In contrast, DDT and its metabolites tended to occur in control samples rather than in samples specifically associated with dip sites. Again, this is consistent with the intensive field use of DDT for grass grub control rather than as a sheep ectoparasiticide. Aldrin was consistently associated with the dip site on one property sampled in both years with levels ranging from 2–10 mg/kg. The origin of these residues is
unclear, as it seems that aldrin was never registered as an ectoparasiticide.
Bromophos-ethyl and carbophenothion residues were detected on some farms. Both these products were withdrawn from availability several years ago, and detection of significant residues was therefore somewhat surprising. Bromophos-ethyl residues were generally low with the highest recorded value being 0.8 mg/kg. In contrast, carbophenothion resi-dues were detected at levels up to 23 mg/kg on one farm.
While this study revealed some low-level contami-nation of dip site soils by dip formulations used in the past, a similar study conducted in the Waikato region (North Island, New Zealand) found greater contami-nation. Levels of arsenic up to 1630 mg/kg were recorded, although the volcanic origin of the soils might have contributed to these high levels. Levels for dieldrin were comparable with the results pre-sented here (McBride 1994). The North Island study, however, found measurable lindane (up to 4.2 mg/kg on one site).
Currently registered compounds
Five farms were selected for their use of the com-pound, cyromazine (Vetrazin™), an insect growth regulator. High levels of cyromazine were detected in and around dipping sites, in drainage areas, and dis-posal sites (Table 4). Samples taken within one or two days of dipping indicated high levels of contami-nation (up to 85 mg/kg) in the top 7.5 cm of the soil. Generally lower residues were recorded in the lower 7.5–15 cm profile, but samples taken from the dis-
Table 3. Soil arsenic levels associated with sheep dipping sites in Canterbury, New Zealand
Farm location Arsenic levels (mg/kg) Dip type Period of use
Control Drainage (years)
Christchurch 6.10 16.20 Permanent 50
Peel Forest 3.84 5.86 Portable >15
Claremont 2.41 14.60 Permanent 15-20
Darfield 2.99 6.20 Permanent 20
Aylesbury 3.03 31.80 Permanent >20
Amberley 0.54 2.29 Portable 10–15
Oxford 3.39 3.97 Portable 3
Swannanoa 1.99 2.05 Portable >10
Amberley 1.13 0.86 Portable <7
Rotherham 2.73 6.00 Portable >15

105Seeking agricultural produce free of pesticide residues
edited by I.R. Kennedy, J.H. Skerritt, G.I. Johnson and E. Highley ACIAR Proceedings No. 85e
(printed version published in 1998)
posal site, where the ground was generally saturated, also sometimes had high levels of cyromazine (up to 36 mg/kg) in the 7.5–15 cm zone.
Post-dipping contamination varied from farm to farm, especially in areas next to the dipping site. Lev-els of cyromazine were generally lower in samples
taken 2 months after dipping, reflecting losses through degradation. Loss of cyromazine, between samples taken within 1–2 days of dipping and 2 months later, varied from 20–98%, with values typi-cally around 70%. Losses from the 7.5–15.0 cm zone were lower than in the top 7.5 cm of the soil profile. In some cases, increases in concentration were appar-ent in the latter zone which may reflect some move-ment of cyromazine through the soil column, coupled with slower degradation (Table 5).
Overall loss rates for individual farms were rela-tively consistent between the three sampling locali-ties but, as indicated, there was variation between farms. There was no correlation between the loss of cyromazine from individual sites (and movement down through the soil column) and the cation exchange capacity or organic matter content of the soils. The soils had very low moisture contents. Most sheep dip sites were situated in the open, with little or no vegetation cover. This, coupled with low rainfall over the months of this study, would be expected to result in low microbial activity and low cyromazine degradation.
The reported degradation rate for cyromazine in soils is highly dependent on soil moisture and micro-bial biomass and, as such, the DT50 has been
Table 4. Mean cyromazine contamination of soil (mg/kg) in and around dipping sites at three different sampling periods
Sample site
Sample depth(cm)
Concentration of cyromazine and time of sampling
Pre-dip Post-dip Two months post-dip
Control 7.5 0.0
Control 15.0 0.0
Dip site 7.5 <0.1 24.0 6.1
Dip site 15.0 <0.1 15.5 4.7
Disposal 7.5 <0.1 55.9 28.7
Disposal 15.0 <0.1 11.2 11.8
Drainage 7.5 <0.1 12.5 3.6
Drainage 15.0 <0.1 3.6 2.0
Table 5. Loss of cyromazine from soils in and around sheep dips
Farm location and sample site Total concentration (mg/kg) of cyromazine in 0–15 cm profile and (in brackets) percent present in 7.5–15 cm profile.
Overall percent reduction
Post-dip 2 months post-dip
Swannanoa
Dip 2.6 (0.0) 1.4 (8.0) 46.2
Disposal 53.7 (6.1) 33.8 (24.4) 37.1
Drainage 10.0 (4.0) 8.0 (46.3) 20.0
Amberley
Dip 63.2 (32.3) 6.4 (40.6) 89.9
Disposal 97.4 (12.1) 31.5 (27.0) 67.7
Drainage 20.7 (13.0) 4.5 (33.3) 78.3
Oxford
Dip 82.4 (44.7) 1.2 (58.3) 98.5
Disposal 80.8 (19.3) 48.4 (40.1) 40.1
Drainage 26.5 (18.6) 1.8 (27.8) 93.2
Amberley
Dip 48.0 (41.9) 26.8 (37.3) 44.2
Disposal 49.2 (38.4) 19.0 (36.8) 60.4
Drainage 37.8 (26.2) 8.0 (32.5) 78.8

106Seeking agricultural produce free of pesticide residues
edited by I.R. Kennedy, J.H. Skerritt, G.I. Johnson and E. Highley ACIAR Proceedings No. 85e
(printed version published in 1998)
reported as being between 3 and 142 days (Mumma and Bogus 1981); although values between 50 and 107 days seem more typical. Microbial degradation is the primary loss mechanism, although leaching can be significant in sandy soils. Cyromazine does not hydrolyse or photolyse (Burkhard 1979a, b). There was an interval of 65–76 days between immediate post-dip and 2-month post-dip samples, with average degradation ranging from 34 to 78%. These figures equate to half-lives of approximately 40 to 100 days, which is consistent with observations from other parts of the world.
Soil samples were collected from a further nine farms using either diazinon or chlorfenvinphos. In general, soil contamination with these compounds was consistently lower than the contamination recorded with cyromazine. However, in one 0–7.5 cm sample, at a dip disposal site, chlorfenvinphos at a concentration greater than 530 mg/kg was recorded. It is possible that this level was associated with a spill of concentrate. Table 6 summarises the mean levels of both diazinon and chlorfenvinphos found in the soils of the farms sampled (the 530 mg/kg found at one farm has been excluded from the calculation of these means).
As with the farms sampled for cyromazine, contami-nation was noticeable immediately after dipping but levels were significantly reduced 2 months after dip-ping. The low and variable nature of the data preclude the calculation of half-lives for these compounds, but they are clearly short. Some carryover from previous dipping was apparent, as significant concentrations were detected in some ‘pre-dip’ samples.
We believe that the significant difference between soil contamination associated with cyromazine and that associated with diazinon or chlorfenvinphos can be explained as follows. Cyromazine is a water-solu-ble compound which essentially does not strip (actively partition onto the wool from the dip). In contrast, both diazinon and chlorfenvinphos are lipo-philic and are prone to stripping. Stripping of the active compound by woolgrease, results in a gradual fall in its concentration in the dip wash (Charleston 1985). Label requirements for replenishment, rein-forcement, and replacement should ensure that the dip wash is always maintained above a specified con-centration. It is possible that some farmers do not stick rigidly to label requirements, resulting in signif-icant drop-offs in active concentrations. This drop-off has been recorded in the field (Table 7) and may be responsible for the lower soil contamination observed with lipophilic products and, more importantly for the farmer, the ultimate failure of pest protection.
Disposal of Excess Dip Wash
Dip disposal is the most serious risk to the on-farm environment. Most farmers can dispose of dip on land well removed from surface waters, but a WRONZ survey in 1994 revealed that approximately 30% of the 300 or so farmers who answered the sur-vey questionnaire indicated that their dipping yards and/or disposal sites were within 100 m of permanent surface water (P.W. Robinson, unpublished data, 1994). While there has been no direct evidence for surface-water contamination as a result of sheep dip-
Table 6. Typical diazinon and chlorfenvinphos contamination of soil in and around dipping sites after three different sampling periods
Sample site Sample depth (cm)
Concentration (mg/kg) of diazinon and time of sampling
Concentration of chlorfenvinphos and time of sampling
Pre-dip Post-dip Two months post-dip
Pre-dip Post-dip Two months post-dip
Control 7.5 0.0 0.0
Control 15.0 <0.1 0.0
Dip site 7.5 <0.1 0.4 <0.1 0.0 2.0 0.2
Dip site 15.0 <0.1 0.1 <0.1 0.2 0.1 <0.1
Disposal 7.5 0.1 4.5 <0.1 1.1 9.0 0.4
Disposal 15.0 <0.1 0.7 <0.1 0.3 2.0 0.2
Drainage 7.5 <0.1 0.2 <0.1 0.0 <0.1 <0.1
Drainage 15.0 <0.1 <0.1 <0.1 <0.1 <0.1 <0.1

107Seeking agricultural produce free of pesticide residues
edited by I.R. Kennedy, J.H. Skerritt, G.I. Johnson and E. Highley ACIAR Proceedings No. 85e
(printed version published in 1998)
ping in New Zealand, there is circumstantial evidence to suggest that it might be a problem (Scott et al., 1994). In addition, there is recent circumstantial evi-dence in the U.K. that contamination of waterways might be a significant problem (Anon. 1997).
Laboratory experiments indicated that pesticide residues in spent dip solutions can be destroyed by oxidation using pool chlorine or Fenton’s reagent. The use of chlorine was proven on dirty liquors, such as spent dip solutions. However, there was doubt about the efficacy of Fenton’s reagent in treating these liquors. Chlorine appeared suitable for the treatment of all flystrike control compounds except chlorfenvinphos and cypermethrin. Fenton’s reagent appeared effective against all organophosphates (including chlorfenvinphos) and cypermethrin, but was ineffective against cyromazine. Experiments have not been conducted on either diflubenzuron or ivermectin. A summary of the treatment methods is given in Table 8.
Field trials were conducted on nine farms that were using a variety of dipping compounds. Chlorine tended to provide good treatment of spent dip solu-tions, with removal efficiencies being always greater than 55% and, in most cases, greater than 80%. This was significantly lower than the 80–100% removal efficiencies observed in the laboratory using cleaner solutions. Fenton’s reagent gave variable results ranging from no effect though to 69% removal. Again, results were somewhat poorer than laboratory
experiments had given. In addition to the poor perfor-mance of the treatments in the field, farmers indi-cated that they found handling the chemicals unnerving. Further work has concentrated on non-chemical removal methods, the most encouraging of which so far is the use of wool-based filters.
a NA = treatment not applicable
Laboratory experiments have been conducted using small filters made from glass columns filled with 10 g knops (small balls of wool) of wool. Wool knops have been used both clean and with added wool grease up to 500% w/w. Wool knops were packed into 25 mm diameter glass columns and a solution containing propetamfos, diazinon, chlorfen-vinfos, and coumafos applied. Samples of the filtered liquor were taken at intervals for analysis. In the first experiment, 2500 mL of clean liquor was passed through the column, and samples taken after 300, 500, 1000, 1500 and 2500 mL. The initial mean removal for all four compounds was 92.7%, and the final mean removal 88.8%; giving a cumulative removal of more than 200 mg of pesticides for every gram of wool. In a second experiment, both clean wool knops and wool knops containing 470% w/w of woolgrease were packed into two separate columns. Excess dip wash was collected from a local farm and fortified with the four compounds of interest, then 2000 mL of liquor was passed through the clean wool filter and 3500 mL through the greasy wool filter (Table 9). The greasy wool filter initially removed more pesticides than the clean wool filter (89% ver-
Table 7. Measured and calculated concentrations of dip wash active ingredient on nine farms using shower or plunge dips.
Calculated dip concentration (mg/L active ingredient)
Measured dip concentration (mg/L active ingredient)
Percent (%) of calculated dip concentration
present in final dip wash
440 101.2 23
400 104.5 26
400 88.0 22
400 20.5 5
325 63.3 19
230 94.0 41
205 21.2 10
186 3.1 2
120 57.6 48
Table 8. Chemical treatments for the destruction of surplus dip solutions
Active ingredient of dip wash
Chlorine treatment Fenton’s reagent
Chlorpyrifos, coumafos,dichlofenthion,
20 kg pool chlorine per 1000 litres of dip wash
1/2 cup of ferrous sulfate, stir well, then add 10 litres of peroxide per
1000 litres of dip wash
Chlorfenvinfos NAa as above
Diazinon, propetamfos
10 kg pool chlorine per 1000 litres of dip wash
as above
Cypermethrin NA as above
Cyromazine 20 kg pool chlorine per 1000 litres of dip wash
NA

108Seeking agricultural produce free of pesticide residues
edited by I.R. Kennedy, J.H. Skerritt, G.I. Johnson and E. Highley ACIAR Proceedings No. 85e
(printed version published in 1998)
sus 52.0%) but its efficiency fell as more liquor was processed. Further experiments are planned to inves-tigate whether cumulative removal may be achieved by recycling liquors through a filter several times and also to determine the ultimate loading capacity of such filters.
Toxicity of Pesticide Residues in Processing Effluents
Wool scouring removes on average 95% of all ecto-parasiticides from the shorn wool, with most of this removal occurring in the first three scouring bowls. Water consumption by this point is typically 1.5–2.0 L/kg of greasy wool scoured. Little removal occurs in the subsequent rinse bowls, where detergent concen-trations are low and the water is usually cold. The scouring (or flow down) liquor from the first three bowls is passed through a series of grease recovery centrifuges where typically 30% of the woolgrease is recovered. Approximately 30% of the lipophilic pes-ticides are removed at this point also. The remaining effluent is then discharged through a variety of treat-ment systems to the environment. Treatment of wool scouring waste waters in New Zealand varies from complete evaporation and incineration, at one plant, to untreated municipal ocean discharges at three oth-ers.
The ectoparasiticides used on sheep are highly toxic in aquatic environments. Table 10 indicates the approximate maximum levels than can be sustained in fresh waters, based either on the application of a 100-fold safety factor being applied to the 48-hour EC50 for Daphnia spp. (for organophosphates (OPs), pyrethroids, and diflubenzuron) (Hill 1989; Xiu et al. 1989; Fischer and Hall 1992; van Wijngaarden et al. 1993; Tomlin 1994) or chronic toxicity bioassay results (for cyromazine; Robinson and Scott 1995). Table 10 also indicates proposed U.K. environmental
quality standards (EQS) which are to be set for pyre-throids, organophosphates, and diflubenzuron in order to protect all aquatic life. If the ectoparasiti-cides are present in fresh water at levels below these ‘no effect levels’ then there should be no harm to any aquatic life.
Due to the levels of ectoparasiticides, effluent pro-duced from scouring greasy wool is also highly toxic. Both raw and treated wool scouring effluents were collected from a number of wool scours throughout New Zealand and subjected to both chemical analysis and toxicity bioassays. The toxicity of effluents was determined by diluting with clean water and assess-ing the dilution required to reduce toxicity to a point where only 50% of the test organisms were killed in 48 hours (48-hour EC50, Table 11). The no observ-able effect dilutions for these effluents are probably 10 –100 times greater than the 48-hour EC50 concen-trations.
The ‘toxic units’ for each effluent constituent were calculated based on the measured concentration of the contaminant and its known toxicity to the test spe-cies (Daphnia magna) (Amato et al. 1992) (Equation 1).
Toxic unit = (concentration of the contaminant) ÷(published EC50 for D. magna) (1)
Toxic units can be used for both pesticides and non-pesticides, provided the units of measurement are equivalent. Correlation coefficients were then determined for standardised variates of each contami-nant. A standardised variate is calculated according to Equation 2:
Standardised variate = (value nsource – meansource) ÷ standard deviationsource (2)
In all cases it was shown that the concentration of organophosphates or total pesticides (organophos-phates plus pyrethroids) present in the effluent was highly correlated with its overall toxicity (Table 12). These results indicated a simple additive action for the pesticides present with no apparent synergistic or antagonistic effects evident despite the high concen-trations of grease and suspended solids which might be expected to reduce bioavailability.
Rinse waters were shown to be slightly toxic after settling. Some pesticides were detected at low levels (µg/L range), with organophosphates proving to be the principal toxins. Dilutions of 20–150 times
Table 9. Percentage removal of pesticides from excess dip wash using wool-based filters.
Volume of liquor (mL) processed
Wool only filter Wool + woolgrease filter
250 52 89
500 54 74
1000 56 70
2000 56 65
3500 – 60

109Seeking agricultural produce free of pesticide residues
edited by I.R. Kennedy, J.H. Skerritt, G.I. Johnson and E. Highley ACIAR Proceedings No. 85e
(printed version published in 1998)
should be adequate to reduce the toxicity of these effluents to no observable effect levels. Flow down liquors were highly toxic, with no observable effect dilutions being of the order of 100 000 to 1 000 000 times. However, treatment in an anaerobic pond reduced the toxicity by 50–60% and treatment in a Bioloop™ system (see below) reduced the toxicity by approximately 90%.
a See text for description.
Treatment of wool scouring waste waters
WRONZ has developed a high-rate anaerobic digester to handle wool scour effluents. Known as Bioloop™, this system destabilises the wool-grease/water emulsion with a hydraulic retention time of 2–4 days. Effluent from the Bioloop™ plant is then separated in a settling tank, with the settled sludge being further thickened using a decanter cen-trifuge. Pesticides in the effluent to be treated by the
Bioloop™ plant partition into the sludge phase. Even for the water-soluble cyromazine, partitioning between the sludge and the clarified liquor strongly favours the sludge (mean proportion in the sludge = 86.1 ± 3.7%). Thickened sludge may then be com-posted or mixed with waste fibre before land spread-ing or landfill disposal.
a Correlation coefficient for total pesticides.b See text for description.
Composting of wool scour sludges has been carried out in forced-air aerated stacks, with temperature of the compost controlled by a computer linked to the aeration fans. Composting is a biological process which converts complex wastes into a rich organic substance which can be applied to land with a net benefit in terms of soil quality. Obviously, with the demonstrated high affinity of ectoparasiticides for the
Table 11. Toxicity (48-hour EC50) of woolscouring waste waters to freshwater aquatic life
Effluent 48-hour EC50 dilution
Effluent 48-hour EC50 dilution
Untreated flowdown
10 800 Bioloop™a treated
flowdown
550
Flowdown, ex. anaerobic pond
6 300 Settled rinse water
5.7
Table 12. Correlation coefficient of the standardised variate for organophosphate (OP) concentration and woolscouring waste water toxicity
Effluent Correlation coefficient for OP concentration
Untreated flowdown 0.72a
Bioloop™b treated flowdown
0.70
Flowdown, ex anaerobic pond
0.70
Settled rinse water 0.71
.
a Based on chronic toxicity to freshwater chironomids (Robinson and Scott 1995)b Based on a 0.01× Daphnia 48 hour EC50
Table 10. Toxicity and approximate no effect level for ectoparasiticides in fresh waters
Compound 48-hour EC50 Daphnia spp. (µg/L)
Proposed U.K. EQS or no effect level
Toxicity reference
Chlorfenvinphos 0.3 0.01 Tomlin 1994
Chlorpyriphos 0.8 van Wijngaarden et al. 1993; Tomlin 1994
Coumaphos 1.0 0.01 Tomlin 1994
Cyhalothrin 0.1 0.001 Hill 1989; Tomlin 1994
Cypermethrin 0.15 0.001 Tomlin 1994
Cyromazine 93 000 5.0a Tomlin 1994; Robinson and Scott 1995
Deltamethrin 0.04 0.001 Xiu et al. 1989
Diazinon 0.8 0.01 J Reeve, pers. comm., MAF, NZ, 1993
Diflubenzuron 7.1 0.03 Fischer and Hall 1992; Tomlin 1994
Ivermectin 0.025 0.0002b Bloom and Matheson 1993
Propetamphos 14.5 0.01 Tomlin, 1994

110Seeking agricultural produce free of pesticide residues
edited by I.R. Kennedy, J.H. Skerritt, G.I. Johnson and E. Highley ACIAR Proceedings No. 85e
(printed version published in 1998)
sludge phase of anaerobic digesters (and thus Bioloop™ and pond sludges) it was important to investigate the degradation of these compounds dur-ing composting.
Sludges from a Bioloop™ pilot plant were com-posted in the presence of wool waste and sawdust. Pes-ticides were quantified in solvent extractable ‘grease’ fractions of material before and after composting, as well as after curing. The results presented here (Table 13) are from a preliminary trial. It can be seen that the degree of degradation of each pesticide after compost-ing varied between samples. This variability was asso-ciated with variations in the operating conditions of the individual composts and the degree of biological activ-ity. After 8 weeks curing (sample HR2 cured 3/2; Table 13) virtually all the pesticides had been lost from the compost. At this stage it is not certain whether this loss was the result of degradation or leaching, as cur-ing piles were stored outside and leachate was not col-lected or analysed. However, given the low water solubility and high Kow values for these pesticides, and the high affinity they have for organic matter, it is
unlikely that leaching would result in significant loss of pesticides from the curing piles.
Marine toxicity
Most wool scours, indeed most sewage discharges in New Zealand, ultimately discharge into the marine environment. Unfortunately, the toxicity of pesticides to marine organisms is largely unknown. We have found, however, that the toxicity of many organic compounds, including pesticides, can be predicted based on their toxicity to the freshwater flea (Daph-nia spp.). The toxicity of organics to a typical marine organism (a mysid shrimp) has been shown (Fig. 1; Le Blanc 1984; P.W. Robinson, unpublished data) to be approximately twice that of the standard freshwa-ter test species (D. magna). This would suggest that the EQS values indicated in Table 10 need to be halved to adequately protect the marine environment.
Many of New Zealand’s municipal ocean outfalls are of essentially untreated effluent. In some cases wool scour effluent can represent a significant pro-portion of this effluent. The New Zealand Coastal Policy Statement of 1994 specifies an allowable mix-ing zone equivalent to a 200-fold dilution for ocean outfalls. In the worst case, one New Zealand scour contributes 8.1% of the average dry weather flow (ADWF) of a municipal sewage outfall and the efflu-ent receives no treatment other than on-site grease recovery. These figures, in addition to within-scour water consumption, can be used to calculate maxi-mum acceptable greasy wool limits and hence poten-tial compliance with allowable discharge amounts. Indications are that many New Zealand wool scours will have to invest in effluent treatment technology specifically to address the problems posed by the dis-charge of ectoparasiticide residues.
Table 14. Approximate half-lives for diazinon and chlorfenvinphos on crossbred and merino sheep at different times of the year
Half-life (days)
Time of year and type of sheep
Chlorfenvinphos Diazinon
Summer, crossbred
25 12
Winter, crossbred 39 32
Summer, merino 56 47
Note: Bromophos-ethyl, carbophenothion, cyhalothrin, coumaphos and deltamethrin were also analysed for but not detected.
Table 13. Percentage degradation of pesticides in material before and after four composting and curing trials (solvent extractable ‘grease’ fractions)
Sample name and date
Propetamphos Diazinon Dichlofenthion Chlorpyriphos Chlorfenvinphos Cypermethrin
HR1 composted 38 55 14 9 57 –24
HR2 composted 34 58 24 18 61
HR2 cured 21/11 70 100 84 68 89
HR2 cured 3/2 95 100 98 95 98
HR3 composted 80 84 58 67 89 54
HR4 composted 65 62 10 45 85 24

111Seeking agricultural produce free of pesticide residues
edited by I.R. Kennedy, J.H. Skerritt, G.I. Johnson and E. Highley ACIAR Proceedings No. 85e
(printed version published in 1998)
Shrimps
EC50 Daphnia (log µmol/L)
4.0000
y = 0.9772 x –0.2657R2 = 0.9321
3.0000
2.0000
1.0000
0.0000
–1.00004.00003.00002.00001.00000.0000–1.0000–2.0000–3.0000–4.0000–5.0000
–2.0000
–3.0000
–4.0000
–5.0000
Ectoparasiticide Residues and Overseas Legislation
Ectoparasiticide residues have the potential to be used as technical barriers to trade following the Uru-guay Round of the GATT talks. Ectoparasiticide resi-dues are both a market acceptance (consumer acceptance) and a market access issue. Consumers do not like the thought of the wool products they wear, or walk on, containing pesticide residues. It does not matter that the levels found in final products are well below accepted no-risk levels, and that the residues are, in all probability, not bioavailable. The European consumer is not aware of the need to treat animals on farms to prevent them suffering from ectoparasites. Two large consumer/industry groups in Europe have imposed very strict limits on pesticide residues in consumer goods. Most of these limits relate to orga-nochlorines, which are still used in some developing countries but are largely absent from New Zealand’s wool. The German Association for Environmentally Friendly Carpets, however, has also indicated that neither diazinon nor dichlofenthion should be present at ‘detectable concentrations’ in the final product. This is generally not a difficult condition for New Zealand producers to meet, but the Fernmark™ spec-ifies only 60% New Zealand wool content in a final product. The potential therefore exists for some Fernmark™ products to contain significant residues,
especially of diazinon, and particularly if poorly scoured wool from another source is used in the blend. In cases where this occurs it is the Fernmark™ reputation that may be damaged rather the component containing residues, a problem that may require stricter controls to be imposed over what wool can be blended into Fernmark™ branded products.
Ectoparasiticide residues on wool result in toxic scouring effluents and have potentially adverse effects on receiving waters. Both the U.K. and Europe have recognised this and enacted legislation that prescribes limits for ectoparasiticides on greasy or scoured wool to be processed. The U.K. legislation is based on an EQS approach using the values out-lined in Table 10; although the specific figure for cypermethrin may be 10 times lower than the figure indicated here for pyrethroids. By making allowances for removal during effluent treatment, and dilutions within the environment and the sewage system, the U.K. has indicated possible maximum acceptable greasy wool residues levels. These are:• 10 mg/kg for organophosphates• 1.0 mg/kg for pyrethroids, and• 3.1 mg/kg for diflubenzuron.
No limits have yet been set for cyromazine. WRONZ, in association with Wools of New
Zealand, surveys the national greasy wool clip annu-ally. Based on these surveys, we have an informed estimate of mean ectoparasiticide residue levels, and
Figure 1. The toxicity of organics to a typical marine organism (a mysid shrimp) Le Blanc 1984; P.W. Robinson, unpublished data).

112Seeking agricultural produce free of pesticide residues
edited by I.R. Kennedy, J.H. Skerritt, G.I. Johnson and E. Highley ACIAR Proceedings No. 85e
(printed version published in 1998)
these data can be used to calculate compliance with the above limits, assuming this wool is exported greasy. In general, crossbred wool has no trouble complying with the limits for organophosphates and diflubenzuron, but a proportion fails to comply with the limit for pyrethroids. It is believed the biggest problem with pyrethroid compliance is both late sea-son (long wool) applications for lice, and the use of some high strength cypermethrin formulations. Cypermethrin appears to have a very long half-life on wool which may restrict its use in the future; espe-cially if the U.K. persists in lowering the acceptance criterion for this compound.
Of much greater concern than residues on wool from crossbred sheep, are residues associated with the halfbred and merino sectors of the clip. Compli-ance with either the organophosphate or pyrethroid limit is low. Late season treatments, in particular autumn dipping followed by shearing before lambing in early spring, are the main problems but the lower degradation rate for ectoparasiticides on fine wool in comparison to coarse-woolled animals is also a factor (Table 14). Based on a review of the data available it appears as though the average half-lives for diazinon, chlorfenvinphos, and propetamphos on merinos, applied using either a plunge dip or jetting system, are 1.85 times longer than corresponding half-lives on Romney sheep (Rammell and Bentley 1989; Bur-man 1995; Burman and Edwards 1995; Burman and Strong 1995).
While the U.K. has set limits based on no observ-able effect levels in the freshwater environment, the Europeans have set discharge limits for different types of textile mills ostensibly to protect the marine environment. The European legislation has been formed as a result of several conventions collectively known as OSPARCOM (the Oslo, Paris conventions on the protection of the marine environment). OSPARCOM regulations set limits for chlorine and phosphorus-containing compounds, but they are based on a measure of total chlorine or phosphorus and not the toxicity of individual compounds. This may result in overly conservative limits for com-pounds having both chlorine and phosphorus moi-eties, and potentially ineffective control of highly toxic compounds, such as deltamethrin, that contain neither.
OSPARCOM limits are primarily concerned with late-stage processing, such as dyeing and finishing, rather than raw wool scouring. At present it appears that 90% of New Zealand’s scoured wool may com-
ply with these limits. Currently, non-compliance is associated with the presence of either chlorfenvin-phos or cypermethrin, owing to the persistence of these compounds. In fact, only 80% of scoured wool complies if chlorfenvinphos has been used in any one of the farm lots making up a commercial scouring package.
Conclusions
The dipping of sheep for the control of fly-strike and lice may result in both direct and indirect environ-mental contamination. Soil contamination may occur near dipping sites but this appears to be partially mit-igated by the stripping of the active compounds from the dip wash. The disposal of surplus dip wash from both shower and plunge dips is the most obvious form of environmental contamination. Disposal on to well-grassed flat land, well away from any surface waters, appears to be the easiest way of controlling this form of contamination but methods for treating excess dip wash are being evaluated. Wool-based fil-ter systems offer a possible solution and one that may be applied to other liquors containing pesticides, such as residual sprays and the like.
Ectoparasiticides remaining on wool at shearing result in the contamination of wool scouring efflu-ents. These effluents are toxic and, unless adequately treated, may have adverse effects on both the fresh-water and marine environments. Anaerobic destabili-sation followed by sludge composting offers a feasible and sustainable mechanism for dealing with these wastes.
Both the U.K. and Europe have recognised the tox-icity of ectoparasiticides and have imposed limits on residues on either greasy or scoured wool. While the criteria for scoured wool residues can generally be met, compliance with greasy wool residues may prove more difficult to achieve; especially for the finer wool in our clip. International pressure may see some com-pounds forced from the market. The British Labour Government has already signalled that it would like to see a ban on organophosphates and more recently it has been suggested that pyrethroids should also be withdrawn because of their high aquatic toxicity and suspected interference with the human endocrine sys-tem (Anon 1997). Removal of either, or both, of these classes of compounds would severely restrict ectopara-site control options for farmers and would significantly increase the cost of that control.

113Seeking agricultural produce free of pesticide residues
edited by I.R. Kennedy, J.H. Skerritt, G.I. Johnson and E. Highley ACIAR Proceedings No. 85e
(printed version published in 1998)
References
Agnihotri, N.P., Jain, H.K. and Gajbhiye, V.T. 1986. Persis-tence of some synthetic pyrethroids in soil, water and sediment - Part 1. Journal of Entomological Research, 10, 147–151.
Agnihotri, N.P., Jain, H.K., Gajbhiye, V.T. and Srivastava, K.P. 1989. Persistence of some synthetic pyrethroids and organophosphorus insecticides in soil, water and sedi-ment (Part II). Journal of Entomological Research, 13, 131–136.
Amato, J.R., Mount, D.I., Durhan, E.J., Lukasewycz, M.T., Ankley, G.T. and Roberts, E.D. 1992. An example of the identification of diazinon as a primary toxicant in an effluent. Environmental Toxicology and Chemistry, 11, 209–216.
Anon. 1997. Sheep dips poison river life. New Scientist, 11 January 1997.
Bloom, R.A. and Matheson III, B.V. 1993. Environmental assessment of avermectins by the US Food and Drug Administration. Veterinary Parasitology, 48, 281–294.
Burkhard, N. 1979a. Hydrolysis of CGA-72662 under labo-ratory conditions. Project report 17/79. Basle, Switzer-land, Ciba-Geigy Ltd.
— 1979b. Photolysis of CGA-72662 in aqueous solutions under artificial sunlight conditions. Project report 18/79. Basle, Switzerland, Ciba-Geigy Ltd.
Burman, S.L. 1995. Avcare Industry Task Force Report on Pesticide residues in greasy merino sheep: diazinon plus cypermethrin pour-on. Australia, Report No. 95/045, March 1995.
Burman, S.L. and Edwards, S. R. 1995. Avcare Industry Task Force Report on Pesticide residues in greasy merino sheep: chlorfenvinphos. Australia, Report No. 95/046, March 1995.
Burman, S.L. and Strong, M. 1995. Avcare Industry Task Force Report on Pesticide residues in greasy merino sheep: diazinon dipping and jetting. Australia, Report No. 95/044, March 1995.
Charleston, W.A.G., ed. 1985. Ectoparasites of sheep in New Zealand and their control. Massey University, New Zealand Veterinary Association Sheep and Beef Cattle Society.
Ferrando, M.D., Alarcón, V., Fernández-Casalderrey, A., Garnón, M. and Andreu-Moliner, E. 1992. Persistence of some pesticides in the aquatic environment. Bulletin of Environmental Contamination and Toxicology, 48, 747–755.
Fischer, S.A. and Hall, L.W. Jr. 1992. Environmental con-centrations and aquatic toxicity data on diflubenzuron (Dimilin). Critical Reviews in Toxicology, 22(1), 45–79.
Frank, R., Braun, H.E., Chapman, N. and Burchat, C. 1991. Degradation of parent compounds of nine organophos-phorus insecticides in Ontario surface and ground waters under controlled conditions. Bulletin of Environmental Contamination and Toxicology, 47, 374–380.
Gillespie, A.M. and Walters, S.M. 1986. HPLC silica col-umn fractionation of pesticides and PCB from butterfat. Journal of Liquid Chromatography, 9, 2111–2141.
— 1989. Semi-preparative reverse phase HPLC fraction-ation of pesticides from edible fats and oils. Journal of Liquid Chromatography, 12, 1687-–1703.
Greene, R. 1993. The development of improved methods for the multi-residue analysis of pesticides in wool process-ing wastes and products. M.Sc. thesis, Coventry Univer-sity, England.
Greene, R.V. and Wimbush, J.M. 1995. The extraction for chemical analysis of pesticide residues in wool and wool products. In: Proceedings of the 9th International Wool Textile Research Conference, 28 June–5 July 1995, Biella, Italy. Città degli Studi Biella and IWS, Italy.
Hill, I.R. 1989. Aquatic organisms and pyrethroids. Pesti-cide Science, 8, 305–319.
Hornsby, A.G., Wauchope, R.D. and Herner, A.E. 1996. Pesticide properties in the environment. New York, Springer-Verlag.
Jones, F.W. 1992. Multi-residue analysis of pesticides in wool grease and lanolin using gel permeation and gas chromatography. Geelong, Australia, CSIRO Division of Wool Technology Report, No. G75.
LeBlanc, G.A. 1984. Interspecies relationships in acute tox-icity of chemicals to aquatic organisms. Environmental Toxicology and Chemistry, 3, 47–60.
McBride, G.L. 1994. What’s cooking in the Hangi pit. In: Proceedings Solid Waste in the Pacific, common issues—common solutions. Waste Management Institute New Zealand Inc., Sixth Annual Conference, Christchurch.
Mestres, R. and Mestres, G. 1992. Deltamethrin: uses and environmental safety. Reviews of Environmental Con-tamination and Toxicology, 124, 1–18.
Muir, D.C.G., Rawn, G.P. and Grift, N.P. 1985. Fate of pyrethroid insecticide deltamethrin in small ponds: a mass balance study. Journal of Agricultural and Food Chemistry, 33, 603–609.
Mumma, R.O. and Bogus, E.R. 1981. The effects of 1, 10 and 100 ppm CGA-72662 on soil respiration. Switzer-land, Ciba-Geigy Ltd, 29 September 1981.
Peaker, S., Wimbush, J.M. and Demot, P.F.A. 1991a. A method for the analysis of organochlorine (oc) and organ-ophosphorus (op) pesticide residues in raw woolscouring effluents, greasy wool, woolgrease and wool products by gas chromatography. Laboratory Report RET-614. Ilkley, International Wool Secretariat.
— 1991b. A method for the chemical analysis of synthetic pyrethroid (sp) pesticide residues in raw woolscouring effluents and woolgrease/lanolin by gas chromatography. Laboratory Report RET-635. Ilkley, International Wool Secretariat.
Racke, K.D. 1993. Environmental fate of chlorpyrifos. Reviews of Environmental Contamination and Toxicol-ogy, 131, 1–150.

114Seeking agricultural produce free of pesticide residues
edited by I.R. Kennedy, J.H. Skerritt, G.I. Johnson and E. Highley ACIAR Proceedings No. 85e
(printed version published in 1998)
Rammell, C.G and Bentley, G.R. 1989. Decay rates of orga-nophosphate residues in the fleeces of sheep dipped for flystrike control. New Zealand Journal of Agricultural Research, 32, 213–218.
Rammell, C.G., Bentley, G.R. and Heath, A.G.C. 1988. Organophosphate residues in the wool of sheep dipped for flystrike control. New Zealand Journal of Agricultural Research, 31, 151–154.
Roberts, A.H.C., Cameron, K.C., Bolan, N.S., Ellis, H.K., and Hunt, S. 1996. Contaminants and the soil environ-ment in New Zealand. In: Naidu, R., Kookana, R.S., Oliver, D.P., Rogers, S. and McLaughlin, M.J., ed., Con-taminants and the soil environment in the Australa-sia–Pacific region. Proceedings of the first Australasia–Pacific Conference on Contaminants and Soil Environment in the Australasia–Pacific Region, Adelaide, 18-23 February 1996. London, Kluwer Aca-demic Publishers, 579–628.
Robinson P.W. 1995. The fate of cyromazine during wool-scouring and its effects on the aquatic environment. PhD thesis, Lincoln University, New Zealand.
Robinson, P.W. and Scott, R.R. 1995. The toxicity of cyro-mazine to Chironomus zealandicus (Chironomidae) and Deleatidium sp. (Leptophlebiidae). Pesticide Science, 44, 283–292.
Rouchard, J., Roucourt, P., Van de Steene, F., Pelerents, C., Gillet, J., Benoit, F. and Ceustermans, N. 1988. Fate of insecticide chlorfenvinphos in the soil of cauliflower fields. Bulletin of Environmental Contamination and Toxicology, 40, 47–53.
Scott, D., White, J.W., Rhodes, D.S. and Koomen, A. 1994. Invertebrate fauna of three streams in relation to land use in Southland, New Zealand. New Zealand Journal of Marine and Freshwater Research, 28, 277–290.
Takahashi, N., Mikami, N., Matsuda, T. and Miyamoto, J. 1985. Photodegradation of the pyrethroid insecticide cypermethrin in water and on soil. Journal of Pesticide Science, 10, 629–642.
Tomlin, C., ed. 1994. The pesticide manual, incorporating the agrochemicals handbook, 10th ed. Cambridge U.K., Royal Society of Chemistry and British Crop Protection Council.
van Wijngaarden, R., Leeuwangh, P., Lucassen, W.G.H., Romijn, K., Ronday, R., van der Velde, R. and Willigen-burg, W. 1993. Acute toxicity of chlorpyriphos to fish, a newt, and aquatic invertebrates. Bulletin Environmental Contamination Toxicology, 51, 716–723.
Xiu, R., Xu, Y. and Gao, S. 1989. Toxicity of the new pyre-throid insecticide, deltamethrin, to Daphnia magna. Hydrobiologia, 188/189, 411–413.

115Seeking agricultural produce free of pesticide residues
edited by I.R. Kennedy, J.H. Skerritt, G.I. Johnson and E. Highley ACIAR Proceedings No. 85e
(printed version published in 1998)
NOWADAYS, the demand for high quality food has become as important as the food supply itself. Food quality includes not only highly acceptable organo-leptic characteristics and nutritive value, but also the safety of the food. Food safety has been an important criterion of food quality of agricultural products, which includes freedom from chemical residues and contaminants such as antibiotics and pesticides. Pes-ticides, antibiotics, and other chemicals have been used intensively in agriculture to maximise produc-tion. In animal husbandry, antibiotics are used inten-tionally for disease treatment or growth promotion, while the exposure of animals to pesticides is mostly unintentional through contaminated feed (Sosromar-sono 1977; Prescott and Baggot 1988).
In a developing country such as Indonesia, the effort to reduce the use of pesticides and antibiotics through biological control and integrated pest man-agement has not yet had a significant impact. The amount of pesticides and antibiotics used in agricul-ture increases every year. The number of veterinary medicines registered in Indonesia increases every year. In 1991 there were 1281 registered veterinary
medicines, while in 1993 this had increased to 1378. Similarly, the amount of antibiotics used increases every year: it was 27 592 kg in 1992, which increased to 29 525 kg in 1993 (Wiryosuhanto 1994). The num-ber of pesticides registered and approved is also increasing every year (DEPTAN-RI 1997).
In the past few years there has been increasing con-cern over the extensive use of antibiotics in animal husbandry and their addition to animal feeds. Improper used of antibiotics in food-producing ani-mals has resulted in the presence of antibiotic resi-dues in animal products. Public concern on the hazards of pesticide contamination in food appeared earlier than concern about the hazards of antibiotic residues, probably because pesticides themselves are classified as toxic compounds, while antibiotics are not.
Human exposure to chemicals through food usu-ally occurs at low doses; acute illness rarely occurs. However, continuous low-level exposure to chemi-cal-contaminated food has been reported to cause cancer, allergies, hypersensitivity, and toxic effects. The most frequently reported allergic reactions was to β lactam antibiotic. It was reported that levels of penicillin as low as 5–10 IU are sufficient to produce an allergic reaction in sensitised humans (Paige et al.
Contamination of Animal Products by Pesticidesand Antibiotics
T.B. Murdiati, Indraningsih, and Sjamsul Bahri*
* Research Institute for Veterinary Science (Balitvet), Jalan Martadinata 30, Bogor 16114, Indonesia.
Abstract
Chemicals such as pesticides and antibiotics have been widely used in agriculture to improve product quality and output. However, over-use of those chemicals has caused contamination of animal products either directly or indirectly. While livestock is intentionally given antibiotics for disease treatment or for growth promotion, the exposure of pesticide to livestock usually comes from contaminated animal feed. Pesticide or antibiotic residues above the maximum residue limits are reported from a number of places in Indonesia. For food of animal origin, excessive antibiotic residues are reported more often than pesticide contamination.

116Seeking agricultural produce free of pesticide residues
edited by I.R. Kennedy, J.H. Skerritt, G.I. Johnson and E. Highley ACIAR Proceedings No. 85e
(printed version published in 1998)
1997). Other antibiotics such as tetracyclines, ami-noglycoside, and sulfonamide in a few cases may also cause allergic reactions in sensitised individuals. Prolonged used of antibiotics at low doses has led to antibiotic-resistant bacteria (Smith 1977; Bensink and Botham 1983). In 1968, the Swann Committee established by the British Government made a num-ber of important recommendations on the use of anti-biotics in animal husbandry and veterinary medicine. The recommendations were adopted and imple-mented by many other countries (Brander 1977; Bell 1986).
The degree of toxicity of pesticides to humans and other organisms differs considerably between each type of pesticide: a small amount of one pesticide might cause severe illness or even death, while larger quantities of another pesticide might have little or no effect, even if ingested. A pesticide might also have selective toxicity, causing death of one type of organ-ism, but having little or no effect on other types of organisms (Hassall 1987). Some pesticides degrade quickly on the crop and in the soil, whereas others may persist in one form or another for longer periods. These persistent pesticides, which are mostly lipo-philic, accumulate in animal fat and in particular tis-sues such as liver and kidneys, and the pesticide levels become higher than those in crops. Continuous consumption of either animal fat, liver, or kidney might caused serious health problems (Oudejans 1991).
Antibiotics in Food-producing Animals
In food-producing animals, antibiotics have therapeu-tic and non-therapeutic uses. Therapeutically, they are used for disease treatment and non-therapeuti-cally as growth promoters. Ideally, the choice of anti-biotic for disease treatment should be based on the identification and known sensitivity of the causal organism. However, in practice the treatment often does not wait for laboratory examination, as the aim is to return the acutely ill animals to optimal produc-tion as rapidly as possible. The infected animal might also spread the disease to other animals in the flock or herd. And, to achieve an effective therapeutic effect, antibiotics should be administered at a therapeutic dose rate (Bell 1986). Legally, antibiotics for disease treatment are available only on prescription, and only those antibiotics registered and approved are avail-able in the market. However, antibiotics are easily obtainable without any prescription.
As growth promoters, antibiotics are usually added to feed at low concentrations, below therapeutic dose rate. Antibiotics added to the feed of the growing ani-mal improve the growth rate and feed efficiency. The growth response of animals to antibiotics is a com-plex interaction of nutritional, physiological, and dis-ease factors. It varies with animal species, age, the feed environment, and other factors. The growth-pro-moting properties of antibiotics have led to improper use of antibiotics. Farmers have been using any anti-biotics available in the market, with no consideration for the hazards of those antibiotics to the animals or to the consumers of animal products.
When antibiotics are administered to food-produc-ing animals, the appropriate withholding period should be observed before the animal products are consumed. Withholding time is the time taken for the concentration of a drug to fall below the acceptable level after the last dose has been administered. The withholding time for drugs given to farm animals affects the presence of residues of the particular drug in the animal products. Thus, it is expected that no residue will be detected or the residue will be below the recommended maximum residue limit (MRL) if the animal products are consumed after the withhold-ing period. The withholding time is influenced by a number of factors, such as the dose rate, the dosage form of the drug, the route of the administration, the physical and chemical properties of the drug and the patho-physiological status of the animal (Baggot 1977; Debackere 1990). Table 1 lists the recom-mended use and withholding periods for antibiotics approved for use in food-producing animals in Indo-nesia.
Antibiotics added to animal feed have increased the exposure of animals to the antibiotics, as animals would be exposed to the antibiotics for their life time. Treatment with antibiotics should be terminated a few days before the animals are killed. In animals producing egg and milk, the products should not be consumed while the animals were on medication. In practice, for economic reasons, farmers have been selling all products, even those from animals which are under medication. Reports from Australia, the USA, and Indonesia indicated that most likely the appearance of antibiotic residues in animal products is the result of failure to observe withholding times (Herrick 1993; Spence 1993; Kusumaningsih 1996).
Like those antibiotics for medication, only antibi-otics registered and approved as feed additive are allowed to be marketed for that purpose. Table 2 lists

117Seeking agricultural produce free of pesticide residues
edited by I.R. Kennedy, J.H. Skerritt, G.I. Johnson and E. Highley ACIAR Proceedings No. 85e
(printed version published in 1998)
compounds approved as feed additives, classified as either non antibiotic and antibiotics (Anon. 1994). Attempts to minimise production costs, have led farmers to use the cheapest antibiotics available on the market. For example, chloramphenicol is used despite the fact that it is banned for use in food-pro-ducing animals. Exposure to even small quantities of chloramphenicol may result in fatal aplastic anaemia in such animals. Nevertheless, chloramphenicol remains the drug of choice for treating certain dis-eases, especially typhoid, where the advantages appear to outweigh the potential risk (Bell 1986).
Pesticides in Food-producing Animals
Farm animals are usually exposed to pesticides unin-tentionally through contaminated animal feed, or a contaminated environment in which the animals were raised. Pesticide contamination of animals products due to direct application of pesticides to the animals
for disease treatment is very rare. Ticks, flies, and scabies are the common animal disease usually treated with pesticides. However, in Indonesia, the use of pesticides to control livestock diseases is not common (Sosromarsono et al. 1977).
In Indonesia, as in most other countries, pesticides are more extensively used in crop production than in other areas of agriculture. The intensification program for crop production has brought an increased use of pesticides. Furthermore, efforts to reduce production cost in crop farming have caused more intensive use of pesticides. As a result crop products have been con-taminated and some of these products then used as animal feed ingredients. The use of pesticides in stored products is another possible sources of crop contami-nation with pesticides. A report from the Diagnostic Laboratory of Balitvet supports this argument (Table 3). Feed factories or individual farms sent samples for pesticides analysis only if contamination was sus-pected (Indraningsih and Yuningsih 1995).
Table 1. Recommended usage and withholding period for antibiotics registered for food-producing animals in Indonesia
Antibiotic Form Animal species Withholding period (days)
Ampicillin injectableinjectable
poultrycattle
5 6
Amprolium oral cattle 1
Dihydrostreptomycin injectableinjectable
cattlepigs
30 30
Streptomycin oral oral
poultrycattle
4 2
Furazolidone oraloral
poultrypigs
5 5
Nitrofurazon oraloral
poultrypigs
5 5
Carbadox oral pigs 70
Chlortetracycline injectable poultry 15
Oxytetracycline injectable poultry 15
Tetracycline injectableoral
poultrycattle
15 5
Penicillin G injectableinjectable
cattlepoultry
5 5
Penicillin + streptomycin injectableinjectable
cattlepigs
30 30
Erythromycin injectableinjectable
pigscattle
7 14
Sulfonamides oral cattle 7–15
Monensin oral poultry 3
Tylosine oral pigs 2

118Seeking agricultural produce free of pesticide residues
edited by I.R. Kennedy, J.H. Skerritt, G.I. Johnson and E. Highley ACIAR Proceedings No. 85e
(printed version published in 1998)
When pesticides are deliberately added to stored crops, the chance of pesticide residues being present is higher than the use of pesticides during the growth of the crops. In addition to the type of application, the type of pesticides applied would also affect the pres-ence of residues in the crop products. A great many types of pesticides are available, each type having different physical and chemical properties. Some pes-ticides are quite persistent, while others degrade rap-idly. Farmers lacking education and knowledge, especially in developing countries, invariably choose the cheapest available pesticide rather than the safest ones. About half of the poisoning cases and nearly three quarters of the human deaths due to pesticides are estimated to occur in developing countries, although they use only 20% of the total world pesti-cides (Oudejans 1991).
Antibiotic and Pesticide Contamination Animal products contaminated with antibiotics and pesticides have been reported not just from Indone-sia, but also from developed countries (Spence 1993; Nakazawa 1995; Gibbons et al. 1996). This suggests that there is global concern on the health impact of chemical residues in food. Consumers are concerned more than ever before about the quality and safety of food products, including food of animal origin. Food safety concerns not only consumers, but also veteri-narians, producers, processing facilities, and regula-tory officials throughout the world (Riviere 1991; Stenholm and Waggoner 1992; Angulo 1996).
A study was conducted by the Food Safety and Inspection Service of the United States Department of Agriculture to describe patterns of chemical resi-due violations in beef in 12 states of the USA during 1991, 1992, and 1993. The total number of violations fell during the 3 years studied. However, the residues in beef from slaughtered dairy cows increased. In 1991, there were 3249 residues found in 2734 car-casses, in the second year 3132 violative residues were found in 2813 carcasses and, in 1993, there were 2317 violative residues were found in 2051 car-casses. Neomycin was the most frequently identified chemical residue, followed by tetracycline, gentamy-cin, oxytetracycline, and penicillin (Gibbons et al. 1996).
Balitvet (1990) found residues of oxytetracycline in 65 of 93 chicken meat samples, and 35 of the sam-ples were contamined above the recommended MRL. Chicken meat was collected from slaughterhouses in West Java and the Jakarta area (Table 4). Analyses were carried out only for tetracycline and sulfona-mide residues. Pesticide contamination of chicken meat was also reported from the same study. How-ever, although contamination by pesticides was detected, there was no sample with a pesticide level above the MRL. Field studies of farms in West Java found that different types of antibiotics were heavily used on poultry farms (Murdiati and Bahri 1991). Tetracycline residues and sulfonamides were also reported in chicken meat sold in the market in Bali and Kalimantan (Dewi et al 1996; Anon.1996).
While antibiotic tetracyclines have been widely used in poultry farming, β lactams are the antibiotics most widely used in dairy farming in Indonesia. Peni-cillin residues were detected in fresh milk collected from farmers and milk men in West Java, and in pas-teurised milk from the supermarkets. Residues of penicillin were detected in 43% of 31 pasteurised
Table 2. Compounds approved for use as feed additives for food-producing animals in Indonesia.
Non antibiotics Antibiotics
Aklomide Zinc bacitracin
Amprolium Virginiamycin
Buthinorate Flavomycin
Clopidol Hygromycin
Dequinate Monensin
Ethopabate Salinomycin
Levamisole Spiramycin
Piperazine Kitasamycin
Tetramisole Tylosin
Robenidin Lasalocid
Roxarsone Avilamycin
Sulfachlorpyridazine Avoparcin
Sulfadimethoxine Envamycin
Sulfanitrane Colistine
Sulfaquinoxaline Lincomycin
Buquinolate Maduramycin
Nitrofurasone Narasin
Furasolidone Natacyn
Phenothiazine
Halquinol
Pirantel tartarte
Olaquindox
Aluminum silicate
Nitrovin
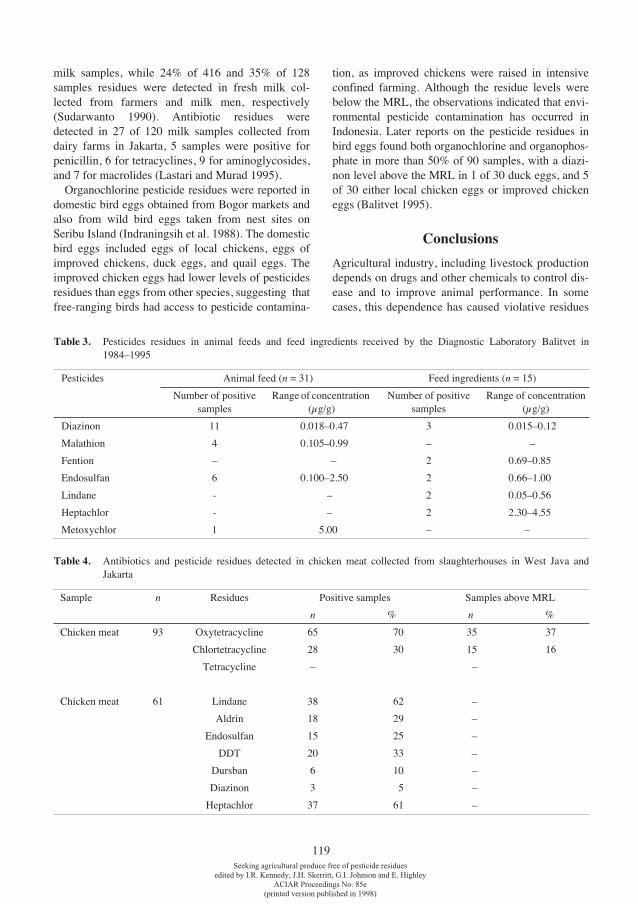
119Seeking agricultural produce free of pesticide residues
edited by I.R. Kennedy, J.H. Skerritt, G.I. Johnson and E. Highley ACIAR Proceedings No. 85e
(printed version published in 1998)
milk samples, while 24% of 416 and 35% of 128 samples residues were detected in fresh milk col-lected from farmers and milk men, respectively (Sudarwanto 1990). Antibiotic residues were detected in 27 of 120 milk samples collected from dairy farms in Jakarta, 5 samples were positive for penicillin, 6 for tetracyclines, 9 for aminoglycosides, and 7 for macrolides (Lastari and Murad 1995).
Organochlorine pesticide residues were reported in domestic bird eggs obtained from Bogor markets and also from wild bird eggs taken from nest sites on Seribu Island (Indraningsih et al. 1988). The domestic bird eggs included eggs of local chickens, eggs of improved chickens, duck eggs, and quail eggs. The improved chicken eggs had lower levels of pesticides residues than eggs from other species, suggesting that free-ranging birds had access to pesticide contamina-
tion, as improved chickens were raised in intensive confined farming. Although the residue levels were below the MRL, the observations indicated that envi-ronmental pesticide contamination has occurred in Indonesia. Later reports on the pesticide residues in bird eggs found both organochlorine and organophos-phate in more than 50% of 90 samples, with a diazi-non level above the MRL in 1 of 30 duck eggs, and 5 of 30 either local chicken eggs or improved chicken eggs (Balitvet 1995).
Conclusions
Agricultural industry, including livestock production depends on drugs and other chemicals to control dis-ease and to improve animal performance. In some cases, this dependence has caused violative residues
Table 3. Pesticides residues in animal feeds and feed ingredients received by the Diagnostic Laboratory Balitvet in
1984–1995
Pesticides Animal feed (n = 31) Feed ingredients (n = 15)
Number of positive samples
Range of concentration (µg/g)
Number of positive samples
Range of concentration(µg/g)
Diazinon 11 0.018–0.47 3 0.015–0.12
Malathion 4 0.105–0.99 – –
Fention – – 2 0.69–0.85
Endosulfan 6 0.100–2.50 2 0.66–1.00
Lindane - – 2 0.05–0.56
Heptachlor - – 2 2.30–4.55
Metoxychlor 1 5.00 – –
Table 4. Antibiotics and pesticide residues detected in chicken meat collected from slaughterhouses in West Java and Jakarta
Sample n Residues Positive samples Samples above MRL
n % n %
Chicken meat 93 Oxytetracycline 65 70 35 37
Chlortetracycline 28 30 15 16
Tetracycline – –
Chicken meat 61 Lindane 38 62 –
Aldrin 18 29 –
Endosulfan 15 25 –
DDT 20 33 –
Dursban 6 10 –
Diazinon 3 5 –
Heptachlor 37 61 –

120Seeking agricultural produce free of pesticide residues
edited by I.R. Kennedy, J.H. Skerritt, G.I. Johnson and E. Highley ACIAR Proceedings No. 85e
(printed version published in 1998)
in animal products, especially if the chemicals were used improperly.
Antibiotic residues were detected more often than pesticide residues, since animals are deliberately exposed to antibiotics, while the exposure to pesti-cides is usually unintentional through a contaminated environment.
Public concerns are continuously growing on the pesticides and antibiotics contamination of animal products, and other aspects of food safety of animal origin.
Consideration of food safety and quality must start at the farm and receive attention at all stages in the food chain of animal products. All segments of the food industry, the regulatory officers, and the scien-tific communities have attempted to reduce the poten-tial problem of food safety.
The hazard analysis critical control point (HACCP) approach has been a promising concept for control-ling contamination of food.
References
Angulo, F.J. 1996. Food safety symposium: responding to the changing epidemiologic characteristic of food borne disease. Journal of American Veterinary Medical Associ-ation, 208(9), 1396–1404.
Anon. 1994. Hati hati menggunakan feed additive. Infovet, 014, 9–14.
— 1996. Laporan kegiatan program monitoring residu tahun 1995/1996. District Investigation Centre, Banjarbaru, Kalimantan Selatan.
Baggot, J.D. 1977. Principle of drug disposition in domestic animals. Philadelphia. W.B. Saunders, 238p.
Balitvet 1990. Report on Penelitian residu pestisida, hor-mon, antibiotika, dan standarisasi kualitas broiler untuk ekspor. Pusat Penelitian dan Pengembangan Peternakan, Departemen Pertanian, 37p.
— 1995. Report on Residu pada daging dan teklur dan upaya penanggulangnya. Pusat Penelitian dan Pengem-bangan Peternakan, Departemen Pertanian, 22p.
Bell, I. 1986. Rational chemotherapeutics. In: Poultry health, proceedings of Australian Veterinary Association, 23–26 May 1986, Sydney. Proceedings No 92, 429–467.
Bensink, J.C. and Botham, F.P. 1983. Antibiotic resistant coliform bacilli, isolated from freshly slaughtered poultry and from chilled poultry at retail outlets. Australian Vet-erinary Journal, 60, 80–83.
Brander, G.C. 1977. The use of antibiotics in the veterinary field in the 1970s. In: Antibiotics and antibiosis. London, Butterworths, 199–209.
Debackere, M. 1990. Veterinary medicine products : their pharmacokinetics in relation to the residue problem.
Euroresidues Proceedings, 21–23 May 1990, Noordwijk-erhout, The Netherlands, 326–395.
DEPTAN-RI. 1997. Pestisida untuk Pertanian dan Kehu-tanan. Komisi Pestisida, Departemen Pertanian
Dewi, A.A.S., Dharma, D.M.N. and Supartika, I.K.E. 1996. Survei residu obat golongan.
Gibbons, S.N., Kaneene, J.B. and Lloyd, J.W. 1996. Pat-terns of chemical residues detected in US beef carcasses between 1991 and 1993. Journal of American Veterinary Medical Association, 209, 589–593.
Hassall, K.A. 1987. The chemistry of pesticides. London, ELBS, 372p.
Herrick, J.B. 1993. Food for thought for food animal veteri-narians. Violative drug residues: the record of food ani-mal practitioners looks good. Journal of American Veterinary Medical Association, 203, 1122–1123.
Indraningsih., Maryam, R., Milton, R. and Marshall, R.B. 1988. Penyakit Hewan, 20, 98–100.
Indraningsih. and Yuningsih. 1995. Residu pestisida pada bermacam macam sampel diagnosis di bagian toksikologi Balitvet. Proceeding Seminar Nasional Peternakan dan Veteriner, Bogor, 7–8 November 1995, Pusat Penelitian dan Pengembangan Peternakan, Departemen Pertanian, 983–989.
Kusumaningsih, A., Murdiati, T.B. and Bahri, S. 1996. Pengetahuan peternak tentang waktu henti obat dan hubungannya dengan residu antibiotika pada susu. Media Kedokteran Hewan, 12, 260–267.
Lastari, P. and Murad, J. 1995. Residu antibiotika dalam air susu sapi dari peternakan di Jakarta. Cermin Dunia Kedokteran, 103, 15–18.
Murdiati, T.B. and Bahri, S. 1991. Pola penggunaan antibi-otika dalam peternakan ayam di Jawa Barat, kemungki-nan hubungan dengan masalah residu. Proceeding Kongres Ilmiah ke 8 ISFI, Jakarta, 4–6 November 1991.ISFI, 445–448.
Nakazawa, H. 1995. Overview of antibiotics used for agri-culture and residual analysis in Japan. In: Oka, H., Naka-zawa, H., Harada, K. and MacNeil, J.D., ed., Chemical analysis for antibiotics used in agriculture. Arlington, AOAC International, 31–46.
Oudejans, J.H. 1991. Agro pesticides. Bangkok, ESCAP, 329p.
Paige, J.C., Tollefson, L. and Miller, M. 1997. Public health impact on drug residues in animal tissues. Veterinary Human Toxicology, 39, 162–169.
Prescott, J.F. and Baggot, J.D. 1988. Antimicrobial therapy in veterinary medicine. Boston, Blackwell Scientific Pub-lication, 367p.
Riviere, J.E. 1991. Pharmacologic principles of residue avoidance for veterinary practitioners. Journal of Ameri-can Veterinary Medical Association, 198, 809–816.
Smith, H.W. 1977. Antibiotics resistance in bacteria and associated problems in farm animals before and after the 1969 Swann Report. In: Antibiotics and antibiosis. Lon-don, Butterworths, 344–357.

121Seeking agricultural produce free of pesticide residues
edited by I.R. Kennedy, J.H. Skerritt, G.I. Johnson and E. Highley ACIAR Proceedings No. 85e
(printed version published in 1998)
Sosromarsono, S., Wardojo,S. and Sorjani, M. 1977. Pesti-cide use in Indonesia. Proceedings Southeast Asian Workshop on Pesticide Management, Bangkok, 14–16 March, SEAMEO–Kasetsart University, Bangkok, 53–63.
Spence, S. 1993. Antimicrobial residue survey, 27 October 1992. Perspective, 18, 78–82.
Stenholm, C.W. and Waggoner, D.B. 1992. Moving beyond the rhetoric of food safety and meeting the challenge. Journal of American Veterinary Medical Association, 201, 234–239.
Sudarwanto, M. 1990. Residu antibiotika didalam susu dit-injau dari kesehatan masyarakat veteriner. Proceeding Penggunaan Antibiotika Dalam Kedokteran Hewan, Jakarta, 9 Januari 1990, Perhimpunan Dokter Hewan Indonesia.
Wiryosuhanto, S. 1994. Sistem pengawasan obat hewan dalam sistem kesehatan hewan nasional. Farmazoa, 03,1–26.

122Seeking agricultural produce free of pesticide residues
edited by I.R. Kennedy, J.H. Skerritt, G.I. Johnson and E. Highley ACIAR Proceedings No. 85e
(printed version published in 1998)
AFTER Japan and the USA, the European Union (E.U.) is the largest producer of chemicals in the world. Historically, there are differences in the national policies on chemicals in the E.U. member countries. In order to improve the internal market harmonisation of the various national approaches is taking place. This has resulted in a myriad of E.U. directives and regulations dealing with the safe pro-duction, use, import, storage, transport, and disposal of chemicals in order to protect humans and the envi-ronment. Human health (workers, consumers, indi-rect exposure of people through the environment) and ecosystem health have now received equal attention.
During the past decade there have been many developments in the area of risk assessment, e.g. within the Organisation of Economic Co-operation and Development (OECD) and the E.U.. In the E.U. there are several legislative instruments regarding
new chemicals (the seventh amendment to Directive 67/548/EEC), existing chemicals (E.C. Council Reg-ulation 793/93), plant protection products (Directive 91/414/EEC), and biocides (in preparation). Risk assessment in the E.U. involves three parties, i.e. the European Commission (policy co-ordination), the Member States (responsible for risk assessments and enforcement), and the producers and importers (sub-mission of data). This three-party process requires an open, transparent process of communication and co-ordination. Academia plays a role in risk-assessment-related research. A short description of these regula-tory frameworks is provided by Vermeire and Van Der Zandt (1995) and Van Leeuwen et al. (1996a).
A harmonised approach is needed for the assess-ment of new chemicals and the approximately 100 000 existing chemicals, including pesticides and biocides. An important instrument for the notification and evaluation of new and existing chemicals is the technical guidance document (TGD). The TGD con-tains methodologies for the toxicological and ecotox-icological risk assessment of new and existing chemicals (Commission of the European Communi-ties 1996). This guidance takes the form of detailed
Approaches to Risk Assessment of Chemicalsin the Environment
C.J. Van Leeuwen*
* Research Institute of Toxicology (RITOX), University of Utrecht, P.O. Box 80176, 3508 TD Utrecht; and Centre for Substances and Risk Assessments, National Institute of Public Health and the Environment, Bilthoven, The Netherlands.
The methodologies to assess the risks of chemicals in the European Union (EU) are generic and may include local and regional assessments. For realistic site-specific analyses of risks of contaminants in water, soil, and air, more refined models are needed. Models must be as simple as possible and as complex as needed. The bottleneck for risk assessment is the lack of adequate data on the production, use, disposal, fate, and effects of chemicals. Even for well-known pollutants, most of the environmental quality criteria for water are based on a few acute toxicity data for fish, daphnids, and algae. The situation is even worse for aquatic sediments and soil, despite the enormous costs involved in clean-up operations. The scientific justification of quality standards and the financial consequences these may have are unbalanced. In some areas in the Netherlands, pesticide concentrations in rain are acutely toxic to aquatic life. Drinking water quality standards are exceeded in some cases. It illustrates the need to further explore the fluxes of chemicals in the air and their ecological consequences in, for example, shallow surface waters and top soils. For the monitoring of mixtures of chemicals in surface waters integrated approaches are needed.

123Seeking agricultural produce free of pesticide residues
edited by I.R. Kennedy, J.H. Skerritt, G.I. Johnson and E. Highley ACIAR Proceedings No. 85e
(printed version published in 1998)
descriptions in terms of data needs, release estima-tion, fate parameters, exposure models, and effect models. This guidance is seen as the state of the art. Deviation from this guidance remains possible, pro-vided that clear further information or explanation is submitted. The TGD has been developed in close co-operation between the European Commission, the chemical industry, and the E.U. member states (Com-mission of the European Communities 1996). It should be noted that the TGD and all other risk assessment procedures, contain numerous science-policy decisions (Milloy et al. 1994).
A recent development is a European Union Sys-tem for the Evaluation of Substances (EUSES 1996), based on the TGD. EUSES is a simple, straightfor-ward, and transparent set of risk-assessment method-ologies, recognising: (a) the limited data sets usually available; (b) the accuracy and variability of these data; and (c) the uncertainties in many of the assump-tions. A new version of EUSES will be developed during 1988. It will include risk assessment method-ologies for plant protection products and biocides. A standardised approach for ecological risk assessment (ERA) and human health risk assessment has three advantages:1. Risk assessment is accompanied by complete
transparency of methods, assumptions, and uncer-tainties. Risk assessments become predictable and their mutual acceptance will increase, leading to an increased co-operation and ‘sharing the burden’.
2. Conditions are created for regular methodological improvements and adaptations on the basis of both scientific and legislative developments.
3. Time and money can be spent more effectively on ‘priority chemicals’, chemicals for which in-depth ERA and expert judgment are required.In this paper, only four aspects of chemical risk
assessment will be discussed, i.e. (a) the generic nature of risk assessment methodologies described in the TGD and its role in aquatic ecosystem manage-ment, (b) the data gap problem in deriving environ-mental quality criteria for water, aquatic sediments and soil, (c) the importance of dry and wet deposition from air and the impact on water quality, and (d) approaches to the determination of mixture toxicity.
The Generic Nature of Risk Assessment
The TGD (Commission of the European Communi-ties 1996) is comprised of the following elements: a standardised minimum data set (the so-called base-
set) which contains (short-term) toxicity and ecotox-icity data, basic physicochemical data, use informa-tion, and import/production data. A standardised realistic worst-case emission scenario is used by applying emission scenarios for ‘use categories’ based on use-specific emission patterns and emission factors. PECs are determined for local and regional circumstances using multimedia exposure models. These models operate by simplifying environmental media— air, water, soil, sediment, and biota—into homogeneous compartments or boxes and then track-ing movement, degradation, and accumulation of chemicals from box to box. The TGD also contains modules for indirect exposure of humans through the environment (via drinking water, fish, plants, milk, and meat). Geographic, hydrological, and climatic variability are excluded in these exposure models as ‘standardised environments’ are used for the expo-sure calculations. For instance, it is assumed that 70% of the waste water passes through sewage treatment plants. For the regional PEC a Mackay Level-III model is used.
Procedures for assessment of chemical effects are also provided in the TGD. Extrapolation factors and methodologies are clearly described. Estimation methodologies, i.e. quantitative structure–activity relationships (QSARs) and a critical assessment of their limitations are given for physicochemical parameters, (bio)degradation, sorption, and (eco)tox-icity data. Bioconcentration in fish and earthworms is used to estimate biomagnification. Two routes are considered: water –fish–fish-eating mammal or fish-eating bird, and soil–earthworm–worm-eating bird or mammal. For most existing chemicals, lack of data is the rule not the exception. Often, basic physicochem-ical properties, monitoring data, and toxicological information are not available (Van Leeuwen 1992, Van Leeuwen et al. 1996a). Because of the lack of data, assessment of effects in soil and sediments will often be based on the principle of equilibrium-parti-tioning between water and sediments and soil, respectively (Di Toro et al. 1991).
The shortcomings of this generic approach for eco-logical risk assessment (ERA) are obvious. Many ecological aspects are neglected. Numerous assump-tions and arbitrary decisions are made to arrive at a risk characterisation for humans and ecosystems. These include assumptions concerning equilibrium partitioning, instantaneous mixing in the compart-ments of the exposure model, simplistic representa-tions of aquatic and terrestrial ecosystems,

124Seeking agricultural produce free of pesticide residues
edited by I.R. Kennedy, J.H. Skerritt, G.I. Johnson and E. Highley ACIAR Proceedings No. 85e
(printed version published in 1998)
simplifications of exposure, and the use of only a few biomagnification routes. Probably the greatest uncer-tainties are related to actual emissions of industrial chemicals during the various stages in their life cycle, with little known about the actual use pattern of industrial chemicals. The use of product registers can only partly overcome this problem. For agricultural pesticides this lack of knowledge is less problematic, as crop-specific dosages are known, leading to better prediction of the actual emissions of pesticides
The enormous variations in climatic (e.g. tempera-ture and precipitation), hydrological, and geographic (e.g. soil type) conditions, and the variability in actual measures and techniques to reduce emissions or treatment of waste (water) are captured by assum-ing ‘average’ values. This implies that the ERA methods developed in the E.U. are focused on the assessment of ‘generic risks of chemicals in the E.U.’. They are not suitable to assess site-specific or actual risks (Van Leeuwen et al. 1996a). For these questions—which are entirely different—more sophisticated models are needed. However, more sophisticated models will greatly increase the data requirements and thus the costs for authorities and industry. Even then, complete reduction of uncertain-ties is impossible. The quotation to be used here is the one from Aristotle: ‘It is the mark of an instructed mind to rest easy with the degree of precision which the nature of the subject permits and not to seek an exactness where only an approximation of the truth is possible.’
Deriving Environmental Quality Criteria
According to the OECD (1989) assessment of the effects of chemicals follows a tiered system in which preliminary, refined, and comprehensive stages can be distinguished. For the derivation of predicted no effect levels (PNECs) for chemicals on the basis of limited ecotoxicological data, assessment factors are used. These assessment factors are modifications of assessment factors which were originally developed by the United States Environment Protection Agency (EPA). Limited ecotoxicological data include esti-mates on the basis of QSARs, short-term toxicity data on fish, daphnids, and algae, and a few (less than 4) long-term toxicity data (Table 1). Refined effects assessment is applicable in case more than four no observed effect concentrations (NOECs) are avail-able. In this case, statistical extrapolation methodolo-gies may be used, e.g. the one developed by
Aldenberg and Slob (1993). Comprehensive risk assessment is applicable in cases where reliable field tests are available. This information is rarely avail-able (Van Leeuwen et al., 1994). In order to derive PNECs for aquatic sediments and soil it is preferable to use sediment and soil-dwelling organisms. Since this ecotoxicological information is rarely available, the PNECs are estimated on the basis of the equilib-rium-partitioning (EP) between water and sediment or soil. Van Leeuwen (1995) gives a detailed descrip-tion of the extrapolation techniques and the equilib-rium-partitioning.
a Detailed explanation is given in the Technical Guidance Docu-ment (Commission of the European Communities 1996).
b Reviewed on a case-by-case basis.
In order to illustrate the current attributes of envi-ronmental quality criteria, an inventory was made of ecotoxicological data available for well-known chemicals, i.e., 17 metals, 10 polycyclic aromatic hydrocarbons, 45 volatile chemicals, and 78 pesti-cides. The data were obtained from the project ‘inte-grated environmental quality’ in the Netherlands. Five data categories were distinguished (the extrapo-lation methodologies are given in parentheses):a) fewer than four short-term ecotoxicity data (EPA);b) more than three NOECs (A&S);c) no data or not determined (ND);d) EP using fewer than four short-term aquatic data
(EP/EPA);e) EP using more than three aquatic NOECs
(EP/A&S).
Table 1. Assessment factors to derive a PNEC (Commission of the European Communities 1996)
Available information Assessment factora
At least one short-term L(E)C50 from each of three trophic levels of the base-set (fish, Daphnia and algae)
1000
One long-term NOEC (either fish or Daphnia)
100
Two long-term NOECs from species representing two trophic levels (fish and/or Daphnia and/or algae)
50
Long-term NOECs from at least three species (normally fish, Daphnia and algae) representing three trophic levels
10
Field data or model ecosystems xb

125Seeking agricultural produce free of pesticide residues
edited by I.R. Kennedy, J.H. Skerritt, G.I. Johnson and E. Highley ACIAR Proceedings No. 85e
(printed version published in 1998)
The results of this inventory are presented graphically in Figure 1. It can be concluded that, even for well-known chemicals, most of the PNECs are based on short-term ecotoxicity data. Note too that about 15% of the chronic toxicity of the chemicals is estimated on the basis of QSARs. In fact, most of the environ-mental quality criteria are based on PNECs using pre-liminary effects assessments. For soil and sediment, many standards are based on very few toxicological tests. In order to overcome this problem the concept of equilibrium partitioning is applied and this is prob-ably the best we can at the moment, but it is certainly not scientifically justified for many chemicals. More-over, many species in soil are exposed in a totally dif-ferent manner. It is clear that some investment in refined effects assessment would lead to more realis-tic standards. When we compare this with the enor-mous costs of soil and sediment clean-up (this is approximately one-third of the Netherland’s national environment budget) it can be concluded that the sci-entific justification of quality standards and the finan-cial consequences this may have, are unbalanced.
Figure 1. Data availability for the derivation of PNECs for 150 chemicals: Aldenberg and Slob (1993); EP/EPA; EP/Aldenberg and Slob; EPA; no data. See text for details.
Deposition and Water Quality
In 1994, the Province of South-Holland published a report on the occurrence of pesticides in rain (Provin-cie Zuid-Holland, 1994). These monitoring data were compared with environmental quality criteria for drinking water and ecotoxicological data published in the literature. From these data it appeared that the concentrations in rain were high. The concentrations of dichlorvos, parathion, and endosulfan exceeded
the lowest LC50-values obtained from short-term lab-oratory studies (Table 2). For dichlorvos, the mean and maximum concentrations exceeded the LC50 by factors of 3 and 14, respectively. At some places in the Netherlands rain is acutely toxic to aquatic life and adverse effects at the ecosystem level cannot be excluded. Concentrations of dichlorvos and parathion in rain exceed the drinking water standards of 0.1 µg/L, whereas for endosulfan, the highest concentra-tions measured equalled the drinking water standards. Very often, pesticide concentrations in rain are higher than their concentrations in surface water.
Similar observations were made in other places in the Netherlands (Heemraadschap Fleverwaard 1993). They can be explained on the basis of the use and emission patterns of the pesticides and their environ-mental distribution. On the basis of the inventory of emissions of pesticides to water, soil, and air, it appeared that the emissions to air account for approx-imately 96% of total emissions (Table 3).
Surface waters, which receive 1.5% of all emis-sions, are the most frequently monitored environ-mental compartment. Direct emissions to surface water still cause some problems. The soil compart-ment, including groundwater, receives 2.3% of all
100
80
60
40
20
0water soil sediment
Per
cent
age
of to
tal
Table 2. Quotients of the mean and maximum concentrations measured in rain and the lowest LC50-value reported in the literature for three pesticides (De Poorte en Van Leeuwen 1997).
Chemical Quotient of mean concentration in rain and the lowest LC50
Quotient of maximum concentration in rain and the lowest LC50
Dichlorvos 3.4 14.3
Parathion 0.8 8.3
Endosulfan 0.2 1.5
Table 3. Emissions of pesticides in 1995 expressed as active ingredient (Commissie van Deskundigen 1996)
Compartment Emission (tonnes active ingredi-
ent/year)
Percentage
Soil 41 1.3
Groundwater 26 0.8
Surface water 46 1.5
Air 3090 96.4
Total 3203 100

126Seeking agricultural produce free of pesticide residues
edited by I.R. Kennedy, J.H. Skerritt, G.I. Johnson and E. Highley ACIAR Proceedings No. 85e
(printed version published in 1998)
emissions. These compartments are monitored less frequently. Concentrations of pesticides in air and rain are not monitored on a routine basis. The ecolog-ical effects of dry and wet deposition of pesticides on shallow surface waters or topsoils, are hardly known. The same is true for industrial chemicals.
The occurrence of pesticides at acutely ecotoxic levels in rain suggests that biodiversity may be adversely affected, even in nature reserves. It shows the need to restrict the use of mobile, persistent, and ecotoxic pesticides. In the Netherlands, it is con-cluded that only 5% of the pesticides cause about 95% of the environmental problems. This offers a good opportunity for further sanitation and environ-mental improvement.
This example shows the relatively high importance of diffuse pollution and transboundary transport of chemicals. The importance of these transport routes has received attention, for example at the last minis-terial conference on the North Sea. Nevertheless, the magnitude of the fluxes of many chemicals and their ecological effects still need to be explored in greater detail.
Approaches to the Toxicity of Mixtures of Chemicals
Much of the information available on the ecotoxicity of substances relates to single chemicals tested under laboratory conditions. Yet, it is unusual to find an aquatic ecosystem which is polluted by just a single toxicant. Mixture toxicity has received considerable attention by the European Inland Fisheries Advisory Commission (1987). Several reviews have been pub-lished, e.g. Calamari and Vighi (1991 and Hermens (1989). Based on the results of mixture toxicity stud-ies carried out with aquatic organisms it can be con-cluded that the concept of additivity of the effects must be taken into account in the derivation of water quality criteria. Recently an attempt was made to summarise the options to deal with the problem of mixture toxicity (Van Leeuwen et al. 1996b). These options are summarised in Table 4.
One of the approaches presented in Table 4, i.e. group parameters, may be less familiar. The so-called group, or surrogate, parameter approach is an analytical procedure that is able to quantify the total
Table 4. Components of an integrated approach to water quality-based toxics control (modified after USEPA 1991)
Control approach Capabilities Limitations
Chemical-specific methods Human/ecological protection Do not consider all toxics present
Generally accepted approach Bioavailability not measured
Straightforward treatability less Neglect interactions of mixtures
Expensive in case of only few chemicals Complete testing is very expensive
Allows predictions of impacts Biological impairment is not measured
Fate understood Complete fate and toxicological data are available for very few chemicals
Group parameters Aggregate groups of chemicals Does not consider all toxics present
Unknown toxicity partly covered Biological impairment is not measured
Relatively cheap No direct human/ecological health
Bioavailability partly measured
Toxicity tests Aggregate and accurate toxicity No direct human/ecological health
Unknown toxicants addressed Incomplete toxicology (few species may be tested)
Bioavailability measured Incomplete knowledge of the causative toxicants
Prevents impacts No direct treatment
Persistency not taken into account
Bioassessments Measure actual effects historical Impact has already occurred
Trend analysis total effects of all sources Cause of impact not identified
No differentiation of source No direct human health protection

127Seeking agricultural produce free of pesticide residues
edited by I.R. Kennedy, J.H. Skerritt, G.I. Johnson and E. Highley ACIAR Proceedings No. 85e
(printed version published in 1998)
amount of compounds from a single toxicological class that are present in a sample, or alternatively, the total amount of biological activity associated with that particular class. In practice, most group parameters that have been described to date are severely limited in either their relevance (cf. AOX, EOX, TOX measurements), both chemically and toxicologically, or in the number of groups or effects that can be monitored. One promising approach has been described recently for the quanti-fication of the total narcosis-related toxicity of a mixture (Verhaar et al. 1995; Van Loon and Her-mens 1995). Other groups that could in principle be monitored in a similar way are: reactive compounds, which could be quantified by assessing the amount of modified substrate in an assay that uses an appro-priate substrate for a certain type of reactivity; and receptor-specific compounds.
It can be concluded that toxicity tests are cost-effective tools to detect, control, or predict biological effects of (mixtures of) chemicals. The application of short-term bioassays should be the first step in a tiered testing system. The next step should be the identification of the causative chemicals, using ana-lytical chemical tools. The application of group parameters with a clear toxicological background may reduce costs and enhance our understanding of toxicological effects.
Conclusions
1) The risk management process is greatly hindered by the lack of knowledge of actual concentrations and effects of chemicals. Generic risk assessments are suitable to assess the risk of chemicals, but are often not suited to assess site-specific risks.
2) Data on environmental quality criteria are not available for most chemicals and the scientific quality of what environmental quality data are available on well-known chemicals is relatively poor.
3) For scientific and practical purposes there is a need to increase our knowledge of the impact of trans-port of chemicals through the air and their ecologi-cal effects. For instance, 95% of pesticides in the Netherlands are emitted to the air. Pesticide con-centrations in rain are relatively high, but few data on the chemical monitoring of these pesticides exist . For some pesticides the measured concentra-tions were acutely toxic to aquatic life.. The magni-
tude of the fluxes of many chemicals in the air compartment and their ecological effects still need to be explored in greater detail.
4) Integrated approaches to water quality monitoring are needed to deal with the problem of mixture tox-icity.
References
Aldenberg, T. and Slob, W. 1993. Confidence limits for hazardous concentrations based on logistically distributed NOEC toxicity data. Ecotoxicology and Environmental Safety, 25, 48–63.
Calamari, D. and Vighi, M. 1991. Scientific bases for the assessment of toxic potential of several chemical sub-stances in combination at low level. Report prepared for the Commission of the European Communities, Contract B 6612-90-001297, by the Institute of Agricultural Ento-mology, University of Milan, Milan.
Commissie van Deskundigen 1996. MJP-G emissie-evalu-atie 1995. Einddocument, Ede, the Netherlands.
Commission of the European Communities 1996. Technical guidance documents in support of the Commission Direc-tive 93/67/EEC on risk assessment for new substances and the Commission Regulation (EC) No 1488/94 on risk assessment for existing substances. Brussels, Belgium, Commission of the European Communities.
De Poorte, J. and Van Leeuwen C.J. 1997. How toxic is rain? H2O, 30, 169–171.
Di Toro, D.M., Zarba, C.S., Hansen, D.J., Berry, W.J., Swartz, R.C., Cowan, C.E., Pavlou, S.P., Allen, H.E., Thomas N.A. and Paquin, P.R. 1991. Technical basis for establishing sediment quality criteria for non-ionic organic chemicals by using equilibrium partitioning. Environmental Toxicology and Chemistry, 10, 1541–1583.
EUSES (European Union System for the Evaluation of Sub-stances) 1996. EUSES 1.0. The European Union System for the Evaluation of Substances. National Institute of Public Health and the Environment (RIVM), the Nether-lands. Available from European Chemicals Bureau (EC/DGXI), Ispra, Italy.
European Inland Fisheries Advisory Commission 1987. Revised report on combined effects on freshwater fish and other aquatic life. EIFAC Technical Paper 37, Rev. 1. Rome, Italy, FAO.
Heemraadschap Fleverwaard 1993. Bestrijdingsmiddelen in neerslag en in oppervlaktewater. Onderzoek naar het voorkomen en de verspreiding van bestrijdingsmiddelen in oppervlaktewater, atmosferische depositie en waterbo-demsslib in Oostelijk en Zuidelijk Flevoland in 1990 en 1991. Lelystad, the Netherlands.
Hermens. J. 1989. Quantitative structure–activity relation-ships on environmental pollutants. In: Hutzinger, O., ed.,

128Seeking agricultural produce free of pesticide residues
edited by I.R. Kennedy, J.H. Skerritt, G.I. Johnson and E. Highley ACIAR Proceedings No. 85e
(printed version published in 1998)
Handbook of environmental chemistry. Berlin, Springer Verlag, vol. 2E, 111–162.
Milloy, S.J., Aycock, P.S. and Johnston, J.E. 1994. Choices in risk assessment. The role of science in the environmen-tal risk management process. Washington, D.C., Regula-tory Impact Analysis Project, Inc.
OECD (Organisation for Economic Cooperation and Devel-opment) 1989. Report of the OECD workshop on ecolog-ical effects assessment. Paris, OECD Environment Monographs, 26.
Provincie Zuid-Holland 1994. Bestrijdingsmiddelen in neer-slag in Zuid-Holland. Provincie Zuid-Holland, Dienst Water en Milieu, Den Haag, the Netherlands.
USEPA (United States Environment Protection Agency) 1991. Technical support document for water quality-based toxic control. Washington, D.C., Report EPA/505/2-90-001.
Van Leeuwen, C.J. 1992. Ecotoxicological risk manage-ment of aquatic pollutants. In: Newman, P.J., Piaveaux, M.A. and Sweeting, R.A., ed., International Conference on River Water Quality, Ecological Assessment and Con-trol, Brussels, Belgium, 643–655.
— 1995. Ecotoxicological effects. In: Van Leeuwen, C.J. and Hermens, J.L.M., ed., Risk assessment of chemicals. An introduction. Dordrecht, The Netherlands, Kluwer Academic Publishers, 175–237.
Van Leeuwen, C.J., Bro-Rasmussen, F. Feijtel, T.C.J., Arndt, R., Bussian, B.M., Calamari, D., Glynn, P., Grandy, N.J., Hansen, B., Van Hemmen, J.J., Hurst, P., King, N., Koch, R., MÅller, R., SolbÇ, J.F., Speijers G.A.B. and Vermeire, T. 1996a. Risk assessment and risk management of chemicals: status and future needs. Envi-ronmental Toxicology and Pharmacology, 2, 243–299.
Van Leeuwen, C.J., Emans, H-J., Van De Plassche E.J. and Canton J.H. 1994. The role of field tests in hazard assess-ment. In: Hill, I.R., Heimbach, F., Leeuwangh, P. and Matthiessen, P. ed., Freshwater field tests for hazard assessment of chemicals. London, Lewis Publishers, 425–437.
Van Leeuwen, C.J., Verhaar, H.J.M. and Hermens, J.L.M. 1996b. Quality criteria and risk assessment for mixtures of chemicals in the aquatic environment. Human Ecologi-cal Risk Assessment, 2, 419–425.
Van Loon, W.M.G.M. and Hermens, J.L.M. 1995. Monitor-ing water quality in the future. Volume 2. Mixture toxic-ity parameters. Utrecht, The Netherlands, Research Institute of Toxicology.
Verhaar, H.J.M., Busser, F. and Hermens, J.L.M. 1995. Sur-rogate parameter for the baseline toxicity content of con-taminated water: Simulating the bioconcentration of mixtures of pollutants and counting molecules. Environ-mental Science and Technology, 29, 726–734.
Vermeire, T. and Van Der Zandt, P. 1995. Procedures of hazard and risk assessment. In: Van Leeuwen, C.J. and Hermens, J.L.M., ed., Risk assessment of chemicals. An introduction. Dordrecht, The Netherlands, Kluwer Aca-demic Publishers, 293–337.

129Seeking agricultural produce free of pesticide residues
edited by I.R. Kennedy, J.H. Skerritt, G.I. Johnson and E. Highley ACIAR Proceedings No. 85e
(printed version published in 1998)
RICE is a staple food crop in several Asian countries, including Malaysia. Pests continue to pose a threat to its production in spite of efforts to produce resistant varieties. Pesticides remain an essential tool for pro-tecting rice crops in Malaysia, as a component of integrated pest management. Lindane, the only orga-nochlorine insecticide allowed for agricultural use, offers effective control of the main stem borer spe-cies, Tryporyza incertulas and Chilo polychrysus(Lim and Heong 1977). The popularity of 2,4-D for weed control in rice is reflected in the $M4 000 000 spent on purchases of it each year (Cheah and Ooi 1988). Other commonly used pesticides include car-bofuran, endosulfan, BPMC, MIPC, paraquat, thiobencarb, molinate, propanil, pretilachlor, glypho-
sate, metsulfuron, quinclorac, and fenoprop-ethyl (Ho et al. 1991). These chemicals are frequently dis-charged into the rice ecosystem.
The paddy land under the jurisdiction of the Muda Agricultural Development Authority (MADA) in Kedah State, and the agricultural plain of Kelantan, are two of the most important rice-cultivation areas in Malaysia. Water is an important resource to be con-served, and water has been recycled in the MADA agroecosystem which has an established network of irrigation and drainage channels. In the latter ecosys-tem, groundwater is an important source (70%) of potable water for rice farmers
Materials and Methods
Sampling sites
In the MADA agroecosystem, 12 sites were identi-fied for the study, with surface water samples col-lected from 5 sampling points at each of these. The
Residues and Dissipation of Selected Pesticidesin Paddy Rice Agroecosystems in Malaysia
U.B. Cheah and K.Y. Lum*
* Strategic, Environment and Natural Resources Research Centre, Malaysian Agricultural Research and Develop-ment Institute, P.O. Box 12301, 50774 Kuala Lumpur, Malaysia.
Abstract
A broad-scale survey was conducted on pesticide residues in surface and groundwater in rice agroecosystems of the Muda rice-growing areas, the ‘rice-bowl’ of the country, and the agricultural plain of Kelantan in Malaysia. Dissipation of lindane, 2,4-D, and paraquat was assessed through laboratory studies.
Pesticide residues were evident in the surface/groundwaters of the Kelantan Plain and MADA agroeco-system. Samples taken from piezometers and wells generally showed similar results. The cyclodiene insec-ticide endosulfan, in the form of the β-isomer, and its oxidation product endosulfan sulfate, was found extensively. The organochlorine residues detected were lindane, aldrin, dieldrin, and DDT. Their residues were generally low.
In many samples from the Kelantan Plain 2,4-D was found but, because it is not persistent, is not expect-ed to cause a problem. The occurrence of 2,4-D, paraquat, and molinate residues in the surface waters of the Muda rice ecosystem was seasonal and more widespread during the period when the herbicides were applied. Residues of two commonly used pesticides, thiobencarb and carbofuran, did not pose a problem to the area’s water resources.

130Seeking agricultural produce free of pesticide residues
edited by I.R. Kennedy, J.H. Skerritt, G.I. Johnson and E. Highley ACIAR Proceedings No. 85e
(printed version published in 1998)
sampling points included farmers’ fields, canals, drains, and rivers, and were selected to include par-tially and totally recycled water. Water was sampled monthly from November 1992 until July 1993. There were about 60 samples taken in each collection.
In the Kelantan Plain, 30 sites were selected for the study. The choice of sampling sites for groundwater was based on location, site elevation, cropping sys-tem, source of irrigation, and type of farm. A piezom-eter was installed at each site to collect water seeping from the surrounding paddy area.
Pesticides examined
The pesticides examined were: the organochlorine pesticides aldrin, dieldrin, lindane, and DDT and its metabolites DDE and DDD; endosulfan alpha and beta isomers and their oxidation product endosulfan sulfate; and carbofuran. The herbicides investigated were paraquat, 2,4-D, molinate, and thiobencarb.
Analytical procedure
Organochlorines
Organochlorine pesticide residues in water were analysed by liquid–liquid extraction and gas chroma-tography method as described in APHA (1989). The extracts were examined on a gas chromatograph equipped with an electron-capture detector (Model 8500, Perkin-Elmer Corporation, Connecticut, USA). The capillary column used was 25 m long and packed with 3% phenyl methyl silicone gum, 0.32 mm × 0.25 mm film thickness. Injector and oven temperatures were maintained at 190˚C and 200˚C, respectively. Oven temperature was programmed at a rate of 2˚C per minute from 120˚C to 250˚C. Under these condi-tions, the minimum detection levels were 0.002 ng/mL for lindane, aldrin, dieldrin, and endosulfan I (α-isomer) and 0.004 ng/mL for endosulfan II (β-iso-mer), endosulfan sulphate, and DDT and its metabo-lites DDD and DDE. To confirm the results, the extracts of randomly selected samples were rechro-matographed on another column of different polarity.
2,4-D and paraquat
2,4-D and paraquat residues were determined using a Strategic Diagnostics immunoassay test kit. Standard solutions of 0.5, 10, and 100 ng/mL and a negative control were supplied with the kit. Three replicates per sample were conducted. Optical density values for each well reaction on the microtitre plate were obtained using an enzyme-linked immuno sorbent
assay (ELISA) plate reader at 450 nm wavelength. A calibration graph was prepared with readings from the standard solutions, and was used to compute sample concentrations. The minimum detection limits for 2,4-D and paraquat were 0.5 ng/mL and 0.03 ng/mL, respectively.
Cabofuran, molinate, and thiobencarb
Carbofuran was determined using solid-phase extraction (SPE) and liquid chromatography in the method of Beauchamp et al. (1989). Molinate and thiobencarb were also analysed through the use of C18 and C8 SPE cartridges, respectively, and liquid chromatography with UV detection. The extracts were examined on a high performance liquid chro-matograph (Waters Modular System with 501 HPLC Pump, Lambda-Max Model 481 LC spectrophotome-ter and Model 745 data module). The detection limits were 2 ng/mL for carbofuran and 0.1 ng/mL for moli-nate and thiobencarb.
Results and Discussion
MADA agroecosystem
The cyclodiene endosulfan, in the form of β-iso-mer and endosulfan sulfate, was found everywhere in the water of the MADA agroecosystem. Residues of the insecticide were detected in most of the water samples at levels ranging from <0.005 ng/mL to 25.5 ng/mL (Table 1). It is interesting to note that although the α-isomer is relatively more stable than the β-iso-mer (Guerin and Kennedy 1992), the results gener-ally showed a higher number of samples containing the β-isomer. Residue levels were also generally higher. The observation may be attributed to the loss of the α-isomer through volatilisation. The ubiquity of endosulfan sulfate reinforces the conclusion that the oxidation product of endosulfan is very stable and considerably more persistent than the parent isomers (Miles and Moy 1979; Guerin and Kennedy 1992). The half-lives of endosulfan sulfate in aqueous media have been reported to be in the range 140–184 days.
The occurrence of other organochlorine insecti-cides such as lindane, DDT, aldrin, and dieldrin was sporadic. Except for lindane, use of organochlorine insecticides has been restricted or banned in Malay-sia. Residue levels in most of the samples were below 0.1 ng/mL (Table 1). Lindane residues ranging from <0.002 ng/mL to 0.23 ng/mL found in the study were in the same order as those reported in India (Sujatha et al. 1993; Iwata et al. 1994).

131Seeking agricultural produce free of pesticide residues
edited by I.R. Kennedy, J.H. Skerritt, G.I. Johnson and E. Highley ACIAR Proceedings No. 85e
(printed version published in 1998)
Table 1. Pesticide residues in water resources in Muda agroecosystem
Time of sampling No. analysed Pesticides detected No. detected Concentration range (ng/mL)
November 92 26 Lindane 11 <0.002–0.15
26 Aldrin 1 <0.002–0.01
26 Dieldrin 16 <0.002–0.12
26 Endosulfan 25 <0.002–0.37
26 DDT 14 <0.004–0.08
55 2,4-D 9 <0.5–0.70
54 Paraquat 6 <0.03–0.10
55 Carbofuran 9 <2.0–2.2
December 92 42 Lindane 7 <0.002–0.15
42 Aldrin 6 <0.002–0.06
42 Dieldrin 13 <0.002–0.10
42 Endosulfan 33 <0.002–25.5
42 DDT 13 <0.004–0.30
January 93 51 Lindane 22 <0.002–0.09
51 Aldrin 26 <0.002–0.16
51 Dieldrin 7 <0.002–0.04
51 Endosulfan 49 <0.002–0.32
51 DDT 4 <0.004–0.09
30 Carbofuran 0 <2.0
February 93 33 Thiobencarb 0 <0.1
34 Molinate 28 <0.1
April 93 20 Lindane 5 <0.002–0.23
20 Aldrin 3 <0.002–0.15
20 Dieldrin 3 <0.002–0.04
20 Endosulfan 13 <0.002–0.04
20 DDT 2 <0.004–0.05
38 2,4-D 30 <0.5–2.80
6 Thiobencarb 0 <0.1
39 Paraquat 33 <0.03–0.09
6 Molinate 0 <0.1
May 93 6 Lindane 2 <0.002–0.04
6 Aldrin 3 <0.002–0.06
6 Dieldrin 3 <0.002–0.06
6 Endosulfan 5 <0.002–0.54
6 DDT 2 <0.004–0.05
57 2,4-D 6 <0.5–4.5
52 Paraquat 5 <0.03–0.097
9 Thiobencarb 0 <0.1
9 Molinate 1 <0.1–0.2

132Seeking agricultural produce free of pesticide residues
edited by I.R. Kennedy, J.H. Skerritt, G.I. Johnson and E. Highley ACIAR Proceedings No. 85e
(printed version published in 1998)
June 93 27 Lindane 17 <0.002–0.14
27 Aldrin 11 <0.002–0.04
27 Dieldrin 11 <0.002–0.09
27 Endosulfan 23 <0.002–2.3
27 DDT 15 <0.004–0.03
54 2,4-D 13 <0.5–120
52 Paraquat 5 <0.03–0.19
22 Thiobencarb 2 <0.1–0.9
23 Molinate 6 <0.1–17.0
July 93 7 Lindane 7 <0.002–0.05
7 Aldrin 6 <0.002–0.01
7 Dieldrin 0 <0.002
7 Endosulfan 7 <0.002–0.04
7 DDT 7 <0.004–0.02
Table 1. (Cont’d) Pesticide residues in water resources in Muda agroecosystem
Time of sampling No. analysed Pesticides detected No. detected Concentration range (ng/mL)
Lower lindane residues were generally observed in the river and estuarine waters of Thailand (non-detectable–0.018 ng/mL), Vietnam (0.00036–0.012 ng/mL), and Indonesia (0.00084–0.0037 ng/mL) (Iwata et al. 1994). The results of laboratory studies (Mathur and Saha 1975; Scheunert et al. 1987; Cheah et al. 1998), suggest that lindane is very persistent in soils, but several field studies have indicated rapid dissipation of lindane. In these cases the loss was attributed to rapid volatilisation from soils, rather than biodegradation (Samuel et al. 1988; Tanabe et al. 1991; Waliszewski 1993).
The occurrence of 2,4-D, paraquat, and molinate residues was seasonal and more widespread during the period when the herbicides were applied. Many water samples were found to contain 2,4-D residues exceeding the European Union drinking water stan-dard of 0.1 ng/mL. These residues were not expected to persist in the environment in view of the short half-lives of these materials, which were reported to range from 3.4 days in an aerobic muck to 9.3 days under anaerobic conditions (Table 3) (Cheah et al. 1998). None of the samples in which paraquat was detected contained residues exceeding 0.1 ng/mL. Its unique property of strong adsorption to soil colloidal parti-cles (Damanakis et al. 1970) may account for this observation. Residues of molinate were higher—up to 12.7 ng/mL. Thiobencarb and carbofuran residues did not pose a problem in the waters of this ecosys-
tem. Thiobencarb was detected in only two samples, at levels close to the limit of detection. Carbofuran also was found in only two samples, with residue lev-els close to the limit of detection of 2 ng/mL.
The source of aldrin contamination was difficult to establish. Consistently low residue levels suggested that these residues may have originated from another locality, as long-range transport of aldrin has been demonstrated (Butarelli et al. 1991). In general, dieldrin was found more frequently than aldrin and, as with aldrin, it was difficult to locate the source of contamination. Contamination arising from its illegal use in the ecosystem, and from non-point sources as discussed previously, was possible.
Though the frequency of detection of DDT was low, the residue levels detected were higher than those observed in river and estuarine waters of sev-eral countries in Asia and Oceania. Lower DDT resi-due levels of 0.00023–0.00250 ng/mL, 0.00029–0.025 ng/mL, 0.00019–0.00027 ng/mL, 0.0000065–0.000016 ng/mL, 0.0000095–0.00019 ng/mL, 0.0000013–0.0011 ng/mL were found in water samples from Thailand, Vietnam. Indonesia, Japan, Taiwan, and Australia, respectively (Iwata et al. 1994).
Kelantan Agricultural Plain
Endosulfan was also found as a ubiquitous contam-inant in the rice ecosystem of the Kelantan agricul-

133Seeking agricultural produce free of pesticide residues
edited by I.R. Kennedy, J.H. Skerritt, G.I. Johnson and E. Highley ACIAR Proceedings No. 85e
(printed version published in 1998)
tural plain (Table 2). Other organochlorine insecticides such as lindane, aldrin, dieldrin, and DDT were also present. There was little difference in the type of pesticides found, the number of samples in which they were detected, and their levels between groundwater from piezometers and drinking water.
The presence of organochlorine residues in surface water and groundwater has been reported in Malaysia previously (Tan 1992; Cheah et al. 1994). The occur-rence of organochlorine pesticides arising from nor-mal agricultural use has also been reported in the USA (Ritter 1990).
Table 2. Pesticide residues in water resources of rice agrosystem in the Kelantan Plain. The figures in parenthesis indicate the total number of samples analysed and the number of samples containing detectable residues.
Time of sampling
Pesticides detected
Concentration range ( ng/mL)
Piezometer Well Drain Irrigation canal River
July 92 Endosulfan <0.002–1.54 (45)(37)
<0.002–0.6 (36)(28)
<0.002–0.52 (35)(32)
<0.002–0.029 (5)(4)
<0.002–0.15 (3)(3)
Lindane <0.002–0.34 (45)(21)
<0.002–0.31 (36)(16)
<0.002–0.26 (35)(16)
<0.002–0.066 (5)(1)
<0.002–0.15 (3)(2)
Aldrin <0.002–0.17 (45)(19)
<0.002–0.17 (36)(18)
<0.002–0.31 (35)(18)
<0.002–0.06 (5)(2)
<0.002–0.076 (3)(1)
Dieldrin <0.002–0.046 (45)(18)
<0.002–0.097 (36)(17)
<0.002–0.03 (35)(13)
<0.002–0.005 (5)(1)
<0.002 –0.027 (3)(2)
DDT <0.004–0.241 (45)(6)
<0.004–0.061 (36)(9)
<0.004–0.66 (35)(4)
<0.004(5)(0)
<0.004(3)(0)
2,4-D <0.5–0.95 (23)(10)
<0.5–44.0 (13)(5)
<0.5–0.85 (14)(11)
<0.5–0.56(2)(2)
<0.5 –0.70(3)(3)
Paraquat <0.03–0.08 (11)(11)
<0.03–0.13 (7)(7)
<0.03–0.13 (8)(8)
<0.03–0.03 (1)(1)
<0.03–0.10 (1)(1)
September 92 Endosulfan <0.002–0.14 (33)(21)
<0.002–0.13 (29)(21)
<0.004–0.15 (22)(17)
<0.002–0.02 (4)(2)
<0.002–0.022 (3)(2)
Lindane <0.002–0.13 (33)(25)
<0.002–0.10 (29)(18)
<0.002–0.26 (22)(14)
<0.002–0.066 (4)(2)
<0.002(3)(0)
Aldrin <0.002–0.09 (33)(15)
<0.002–0.17 (29)(7)
<0.002–0.11 (22)(6)
<0.004(4)(0)
<0.002(3)(0)
Dieldrin <0.002–0.13 (33)(26)
<0.002–0.072 (29)(21)
<0.002–0.09 (22)(11)
<0.002–0.013 (4)(20)
<0.002(3)(0)
DDT <0.004–0.26 (33)(5)
<0.004–0.14 (29)(3)
<0.004–0.2 (22)(2)
<0.004–0.17 (4)(3)
<0.004(3)(0)
February 93 Endosulfan <0.002–0.15 (61)(47)
<0.002–0.48 (55)(28)
<0.002–1.52 (35)(34)
<0.002–0.087 (9)(6)
<0.002–0.14 (6)(5)
Lindane <0.002–0.08 (61)(3)
<0.002–0.007 (55)(3)
<0.002–0.026 (35)(3)
<0.002–0.008 (9)(1)
<0.00 –0.018 (6)(1)
Aldrin <0.002–0.033 (61)(15)
<0.002–0.10 (55)(10)
<0.002–0.015 (35)(4)
<0.002–0.024 (9)(1)
<0.002–0.017 (6)(1)
Dieldrin <0.002–0.13 (61)(26)
<0.002–0.022 (55)(8)
<0.002–0.11 (35)(14)
<0.002(9)(0)
<0.002–0.012 (6)(2)
DDT <0.004–0.18 (61)(9)
<0.004–0.11 (55)(3)
<0.004–0.18 (35)(8)
<0.004–0.046 (9)(3)
<0.004–0.034 (6)(3)

134Seeking agricultural produce free of pesticide residues
edited by I.R. Kennedy, J.H. Skerritt, G.I. Johnson and E. Highley ACIAR Proceedings No. 85e
(printed version published in 1998)
The detection of 2,4-D in the groundwater was not surprising as it has been shown to be moderately mobile in Malaysian agricultural soils (Cheah et al. 1997). Residue levels were, nevertheless, found to be low, ranging from <0.5 to 44 ng/mL (Table 2), for the entire sampling period.
Paraquat residues were found in the surface water (drainage, irrigation, and river) and their presence was not unexpected. The detection of the herbicide in the groundwater, however, was rather surprising con-sidering its strong and irreversible adsorption to soils (Knight and Tomlinson 1967; Damanakis et al. 1970; Cheah et al. 1997). The presence of paraquat residues may be attributable to preferential flow or by-pass through the soil profile. Attempts were made to con-firm the residues by ion-exchange and UV determi-nation, but this was not successful because of the extremely low concentrations. Although long half-lives of 499 days and 2614 days in aerobic and anaer-obic muck, respectively, were reported in agricultural soils (Cheah et al. 1998), paraquat is not expected to have any adverse effect on the ecosystem because of its rapid inactivation through soil colloidal particles.
Several studies have shown that there is little or no accumulation of pesticide residues in paddy crops (Iman and Rejesus 1977; Cheah and Lum 1993), but the impact of the residues on the biodiversity of the ecosystems needs to be examined in detail.
Acknowledgments
The authors thank Ms Rosmawati Selamat, Ms Jamiah Jaafar, and Mr Lim Teck Poi for technical assistance.
References
APHA (American Public Health Assocciation) 1989. Stan-dards methods for the examination of water and wastewa-ter, 17th ed. Lenore, S.C., Arnold, E. and Greenberg, R. , ed. New York, APHA.
Beauchamp, K.W. Jr., Dave, D., Lui, W. and Kikta, E.J. Jr. 1989. Determination of carbofuran and its metbolites in rice paddy water by solid phase extraction and liquid chromatography. Journal of the Association of Analytical Chemists, 72, 845–847.
Butarelli, F., Cartoni, G., Vicedomini, M. and Zocolillo, L. 1991. Long lasting pesticides in Antarctic surface fresh watwer. Annali Di Chimica, 81, 589–593.
Cheah, U. B., Kirkwood, R.C. and Lum, K.Y. 1997. Adsorption, desorption and mobility of four commonly used pesticides in Malaysian agricultural soils. Pesticide Science, 50, 53–63.
— 1998. Journal of Agricultural and Food Chemistry, in press.
Cheah, U.B. and Lum, K.Y. 1993. Pesticide contamination in the environment. In: Yeoh, B.G., Chee, K.S., Phang, S.M., Zaid, I. Azni, I. and Maketabb, M., ed., Waste man-agement in Malaysia: current status and prospects for bioremediation. Kuala Lumpur, Ministry of Science, Technology and the Environment.
Cheah, U.B. and Ooi, G.G. 1988. Potential approaches towards degradation of 2,4-D. In: Lam, Y.M., Cheong, A.W. and Azmi, M., ed., Proceedings of a national semi-nar and workshop on rice field weed management, Pen-ang, 7–9 June 1988, 237–243.
Cheah, U.B., Sharma, M.L., Aminuddin, B.Y., Mohammud, C.H. and Mohd Zain, M. 1994. Pesticide residues in water resources of the agricultural plains of Kelantan. ACIAR Proceedings No. 61, 22–28.
Damanakis, M.D.S.H., Drennan, J.D, Fryer, J.D. and Holly, K. 1970. The adsorption and mobility of paraquat on dif-ferent soils and soil constituents. Weed Research, 10, 264.
a c.l. = confidence limitsSource: Cheah et al. 1998
Table 3. First-order rate constants (k), half-lives (t1/2) with 95% confidence limits and determination coefficients (r2) in an aerobic and anaerobic rice-field soil
Soil Pesticide r2 k(/day)
t1/2(days)
t1/295% c.l.a
Aerobic muck 2,4-D 0.89 0.21 3.4 2.8 –4.2
Lindane 0.97 0.0019 369.3 343.0–400.0
Paraquat 0.96 0.0014 499.2 405.1–650.9
Anaerobic muck 2,4-D 0.73 0.075 9.3 7.2–13.0
Lindane 0.93 0.0012 609.1 548.9–683.6
Paraquat 0.76 0.00024 2614 2289–3652

135Seeking agricultural produce free of pesticide residues
edited by I.R. Kennedy, J.H. Skerritt, G.I. Johnson and E. Highley ACIAR Proceedings No. 85e
(printed version published in 1998)
Guerin, T.F. and Kennedy, I.R. 1992. Distribution and dissi-pation of endosulfan and related cyclodienes in sterile aqueous systems: implications for studies on biodegrada-tion. Journal of Agricultural and Food Chemistry, 40, 2315–2323.
Ho, N.K., Asna, B.O., Aznan, A. and Rabirah, A. 1991. Herbicide usage and associated incidences of poisoning in the Muda Area, Malaysia. A case study. In: Lee, S.A. and Kon, ed., 1991. Proceedings of the Third Tropical Weed Science Conference, Kuala Lumpur, 4–6 Decem-ber 1990, 321–333.
Iman, M. and Rejesus, B.M. 1977. Carbofuran and 3-hydroxycarbofuran residues in rice plants and grains. The Philippine Entomologist, 3, 281–288.
Iwata, H., Tanabe, S., Sakai, N. Nishimura, A. and Tat-sukawa, R. 1994. Geographical distribution of persistent organochlorines in air, water and sediments from Asia, Oceania, and implications for global redistribution from lower latitudes. Environment Pollution, 85, 15–33.
Knight, R.A.G. and Tomlinson, T.E. 1967. The interaction of paraquat (1:1'-dimethyl 4,4'-dipyridylium dichloride) and mineral soils. Journal of Soil Science, 18, 233.
Lim, G.S. and Heong, K.L. 1977. Habitat modification for regulating pest population in Malaysia. MARDI publica-tion.
Mathur, S.P. and Saha, J.G. 1975. Microbial degradation of lindane-C14 in a flooded sandy loam soil. Soil Science, 120, 301–307.
Miles, J.R.W. and Moy, P. 1979. Degradation of endosulfan and its metabolites by a mixed culture of soil microorgan-
isms. Bulletin of Environment Contamination and Toxi-cology, 23, 13–16.
Ritter, W.F. 1990. Pesticide contamination of groundwater in the United States—a review. Environmental Science and Health, B25, 129.
Samuel, T., Agarwal, H.C. and Pillai, M.K.K. 1988. Persis-tence and binding of DDT and gamma-HCH in a sandy loam soil under field condiions in Delhi, India. Pesticide Science, 22, 1–15.
Scheunert, I., Vockel, D., Schmitzer, J. and Korte, F. 1987. Biomineralisation rates of 14C-labelled organic chemi-cals in aerobic and anaerobic suspended soil. Chemosh-ere, 16, 1031–1041.
Sujatha, C.H., Nair, S.M., Kumar, N.C. and Chacko, J. 1993. Distribution of organochlorine pesticides in a tropi-cal waterway—HCH isomers. Toxicology and Environ-mental Chemistry, 39, 103–111.
Tan, G.H. 1992. Environmental monitoring of organochlo-rine pesticide residues in selected Malaysian rivers: an assessment. Paper presented at the international confer-ence on pesticides in perspective, Kuala Lumpur, 28–29 May 1992.
Tanabe, S., Ramesh, A., Sakashita, D., Iwata, H. and Tat-sukawa, R. 1991. Fate of HCH (BHC) in tropical paddy field: application test in South India. International Journal of Environmental Analytical Chemistry, 45, 45–53.
Waliszewski, S.M. 1993. Residues of lindane, HCH isomers and HCB in the soil after lindane treatment. Environment Pollution, 82, 289–293.

136Seeking agricultural produce free of pesticide residues
edited by I.R. Kennedy, J.H. Skerritt, G.I. Johnson and E. Highley ACIAR Proceedings No. 85e
(printed version published in 1998)
AGRICULTURAL production in Thailand has long depended heavily on pesticides. The evidence relat-ing to pesticide use since pesticides were first imported into Thailand shows a continuing trend of increasing use over time. After years of intensive use of pesticides, problems concerning pesticide residues in food and the environment, resistance to pesticides, and pesticide hazards to humans and non-target organisms have been reported. However, the full impact has not yet been quantified.
Use of Pesticides in Agriculture
Pesticides were needed in agriculture because roughly one-third of the production of food, feed, and fibre was being lost to insect pests and plant and ani-mal diseases. The reasons for extensive use of pesti-cides in Thailand are the wide variation in climate and crops, and the great multitude of pests and dis-eases. There are many types of pesticides now in use
in Thailand: insecticides, herbicides, fungicides, and other minor categories including plant growth regula-tors, nematicides, and rodenticides. Among these, more herbicides are used than any other type of chemical. In the past, insecticides were the major class of pesticides used by farmers, but now the increasing cost of labour has made herbicide domi-nant over insecticides. The major insecticides cur-rently in use are organophosphosphate, carbamate, and pyrethroid compounds. Almost all organochlo-rines used actively in the past have now been replaced by newer compounds. Dithiocarbamates and quaternary ammonium compounds are the major compounds used as fungicides and herbicide in Thai-land.
Extent of Pesticide Usage
Over 60% of the overall pesticide usage in agriculture Thailand, in terms of amounts applied per unit area, is on rice, cotton, and fruits and vegetables. The remaining 40% is used to control pests in field crops, oil crops, rubber, ornamentals, etc. The trend of increasing pesticide use is reflected in the increasing
Pesticide Use and Dissipation in Paddy Rice in Thailand
Nuansri Tayaputch*
* Division of Agricultural Toxic Substances, Department of Agriculture, Chatuchak, Bangkok 10900, Thailand.
Abstract
Pesticide use in Thailand has been increasing in the last 10 years in parallel with the increased production of agricultural commodities. The major types of pesticides used are organophosphates, carbamates, and pyrethroids, and various types of herbicides and fungicides. From surveys in 1991–92 on pesticides used in paddy fields, it was found that at least 25 different chemicals were used, some of which left residues in field soil and water. Further extensive surveys were made in 1996 on pesticide residues in milled rice and husked rice from 45 growing areas and one organic-rice-growing area. They revealed that trace amounts of organochlorine insecticides, mostly long banned from agricultural use, could still be found in most of the samples, but not at concentrations to cause concern. Some organophosphosphate and carbamate insecticides, such as monocrotophos, malathion, carbofuran, MIPC, and carbaryl were also found at low levels in some of the samples, but none in organic rice.

137Seeking agricultural produce free of pesticide residues
edited by I.R. Kennedy, J.H. Skerritt, G.I. Johnson and E. Highley ACIAR Proceedings No. 85e
(printed version published in 1998)
quantities of active ingredients being imported (Table 1). Most of the pesticides used in the country are imported in the form of finished products or technical grades which are subsequently formulated into vari-ous products.
Pesticide Usage on Major Cropsin Thailand
Rice is Thailand’s most important crop. Over 50% of the total cultivated area is planted with rice, while cassava, maize, and mungbean are the major field crops grown in northeastern Thailand. The areas planted to other economic crops such as cotton, sug-arcane, peanut, and soybean have fluctuated widely in recent years due to variations in world markets and local demand. Fruits and vegetables are increasing in importance at present, because of their high domestic and export values.
Table 2 gives the numbers of pesticides used on major crops as reported by many sources. A crop with serious pest problems and the greatest use of insecticides is cotton. Because of the heavy use of insecticides on cotton, cultivation of this crop in Thailand was sometimes reduced to accord with gov-ernment policy for pesticide risk reduction.
Pesticide Dissipation in Paddy Rice
A study of the impact of pesticide residues on the rice paddy environment was carried out in Thailand dur-ing 1991–1992. Samples of paddy soil and water, and surface and run-off water, were collected from the experimental sites over two consecutive rice-growing seasons and analysed for all chemicals reported as being used. They were 25 different pesticides com-monly used in rice-paddy field: 12 insecticides, 7 her-bicides and 6 fungicides (Table 3).
From the overall analysis, it was found that there were two types of residues. One type consisted of res-idues that could be detected throughout the survey period at trace amounts. The other type was of resi-dues that could be detected only shortly after their application and then disappeared.
Source: Tayaputch (1990).
Source: Tayaputch (1996).
The residues that could be detected throughout the whole period at low levels were endosulfan and oxa-diazon, both of which were found in paddy soil and paddy water at different levels. However, at the end
Table 2. Numbers of pesticides used on major crops in Thailand in 1987
Crop or crop class
Insecticides Fungicides Herbicides
Fruits 35 30 4
Vegetables 30 26 small
Legume 29 13 5
Cotton 28 small small
Rice 18 16 13
Table 3. Pesticides used in rice-paddy fields in Thailand during 1991–1992
Insecticides Fungicides Herbicides
monocrotophos,cartap, MIPC,methamidophos,isoprocarb, EPN,methyl parathion,carbofuran, endosulfan,triazophos, BPMC, cypermethrin
propineb,tricyclazole,benomyl,iprobenphos,carbendazim,isoprothiolane, oxadiazon
2, 4-D,bensulfuron,butachlor,metsulfuron,benthiocarb
a Includes rodenticides, nematicides, and plant-growth regulators
Table 1. Quantities (t) of the main groups of pesticides imported into Thailand during 1992–1996
Type of pesticide 1992 1993 1994 1995 1996
Insecticides 6 098 5 305 5 252 6 573 6 608
Fungicides 3 513 3 988 4 885 4 828 4 446
Herbicides 8 450 9 056 9 554 11 934 14 041
Othera 418 476 640 727 446
Total 18 479 18 825 20 331 24 062 25 541
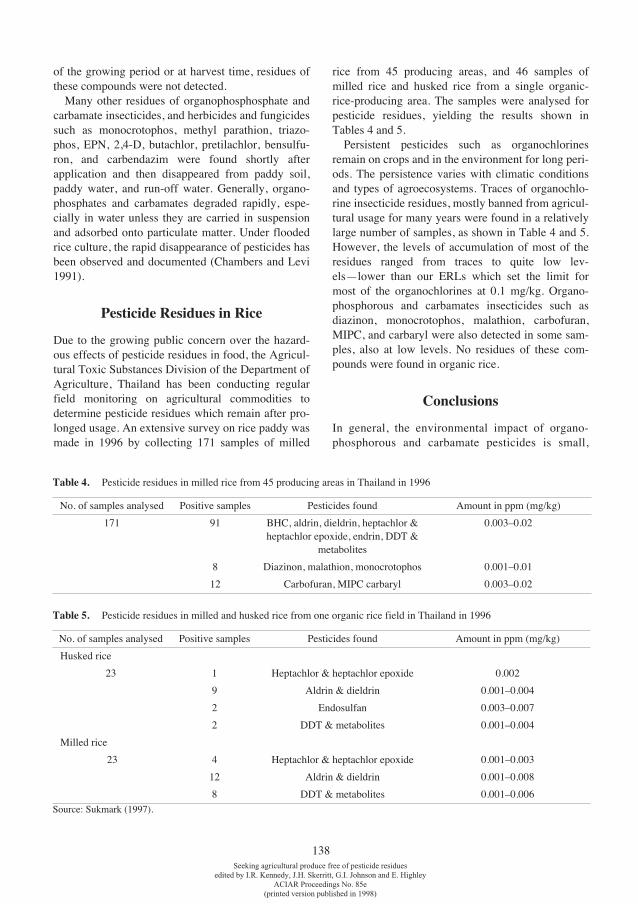
138Seeking agricultural produce free of pesticide residues
edited by I.R. Kennedy, J.H. Skerritt, G.I. Johnson and E. Highley ACIAR Proceedings No. 85e
(printed version published in 1998)
of the growing period or at harvest time, residues of these compounds were not detected.
Many other residues of organophosphosphate and carbamate insecticides, and herbicides and fungicides such as monocrotophos, methyl parathion, triazo-phos, EPN, 2,4-D, butachlor, pretilachlor, bensulfu-ron, and carbendazim were found shortly after application and then disappeared from paddy soil, paddy water, and run-off water. Generally, organo-phosphates and carbamates degraded rapidly, espe-cially in water unless they are carried in suspension and adsorbed onto particulate matter. Under flooded rice culture, the rapid disappearance of pesticides has been observed and documented (Chambers and Levi 1991).
Pesticide Residues in Rice
Due to the growing public concern over the hazard-ous effects of pesticide residues in food, the Agricul-tural Toxic Substances Division of the Department of Agriculture, Thailand has been conducting regular field monitoring on agricultural commodities to determine pesticide residues which remain after pro-longed usage. An extensive survey on rice paddy was made in 1996 by collecting 171 samples of milled
rice from 45 producing areas, and 46 samples of milled rice and husked rice from a single organic-rice-producing area. The samples were analysed for pesticide residues, yielding the results shown in Tables 4 and 5.
Persistent pesticides such as organochlorines remain on crops and in the environment for long peri-ods. The persistence varies with climatic conditions and types of agroecosystems. Traces of organochlo-rine insecticide residues, mostly banned from agricul-tural usage for many years were found in a relatively large number of samples, as shown in Table 4 and 5. However, the levels of accumulation of most of the residues ranged from traces to quite low lev-els—lower than our ERLs which set the limit for most of the organochlorines at 0.1 mg/kg. Organo-phosphorous and carbamates insecticides such as diazinon, monocrotophos, malathion, carbofuran, MIPC, and carbaryl were also detected in some sam-ples, also at low levels. No residues of these com-pounds were found in organic rice.
Conclusions
In general, the environmental impact of organo-phosphorous and carbamate pesticides is small,
Source: Sukmark (1997).
Table 4. Pesticide residues in milled rice from 45 producing areas in Thailand in 1996
No. of samples analysed Positive samples Pesticides found Amount in ppm (mg/kg)
171 91 BHC, aldrin, dieldrin, heptachlor & heptachlor epoxide, endrin, DDT &
metabolites
0.003–0.02
8 Diazinon, malathion, monocrotophos 0.001–0.01
12 Carbofuran, MIPC carbaryl 0.003–0.02
Table 5. Pesticide residues in milled and husked rice from one organic rice field in Thailand in 1996
No. of samples analysed Positive samples Pesticides found Amount in ppm (mg/kg)
Husked rice
23 1 Heptachlor & heptachlor epoxide 0.002
9 Aldrin & dieldrin 0.001–0.004
2 Endosulfan 0.003–0.007
2 DDT & metabolites 0.001–0.004
Milled rice
23 4 Heptachlor & heptachlor epoxide 0.001–0.003
12 Aldrin & dieldrin 0.001–0.008
8 DDT & metabolites 0.001–0.006

139Seeking agricultural produce free of pesticide residues
edited by I.R. Kennedy, J.H. Skerritt, G.I. Johnson and E. Highley ACIAR Proceedings No. 85e
(printed version published in 1998)
because of dissipation by processes such as volatil-isation, leaching, and run-off. The disappearance of these compounds may also occur aided by biotic and abiotic degradation. Organochlorine insecti-cides which persist in the environment long after their use was stopped, appeared in trace amounts in agricultural commodities. The concern over persis-tence of organochlorine compounds resulted in their use in agriculture being prohibited. However, the stability of these compounds and their wide-spread distribution in the environment mean that it will take a long time for their concentrations to diminish.
References
Chambers, J.E. and Levi , P.E. 1991. Organophosphates chemistry, fate and effects. San Diego, California, Aca-demic Press Inc., 443 p.
Sukmark, S. 1997. Pesticide residues in agricultural prod-ucts. Proceedings of the Second Technical Conference of Agricultural Toxic Substances Division, Kanchanaburi, Thailand, 8–10 July 1997.
Tayaputch, N. 1990. Pesticides: environmental and health hazards in Thailand . Technical Report, National Epide-miology Board, Thailand, 71p.
— 1996. Present aspects and environmental impacts of pes-ticide use in Thailand. Journal of Pesticide Sciences, 21(1), 132–135.
140Seeking agricultural produce free of pesticide residues
edited by I.R. Kennedy, J.H. Skerritt, G.I. Johnson and E. Highley ACIAR Proceedings No. 85e
(printed version published in 1998)
IN developing countries like the Philippines there is a growing concern on the effects of pesticides in the environment. One segment of the environment which is being threatened by pesticide pollution is the rice paddy ecosystem. About 60% of the total cultivated land area in the Philippines is devoted to rice produc-tion, and the drainage water from it finds its way into lakes, rivers, and the sea. This substantially increases
the opportunity for widespread contamination of the terrestrial and aquatic environments. The problem is heightened when rice fish culture, which is being pro-moted throughout Asia, is practiced. The paddy-reared fish are exposed to pesticides, and thus may bioaccumulate residues above safe limits. The move-ment of these pesticides along the food chain may also result in the build-up of residues in organisms higher in the food chain, posing hazards to consumers or to the environment in general.
There are already some reports on the fate of pesti-cides in the paddy environment in the Philippines (Argente et al. 1977; Catahan 1977; Seiber et al. 1978;
Dissipation of Pesticides in Rice Paddy in the Philippines
L.M. Varca and A.W. Tejada*
* National Crop Protection Center, College of Agriculture, University of the Philippines, Los Baños, College, Laguna 4031, Philippines.
Abstract
The dissipation of pesticides in rice paddy and rice paddy-fish culture was investigated.Carbosulfan was rapidly converted to carbofuran in all components of the rice paddy ecosystem, except
on rice leaves where it remained up to 7 days as parent compound. The major metabolite, carbofuran, remained up to 30 days in soil. Hydrolysis was the major route of degradation in water, with a higher rate at higher pH and temperature. The concentration in water was biomagnified up to 100 times in fish (Tilapia sp.), with the highest residues in gut tissues, then in fillets, and least in cranial tissue. Uptake by aquatic plants was observed up to 20 days and declined thereafter.
Similarly, BPMC (2-sec-butyl phenyl N-methyl-carbamate ) declined rapidly at higher pH with half-lives of 2.4 hours, 5.6 hours, 7.6 hours and 8.4 hours at pH 10, 6, 7, 6, and 4, respectively. The rate of loss was higher in flooded than in unflooded soil, and followed a pseudo first-order kinetics with half-lives of 1.5 and 2.2 days, respectively.
In a chlorpyrifos-treated rice paddy fields, residues in soil and water remained longer in higher pesticide use farms than in lower pesticide use farm. Residues were also found in larger animals collected within the vicinity of the treated rice fields but the levels did not exceed the tolerance limit set by FAO/WHO.
Monocrotophos, methyl parathion, and cypermethrin in rice–fish culture had no apparent effect on fish survival if recommended practice was followed. Laboratory studies showed, however, that these pesticides were very toxic to fish. A 10-day interval between field treatment and harvest of fish may be considered tolerable for consumption.
Even the persistent DDT, when exposed in the open field, degraded rapidly, with a half-life of 31 days. In soil, DDT and its metabolite, DDE, dissipate faster than in temperate countries with half-lives of 235 and 161 days, respectively.

141Seeking agricultural produce free of pesticide residues
edited by I.R. Kennedy, J.H. Skerritt, G.I. Johnson and E. Highley ACIAR Proceedings No. 85e
(printed version published in 1998)
Lucero 1980; Varca 1981; Bajet and Magallona 1982; Barril and Tejada 1982; Tejada and Magallona 1985).
This paper reports studies on the movement, distri-bution, and loss of carbosulfan/carbofuran, BPMC (2-sec-butyl phenyl N-methyl-carbamate), chlorpyri-fos, and DDT in the rice paddy ecosystem.
Field Experiment
An existing rice paddy and fish pond (7 × 4 m) next to each other at the National Crop Protection Center, Los Baños, Philippines were used in the study.
Rates of uptake, distribution, and loss of carbosul-fan were determined in different components of the rice field and pond ecosystem over a 30-day period.
Field sampling
Rice paddy ecosystem
Samples of paddy water, soil, snails, and rice plants were taken at 3 hours, and at 1, 2, 3, 5, 7, 15, and 30 days after spray application (90 days after transplanting). At harvest time, rice plant samples were divided into stems, leaves, and grains and these were analysed separately.
Fish pond
Before paddy water was run into the pond, samples of water, fish (Tilapia nilotica), ‘kangkong’ plants (Ipomoea aquatica), and snails (Pila luzonica) were taken to measure the background level of pesticide.
After draining the water from the rice paddy into the fish pond, samples of fish, kangkong, and pond soil and water were collected and analysed at various at 3 hours and at 1, 2, 3, 7, 15, and 30 days after the last application of the insecticides. The fish were divided into head, intestines, and fillets for analysis.
Fate of Carbosulfan
Rice
Carbosulfan residue was detected only on rice leaves, where it remained for up to 7 days after the last application of the insecticide. As carbosulfan concentration fell, carbofuran concentration increased. The maximum conversion of carbofuran was reached after one day, falling thereafter (Fig. 1). The rate of loss followed pseudo first-order kinetics with a half-life(t1/2) of 1.5 days. Carbofuran residue was concentrated on the leaves, followed by the stems, and was least on the grains (Fig. 2).
The effect of rainfall was very great. After 8 mm of rain, carbosulfan and carbofuran residues on rice leaves fell by 75–80%, and by 95% after 50 mm of rain (Table 1).
Sunlight enhanced degradation of the insecticide. Photodecomposition studies in the laboratory con-firmed more rapid degradation in the field, giving a half-lives for carbosulfan and carbofuran of 1.4 hours and 3.2 days, respectively (Tejada 1983).
Figure 1. Residues of carbosulfan and carbofuran in rice plants 0–7 days after spray application
After conversion of carbosulfan to carbofuran, the latter was oxidised at the 3-position of the ring, giv-ing rise to 3-hydroxy phenol. Also detected by thin layer chromatography and gas chromatography 3-
Table 1. Effect of rainfall on residues of carbosulfan and carbofuran on the leaves of rice plants.
Days Rainfall(mm)
Residues on rice leaves
Carbo-sulfan
% reduction
Carbo-furan
% reduction
0 0 3.5 0.3
1 0 2.2 37
2 8.4 0.8 63 2.5 52
3 0 0.2 75 1.0 80
4 50 95 0.2 90
5 1.4 0.1 0.08
6 0.6
7 5.4 ND 0.01
3
2
1
100
2 3 4 5 6 7 8 9Days
CarbosulfanCarbofuran
Con
cent
ratio
n (m
g/kg
)

142Seeking agricultural produce free of pesticide residues
edited by I.R. Kennedy, J.H. Skerritt, G.I. Johnson and E. Highley ACIAR Proceedings No. 85e
(printed version published in 1998)
ketophenol and 7-phenol (Fig. 3). From these data, the possible metabolic pathway is shown in Figure 4. The same metabolites were reported by Umetsu et al. (1979) in maize and cotton plants and by Callejas (1982) in tomatoes. After 7 days they reported other metabolites such as n-hydroxyl methyl carbofuran.
Water
Carbosulfan residues were not detected in paddy water one day after application of the insecticide but the major metabolite, carbofuran, was detected up to 15 days. Repeated application did not result in the accumulation or build-up of carbofuran residue in paddy water (Fig. 5). This may be attributed to its rela-tively high solubility in water (700 mg/L). Carbosul-fan/carbofuran is 60 000 times more soluble in water than is DDT (solubility is 0.0034 mg/L). Compounds
such as DDT which are relatively insoluble in water have high partition coefficients (DDT = 1.55 × 10⁶) and thus have greater potential for bioaccumulation.
As the level of carbosulfan in paddy water decreased, the level of carbofuran increased. Again the maximum conversion of carbosulfan to carbofuran occurred one day after spray application with the resi-due level declining thereafter. The rate of loss was pseudo first order with a t1/2 of 5.8 days. Hydrolysis is the major degradation route of carbosulfan and carbo-furan residues in water. The rate of hydrolysis was more rapid at higher pH and temperature (Fig. 6). The maximum pH occurred during the hottest part of the day between 1400–1600 hours.
This is the time when algal photosynthesis shifts the CO2 equilibrium away from HCO3 to CO3 (Obcemea et al. 1971; Nikkelsen et al. 1977) thus increasing alka-
3
2
1
00 1 2 3 4 5 6 7 8 9
Days
StemGrainsLeaves
Con
cent
ratio
n (m
g/kg
)
Figure 2. Distribution of carbofuran in different parts of rice plants
1 2 3 4 5 6 7
Figure 3. Thin-layer and gas chromatograms of carbosulfan and its metabolites: 1. carbofuran phenol standard; 2. carbofuran standard; 3. carbosulfan standard; 4. 3OH carbofuran; 5. extract of rice leaves harvested 2 days after spraying; 6. 3 keto carbofuran; 7. extract of rice leaves harvested 3 hours after spraying.

143Seeking agricultural produce free of pesticide residues
edited by I.R. Kennedy, J.H. Skerritt, G.I. Johnson and E. Highley ACIAR Proceedings No. 85e
(printed version published in 1998)
Figure 5. Levels of carbofuran in water folowing periodic application
01
02
03
Days
Maximum residue level
Minimum residue level
Con
cent
ratio
n (p
pm)
04
Figure 4. Metabolic pathway of dibutylaminosulfenyl carbofuran (after Umetsu et al. 1979).
O
O
OCN
CH
C4H9
C4H9
(DBSC)
NS
O
O
OCNCH3
(Carbofuran)
O
OH
(Phenol)
H
O
O
HO
Conju.
OCNCH
(3-OH-CF) (3-OH-F)
H O
HO
OH
O
O
O
OCNCH3
(3-C=O-CF)
HO
O
OH
(3-C=O F)
Conju.
Figure 6. Fluctuation in pH at different times of the day under sterile and non-sterile conditions.
7
6
5
080 10 12 14 16 18
Time (hours)
Non-sterile
Sterile
pH
linity. On the other hand, at low pH, carbosulfan is very stable, e.g. at pH 2.5–3.8 in the rat stomach (Umetsu and Fukuto 1982). This could be the reason for its lower mammalian toxicity.
Soil
Carbosulfan residues were not detected in soil. This could be expected because upon reaching the soil, the parent compound has already been converted to carbo-furan in paddy water. Carbofuran remained the major
metabolite in soil for 30 days (Fig. 7). The t1/2 is 4 days. Siddaramapa and Watanabe (1979) reported that degra-dation of carbofuran in flooded soil was slow, because of strong adsorption. This has been considered the determining factor in the fate of insecticide in the soil. Adsorption is highly correlated with the organic matter and clay content of the soil (Stevenson 1975; Edwards 1966). Adsorption also reduces the biological activity and chemical degradation in soil (Ogawa et al. 1976), hence the residue is retained for longer.

144Seeking agricultural produce free of pesticide residues
edited by I.R. Kennedy, J.H. Skerritt, G.I. Johnson and E. Highley ACIAR Proceedings No. 85e
(printed version published in 1998)
Snails (Pila luzonica)
Carbosulfan residues were not detected in snails even at 3 hours after application. The major metabolite detected was carbofuran. About 50% of the residues were obtained on the surface of the shell, suggesting that it might be a good protective covering against pes-ticide. The maximum uptake was obtained one day after spray application with no detectable residues after 7 days in the soft tissues of snails (Fig. 8).
Fish pond
Most of the pesticides used in rice paddy are highly toxic to fish (Table 2).
After inflow of the paddy water into the fish pond 3 hours after insecticide application to the rice paddy, all components were contaminated with the insecticide.
a Rankings are adapted from Nishiuchi (1974):A = LC50 > 1 0 ppm: low toxicityB = LC50 0.5–10 ppm: moderately toxicC = LC50 < 0.5 ppm: extremely toxic
b BPMC = 2-sec-butyl phenyl N-methyl-carbamate
Since carbosulfuran was already converted to car-bofuran even before inflow of the paddy water, the major residue detected was carbofuran. The residue in water was detected up to 15 days. The mechanism of loss was pseudo first-order with a t1/2 of 2.9 days.
As a consequence of contamination of water, uptake of residues by aquatic plants was significant. Maximum uptake was reached on the 15th day, when it levelled off up to 20 days, and declined thereafter (Fig. 9). Residues could still be detected at up to 30 days, but usually at low levels. Absorption through the roots is the normal pathway for systemic insecti-cides such carbofuran.
Residues were detected in Nile tilapia fish. The major metabolite detected in fish was carbofuran. The residue was highest in gut tissue, followed by fil-let, and least in head tissue (Fig. 10). Similar results were reported by Argente et al. (1977).
Residue levels of carbofuran in fish were up to 100 times those in the pond and 10 times those in snails. Nevertheless, the bioconcentration factor is much lower than that in chlorinated insecticides, which can reach 10 000–100 000 times with DDT. Other insecti-cides examined (Table 3) have also bioaccumulated in fish.
Fate in lactating goats
The residues detected on rice plants were simulated by spiking rice fodder fed to goats with 14C-carbofu-ran (ring labelled) at rates of 0.5 and 1 mg/kg/day. Feeding was carried out for 7 days. Excretions in the faeces, urine, and milk were monitored. Accumula-
Table 2. Toxicity of some insecticides to Nile tilapia(Oreochromis niloticus).
Insecticide LC5O (mg/L)at 48 hours
Ranka
Azinphos ethyl 1.0 × 10⁻⁶ C
Endosulfan 6.9 × 10⁻⁴ C
Cyfluthrin 1.6 × 10⁻² C
Chlorpyrifos 3.0 × 10⁻² C
Fenvalerate 3.0 × 10⁻² C
Cypermethrin 3.1 × 10⁻² C
Triazophos 3.5 × 10⁻² C
Etofenprox 9.1 × 10⁻² C
Thiodicarb 0.12 C
Carbosulfan 0.17 C
Alpha cypermethrin + BPMCb 0.22 C
Monocrotophos + fenvalerate 0.25 C
BPMC + chlorpyrifos 0.28 C
Fenitrothion 0.49 C
BPMC 0.64 C
Malathion 1.48 B
Metamidophos 2.96 B
Methyl parathion 3.50 B
Carbaryl 3.52 B
Monocrotophos 13.8 A
Table 3. Bioaccumulation of 14C labelled pesticides in fish
Pesticide Fish (ppb) Water(ppb)
Biocon-centration
factor
Methyl parathion 8.3 1.000 8.3
Carbofuran
Fillet 10.5 0.090 117
Intestines 17.0 0.090 189
Carbosulfan 1.0 0.004 239
Endosulfan I 0.9 0.011 82
Endosulfan II 1.5 0.007 214
Chlorpyrifos
Fillet 1.8 0.027 65
Intestines 4.1 0.027 152

145Seeking agricultural produce free of pesticide residues
edited by I.R. Kennedy, J.H. Skerritt, G.I. Johnson and E. Highley ACIAR Proceedings No. 85e
(printed version published in 1998)
4). Seventy-seven percent of the 14C-carbofuran applied were excreted in the urine, 3% in the faeces, and 0.05% in the milk.
Fate of BPMCIn water
Insecticide application at the recommended rate of 0.75 kg of active ingredient per ha would theoretically give a 2.5 mg/kg residue level at the prevailing water level in the field. However, 1.3 mg/kg was present in the paddy water 3 hours after application. This means that about 50% of the applied material does not reach the target rice plants.
There was a rapid loss of BPMC in water (Fig. 10). The loss followed a pseudo first-order kinetics with t1/2 = 13.9 hours. The probable causes of loss are vol-atilisation, weather factors, hydrolysis and partition-ing into the soil component. The role of sunlight in the degradation of pesticides cannot be discounted. Haque and Freed (1974) found that most of the organic pesticides decompose in the presence of sun-light or ultraviolet radiation.
In soil
The rate of loss of BPMC from paddy mud was much less rapid than that from water over the first 2 days after application.
Adsorption is correlated with organic matter con-tent and soil structure (Edwards 1966). Paddy soil, because of its high clay content, has greater adsortion for BPMC. The residue is thus retained longer in paddy mud than in paddy water.
Figure 7. Adsorption and decline of carbofuran in soils from 0–30 days after spraying
0.3
0.2
0.6
0.5
0.4
0.1
500.0
10 15 20 25 30Days
Paddy soil
Pond soil
Con
cent
ratio
n (m
g/kg
)
Figure 8. Carbofuran residues in snails (Pila luzonica), 0–9 days after spraying
1.0
0.8
1.4
1.2
0.6
0.4
0.2
100.0
2 3 4 5 6 7 8 9Time (days)
Shell
Flesh
Con
cent
ratio
n (p
pm)
tion and distribution in various organs and tissues of the goats were determined. The total milk and urine samples were taken twice daily, and the faeces once a day. The goats were sacrificed after 7 days.
Carbon-14-carbofuran equivalents were detected in various organs and tissues of the goats in decreasing order of concentration: omental fat > liver > kidney > subcutaneous fat > muscle > heart > brain (Table
a Average values from the two goats in each group.b Animal dosed with 0.5 mg/kg/day.c Animal dosed with 1.0 mg/kg/day.
Table 4. Radioactivity levels in different tissues of lactating goat (ppm carbofuran equivalent)a
Tissue Group Ib Group IIc
Blood 0.08 0.07
Liver 0.55 0.69
Omental fat 0.84 1.42
Subcutaneous fat 0.23 0.41
Kidney 0.25 0.43
Brain 0.27 0.34
Heart 0.17 0.33
Muscle (biceps femoris) 0.19 0.34
Muscle (longissimus dorsi) 0.02 0.36

146Seeking agricultural produce free of pesticide residues
edited by I.R. Kennedy, J.H. Skerritt, G.I. Johnson and E. Highley ACIAR Proceedings No. 85e
(printed version published in 1998)
Solubility in water is another factor determining the extent to which pesticides will partition in this substrate. BPMC is insoluble in water. The distribu-tion coefficient (Kd) is obtained using the equation of Hamaker and Goring (1976):
Kd= quantity absorbed in soil (µmoles/kg) ÷ quantity in solution (µmoles/L)
The distribution coefficient increased with time showing that the soil was the ultimate sink for the insecticide (Fig. 11).
The total amount of insecticide from the soil and water portions showed unaccounted increases in resi-dues with time. It might be inferred that these are the result of soil bound residues or actual losses from degradation.
The degradation rate differed between flooded and un-flooded soils (Fig. 12), BPMC degrading more rap-
Figure 9. Uptake by, and decline of carbofuran in ‘kangkong’ (Ipomoea sp.) plants
0.2
0.3
0.1
0.050 10 15 20 25 30
Days
Con
cent
ratio
n (m
g/kg
)
Figure 10. Distribution of carbofuran residues in fish, 0–30 days after spraying
1.2
1.6
0.8
0.4
0.050 10 15 20 25 30
Days
HeadFillet
Intestines
Con
cent
ratio
n (m
g/kg
)
Figure 11. Distribution coefficient of BPMC in soil and water between 0 and 15 days after spraying
2.0
2.5
1.5
1.0
0.5
0.050 10 15
Time (days)
Dis
trib
utio
n C
oeffi
cien
t
Figure 12. Decline curves for BPMC in flooded and unflooded soil
3.0
2.5
3.5
2.0
1.5
1.0
0.5
0.0210 43 5 6 87 9 10 11 1312 14 15
Time (days)
Unflooded soil
Flooded soil
In C

147Seeking agricultural produce free of pesticide residues
edited by I.R. Kennedy, J.H. Skerritt, G.I. Johnson and E. Highley ACIAR Proceedings No. 85e
(printed version published in 1998)
idly in flooded soils. Half-life values were 1.5 days and 2.1 days in flooded and unflooded soils, respectively. This more rapid decomposition under flooded condi-tions might be attributable to the participation of anaer-obic microorganisms in flooded soils (Venkateswarlu et al. 1977).
In flooded soil, the water molecules complete for sites in soil particles so that desorption exceeds adsorp-tion, thus resulting in more rapid degradation of the insecticide (Edwards 1966).
Distribution in rice plants
Residues were highest in rice leaves, followed by those in rice stems and were lowest in rice grains. The high level on the leaves is only to be expected because application was by spraying which was directed towards the thick foliage covering the plants. After a day, almost 90% of the residue was removed from the leaves, declining rapidly to 1.5 mg/kg after 3 days.
Ogawa et al. (1976) found that BPMC was taken up by the roots of rice plants and translocated rapidly to the upper portions of the plants. The decline on the stem was slow compared with that on the leaves because of the protective covering of the foliage shielding the stems from agencies of degradation.
On rice grains, residues were higher on rough rice than on milled rice. The low level in milled rice can be attributed to loss during milling.
Degradation Studies of Chlorpyrifos in a Farmer’s Field
Chlorpyrifos was degraded rapidly in paddy water taken from the field of a farmer who was a high user of pesticides, with residues detectable only up to 3 days
(Table 5). This supports the findings of Zulkifli et al. (1983) and Smith et al. (1966). Coincidentally, this is the time when chlorpyrifos residues were highest on rice stalks. This could be the period during which the rice plants absorbed the chemical in the water by capil-lary action. The residues then started to decline, with a half-life of 187 days.
Chlorpyrifos residues on rice leaves were detectable at up to the 15th day after application. Analysis of soil from a high-pesticide-using farmer showed that the lev-els were higher than in rice plants, i.e. 1.25 mg/kg in soil and 0.09 mg/kg on leaves at day zero. This could be due to rainfall after application of the insecticide, which washed out the residues from the leaves and deposited them in the soil. The soil retained the residue longer than any component of the rice paddy due to adsorption and bound-residue formation. In addition, the soil is the ulti-mate sink of pesticide deposition.
Samples of rice leaves contained the highest levels of residues among the components analysed (Table 5). The size of the plant per volume of spray solution will affect the distribution of pesticide in the plant. Rice grains taken at harvest time did not contain any pesticide resi-due either in dehusked or rough rice. The usual practice of harvesting rice 40 days after the last application may be considered from the consumer’s standpoint. How-ever, stored rice treated with pesticide in warehouses contained residues for a long period (Tejada 1995).
Dissipation of DDT
Natural water from a river was collected and treated with 14C-DDT. Samples were analysed daily for total radioactivity for up to 6 months. Sediments were cen-trifuged from water and analysed separately.
Table 5. Residues of chlorpyrifos from a high pesticide user farm (wet season, 1989)
Days after application
Water Residues (mg/kg)
Rice stalks Rice leaves Soil
0 – 0.003 ± 0.001 0.09 ± 0.01 0.25 ± 0.04
1 0.001 ± 0.004 0.006 ± 0.0001 0.12 ± 0.005 0.23 ± 0.01
2 0.001 ± 0.007 1.009 ± 0.0003 0.10 ± 0.02 0.21 ± 0.02
3 0.001 ± 0.005 0.010 ± 0.005 0.07 ± 0.03 0.11 ± 0.07
5 <0.001 0.002 ± 0.0002 0.01 ± 0.003 0.06 ± 0.01
7 <0.001 <0.001 – 0.08 ± 0.01
15 <0.001 <0.001 0.003 ± 0.005 0.05 ± 0.02

148Seeking agricultural produce free of pesticide residues
edited by I.R. Kennedy, J.H. Skerritt, G.I. Johnson and E. Highley ACIAR Proceedings No. 85e
(printed version published in 1998)
The decline of DDT was rapid in water, with a reduction of 36% in one day, then more gradually to 22% after 14 days. Only 1.69% of the applied 14C-DDT remained after 6 months. The rapid decline maybe attributed to volatilisation, codistillation, and adsorption to suspended particles (Bowman et al. 1959; Acree et al. 1963).
Under field conditions, 14C-DDE dissipated rap-idly, with a half-life of 151 days, comparable with DDT, which has a half-life 105 days. DDD was detected a year after treatment of the soil.
ReferencesAcree, F.M., Beroza, M. and Bowman, M.C. 1963. Codistil-
lation of DDT with water. Journal of Agricultural and Food Chemistry, 11, 278.
Argente, A.M., Seiber, J.N. and Magallona, E.D. 1977. Resi-due of carbofuran in paddy reared fish (T. mosambica) resulting from treatment of rice paddies with Furadan insec-ticide. Paper presented at a meeting of the Pest Control Council of the Philippines, Bacolod City, 18–20 May 1977.
Bajet, O.M. and Magallona, E.D. 1982. Chemodynamics of isoprocarb in the rice paddy environment. Philippine Entomologist, 5, 355–371.
Barril, O.R. and A.W. Tejada. 1982. The dynamics of trans-port and distribution of organochlorine insecticides in low-land paddy rice. In: Annual Report, Philippine Council for Agricultural and Resources Research and Development.
Bowman, M.C., Acree, F. Jr, Schmidst, C.H. and Beroza, M.J. 1959. Journal of Economic Entomology, 52, 1038–1042.
Callejas, E.D. 1982. Movement and metabolism of carbo-sulfan in tomato (Lycopercium esculentum Mill) and analysis by gas chromatography. Unpublished M.S. the-sis, University of the Philippines at Los Baños.
Catahan, M.P. 1977. The persistence of carbofuran in rice paddy water. Unpublished M.S. thesis, University of the Philippines at Los Baños.
Edwards, C.A. 1966. Insecticide residues in soil. Residue Reviews, 13, 83–132.
Haque, R. and Freed, V.R. 1974. Behaviour of pesticides in the environment. Environmental chemodynamics. Resi-due Reviews, 52, 89–116.
Hamaker, J.W. and Goring, C.S.I. 1976. Turnover of pesti-cide residues in soil. Washington, D.C., American Chem-ical Society Symposium Series 29.
Lucero, C.M. 1980. The dynamics of transport and distribution of two organochlorine insecticides (Lindane and Endosul-fan) in a lowland rice field ecosystem. Unpublished Ph.D. thesis, University of the Philippines at Los Baños.
Nischiuchi, Y. 1974. Testing methods for the toxicity of agricultural chemicals. Japan Pesticides Information, 19, 16–19.
Nikkelsen, D.S., De Datta, S.K. and Obcemea, W.N. 1977. Paper presented at the International Rice Research Con-
ference, IRRI, Los Baños, Laguna, Philippines, 18–22 April 1977.
Ogawa, K., Tsuda, M., Yamauchi, F., Yamaguchi, I. and Misato, T. 1976. Metabolism of 2-butyl phenyl N-meth-ylcarbamate and its degradation in soils, Journal of Pesti-cide Science, 1, 217–229.
Obcemea, W.N., Nikkelsen, D.S. and De Datta, S.K. 1971. Factors affecting ammonia volatilization losses from flooded environment of rice. Paper presented at the 8th Annual Meeting of the Crop Science Society of the Phil-ippines, 5–7 May, Benguet.
Seiber, J.N., Catahan, M.P. and Barril, C.R. 1978. Loss of car-bofuran from rice paddy water. Chemical and physical fac-tors. Journal of Environmental Science and Health, 13, 131.
Siddaramapa, R. and Watanabe, I.1979. Persistence in soil and adsorption and movement of carbosulfan in rice plants. Journal of Pesticide Science, 4, 473–479.
Smith, G.N., Watson, B.S. and Gould, F.M. 1966. The metabolism of MC-0, 0-diethyl 0-(3,5,6-trichloro-2-pyridyl) phosphorotheoate (Dursban) in fish. Journal of Economic Entomology, 59, 1464–1475.
Stevenson, F.J. 1975. Organic matter reactions involving pesticides in soil. In: Kaufman, D.G., ed., Bound and conjugated pesticides . ACS Symposium Series 29.
Tejada, A.W. 1983. Fate of carbosulfan in rice paddy eco-system. PhD thesis, University of the Philippines at Los Baños, College. Laguna.
Tejada, A.W. 1995. Pesticide residues in foods and the envi-ronment as a consequence of crop protection. Philippine Agriculture, 78, 63–81.
Tejada, A.W. and Magallona, E.D. 1985. Fate of carbosul-fan in rice paddy environment. Philippine Entomologist, 6(3), 29.
Umetsu, N.M., Fahmy, A.H. and Fukuto, T.R. 1979. Metab-olism of 2,3-dihydro 2,2-dimethyl 7-benzofuranyl (di-n-butyl amino sulfenyl) methyl carbamate and 2,3-dihydro 2,2-dimethyl-7 benzofuranyl (morpholisulfenyl) methyl carbamate and cotton and corn plants. Pesticide Bio-chemistry and Physiology, 10, 104–119.
Umetsu, N.M., and Fukuto, T.R. 1982. Alteration of carbo-sulfan (2,3-dihydro 2,2-dimethyl-7 benzofuranyl (di-n-butyl amino sulfenyl) (methyl carbamate) in rat stomach. Journal of Agricultural and Food Chemistry, 30, 555–557.
Varca, L.M. 1981. Residues of BPMC (2-sec-butyl phenyl N-methyl-carbamate) on some components of a paddy rice ecosystem. Unpublished M.S. thesis, University of the Philippines at Los Baños.
Venkateswarlu, K., Gowda, T.S. and Sethunathan, N. 1977. Persistence and biodegradation of carbofuran in flooded soil. Soil Science Society of America Proceedings, 34, 440.
Zulkifli M., Tejada, A.W. and Magallona, E.D. 1983. The fate of BPMC + chlorpyrifos in some components of a paddy rice ecosystem. Philippine Entomologist, 6, 555–565.