Source Water Assessment Report - deq.state.or.us is the Source Water Assessment Report for the...
40
Source Water Assessment Report City of Cannon Beach, Oregon PWS #4 1 00 1 64 February 12, 2002 Prepared r City of Cannon Beach Prepared by � � I•] •1 Slo Orn amonlof Enronmenlal QuaIlly Water Quality Division Drinking Water Protection Program Department of Human Services Oregon Health Division Drinking Water Program
Transcript of Source Water Assessment Report - deq.state.or.us is the Source Water Assessment Report for the...
Source Water Assessment Report
City of Cannon Beach, Oregon PWS #4 1 00164
February 12, 2002
Prepared for City of Cannon Beach
Prepared by
�
� I•] :(•1 Slalo of Oregon Dopartmonlof Envfronmenlal Qua Illy
Water Quality Division Drinking Water Protection Program
Department of Human Services Oregon Health Division Drinking Water Program

regon John A. Kitzhabcr, 110., Governor
Department of Environmental Quality 811 SW Sixth Avenue
Portland, OR 97204-1390 (503) 229-5696
TTY (503) 229-6993
Febrnary 12, 2002
Ms. Joy Gannon City of Cannon Beach PO Box 368 Cannon Beach, Oregon 97110
RE: Revised Source Water Assessment Report City of Cannon Beach PWS # 4100164
Dear Ms. Gannon:
Enclosed is the Source Water Assessment Report for the surface water portion of Cannon Beach's drinking water protection area. This report has been revised to incorporate your comments dated February 5, 2002. A source water assessment report for the groundwater supply will be addressed in a separate report. The assessment was prepared under the requirements and guidance of the Federal Safe Drinking Water Act and the US Environmental Protection Agency, as well as a detailed Source Water Assessment Plan developed by a statewide citizen's advisory committee here in Oregon over the past two years. The Department of Environmental Quality (DEQ) and the Oregon Health Division (OHD) are conducting the assessments for all public water systems in Oregon. The purpose is to provide information so that the public water system staff/operator, consumers, and community citizens can begin developing strategies to protect your source of drinking water.
As you know, the 1996 Amendments to the Safe Drinking Water Act requires Consumer Confidence Reports (CCR) by community water systems. CCRs include information about the quality of the drinking water, the source of the drinking water, and a summary of the source water assessment. Public water systems are responsible for notifying their customers of the assessment results. The information from this assessment can be presented by distributing the "Summary Brochure" attached to the report. There is a blank space to insert instructions for how customers can obtain or review a copy of your source water assessment report. Distribution of any copies of the report must be done at the local level. At a minimum, we would suggest that a copy be placed at the local library, city hall, and/or public water supply office and your customers can review the report at their convenience. By mid-2003, all results of these assessments will also be made available electronically to the public on DEQ's and OHD's websites.
There are no regulatory requirements for you to develop a protection plan using the assessment results, but we hope your community will take the initiative to do so voluntarily. One of the goals of developing a Drinking Water Protection Plan is to address the facilities and land use activities that pose high or moderate risks for contaminating your public water supply. At a
@ DEQ-1

Cannon Beach February 12 , 2002 Page2
minimum, we recommend that the community seek ways to communicate and extend outreach to these facilities/activities with education and technical assistance to minimize the risk of contamination. As you begin thinking about developing a protection plan, it is also important to remember that not all of the assessment's inventoried activities will need to be addressed in a voluntary protection plan. If you move fotward with developing a protection plan, the next step is to enhance the assessment inventory and, at that time, the "potential contaminant sources" which pose little to no tln·eat to your public water supply can be eliminated from your list.
We look fmward to working with you to move forward with developing a protection plan and can assist you with limited resources at this time. In addition, we are developing some useful written guidance and materials that will assist your protection efforts and you will receive these when complete.
We have enclosed one copy of the large GIS map of the watershed and the assessment results. A smaller version of this exact map is found in the report. If you have a need for additional copies of the large map, we must charge a small fee for each to cover the costs that were not budgeted by the program. Let me know if you need additional copies.
If you have any questions or need more information, please do not hesitate to call me at 503-229-5664 or Sheree Stewart at 503-229-5413.
Sincerely,
Julie K. Harvey, R.G. Drinking Water Protection Specialist Water Quality Division
Enclosures
Table of Contents
Executive Summary. . . . . . . . . . . . . . . . . . . . . . . . . . . . . . . . . . .. . . . . . . . . . . . . . . . . . ... . . . . . . . . . . . . .. 1
Introduction.. . . . . . . . . . . .......... . . . . . . . . . . . . . .. . . . . . . . . . . . . . . . . . . . . . . . . . . . . . . . . . . . . . . . . ... 2
Background... . . . . . . . . . . . . .. . . . . . . . . . ... . . . . . . . . . . . . . . . . . . . . . . . . . . . . . . . . . .. . . . . . . . . . . . . . ... 3 Delineation of the Protection Area
Methodology.. ... . . . . .. . . . . . . . . . . . . .... . . . . . . . . . . .. . . . . . . . . . . . .. . . . . .... . . . ...... 4 Results. . . . . . . . . . . . . . . . . . . . . . . . . . . . . . . . . . . . . . ... . . . . . . . . . . . . . . . . ..... . . . . . . . . . . . . .. 4
Identification of Sensitive Areas Methodology.. . . .. .. . . . . . . .. . . . . . . . . . . . . . . . . . . . . . . ... . . . . . . . . . . . . . .. . . . . . . . . . . . . . 4 Results. . . . .. . . . . .. . . . . . . . . . . . . . . ... . . . . . . ..... . . . . .. . . . . . . . ... . . . . . . . . ...... . . . . . . 7
Inventory of Potential Contaminant Sources Methodology. . . . . . . . . . .... . ... . . ... . . . . . . .. . . . . .. . .. . .. . . . . . . . . . . . . .. . . . . . . . . .... 7 Results. . . . . . . . . . . . . . . . . . . . . . . . . . .. . . . . . . .......... . . . . . . . . . . . .. . . . . . . . . . . . . . . .. . . . 9
Susceptibility Analysis Methodology. . . . ... . . . . .. ..... . . . .. . . . .. . . ... . . . . . . . . . . . .. . . . .. . . . . . . . . . . . . . ..... 10 Results . . . . . ... . ... . . . . . . . . . . . . . . .. . . ..... . . . . . . . . . . ........ . . . . . . . . . . .. . . . . . . . . . . . 1 1
Summary and Recommendations. .. . . . . . . . . ... . .. . . . . . .. . . .. . .. . . . . .. . . . . . . . . . . ... . . . .. 12
Developing a Drinking Water Protection Plan... . . . . . . . . . . . . . .. . ....... . . . ... . . . . . . .. 14
References. . . . . . . . . . . . . . . . . . . . . . . . . . . . . . . . . . . . . . . . . . . . . . . . . . . . . . . . . . . . . . . . . . . . . . . . . . . . . . . . . 17
Figures Figure l . City of Cannon Beach's Drinking Water Protection Area Figure 2. Sensitive Areas within City of Cannon Beach's Drinking Water Protection Area Figure 3. Source Water Assessment Results -
Tables
City of Cannon Beach's Drinking Water Protection Area with Sensitive Areas and Potential Contamination Sources
Table I. Summary of Potential Contaminant Sources by Land Use Table 2. Inventory Results- List of Potential Contaminant Sources
A ttachment Attachment A. Source Water Assessment Sun1111ary Brochure
Oregon Source Water Assessment Report (02/12/02) City of Cannon Beach-PWS # 4100164


Executive Summary The drinking water for the City of Cannon Beach is supplied from two sources. The primaiy source originates from a series of springs located on City owned property and the supplement source is supplied by a surface water intake on the West Fork Elk Creek (also known as West Fork Ecola Creek). The Source Water Assessment addresses only the surface water component of Cannon Beach's drinking water supply. The groundwater supply will be addressed in a separate report. The public water system serves approximately 1588 citizens that is augmented by a large tourist and transient populations that can swell the population to 1 0,000 plus in the summer months.
The geographic area providing water to Cannon Beach's intake (the drinking water protection area) extends upstream approximately 1 3 miles in a southerly direction and encompasses a total area of 8.3 square miles. The intake is located in the Necanicum River Watershed in the Necanicum Sub-Basin of the Northern Oregon Coastal Basin. The West Fork Elk Creek (also known as West Fork Ecola Creek) intake is located at an approximate elevation of 50 feet and the upper edge of the watershed is located at an elevation of 3,050 feet at Onion Peak.
An inventory of potential contamination sources/or the swface water source was performed within Cannon Beach's drinking water protection area. The primary intent of this inventmy was to identify and locate significant potential sources of contaminants of concern. The inventory was conducted by reviewing applicable state and federal regulatory databases and land use maps, interviewing persons knowledgeable of the area, and conducting a windshield survey by driving through the drinking water protection area to field locate and verify as many of the potential contaminant source activities as possible. The primary contaminants of concern for surface water intakes are sediments/turbidity, microbiological, and nutrients. It is important to remember that the sites and areas identified are only potential sources of contamination to the drinking water, and water quality impacts are not likely to occur when contaminants are used and managed properly.
The delineated drinking water protection area is primarily dominated by managed forest land uses. Three potential contamination sources were identified within Cannon Beach's drinking water protection area. Of those, two are located in the sensitive areas. The potential contaminant sources identified in the watershed include various regions of managed forest land owned by the City of Cannon Beach and other public and private entities. The potential contaminant sources within the drinking water protection area all pose a relatively higher to moderate risk to the drinking water supply with the exception of City owned land which is not actively managed, has never used pesticides or fertilizers, and has a "no application" policy. This provides a quick look at the existing potential sources of contamination that could, if improperly managed or released, impact the water quality in the watershed.
The susceptibility analysis combines the results of the locations of the potential contaminant sources with the locations of the sensitive areas. Overlaying the locations of the moderate- to high-risk sources within the sensitive areas provides an indication of the areas that are highly susceptible to contamination. In the Cannon Beach watershed, the results of the susceptibility "analysis" include the distribution of one identified high- to moderate-risk sources within the areas of highly permeable soils, high erosional soils, high runoff potential soils, and within the 1000' setback from the streams. The susceptibility analysis provides the community and the public water system with information on where the greatest risk occurs and where to focus resources for protection.
Oregon Source Water Assessment Report (02/12/02) City of Caimon Beach-PWS # 4100164
1

Introduction In 1996, Congress amended the Safe Drinking Water Act, implemented some new requirements, and provided resources for state agencies to assist communities in protecting the sources of their public water supplies. The US Environmental Protection Agency (EPA) developed guidelines for implementing the new requirements to conduct "source water assessments" (EPA, 1997). In
Oregon, the Oregon Health Division (OHD) and the Department of Environmental Quality (DEQ) are conducting the source water assessments. An assessment such as this one will be done for every public water system in Oregon regulated by the Safe Drinking Water Act. DEQ and OHD will each have specific tasks in accomplishing the assessments for a total of 2656 public water systems in Oregon. Of those 2656 public water systems, about 90% of these are groundwater systems drawing water from wells or springs, and 1 0% are surface water systems with intakes on sh·eams, rivers, or lakes/reservoirs.
The assessments in Oregon include delineating the source area supplying the public water system, identifying areas "sensitive" to contamination, and conducting an inventory of potential contamination sources in the area. Using the results of the inventory and sensitive areas, the susceptibility of the public water system is determined. OHD will provide the delineation for all groundwater systems and the identification of the sensitive areas within their source area. DEQ will delineate and identify the sensitive areas within the watersheds for the surface water systems. DEQ will conduct all inventories of the potential contaminant sources inside the drinking water protection areas and this is then used to estimate the public water system's susceptibility to contamination.
Sources of information reviewed during this assessment included U.S. Geological Survey (U.S.G.S.) documents/websites, DEQ reports, EP A/DEQ databases, and other readily accessible reports. The reference list provides a few of the good sources of information used in the report. Time constraints do not allow research into all existing technical resources available for each system. As the assessment is performed, assistance from municipal water staff, state/federal land management officials, and community members will increase OHD and DEQ's abilities to characterize local hydrogeologic/hydrologic conditions, site-specific information, and ultimately increase the quality of the assessment. Where possible, DEQ staff has consulted local Natural Resource Conservation Service, county planning agencies, irrigation districts, and other natural resource officials.
Many watersheds in Oregon provide water used for public or "domestic" drinking water supplies, irrigation, industry, hydro power, fish hatcheries, and of course, natural in-stream fish rearing. Watersheds vary considerably in terms of overall health and susceptibility to contamination. Most surface water sources for drinking water are filtered and undergo h·eatment (disinfection) prior to delivery to the consumer. The ability to adequately (and cost-effectively) treat drinking water from a surface water source is directly related to the quality of the water at the intake. Surface water intakes for public water supplies are generally very susceptible to increases in coarse sediments. Treatment facilities for public water supplies are very susceptible to increases in fine sediments, nutrients and other organic and inorganic contaminants. Treatment facilities are also negatively impacted by changes in temperature.
Changes in surface water quality parameters can be caused by a variety of factors in any watershed. Detailed consideration of all the variables was beyond the scope of this assessment. The procedures for conducting these assessments were developed by a statewide advisory committee (Source Water Assessment Plan, 1999). The value of preparing detailed procedures
2 Oregon Source Water Assessment Report (02/12/02) City of Cannon Beach -PWS # 4100164

is in the ability to be consistent from one system to the next. There are also severe time constraints for the amount of time allowed to complete each public water system assessment. It
is our intent to provide as much information about the watershed as our program resources allow.
Using the results of this assessment, the public water system and the local community can then move forward with voluntarily developing and implementing a drinking water protection plan. The requirements for water quality monitoring of public water systems in Oregon provide some degree of assurance of safe drinking water; however, all systems are vulnerable to potential contamination. One of the best ways to ensure safe drinking water and minimize future treatment costs is to develop a local plan designed to protect against potential contamination. Not only will this measure add a margin of safety, it will raise awareness in the local community of the risks of drinking water contamination, and provide information to them about how they can help protect the system. It is our hope that each community will use the assessment results as a basis for developing a drinking water protection plan.
Background Cannon Beach is located in Clatsop County, Oregon about 8 miles south of Seaside on Highway I 0 I. The public water system serves approximately 1,588 citizens that is augmented by a large tourist and transient populations that can swell the population to 1 0,000 plus in the summer months. The drinking water for the City of Cannon Beach is supplied from two sources. The primary source originates from a series of springs located on City owned property and the supplement source is supplied by a surface water intake on the West Fork Elk Creek (also known as West Fork Ecola Creek). The Source Water Assessment addresses only the surface water component of Cannon Beach's drinking water supply. The groundwater supply will be addressed in a separate report.
The West Fork Ecola Creek intake is located in the Necanicum River Watershed in the Necanicum Sub-Basin in the Northem Oregon Coastal Basin, Hydrologic Unit Code (HUC) #
17 10020 I. DEQ obtained the coordinates for the intake using a Geographic Positioning System (OPS) in February 1999; these coordinates are available to the public water system operator upon request. In addition, Cannon Beach uses several springs (a groundwater source). This Source Water Assessment addresses only the surface water component of Cannon Beach's drinking water supply. The groundwater supply will be addressed in a separate report.
The study area for evaluating the extent of the Cannon Beach Drinking Water Protection Area (DWPA) includes US Geological Survey topographic maps for the Arch Cape ( 1985) and Tillamook Head ( 1973) quadrangles at the 1 :24,000 scale. The surface water intake plots on the U.S. Geological Survey Tillamook Head quadrangle topographic map.
The Necanicum Sub-Basin (Hydrologic Unit Code (HUC) # 17 100201 ) is the catchment basin for approximately 129 square miles (USGS) that all discharge to the ocean along the coast between Gearhart and Manzanita. The Sub-Basin includes the Necanicum River, Ecola Creek and numerous smaller tributaries. These systems flow in a westerly direction from the slopes of the Coast Range to the ocean.
The climate in the Necanicum Sub-Basin area is characterized by moderate annual temperature and precipitation variations. Information on climate in the Cannon Beach area is based on the
Oregon Source Water Assessment Report (02/12/02) City of Cannon Beach-PWS 11 4100164
3

National Oceanic and Atmospheric Administration's (NOAA) Seaside climate station located at an elevation of 10 feet above mean sea level (Western Regional Climate Center). The average annual temperature is 52 degrees for the period of 1930 to 2000. Winters are cool and wet, with temperatures usually staying above freezing. The Seaside station gets an average of two inches of total snowfall per year but none of it accumulates to measurable depths. The summers are dry and moderately warm to hot, with temperature highs of approximately 65 to 70 degrees. Average annual precipitation is about 78 inches, with 70% of that occun-ing between November and March.
Delineation of the Protection Area Methodology The delineation of the source area or the "drinking water protection area" is a fundamental aspect of the assessment of a public water system. For surface water systems such as Cannon Beach's, the drinking water protection area delineation process begins by identifying the watershed. The watershed area is also called the catchment basin of a receiving water body. The outer boundary of this watershed is the drainage divide formed by the surrounding ridges and hills. The surface water delineation includes the entire watershed area upstream of the public water system intake structure. This watershed area provides "source" water to the surface water intake.
A map of the drinking water protection area provides the community with the knowledge of the geographic area providing the water to the intake. This is the area where contamination poses the greatest threat to the drinking water supply. Information about the drinking water protection area allows the community to develop management strategies that will have the most impact on protecting the source of the drinking water.
Results DEQ has collected and reviewed data for the purpose of delineating the drinking water protection area for Cannon Beach's intake on West Fork Elk Creek (West Fork Ecola Creek). The scope of work for this report included collecting information from the water system operator, researching written reports, and establishing a Geographic Information Systems (GIS) basemap of the delineated watershed. Cannon Beach's drinking water protec;tion area for the surface water source is shown in Figure 1. Cannon Beach's drinking water protection area extends upstream approximately 13 miles in a southerly direction and encompasses a total area of 8.3 square miles. The Cannon Beach's intake is located at an approximate elevation of 50 feet as West Fork Elk Creek (West Fork Ecola Creek) flows into the valley floor from the foothills. The upper edge of the watershed is located at an elevation of approximately 3,050 feet at Onion Peak feet; therefore, the elevation change from the upper edge of the watershed to the intake is approximately 3,000 feet.
Identification of Sensitive Areas Methodology After delineating the entire watershed, DEQ identified the "sensitive areas" within the watershed. The objective in determining the sensitive areas for swface water sources is to produce reliable information to the community and public water system that is usefiil in developing and prioritizing protection strategies. The list of the sensitive areas to be identified
4 Oregon Source Water Assessment Report (02/12/02) City of Cannon Beach -PWS # 4100164

within drinking water watersheds was defined by the DEQ advisory committee as the procedures were developed (SWAP, 1999). The sensitive areas within a drinking water watershed includes both setbacks (land adjacent to stream) and other natural factors that increase the risk of contamination of the surface water. The result is an identification· of a subset of the entire watershed. The sensitive areas are those where potential contamination sources or land use activities, if present, have a greater potential to impact the water supply.
In establishing sensitive areas in a watershed, there are several limiting factors to take into account. In using a Geographic Information System (GIS) to delineate the sensitive areas within the watershed, DEQ locates existing GIS layers and other natural resource agency data sets. Not all areas of the state have been mapped for the natural resource parameters of interest or at the level of detail ideal for this type of analysis. The availability of data at appropriate scales is also a potential limitation. The sensitive area mapping may be limited simply by the lack of readily available data, and conducting additional research is not possible within the time frame allowed to do this assessment. DEQ staff has sought to obtain the best available information for each water system as the source water assessment was performed.
There are four individual characteristics that dete1mine the sensitivity of areas within the drinking water watersheds in the Source Water Assessment Plan ( 1999) procedures for Oregon water systems. A brief description of the sensitive area characteristics and the sources of the GIS data are included below.
Sensitive Area Setbacks The first sensitive area is a setback using a consistent 1000' (about 300 meters) distance from the water body. The 1000' sensitive area setbacks are intended to identify those areas where there are higher risks of contamination by spills or other releases, simply due to their proximity to the water body. The sensitive area setbacks are identified as a minimum of 1 000' from centerline of the intake stream and all perennial tributaries within the delineated drinking water watershed. The distance of 1000' was based on EPA national guidance for the distance to conduct the potential contamination source inventories adjacent to streams.
High Soil El'Osion Potential The soil erosion potential is determined by combining the effects of slope and the soil erodibility factor ("K-factor"). Slopes within a watershed are evaluated using the 1 :24,000 SSURGO (Soil Survey Geographic Database) data sets from the Natural
Resources Conservation Service. The slope for a map unit is a weighted average of the average slope. The soil erodibility factor is also available in the SSURGO database and quantifies the susceptibility of soil particles to detachment and movement by water including the effects of rainfall, runoff, and infiltration. The K-factor used is a weighted average of only the value for the surface layer of the map unit. In the watershed, only soils with "high" erodibility ratings were mapped as sensitive areas. Soils that classify as "high" include soil with slopes greater than 30% and K-factors greater than 0.25. This rating system is based on the Revised Universal Soil Loss Equation from the USDA Agricultural Research Service as defined in the Washington's Standard Methodology for Conducting Watershed Analysis (Washington Forest Practices Board, 1993).
Oregon Source Water Assessment Report (02/12/02) City of Cal1llon Beach-PWS # 4100164
5

High Permeability Soils Soils identified in the US. Geological Survey geologic map of Oregon GIS layer ( 1:500,000 scale) as Recent Alluvial Deposits (Qal), Dune Sand (Qd) and Landslide and Debris Flow Deposits (Qls) are mapped as sensitive areas due to the high potential for groundwater recharge adjacent to the stream. Alluvial deposits, dune sand and landslide deposits are typically very high permeability soils. These areas may be very vulnerable to rapid infiltration of contaminants to groundwater and subsequent discharge to a stream or lake/reservoir.
High Runoff Potential The potential for high runoff rates was evaluated using the I :24,000 SSURGO (Soil Survey Geographic Database) data sets from the Natural Resources Conservation Service. Class D soils, which are defined as soils with very slow infiltration rates were mapped as sensitive areas within the boundaries of the drinking water protection area. Map units are assigned to hydrologic groups based on their majority component. A Class D soil is typified as clayey, has a high water table, or an impervious layer occurs at a shallow depth. Soils with these characteristics would have the potential for rapid runoff and subsequent transport of sediments and possible contaminants to the surface water body supplying the public water system.
Additional Sensitive Areas There may be other natural characteristics within a watershed that can be mapped as sensitive. Modifying the list of sensitive areas in this assessment can be done by the public water system or the community by identifying resources and procedures that are appropriate for the individual system. For example, the local community may choose to add "transient snow zones", high rainfall areas, and landslide/debris-flow hazards to the sensitive areas within their watershed. Due to time constraints, these additional areas will not be mapped by DEQ as part of this source water assessment, but can be added by the local community before developing a protection plan.
Transient snow zones are typically defined as areas above 1500 feet in the Oregon Coast Range, or above 2000 feet in the Cascades. In some watersheds, these areas may be subject to rapid snowmelt or rain-on-snow events which increase the likelihood of transport of sediments to the surface water bodies in the watershed. Areas of high rainfall or irrigation rates may increase the likelihood of transport of sediments and possible contaminants to the surface water body. These areas can be identified using average annual precipitation data from Oregon Climate Service (years 1961 through 1990) and irrigation/water rights data from Oregon Water Resources Department's water rights database. Mapping the high risk landslide and debris-flow areas can also be useful for evaluating sediment risks from natural hazards within a drinking water watershed. The Department of Forestry has recently completed GIS-based landslide and debris flow maps for western Oregon (Website address: http://www.odf.state.or.us/gis/debris.html).
The final watershed map for each public water system intake includes a composite of all sensitive areas identified by DEQ within the watershed. This composite or overlay will enable the communities and responsible agencies to focus future protection efforts in these sensitive areas.
6 Oregon Source Water Assessment Report (02/12/02) City of Callilon Beach -PWS # 4100164

Results The sensitive areas within the Cannon Beach's drinking water protection area for the swface water source are shown 011 Figure 2. These include the setbacks from the main stem and all perennial tributaries, areas of high soil permeability, and areas of high soil erosion potential. Areas with high runoff potential were not identified in the GIS layers. Good data coverage was available for the Cannon Beach watershed for each of the sensitive areas.
Inventory of Potential Contaminant Sources Methodology The primary intent of an inventory is to identify and locate significant potential sources of any of the contaminants of concern within the drinking water protection area. Significant potential sources of contamination can be defined as any facility or activity that stores, uses, or produces the contaminants of concern and has a sufficient likelihood of releasing such contaminants to the environment at levels that could conh·ibute significantly to the concentration of these contaminants in the source waters of the public water supply. An inventory is a very valuable tool for the local community in that it:
• provides information on the locations of potential contaminant sources, especially those that present the greatest risks to the water supply,
• provides an effective means of educating the local public about potential problems,
• provides valuable awareness to those that own or operate facilities and land use activities in the drinking water protection area, and
• provides a reliable basis for developing a local protection plan to reduce the risks to the water supply.
Inventories are focused primarily on the potential sources of contaminants regulated under the federal Safe Drinking Water Act. This includes contaminants with a maximum contaminant level (MCL), contaminants regulated under the Surface Water Treahnent Rule, and the microorganism Cryptosporidium. The inventory was designed to identify several categories of potential sources of contaminants including micro-organisms (i.e., viruses, Giardia lamblia, Cryptosporidium, and fecal bacteria); inorganic compounds (i.e., nitrates and metals); organic compounds (i.e., solvents, petroleum compounds and pesticides) and turbidity/sediments. Contaminants can reach a water body (groundwater, rivers, lakes, etc.) from activities occurring on the land surface or below it. Contaminant releases to water bodies can also occur on an areawide basis or from a single point source.
When identifYing potential risks to a public water supply, it is necessm)' to make "worst-case" assumptions. This is important because it is the POTENTIAL risk that we are attempting to determine through this procedure and it is simply not possible within our time constraints to conduct individual reviews or inspections at any of the facilities or land uses. The worst-case assumption that is made when considering potential risks to water bodies is that the facility or activity is not employing good management practices or pollution prevention. Under today's regulatOI)' standards and environmental awareness, the majority of the identified activities and land uses employ "best management practices" (BMPs) in handling contaminants or preventing water quality degradation fi'om their operations. It is important to note that while this assessment will list all POTENTIAL risks, many of these do not present actual risks to the water system. Environmental contamination is not likely to occur when contaminants are handled and
Oregon Source Water Assessment Report (02/12/02) City of Cannon Beach -PWS # 4100164
7

used properly, or when BMPs are employed. The day-to-day operating practices and environmental (contamination) awareness varies considerably ji-0111 one facility or land use activity to another. In-depth analysis or research was not completed to assess each specific source's compliance status with local, state and/or federal programs or laws. Further, the invento1;1 process did not include an attempt to identifY unique contamination risks at individual sites such as facilities (permitted or not) that do not safely store potentially hazardous materials. After the assessment is completed, the next step is to conduct an "enhanced" invento1y that will look at the site-specific practices. The potential sources listed in the assessment that employ BMPs (required through regulations OR voluntaril;) can be removed jiwn the list during the next step in the process of developing a voluntmy drinking water protection plan.
Assumptions are also made about what potential contamination sources are included in the various types of land uses. For example, it is assumed that rural residences associated with farming operations have specific potential contamination sources such as fuel storage, chemical storage and mixing areas, and machinery repair shops. Again, any errors in these assumptions can be easily corrected as the community moves beyond the assessment to develop a protection plan.
Past, current, and possible future potential sources of contaminants were identified through a variety of methods and resources. In completing this inventory, DEQ used readily available information including review of DEQ, EPA, and other agencies' databases of ctmently listed sites, interviews with the public water system operator, and field observation as discussed below. The process for completing the inventory for Cannon Beach's drinking water protection area included several steps, which are summarized as follows:
l . Collected relevant information as of August 200 I from applicable state and federal regulatory databases including the following lists:
8
- DEQ Environmental Cleanup Site Information System (ECSI) which includes the U.S. EPA National Priorities List (NPL) and the U.S. EPA Comprehensive Environmental Response, Compensation and Liability Information System (CERCLA) list;
- DEQ leaking underground storage tank (LUST) list; - DEQ registered underground storage tank (UST) list; - DEQ Active Solid Waste Disposal Permits list; - DEQ Dry Cleaners list; - DEQ Site Information System (SIS) which includes Water Pollution Control Facility
(WPCF) and National Pollutant Discharge Elimination System (NPDES) permitted facilities;
State Fire Marshall Hazardous Material Handlers (HAZMAT) site list (information on materials in a gas-form was not used since gaseous compounds rarely pose a threat to surface water or groundwater);
- DEQ Underground Injection Control (UIC) list of facilities with registered underground injection control systems; and
- DEQ Hazardous Waste Management Information System (HWIMSY) list which includes U.S. EPA Resource Conservation Recovery Act (RCRA) generators or notifiers and U.S. EPA RCRA Treatment, Storage, and Disposal Facility (TSDF) Permits.
Because of the way various state and federal databases are set up, the specific location of listed sites is not always given or accurate within the database. DEQ verified the presence and approximate location of potential contaminant sources and land uses within the drinking
Oregon Source Water Assessment Report (02/12/02) City of Cal11lon Beach -PWS # 4100164

water protection area by consulting with local community members and/or by driving through the area (windshield survey) as discussed below in subsequent inventory steps.
2. Interviewed public water system officials, or someone they designated as knowledgeable of the area to identify potential sources that are not listed elsewhere in databases or on maps and to assist in locating potential sources listed in the state and federal databases.
3. Conducted a windshield survey by driving through the drinking water protection area to field locate and verify as many as possible of the potential contaminant source activities. We looked for potential contaminant sources within four general categories of land use: residential/municipal, commercial/industrial, agricultural/forest, and other land uses (see Table !).
4. Assigned high-, moderate-, or low-risk ratings to each potential contaminant source based on the Oregon Source Water Assessment Plan ( 1999). A summary of the types of potential contaminant sources and level of assigned risk is presented in Table 1 (Summary of Potential Contaminant Sources by Land Use). The "comments" section of Table 2 (Inventory Results- List of Potential Contaminant Sources) provides justification for any modifications to the risk rating that may have resulted from field observations that were different from what is typically expected for the specific facility. Relative risk ratings are considered an effective way for the water supply officials and community to prioritize management efforts for the drinking water protection area. When the local water supply officials and community "team" enhance the inventory for use in developing management options, further analysis may need to be conducted to more closely evaluate the actual level of risk.
5. Produced final summary of the inventoried sources and the GIS base map, which are presented in this report.
Results The results of the inventmy were analyzed in terms of current, past, and future land uses; their proximity to the intake; and their associated potential risk. In general, land uses that are closest to the intake and those with the highest risk rating pose the greatest threat to your drinking water supply. The inventory results are summarized in Tables l and 2 and are shown on Figure 3.
The delineated drinking water protection area for the swface water source is primarily dominated by managed forest lands. Three potential contaminant sources (detailed on Figure 3 and Table 2) were identified in the watershed. The potential contaminant sources identified in the watershed include various regions of managed forest land owned by the City of Cannon Beach and other public and private entities. Area-wide potential sources such as managed forest areas extend throughout the protection area and are shown on Figure 2 in the location nearest to the intake. The City's drinking water treatment plant, a relatively lower risk within the watershed, is located just downstream of the intake.
The managed forest lands within the drinking water protection area all pose a relatively higher to moderate risk to the drinking water supply with the exception of City owned land which is not actively managed, has never used pesticides or fertilizers, and has a "no application" policy on City maintained property. There were no facilities or sites identified on the regulatory databases that were searched within the Drinking Water Protection Area.
Oregon Source Water Assessment Report (02/12/02) City of Cannon Beach-PWS # 4100164
9

This inventory of potential contaminant sources within the City of Cannon Beach's drinking water protection area provides a quick look at the potential sources that could, if improperly managed, impact the water quality in the watershed. Even very small quantities of certain contaminants can significantly impact water bodies. It is important to remember the sites and areas identified in this section are only potential sources of contamination to the drinking water.
Susceptibility Analysis Methodology Susceptibility can be defined as the potential for contamination in the drinking water protection area to reach the intake on the surface water body being used by a public water system for drinking water purposes. Whether or not a particular drinking water source becomes contaminated depends on three major factors: 1 ) the occtmence of a facility or land use that releases contamination, 2) the location of the release, and 3) the hydrologic and/or soil characteristics in the watershed that allow the transport of the contaminants to the surface water body.
In conducting a susceptibility analysis the first step is identifying that part of the watershed that is most sensitive to contamination. This was accomplished after the delineation phase of this assessment. The second step consists of identifying and locating the potential contaminant sources in the drinking water protection area. Based on the type of facility and the nature of the chemicals they use, these sources represent a lower-, moderate-, or higher-relative risk to the surface water body. This step was accomplished in the inventory phase of the assessment.
The third step in the susceptibility analysis is to overlay the results of the inventory with the map of the sensitive areas. The results of the inventory are analyzed in terms of current, past, and future land uses; their time-of-travel relationship or proximity to the intake site; and their associated risk rating. In general, land uses that are closest to the intake and those with the highest risk rating pose the greatest threat to a drinking water supply. The presence and locations of the potential contamination sources within the sensitive areas will determine where the water system has the highest susceptibility to contamination. The susceptibility analysis cannot predict when or if contamination will actually occur, but it does recognize conditions that are highly favorable for contamination to occur. If a contaminant release to soils or water should occur in a sensitive area, it is very likely that contamination of the surface water body would occur if remedial actions were not undertaken.
When several high or moderate risk sources are located within the sensitive areas, the public water system may also be said to have a high overall susceptibility to contamination. If a public watei· system's drinking water source is determined to be of high susceptibility, it is recommended that the system identify those condition(s) that lead to the high susceptibility and take steps to protect the resource (e.g., reducing soil erosion, or working directly with facility operators to implement sound management practices, etc.). Water systems with a low susceptibility should consider all identified factors that could lead to higher susceptibility in the future and take action to prepare a strategy to protect the resource in the future.
1 0 Oregon Source Water Assessment Report (02/12/02) City of Cannon Beach -PWS # 4100164

Results The results of the potential contamination source inventmy are combined with the locations of the sensitive areas to determine the most susceptible areas within Cannon Beach's drinking water watershed. The total number of sources within the sensitive areas is summarized as follows:
Within Outside of Total Within Total Outside Sensitive Sensitive Drinking Water Drinking Water
Areas areas Protection Area Protection Area
Total Number of High am! Moderate Risk Potential 1 I 2 1
Contamination Sources
Higher Risk Potential Contamination Sources Identified 1 0 I I
Moderate Risk Potential Contamination Sources Identified 0 I 1 I Lower Risk Potential Contamination Sources Identified 1 0 1 0
Total Potential Contamination Sources Identified 2 I 3 1
Overlaying the locations of the moderate- to high-risk sources with the sensitive areas provides an indication of the areas that are highly susceptible to contamination. The susceptibility analysis results are shown on Figure 3 (Source Water Assessment Results). Where the moderate- to higher-risk sources fall within the sensitive areas are those areas most vulnerable to contamination. In the Cannon Beach watershed, it includes the distribution of the one identified source (area-wide managed forests) within the areas of highly permeable soils, high erosional soils, high runoff potential soils, and within the I 000' setback from the sh·eams. In general, potential contaminant sources within the sensitive areas in the lower watershed pose greater risk than those in the higher areas of the watershed. The susceptibility analysis provides the water system with information on where the greatest risk occurs and where to focus resources for protection.
When all of the assessments are completed in Oregon, DEQ will provide a second type of susceptibility analysis for the surface water systems, an "inter-system susceptibility" on a statewide basis. DEQ will develop a summary report describing how the Cannon Beach watershed compares with other drinking water watersheds in the state. To normalize the results of the assessments, the total number of potential contamination sources will not be used. The density of the moderate- to higher-risk sources within the drinking water protection area and within the sensitive areas will be calculated. This comparison will be based upon the number and distribution of the potential contamination sources in the watersheds that serve as drinking water resources. The purpose is not to tank individual systems, but to provide general groupings of overall risk relative to other Oregon public water systems. This will enable state agencies to develop priorities for staffing and funding more detailed assessments and protection n1easures.
Oregon Source Water Assessment Report (02/12/02) City of Cannon Beach -PWS II 4100164
11
Summary and Recommendations This assessment provides a basis for focusing limited resources within the community to protect the drinking water source. The delineation provides the conununity with information regarding the location of the land area that directly supplies the surface water intake, i.e., the drinking water protection area. The sensitive areas are those where potential contamination sources or land use activities, if present, have the greater potential to impact the water supply. When the sensitive area information is combined with the potential contaminant source inventmy, the highly vulnerable areas are identified (refel1'ed to as a susceptibility analysis). These should become high priority areas to be addressed first with educational information, technical assistance, and focused outreach to landowners to encourage voluntary cooperation in protecting the water quality in this watershed.
This assessment provides a basis for informed decision-making regarding community planning. The delineation, inventory and susceptibility analysis provides the community with a significant amount of information regarding where their drinking water comes from and an identification of some of the potential risks to the quality of that source. For example, knowing the location and status of the source area allows the community's planning authority to potentially make informed decisions regarding proposed land uses that are compatible with both the drinking water resource and the vision of community growth embraced by the community. Educating the community citizens about the susceptibility and risks to your system enables more public involvement in any future decisions about the public water system.
The results of this Source Water Assessment and the recmmnendations based on the results are summarized below.
+ The drinking water for the City of Cannon Beach is supplied from two sources. The primaty source originates from a series of springs located on City owned property and the supplement source is supplied by a surface water intake on the West Fork Elk Creek (also known as West Fork Ecola Creek). The Source Water Assessment addresses only the surface water component of Cannon Beach's drinking water supply. The groundwater supply will be addressed in a separate report.
+The source of the surface water source is within the Necanicum Sub-Basin of the Northern Oregon Coastal Basin. Cannon Beach's drinking water protection area extends approximately 1 3 miles in a southerly direction and encompasses a total area of 8.3 square miles.
+ Within the Cannon Beach drinking water protection area for the surface water source, there are large areas identified as sensitive to contamination. Areas that are adjacent to the streams/river, areas that have high soil erosion potential, and high permeability should all receive special considerations for protection. These are some of the areas where the risk is greatest for existing ancl future potential sources of contamination impacting the water quality in the watershed. It is recommended that other natural conditions be considered and possibly added to the assessment results before proceeding with voluntaty development of a drinking water protection plan:
There are also some highly-permeable soils in the watershed that should be considered higher risk for groundwater contamination. These areas are very sensitive to any spills or release to soils because the contaminants could rapidly infiltrate into groundwater and discharge to West Fork Elk Creek (also known as West Fork Ecola Creek). The community should take steps to
12 Oregon Source Water Assessment Report (02/12/02) City of Cannon Beach -PWS # 4100164

evaluate current and future land use in areas of highly permeable soils. The facilities or land uses that have been identified either on or in close proximity to these soils should be informed of the sensitive nature of the area and encouraged to adopt best management practices designed to minimize the risk of a contaminant release.
+ The susceptibility of the public drinking water system source depends on both the natural conditions in the watershed as well as the land uses and facilities operating in the watershed. The purpose of the susceptibility exercise is to identify those factors that may pose more of a risk than others within the community's drinking water protection area. It provides information with respect to facilities or land uses in the sensitive areas within the drinking water protection area that should be given greater priority in developing protection strategies. A review of the inventory and the sensitive areas indicates that the Cannon Beach public water system has at least one high and moderate-risk sources within the sensitive areas in the watershed. It is highly recommended that the community "enhance" or refine the delineation of the sensitive areas and the identification of the potential contamination sources through further research and local input.
+ Due to the streamlined procedures for conducting the source water assessments, the results could potentially create a misperception that the "human activities" within the watersheds are higher risks than natural conditions or disturbances such as landslides and storm events. For example, it would be erroneous for communities to conclude that their source water was not at risk from natural conditions that produce sediments if there were no potential contamination sources identified within their watershed. It is recommended that the community take steps to ensure the natural conditions (both those identified in this assessment and any other additional areas identified by the community) within the watershed are considered when developing strategies for protection.
+ Public water systems may be threatened by contamination already in the surface water. Many public water systems conduct routine tests for contamination in the raw water prior to treatment. It is highly recommended that such data be used to determine existing risks in the watershed. Collecting and analyzing this raw water data by DEQ or OHD has not been done and is beyond the scope of this assessment.
+ This assessment provides a basis for dealing with future water quality work in the watershed. The delineation, inventory, and susceptibility analysis has been designed to serve as a strong foundation for further in-depth watershed assessments or water quality improvement efforts, such as Oregon's Total Maximum Daily Load (TMDL) plans.
+ The primary intent of this source water assessment is to provide the background information for the community to use in developing a local Drinking Water Protection Plan. The Cannon Beach and/or the public water system should assemble a team to assist in the development and implementation of a Drinking Water Protection Plan. Clean safe drinking water is fundamental to the viability of any community. Protecting the drinking water source is a wise and relatively inexpensive investment in the community's future. The next section will discuss this voluntary process.
Oregon Source Water Assessment Report (02/12/02) City of Cmmon Beach -PWS # 4100164
13

Developing a Drinking Water Protection Plan This Source Water Assessment (SW A) Report for your public water system is a compilation of the results of the delineation of the source area, identification of the sensitive areas, and an invent01y of significant risks. The final product, the susceptibility analysis, provides the basis for prioritizing the areas in and around your community that need to be protected. As we discussed in the introduction, our hope is that the community will use the assessment as a basis for developing a "Drinking Water Protection Plan".
The process for developing a complete Drinking Water Protection Plan can be summarized as follows:
ASSESSMENT PHASE (Source Water Assessment Report performed by DEQ and OHD) 1 . Delineate the area that serves as the source of the public water supply
("drinking water protection area" for groundwater wells or surface water intakes) 2. Inventory the potential risks or sources of contamination 3. Determine the areas most susceptible to contamination
PROTECTION PHASE (performed by community) 4. Assemble a local Drinking Water Protection Team 5. Enhance the Source Water Assessment 6. Develop a plan to protect the supply (reduce the risks of contamination) 7. Develop a contingency plan to address the potential loss of the system 8. Certify (optional) and implement the Drinking Water Protection Plan
As you know, the assessment phase work was funded by the federal Safe Drinking Water Act. The assessment is simply the first three steps of developing a protection plan for your public water supply. Developing a protection plan is voluntary.
Prior to moving into the protection phase, DEQ recommends the inventory presented in this document be reviewed in detail to clarify the presence, location, operational practices, actual risks, etc. of the identified facilities and land use activities. The SW A invent01y should be regarded as a prelimina1y review of potential sources of contamination within the drinking water protection area. Resources within the community should be used to do an "enhanced inventory" to complete this preliminary list of potential sources of contamination.
It is also important to remember that not all of the inventoried activities will need to be addressed if you choose to develop a Drinking Water Protection Plan. When developing a protection plan, sources which pose little to no threat to your public water supply can be screened out. For example, if any of the land use activities are conducted in a manner that already significantly reduces the risk of a contamination release, the facility would not need to re-evaluate their practices based on drinking water protection "management". One of the goals of developing a Drinking Water Protection Plan based on the invent01y results is to address those land use activities that do pose high or moderate risks to your public water supply. The community should target these facilities with greater levels of education and technical assistance to minimize the risk of contamination.
Limited technical assistance is available through both DEQ and OHD for communities that choose to move beyond the assessments and voluntarily develop a Drinking Water Protection Plan. Using the results of the assessment (and enhanced inventory), the local community can
14 Oregon Source Water Assessment Report (02/12/02) City of Cannon Beach-PWS # 4100164

form a "Drinking Water Protection Team" of connnunity members and develop a plan to reduce the risks of contamination from those sources.
Forming a local team to help with the development of a protection plan is vety important. Oregon's drinking water protection approach relies upon the concept of "community-based protection", as are many other water quality programs. Co111111unity-based protection simply refers to the concept of allowing local control and decision-making to implement the water quality protection effort. Community-based protection is successful only with significant local citizen and stakeholder involvement.
The primary advantage of community-based protection is that it links community needs to environmental needs. Any successful protection program will need to be flexible enough to allow the community to adopt the "tools" or elements that are most appropriate for them. Allowing this local control in making the changes necessaty for improving water quality will accomplish two key elements of restoration and protection. Community-based protection can draw on the knowledge and successful adaptive practices of the local area. Landowners generally know best how to achieve water resource restoration and protection as long as a thorough explanation of the problem is provided, the objectives are defined, and some free technical assistance is provided. Secondly, knowing they have more local control, citizens will also be more likely to participate in the program and more willing to assist with the educational and outreach effort which will make the plan successful. We recommend that the protection plan be developed so as to minimize any b11rde11s on individ11al property owners, but maximize the equity in responsibility for reducing the riskv of future contamination.
Drinking water protection involves developing protection strategies for groundwater or surface water sources of public water supplies. There are many similarities between this program and other water quality protection programs, and it is essential that water quality efforts are coordinated and linked in each geographic area as much as possible. DEQ is committed to linking the drinking water protection efforts to other habitat and water quality improvement efforts for fish in Oregon, as well as the ongoing work to address Clean Water Act 303(d) waterquality-limited streams. One of the primary means of providing technical assistance is to give your community the information and coordination necessary to create these links. Other agencies will also be involved in providing technical assistance as protection plans are developed. For example, on farmlands, the Oregon Department of Agriculture will provide assistance as provided for under Senate Bill 1010. In developing reco111111endations for protecting the drinking water source area, your community can maximize the use of existing programs in Oregon that offer free technical assistance. Examples of such programs include:
• pollution prevention technical assistance from the Department of Environmental Quality,
• sanitary survey assistance from the Oregon Health Division, • household hazardous waste assistance from the Department of Environmental Quality, • land use planning from the Department of Land Conservation and Development, • agricultural water quality management plans Oregon Department of Agriculture, • water conservation education from the Water Resources Department, or • rural water quality outreach from the Oregon State University Extension Service.
Protecting the drinking water supply in a community can also be a very effective way to encourage all citizens to participate in an issue which directly affects evetyone in that community. This often leads to more public involvement in other significant local decisions
Oregon Source Water Assessment Report (02/12/02) City of Cannon Beach-PWS # 4100164
1 5

concerning future livability issues (i.e., land use planning). In communities already developing and implementing Drinking Water Protection Plans, the process has served to bring many diverse interests together on a common goal and strengthened the local rural and urban relationships through communication and increased understanding. We must continue to do a better job in our outreach efforts to point out that we are all part of the existing water quality problems. The risks and sources of water quality problems are not only from industries, farmers, and managed forests, but every individual living, commuting and working in that area.
We encourage communities interested in developing Drinking Water Protection Plans to contact the DEQ or OHD resources listed below:
For technical assistance with the mo11itol'i11g a11d operation of your public water system:
Oregon Health Division Main Office - Portland Oregon 800 NE Oregon St., Room 6 1 1 PO Box 14450, Portland, OR 97293 (503) 73 1-43 17 Fax (503) 731-4077
or: Dennis Nelson, Groundwater Coordinator, (541) 726-2587 [email protected] Oregon Health Division Springfield Field Office 442 A Street, Springfield, OR 97477 Fax (541 ) 726-2596
For tecl111ica/ <1ssistm1ce with developing plans to protect your public w<ller system:
1 6
Department of Environmental Quality Water Quality Division 8 1 1 SW 61h Avenue Portland, OR 97204-1390 (503) 229-5630 Fax (503) 229-5408 Toll Free 1 -800-452-401 1
Surface Water - Sheree Stewart, (503) 229-5413 [email protected]
Gl'Ounclwater - Julie Harvey, (503) 229-5664 [email protected]
Oregon Source Water Assessment Report (02/12/02) City of Cannon Beach- PWS # 4100164

References*
Natural Resource Conservation Service (NRCS). Soil Survey Geographic Database (SURGGO), National Cartography and Geospatial Center, Fort Worth, Texas. http://www.ftw.nrcs.usda.gov/ssurgo.html
Source Water Assessment Plan: Implementation of the Safe Drinking Water Act 1996 Amendments. Sheree Stewart, Oregon Department of Environmental Quality, and Dennis Nelson, Oregon Health Division, February 1999. http://www.waterquality.deq.state.or.us/wq
US Environmental Protection Agency, 1997. State Source Water Assessment and Protection Programs Guidance, US EPA Office of Water, EPA816-R-97-009, August 1997. http://www.epa.gov/ogwdw/swp.html
US Geological Survey, Oregon Hydrologic Units. http://oregon.usgs.gov/data _ dir/ orehucl ist.html
Washington Forest Practices Board. 1993. Standard Methodology for Conducting Watershed Analysis, Version 2.0, October 1993
Western Regional Climate Center, Oregon Climate Summaries. http://www.wrcc.dri.edu/summary/climsmor.html
*Please note that there may be other sources of infonnation for West Fork Elk Creek (also known as West Fork Eco la Creek) and the Necauicum Sub -Basin. Conducting an exhaustive search of all data and technical reports was beyond the scope of this Source Water Assessment Report.
Oregon Source Water Assessment Report (02/12/02) City of Ca1111on Beach -PWS # 4100164
17

Figures
Source Water Assessment Report City of Cannon Beach
PWS # 4 1 00 1 64
Figure 1 . City of Cannon Beach's Drinking Water Protection Area
Figure 2. Sensitive Areas within City of Cannon Beach's Drinking Water Protection Area
Figure 3. Source Water Assessment Results City of Cannon Beach's Drinldng Water Protection Area with Sensitive Areas and Potential Contamination Sources


Tables
Source Water Assessment Report
City of Cannon Beach PWS # 4 1 00 1 64 Inventory Results
Table 1. Summary of Potential Contaminant Sources by Land Use
Table 2. Inventory Results - List of Potential Contaminant Sources
Notes for Tables • Sites and areas identified in Tables 1 and 2 are only potential sources of contamination
to the drinking water. Environmental contamination is not likely to occur when contaminants are used and managed properly.
• Total number of sources listed in Table 1 in the DWPA may not add up to the total number of potential contaminant sources in Table 2 because more than one type of potential contaminant source may be present at any given facility.
• The data was collected by Christopher Blakeman, DEQ's Northwest Region Office, on September 1 8, 200 I .
Acronyms AST - Aboveground Storage Tank DC - DEQ's Drycleaner database DEQ - Oregon Department of Environmental Quality DWPA - Drinking Water Protection Area ECSI - DEQ's Environmental Cleanup Site Information database HWIMSY - DEQ's Hazardous Waste Information Management System database LUST - DEQ's Leaking Underground Storage Tank database NPDES - National Pollution Discharge Elimination System PCS - Potential Contaminant Source PWS - Public Water System SFM - State Fire Marshall's database of hazardous materials SIS - DEQ's Source Information System database (includes WPCF and NPDES permits) SWMS - DEQ's Solid Waste Management System database UST - DEQ's Underground Storage Tank database or Underground Storage Tank WPCF - Water Pollution Control Facility WRD -Oregon Water Resources Division database for water rights information system


TABLE 1 . SUM MARY OF POTENTIAL CONTAMINANT SOURCES BY LAND USE
PWS # 41001 64 CANNON BEACH, CITY OF
Residential/Municipal Land Uses
Relative
Potential Contamination Source Note Risk Level - . . -- ---- - - - - ·----·-- --- ---
Airport - Maintenance/Fueling Area - - ------ -- -- --
Apartments and Condominiums
Higher
Lower - - - · --···-- ----- ---- ---- - ----·-- ----
Campgrounds/RV Parks (1) Lower ----- ---- -- ··- --------- ---- ---- -------- ----
Cemeteries - Pre-1945 Moderate --- - ---·---
Drinking Water Treatment Plants Moderate ----------- ---
Fire Station
Fire Training Facilities ------------ ---
--------·----------- --- --- - - - - - - -
Golf Courses - -- -------------------- ------ ---
Housing - High Density (> 1 House/0.5 acres)
Lower
Moderate
Moderate
Moderate --- ----- -- - - - - ------------
Landfill/Dumps (1 l ---------· -- -------------------- ---
Lawn Care - Highly Maintained Areas ---··--
Motor Pools
Parks
Railroad Yards/Maintenance/Fueling Areas --------------
Schoo ls
Septic Systems - High Density ( > 1 system/acre) (1)
Sewer Lines - Close Proximity to PWS (1)
Utility Stations - Maintenance Transformer Storage ---------
Waste Transfer/Recycling Stations (1} ------- ·-------
Wastewater Treatment Plants/Collection Stations (1) ------- - -- - ------ ---
Other --------- ---- ------ -------- ------ - ---
NOTES:
Higher
Moderate
Moderate
Moderate
Higher
Lower
Higher
Higher
Higher
Moderate
Moderate
Sites and areas identified In this Table are only potential sources of contamination to the drinking water. Environmental contamination is not likely to occur when contaminants are used and managed properly. {1) - Potential source of microblal contamination (2) - Drip Irrigated crops, such as vineyards and some vegetables, are considered lower risk than spray irrigation (3) - For groundwater public water systems, septic systems located within the 2-year time-of-travel (TOT) are considered moderate risks.
Total in
DWPA -----
0
0 ------
0
0
1
0
0
0
0
0
0
0
0
0
0
0
0
0
0
0
0
2/12/2002 Page 1 of 4

TABLE 1 . SUMMARY OF POTENTIAL CONTAMINANT SOURCES BY LAND USE
PWS # 4100164 CANNON BEACH, CITY OF
Commercial/Industrial Land Uses
Relative
Potential Contamination Source Note Risk Level ------- ------ - ---- - - - - --- -
Automobiles - Body Shops -------- --- --- ----
Automobiles - Car Washes --- --------- --------
Automobiles - Gas Stations _,_ _, __ ___________ _____ --- -
Automobiles - Repair Shops ------------------ -----
Boat Services/Repair/Refinishing - -------- ----- ----
CemenUConcrete Plants
Chemical/Petroleum Processing/Storage ---
Dry Cleaners
Electrical/Electronic Manufacturing - - - - ------ -- -
FleeUTrucking/Bus Terminals
Higher
Moderate
Higher
Higher
Higher
Moderate
Higher
Higher
Higher
Higher ------ ---- --- ----- ----- -----
Food Processing -------- ------- -- -- ----
Furniture/Lumber/Parts Stores ----- --------------- ---- - ----- -----
Home Manufacturing --�---------- ---- ---------------
Junk/Scrap/Salvage Yards
Machine Shops
MedicalNet Offices
Metal Plating/Finishing/Fabrication
Mines/Gravel Pits
Office Buildings/Complexes
Parking Lots/Malls (> 50 Spaces)
(1)
-- - - - ---- ---------
Photo Processing/Printing
Plastics/Synthetics Producer - -- - -----
Research Laboratories
RV/Mini Storage --- ------------ --- -- -----
Wood Preserving/Treating - - - - --- - - ---- ---- - ----
Wood/Pulp/Paper Processing and Mills
Other --- ----- - - ------ ----- ----
NOTES:
Moderate
Moderate
Higher
Higher
Higher
Moderate
Higher
Higher
Lower
Higher
Higher
Higher -
Higher
Lower
Higher
Higher
Sites and areas identified in this Table are only potential sources of contamination to the drinking water. Environmental contamination is not likely to occur when contaminants are used and managed properly. (1 ) - Potential source of mlcrobial contamination (2) - Drip irrigated crops, such as vineyards and some vegetables, are considered lower risk than spray Irrigation (3) - For groundwater public water systems, septic systems located within the 2-year time-of-travel (TOT) are considered moderate risks.
-- --- --- - ----
Total in
DWPA
0
0
0
0
0
0
0
0 ------
0
0 - ----
0
0
0
0
0
0 ----
0
0
0
0
0
0
0 - --
0
0
0 ----
0
211212002 Page 2 of 4
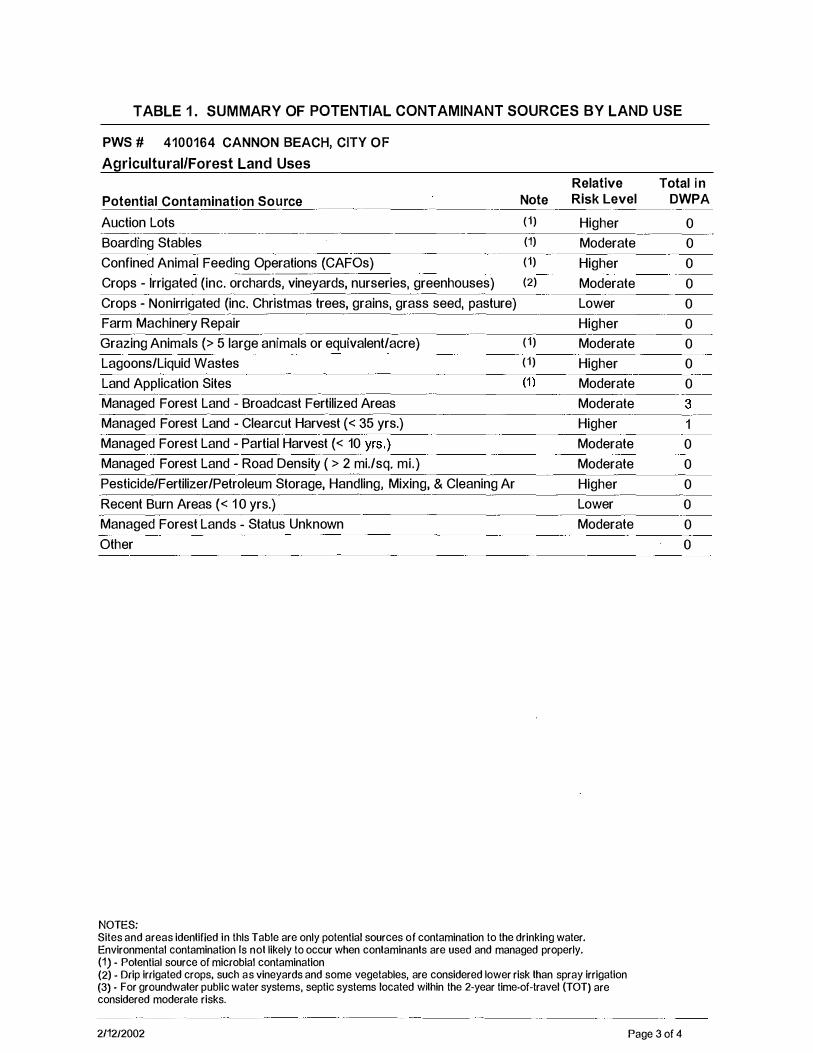
TABLE 1 . SUMMARY OF POTENTIAL CONTAMINANT SOURCES BY LAND USE
PWS # 4100164 CANNON BEACH, CITY OF
Agricultural/Forest Land Uses
Potential Contamination Source Note
Auction Lots (1)
Relative
Risk Level
Higher ------- ------------- -- - - -
Boarding Stables (1) - --- - ------ ------------�----
Confined Animal Feeding Operations (CAFOs) (1) ---------. .,,.
Crops - Irrigated (inc. orchards, vineyards, nurseries, greenhouses) (2)
Crops - Nonirrigated (inc. Christmas trees, grains, grass seed, pasture)
Farm Machinery Repair
Grazing Animals (> 5 large animals or equivalent/acre) (1) ----
Lagoons/Liquid Wastes (1)
Moderate
Higher
Moderate
Lower
Higher
Moderate
Higher -------- - - - - --------- - - - - -�------
Land Application Sites (1) -
------ - - --------------
Managed Forest Land - Broadcast Fertilized Areas
Managed Forest Land - Clearcut Harvest ( < 35 yrs.)
Managed Forest Land - Partial Harvest (< 10 yrs.) -- -- -�------- ----
Managed Forest Land - Road Density ( > 2 mi./sq. mi.) --------
Pesticide/Fertilizer/Petroleum Storage, Handling, Mixing, & Cleaning Ar
Recent Burn Areas (< 1 0 yrs.)
Managed Forest Lands - Status Unknown ----------
0th er
NOTES:
Moderate
Moderate
Higher
Moderate
Moderate
Higher
Lower
Moderate
Sites and areas identified in thls Table are only potential sources of contamination to the drinking water. Environmental contamination Is not likely to occur when contaminants are used and managed properly. (1) - Potential source of microbial contamination (2) - Drip irrigated crops, such as vineyards and some vegetables, are considered lower risk than spray irrigation (3) - For groundwater public water systems, septic systems located within the 2-year time-of-travel (TOT) are considered moderate risks.
Total i n DWPA
0
0
0 --
0
0
0
0
0
0
3
1
0
0
0
0
0 -
0
2/1212002 Page 3 of 4

TABLE 1 . SUMMARY OF POTENTIAL CONTAMINANT SOURCES BY LAND USE
PWS # 41001 64 CANNON BEACH, CITY OF
Miscellaneous Land Uses
Potential Contamination Source --"-- - ---
Above Ground Storage Tanks - Excluding Water
Channel Alterations - Heavy ----
Combined Sewer Outfalls ----
Stormwater Outfalls
Composting Facilities ----
(1)
(1)
(1)
Historic Gas Stations Higher O -�--
Historic Waste Dumps/Landfills
Military Installations
Random Dump Sites
Stormwater Retention Basins
UST - Upgraded/Registered - Active
UST - Status Unknown
Upstream Reservoirs/Dams -- - - � - --------- -
Wells/Abandoned Wells
Large Capacity Septic Systems (serves > 20 people) - Class V UICs
Construction/Demolition Areas
other
NOTES:
(1)
Sites and areas identified in this Table are only potential sources of contamination to the drinking water. Environmental contamination Is not likely to occur when contaminants are used and managed properly. (1) - Potential source of mlcrobial contamination (2) - Drip Irrigated crops, such as vineyards and some vegetables, are considered lower risk than spray irrigation (3) - For groundwater public water systems, septic systems located within the 2-year time-of-travel (TOT) are considered moderate risks.
2/1212002
0
0
Page 4 of 4

TABLE 2. INVENTORY RESULTS - LIST OF POTENTIAL CONTAMINANT SOURCES
PWS# 4100164 CANNON BEACH, CITY OF
Reference Potential Proximity to Relative No. (See Contaminant Approximate Method for Sensitive Risk Level Figure) Source Type Name Location C;ty Listing Areas (1) Potential Impacts
Drinking Water City of cannon Just downstream of the Cannon Field- Just outside Lower Treatment chemicals and equipment Treatment Plants Beach, Drinking Eco!a Creek intake Beach Observation DWPA maintenance materials may impact
Water Treatment Interview groundwater or surface water source. Works
2 Managed Forest Managed Forest - Almost the entire DWPA Cannon Field- Within Higher Cutting and yarding of trees may contribute to Land - Clearcut Willamette Beach Observation sensitive area. increased erosion, resulting in turbidity and Harvest (< 35 yrs.) - Industries Interview chemical changes in drinking water supply. Sporadic. Over-application or improper handling of Incomplete pesticides or fertilizers may impact drinking observation. water source.
Managed Forest Moderate Over-application or improper handling of Land - Broadcast pesticides or fertilizers may impact the Fertilized Areas drinking water source.
3 Managed Forest Managed Forest - 55 Ac. Parcel just E of the Cannon Field- Within Lower Over-application or improper handling of Land - Broadcast City of Cannon Water Works Filter Plant Beach Observation sensitive area. pesticides or fertilizers may impact the Fertilized Areas - Beach Interview drinking water source. Not actively managed for timber harvesting.
4 Managed Forest Managed Forest - Uppennost portion of Cannon Field- Outside Moderate Over-application or improper handling of Land - Broadcast ODF, Clatsop DWPA at Onion Peak Beach · Observation sensitive pesticides or fertilizers may impact the Fertilized Areas State Forest areas. drinking water source.
Note: Sites and areas Identified In this Table are only potential sources of contamination to the drinking water. Environmental contamination ls not likely to occur when contaminants are used and managed properly.
(1) Where multiple potential contaminant sources exist at a site, the hl'ghest level of risk Is used.
(2) See Table 3 for database listings (if necessary).
211212002 Page 1 of1
Comments
Risk reduced to Lower because drinking water treatment plant is downstream of the intake and ·1s a slow sand filtration plant.
Risk reduced to Lower because this area is not actively managed for timber harvesting and the City has reprotedly never used pesticides or fertilizers. In addition, the City has a "no application" policy for City maintained property.
Actual management status unknown. PWS should verify.
No visual observation of site -site location is ba.sed on interview.


Attachment A
Source Water Assessment Report City of Cannon Beach
PWS # 4 1 00 1 64
Attachment A. Source Water Assessment Summary Brochure


SOURCE WATER ASSESSMENT
SUMMARY BROCHURE
CITY OF CANNON BEACH PWS # 4 1 001 64
WHAT IS A SOURCE WATER ASSESSMENT?
The Source Water Assessment was recently completed by the Department of Environmental
· Quality (DEQ) and the Oregon Health Division (OHD) to identify the surface areas (and/or subsurface areas) that supply water to Cannon Beach's public water system intake and to inventory the potential contaminant sources that may impact the water supply.
WHY WAS IT COMPLETED?
The Source Water Assessment was completed to provide information so that Cannon Beach's public water system staf£'operator, consumers, and community citizens can begin developing strategies to protect the source of their drinking water, and to minimize future public expenditures for drinking water treatment. The assessment was prepared under the requirements and guidelines of the Federal Safe Drinking Water Act (SDWA).
WHAT AREAS ARE INCLUDED IN CANNON
BEACH'S DRINKING WATER PROTECTION
AREA?
The drinking water for the City of Cannon Beach is supplied from two sources. The primary source originates from a series of springs located on City owned property and the supplement source is supplied by a surface water intake on the West Fork Elk Creek (also known as West Fork Ecola Creek). The Source Water Assessment addresses only the surface water component of Cannon Beach's drinking water supply. The groundwater supply will be addressed in a separate report. The public water system serves approximately 1588 citizens that is augmented by a large tourist and transient populations that can swell the population to I 0,000 plus in the summer months. The intake is located in the Necanicum River Watershed in the Necanicum Sub-Basin of the Northern Oregon Coastal Basin.
The geographic area providing water to Cannon Beach's intake (the drinking water protection
area) extends upstream approximately 1 3 miles in a southerly direction and encompasses a total area of 8.3 square miles. The boundaries of the Drinking Water Protection Area are illustrated on the figure attached to this summa1y.
WHAT ARE THE POTENTIAL SOURCES OF
CONTAMINATION TO CANNON BEACH'S
PUBLIC DRINKING WATER SUPPLY?
The primaiy intent of this inventory was to identify and locate significant potential sources of contaminants of concern. The delineated drinking water protection area is primarily dominated by managed forest land uses. The potential contaminant sources identified in the watershed include various regions of managed forest land owned by the City of Cannon Beach and other public and private entities. This provides a quick look at the existing potential sources of contamination that could, if improperly managed or released, impact the water quality in the watershed.
WHAT ARE THE RISKS FOR OUR SYSTEM?
A total of three area-wide potential contaminant sources were identified in Cannon Beach's drinking water protection area. Two of these areas are located in the sensitive areas and one is a high- to moderate-risk source within "sensitive areas". The sensitive areas within the Cannon Beach drinking water protection area include areas with high soil permeability, high soil erosion potential, and areas within 1000' from the river/streams. The sensitive areas are those where the potential contamination sources, if present, have a greater potential to impact the water supply. The information in this assessment provides a basis for prioritizing areas in and around our community that are most vulnerable to potential impacts and can be used by the Cannon Beach community to develop a voluntary Drinking Water Protection Plan.
NEED MORE INFORMATION?
Cannon Beach's Source Water Assessment Report provides additional details on the methodology and results of this assessment. The full report is available for review at:
Contact City staff if you would like additional information on Cannon Beach's Source Water Assessment results.

Figure 3: Source Water Assessment Results
City of Cannon Beach's Drinking Water Protection Area with Sensitive Areas and Potential Contamination Sources
PWS 41 001 64
8 Drinking Water Intake - Surface Water
Drinking Water Protection Area
Sensitive Areas
A Area Feature (see Note 2)
+ Point Feature (see Note 2)
Notes on Potential Contaminant Sources
Note 1: Sites and areas noted in this Figure are potential sources of contamination to the drinking water identified by Oregon drinking water protection staff. Environmental contamination is not likely to occur when contaminants are handled and used properly or when best management practices are employed.
Note 2: Feature identification numbers correspond to the potential contaminant source numbers in Table 2. The area features represent the approximate area where the land use or activity occurs and is marked at the point closest to the intake. The point features represent the approximate point where the land use or activity occurs.
l<llometl!ra
0 1
� 0 1000 2000 3000 4000
.... Printed December, 2001
Oregon Department of Environmental Quality GIS
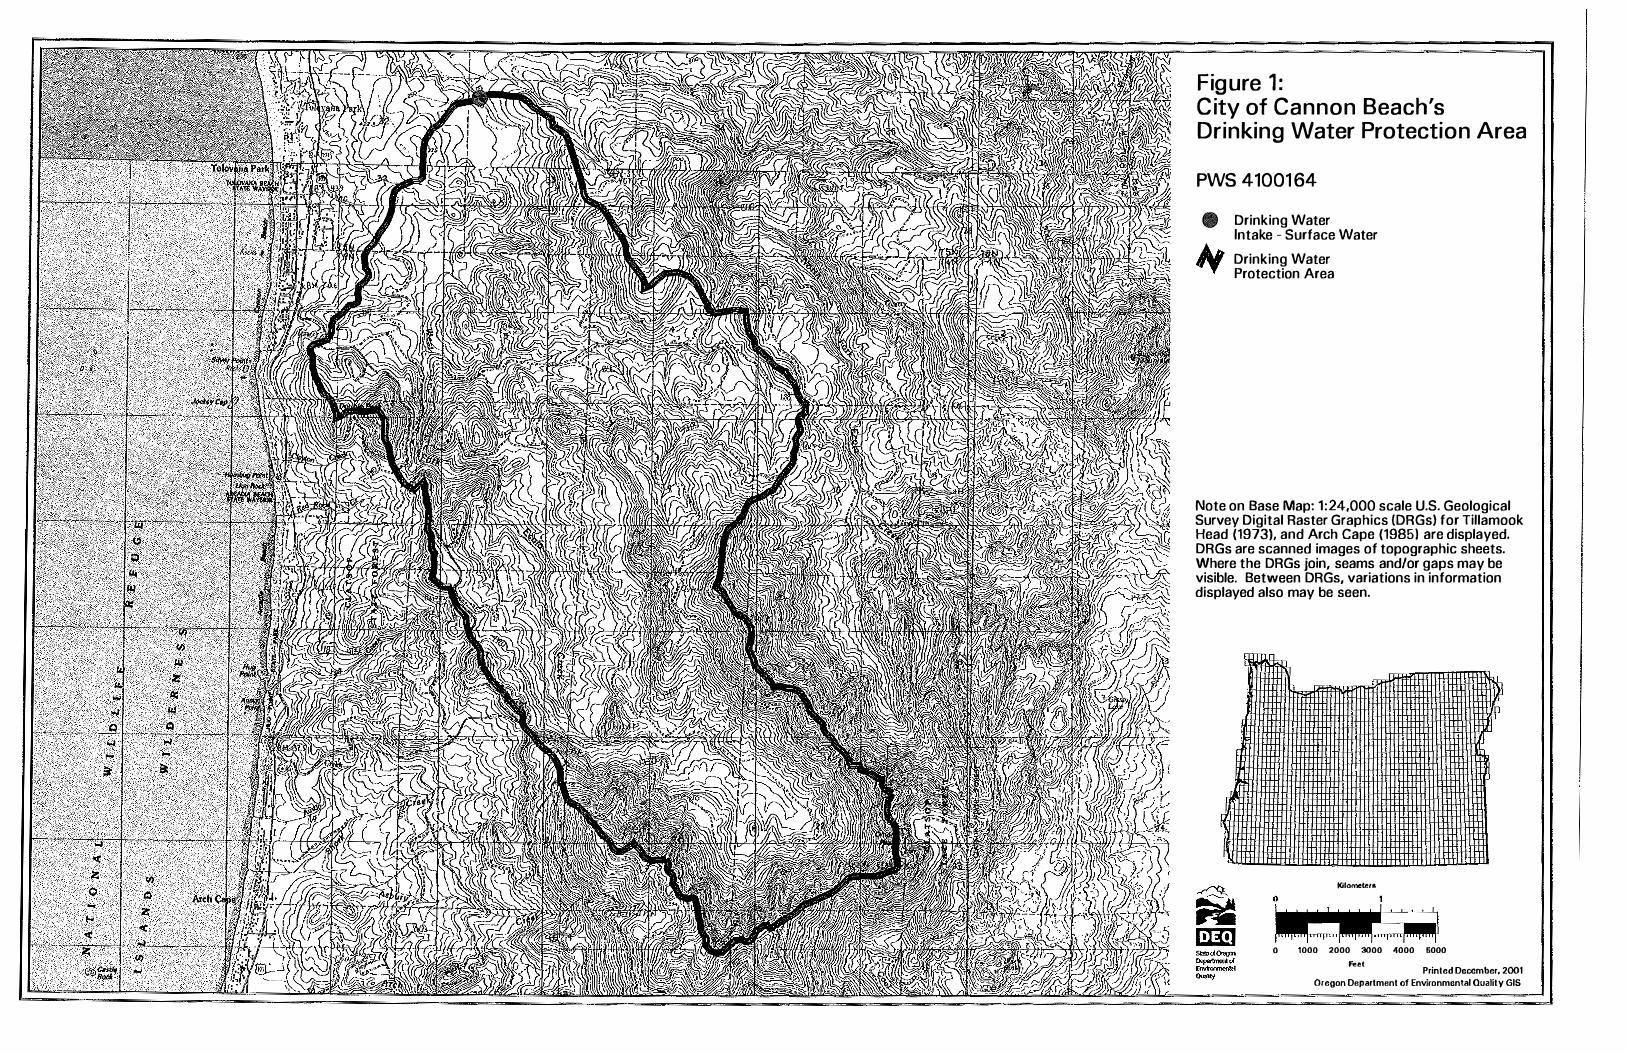
Fig ure 1 : C ity of Cannon Beach's Drinking Water Protection Area
PWS 41001 64
8 Drinking Water Intake - Surface Water
Drinking Water Protection Area
Note on Base Map: 1:24,000 scale U.S. Geological Survey Digital Raster Graphics {DRGs) for Tillamook Head (1973). and Arch Cape (1985) are displayed. DRGs are scanned images of topographic sheets. Where the DRGs join, seams and/or gaps may be visible. Between DRGs, variations in information displayed also may be seen.
Kilomete1•
0 1000 2000 3000 4000 6000
.... Printed December, 2001
Oregon Department of Environmental Quality GIS

Figure 2 : Sensitive Areas with in the C ity of Cannon Beach's Drinking Water Protection Area
PWS 4100164
Drinking Water Intake - Surface Water Drinking Water Protection Area
Sources of Information: High Soil Erodibility: Defined by slopes greater than 30 percent and K factor greater than .25. Soils derived from 1:24,000, USDA, NRCS, SSURGO certified data. Slope is in the SSURGO database Component Table. Slope displayed is a weighted average of the average slope for the map unit. K factor is contained in the SSURGO Layer Table. K factor displayed is a weighted average (of only the surface layer) for the map unit. High Runoff Potential: Hydrology Group D (very slow infiltration rates) from the SSURGO Component Table. SSURGO data have been certified. High P<irmeability Soils: Alluvial deposits (Oal), dune sand (Qd) and landslide and debris-flow deposits (Ols) from the U.S. Geological Survey Geologic Map of Oregon GIS layer. Sensitive Area Setbacks Adjacent to Streams and Reservoirs: 1000 foot buffer from the centerline of perennial streams and the shoreline of any reservoir.
Note on Sensitive Areas: In determining the most sensitive areas within this Drinking Water Protection Area, DEQ used existing GIS layers and other natural resource agency data sets. Not all areas of the state have been mapped for the natural resource parameters of interest or at the level of detail ideal for this type of analysis. DEO has sought to obtain the best available information for this composite.
Printed December, 2001 0 Oregon Department of Environmental Quality GIS
0
Kilometer•
1 2
1
Miles
Sensitive Areas in Watershed
3
2
High Permeability Soils (Alluvial Deposits, Dune Sand, landslide and Debris-flow Deposits)
\
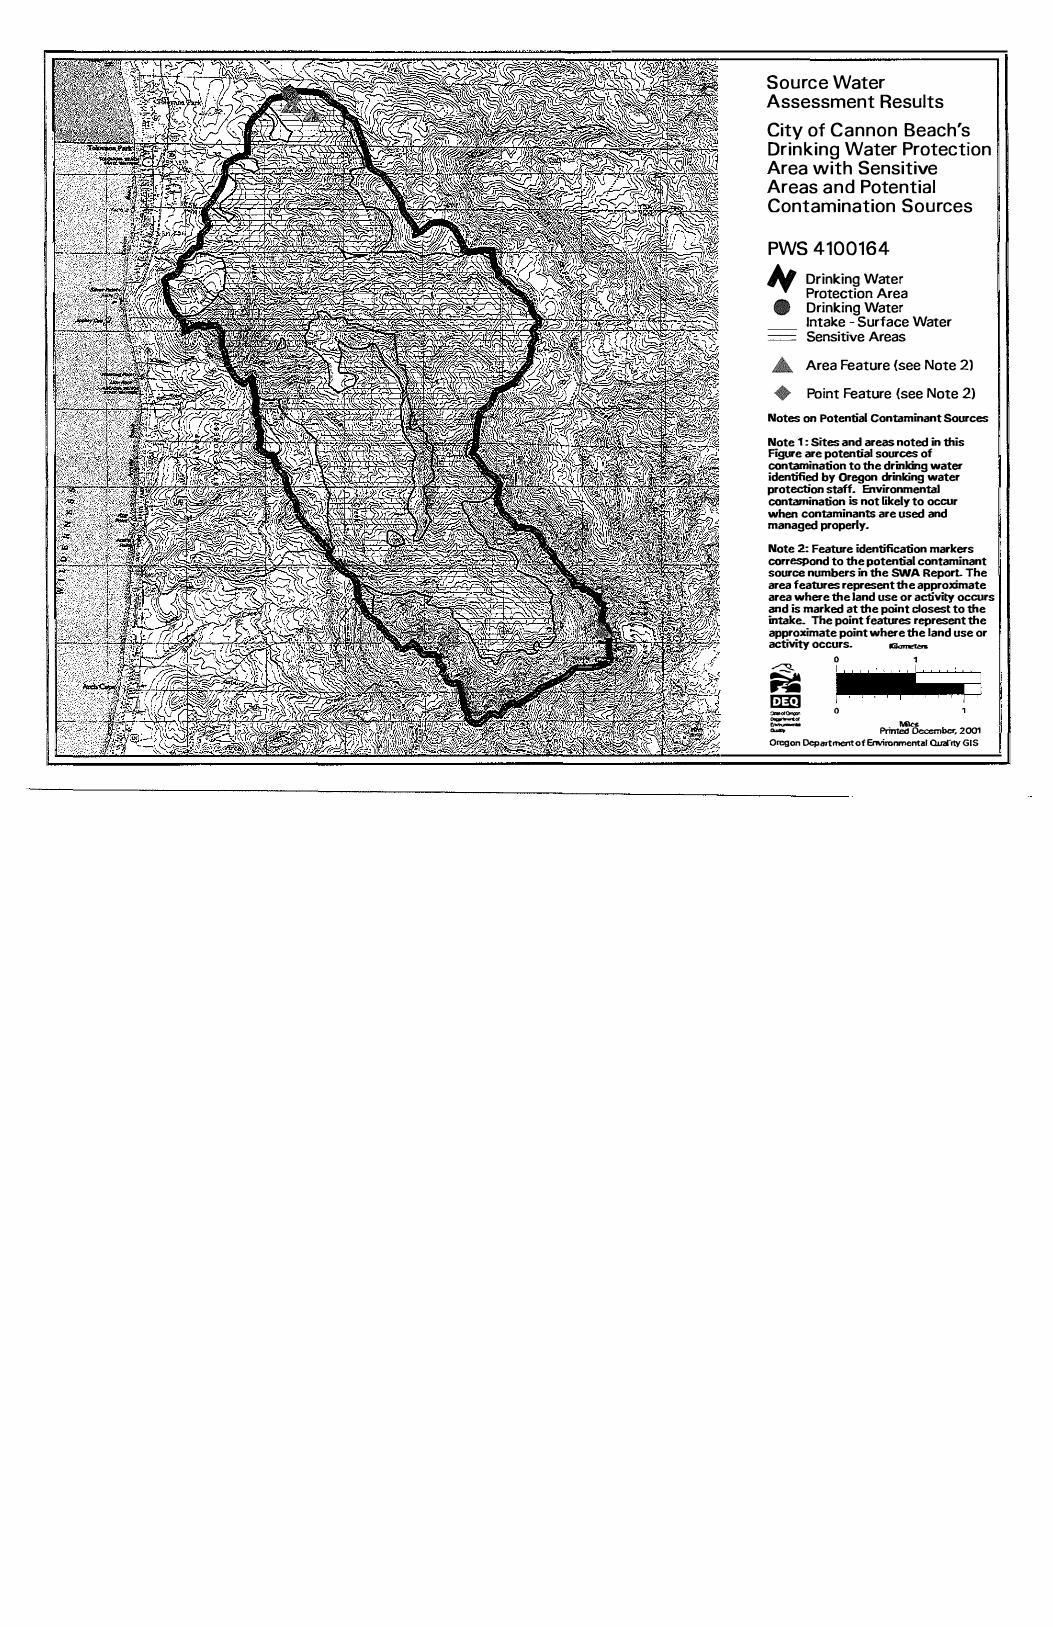
Source Water Assessment Results
City of Cannon Beach's Drinking Water Protection Area with Sensitive Areas and Potential Contamination Sources
PWS 4100164
>( •
Drinking Water Protection Area Drinking Water lntal<e - Surface Water Sensitive Areas
A Area Feature (see Note 21
+ Point Feature (see Note 21
Notes on Potential Contaminant Sources
Note 1 : Sites and areas noted in this Figure are potential sources of contamination to the drinking water identified by Oregon drinking water protection staff. Environmental contamination is not likely to occur when contaminants are used and managed properly.
Note 2: Feature identification markers correspond to the potential contaminant source numbers in the SWA ReporL The area features represent the approximate area where the land use or activity occurs and is marked at the point closest to the intake- The point features represent the approximate point where the land use or activity occurs. Uomet.enr.
� l:ln!.1 -·--· --
0 1
� �
0
�December, 2001 Oregon Department of Environmental Ouarrty GIS