SOURCE REDUCTION AND REUSE
62
33 WASTE REDUCTION ELEMENT SOURCE REDUCTION AND REUSE Both source reduction and reuse are waste management techniques for the non- production or unmaking of waste. In other words, waste reduction of this type can be defined as the reduction, avoidance or elimination of the generation of solid wastes. Since source reduction and reuse both result in the prevention of waste in the first place, the amount of waste which must composted, recycled, landfilled, etc. is reduced. Hence, waste reduction of this type is given the highest priority in solid waste management plans, because it reduces the demand placed on the management system. The downside is that it is the most difficult strategy to implement. Regulations may be needed to promote source reduction. The regulations can take the form of: ♦ Declaration of policy; ♦ Incentive regulations (tax credits, exemptions, positive labeling); ♦ Disincentive regulations (bans, taxes, deposits, product specifications). Different strategies can be incorporated into a plan to promote source reduction and reuse. Strategies used by communities for source reduction and reuse follow. Material Bans Material bans may take two forms--outright bans on production or disposal bans. By far, the disposal ban is the easier to implement and more feasible on a local level. Beyond supporting sensible legislative efforts on a state or national level, the focus of this planning effort should be on disposal bans. When dealing with outright material bans, care must be taken that the alternative material, which must be substituted for the original, is not ultimately worse than the material it replaced. Disposal bans, accomplish nothing unless there is an alternative to disposal provided. This alternative may be in recycling, composting or reuse alternative. It should be noted that disposal bans cannot be looked at as source reduction if they only result in the redirection of material from disposal to another segment of the waste management
Transcript of SOURCE REDUCTION AND REUSE
33
WASTE REDUCTION ELEMENT
SOURCE REDUCTION AND REUSE Both source reduction and reuse are waste management techniques for the non-
production or unmaking of waste. In other words, waste reduction of this type can be
defined as the reduction, avoidance or elimination of the generation of solid wastes. Since
source reduction and reuse both result in the prevention of waste in the first place, the
amount of waste which must composted, recycled, landfilled, etc. is reduced. Hence,
waste reduction of this type is given the highest priority in solid waste management
plans, because it reduces the demand placed on the management system. The downside is
that it is the most difficult strategy to implement. Regulations may be needed to promote
source reduction. The regulations can take the form of:
♦ Declaration of policy; ♦ Incentive regulations (tax credits, exemptions, positive labeling); ♦ Disincentive regulations (bans, taxes, deposits, product specifications).
Different strategies can be incorporated into a plan to promote source reduction and
reuse. Strategies used by communities for source reduction and reuse follow.
Material Bans Material bans may take two forms--outright bans on production or disposal bans. By far,
the disposal ban is the easier to implement and more feasible on a local level. Beyond
supporting sensible legislative efforts on a state or national level, the focus of this
planning effort should be on disposal bans. When dealing with outright material bans,
care must be taken that the alternative material, which must be substituted for the
original, is not ultimately worse than the material it replaced.
Disposal bans, accomplish nothing unless there is an alternative to disposal provided.
This alternative may be in recycling, composting or reuse alternative. It should be noted
that disposal bans cannot be looked at as source reduction if they only result in the
redirection of material from disposal to another segment of the waste management
Waste Reduction
system, such as recycling, without any waste reduction previous to entering this process.
While it is certainly desirable for additional material to enter the recycling process, it
cannot be considered source reduction as explained previously. Disposal bans can,
however, result in some amount of actual source reduction if the alternative provided
carries with it some detrimental attribute(s), e.g., either a direct or indirect cost, which
provides some incentive to reduce waste.
Unit Pricing Structuring waste disposal charges so that generators pay according to the amount of
waste generated can encourage source reduction and recycling. Most refuse haulers
charge a flat rate, sometimes specifying a maximum number of bags or containers per
stop, which will be collected for that flat fee, thus providing little direct economic
incentive for reduction. There are numerous schemes for variable user fees possible for
collection, which include:
1. Charging by the number and/or size(s) of containers used 2. Charging by frequency of collection 3. Charging per bag of garbage collected using standard bags, allowing customers to alter the number of bags as needed 4. Charging customers on a weight basis
Variable garbage collection fees have administrative costs and also may encourage
people to illegally dispose of waste. In areas that have instituted variable rates, these fears
have been largely unrealized. What has happened is citizens will attempt to “shop
around” in order to find the cheapest legal alternative, and they may be willing to go
some distance to do so. Where an increase of illegal dumping has been noticed is in white
goods and other similar large items that may carry a relatively high user fee.
Landfill Surcharges Landfill surcharges have been used by a number of states and local governments. Such
surcharges don’t encourage waste reduction by individuals as long as waste collectors
charge flat fees. Landfill surcharges do, however, provide waste reduction incentives to
34

Waste Reduction
commercial and industrial customers because they generally pay on a volume related
basis, such as size of collection container or frequency of service. Revenues collected
from disposal surcharges may be used to fund waste reduction education, recycling
programs, household hazardous waste collections and other desirable waste management
alternatives.
Product Disposal Charges Product disposal charges may be a charge by weight, unit, composition, value or a
combination. A product disposal charge is a tax assessed on product or packaging
producers at the time of manufacture, or on the consumer at time of purchase. Unlike
product deposits, these charges are not refundable. Instead, they would internalize the
product’s eventual disposal costs. A popular example of this is product disposal charges
on tires.
Since disposal costs vary greatly by both geography and product type, it is nearly
impossible to assess a tax to cover the true cost of disposal in all situations.
Administration of actual disposal costs of specific products in specific locations would be
impossible. Factors to consider in determining product disposal charges include the
disposal costs of the product, volume of waste generated in the product manufacture,
difficulty of disposal of the product or manufacturing by-products, and environmental
impact of the product or manufacturing by-product disposal. Such charges should allow
flexibility for exemptions or prorating for secondary material (recycled) usage in product
manufacture.
In theory, product disposal charges are an ideal method of internalizing the costs of social
responsibility since it is the manufacturers and product consumers that pay in advance for
the eventual disposal and environmental costs a product will create when its useful life is
over. Disposal charges should encourage desirable waste management in two ways. First,
economics would dictate that volume, difficulty of disposal, or hazardousness of a
product be reduced in order to reduce product disposal charges and so reduce production
35
Waste Reduction
costs. Second, the money collected from product disposal charges could be used to
correct or reduce the undesirable impacts of product disposal.
In reality, however, there are problems in assessing such charges effectively. Methods to
assess charges differ. One method is to levy the charge on virgin feedstock for metal,
paper, plastic, rubber, glass, etc. at the point of product manufacture. Another is to levy it
as an excise tax on wholesale or retail finished products. The latter is more realistic for
implementation on a local government level. Although, as has been noted previously and
from experience in states having container deposits, people will “shop around” in order to
avoid such charges by purchasing goods elsewhere. For this reason, such waste reduction
measures are more effective if instituted on a larger geographical basis.
Charges may be placed on both durable and nondurable products or a disposal charge
only on non-durables and deposits on durables. It is difficult sometimes to determine
appropriate disposal charges on durables because of the delay between manufacture and
disposal. Deposits on durable goods would encourage recycling while disposal charges
would not.
There are several ways to estimate disposal costs, including a per unit basis, a weight
basis, and a product value basis. In order to be effective, taxing on a per-unit basis would
need to establish different rates by product categories, material composition, and product
sizes. Taxing by weight of a product is another way of assessing a disposal charge. There
are several problems with a weight-based tax:
1. It encourages the substitution of lighter but potentially more environmentally dangerous feedstock during manufacture, 2. Unless an exclusion existed for reusable products, such a tax would discourage reusability. Returnable glass beverage containers, for example are heavier than non-returnables and lightweight aluminum is not reusable, 3. The effect of a weight-based charge diminishes as a product’s price-to-weight ratio increases.
36
Waste Reduction
37
The last problem could be addressed by using a product value (cost) in the equation for
determining a product disposal tax rate. Such a value-based tax would encourage both a
reduction in the materials used to manufacture products and their substitution by less
expensive materials. It would discourage the use of expensive materials such as
metal/plastic laminates, which are difficult to recycle. Another effect would be reduction
in expensive excess packaging, which is used solely for marketing. Exemptions should be
allowed for secondary material content and reusability.
Economic analyses and modeling was done in the mid 1980’s to analyze the recycling
and waste reduction effects on paper packaging and containers of product disposal
charges, recycling subsidies, variable waste disposal fees and litter taxes. Materials
included in the model were steel, glass, aluminum, paper, and plastics. For the product
disposal charge analysis, the model applied the charge at the bulk materials production
stage. Of the four policies analyzed, the model indicated the product disposal charge was
consistently best and recycling subsides the worst.
Product Stewardship A relatively new concept that has arisen in the U.S. is product stewardship. Product
stewardship is primarily industry driven with encouragement from the environmental
community. It can involve proactive concepts such as what has become known as
“design for the environment”.
The design for the environment concept incorporates into product development
environmental attributes such as reduction of environmentally sensitive materials,
decreases in equipment energy consumption, extension of product life span and
utilization of parts that can be reused, resold or recycled.
Some examples of this might include (computer):
• Modular, upgradeable design - parts can be removed without use of special tools - allowing easy repair and upgrades, thus lengthening the useful life of the computer.
• Designed for ease of assembly and disassembly - most parts snap together, no glue and minimal use of screws used as fasteners.
Waste Reduction
38
• Large plastic parts are marked to aid recycling. • Internal chassis made of recyclable steel.
Some manufacturers, most notably, computer manufacturers, have designed recycling
and reuse programs. One such computer manufacturer, Dell, offers recycling and
donation (reuse) options. Through Dell's partnership with the National Cristina
Foundation, consumers can donate their systems to charity in exchange for a potential tax
deduction.
The National Cristina Foundation is a non-profit organization that places used technology
with local non-profit organizations and public agencies throughout the U.S. that service
disabled and economically disadvantaged children and adults. Computers, which may no
longer be useful for the original purchaser, may have several years of life left in them for
a non-profit or public agency.
The recycling option involves shipping the equipment back to the manufacturer.
Sometimes computer equipment is accepted from any manufacturer. There is often a fee
associated with this service to cover shipping, recycling and processing costs.
Litter Tax Another potential financial disincentive to promote source reduction is a litter tax. Litter
taxes are normally an ad valorem excise tax placed on items judged to be a litter problem.
Funds collected could be used for litter clean up, recycling promotion or other
management purposes. Litter taxes tend to be revenue producing devices, although
theoretically raising the prices of litter prone products could cause a shift to products less
likely to become litter.
Drop and Swaps Drop and swaps, a form waste exchange, have been used in a number of areas with some
success. Such programs work on the principle that waste is a resource in the wrong place.
When items can be matched to people who need them, they are reused and cease to be
waste. Drop and swaps have had success such as in the collection of household paints.
Leftover paint can make up in excess of 60 percent of the total volume of materials

Waste Reduction
collected at household hazardous waste (HHW) collection events. Drop and swaps may
be held on the same date as HHW collections but need to be managed independently of
such events, because there is no time at a HHW event to separate usable from unusable
paints. A pilot project held in 1990 in central Vermont resulted in approximately 50
percent of the paint being diverted for reuse.
Another drop and swap that has been successful is a furniture drop and swap. Such a program was conducted by the Lamoille County Solid Waste District, Vermont. Officials there found that, at times, items had “new homes” even before being off-loaded by the previous owner.
Commercial and Industrial Waste Reduction
EnviroShare The origins of the EnviroShare program in Hall County go back to New England,
specifically to Vermont. Around 1989, WasteCap was started by the Associated
Industries of Vermont. The gist of the program was a business helping business
approach, via a team of business volunteers, who toured requesting businesses and
offered advice as to what they might do to reduce their solid waste. The strength of the
program came from the fact that it operated via peer matching to offer non-threatening,
non-regulatory assistance. Others liked the idea, and WasteCap has since spread to
Maine, New Hampshire, Massachusetts and Wisconsin to name a few. WasteCap
programs are most often operated by state industry associations on a statewide basis.
The WasteCap concept was included in Hall County's Comprehensive Solid Waste
Management Plan adopted in 1993 as a recommended program. The Greater Hall
Chamber of Commerce was approached with the idea. A subcommittee of the Chamber’s
Solid Waste Committee approved of the concept and renamed it EnviroShare. This
expressed both the fundamental purpose (the environment) and the method (information
and materials sharing).
In March 1994 the EnviroShare Team was formed from Hall County business people
with proven experience in waste reduction. The first site visit was conducted on
39
Waste Reduction
40
March 17, 1994, weeks before formal announcement of the program. Site visits involve a
walk through by the EnviroShare team of the requesting business’s facilities. Following
the walk through, a brainstorming session takes place during which time waste reduction
ideas are developed. These are then formulated into a written format and mailed to the
requesting business within a few days of the site visit.
It was decided by the Environmental Management Committee (formerly, Solid Waste
Committee) that, while members of the EnviroShare team already had a good knowledge
of waste reduction practices, a certification program was still in order. Certification
would be required of team members in order to be permitted to conduct site visits of
requesting businesses.
EnviroShare seeks to: • Improve our environment by helping each other reduce solid waste. • Establish a library of best practices for waste reduction (waste prevention and
recycling). • Provide information on services/consultants for special needs beyond what the
EnviroShare team can provide. • Provide sources for recycling markets. • Assist with waste audits. • Provide information on personnel with specific expertise for volunteer assistance. • Encourage networking and information exchange. • Facilitate materials exchange. • Be a clearinghouse of information.
Materials Exchange There are several regional materials exchanges operating throughout the U.S. According
to the most recent information provided by Material Exchanges on the Web Homepage,
hosted by the U.S. EPA, there are over 50 material exchanges being operated in North
America. Of these, the vast majority is operated on a statewide or regional (multi-state)
basis. Most are non-profit and are operated by governments, universities, chambers of
commerce, and non-profit groups. A few are sub-state, regional operations and some are
operated at the county level. Hall County’s program is one of these.

Waste Reduction
41
Hall County operates a materials exchange under its EnviroShare program. This was also
a recommendation of our original solid waste management plan. The basis of materials
exchange is what is trash to one is treasure to another. Often it's simply a matter of
matching those that want to get rid of something with those that need it. In the process,
both landfill space and money are saved because no money had to be paid in landfill
disposal.
At first, the normal paper-based method of conducting a materials exchange via filling
out of listing forms for wanted or available listings was attempted. On a county scale,
this proved to be unworkable. The weakness of paper-based listings is that they can
become antiquated very quickly. Assembled into a quarterly catalog of listings, as was
standard practice, the listings can become outdated virtually the instant they are put to
paper. Materials’ status may change quickly, negating the accuracy of printed listings.
Materials exchange is now facilitated via the EnviroShare List and other resources. Sample Categories for listings: • Paper • Plastic & Rubber • Glass • Metal & Metal Sludges • Wood • Miscellaneous EnviroShare List A listserv (list) is an electronic mailing list that sends e-mail to all persons on the list via
an email message to a single address. The basic purpose of the EnviroShare List is to
provide an instant, electronic format to continue information sharing. Relevant topics
include environmental, health and safety issues.
Sample Areas:
1. Training Opportunities- share information on upcoming workshops/training/certification opportunities.
2. Tips- share information you've got on environmental management.

Waste Reduction
3. Inquiries- send an inquiry to the list. Perhaps someone out there has the answer. 4. Regulations- share information on upcoming regulations of interest. 5. Materials Exchange- got a material, need a material? Post it to the list. Maybe
someone on the list can use it or knows of someone who can.
EnviroShare X-change Continuing on with the success of the EnviroShare List, the concept was expanded and
named EnviroShare X-change. EnviroShare X-change consists of email lists arranged in
a web fashion to promote solid waste reduction via reuse and materials matching in Hall
County. In addition to the potential for waste reduction, such a network also has
implications for information exchange.
Each list in this web is organized around the following sectors in Hall County:
1. EnviroShare List (business and industry); 2. Non-Profit List (nonprofits); and 3. Schools List (city/county, private, pre-school, colleges).
Community BenefitsThis program allows materials and needs to match themselves. As materials become
available for reuse, they can be matched directly to those sectors doing "public works" or
through them to those in need, helping to make Hall County a better place to live, while
keeping beneficial materials out of the landfill. The EnviroShare X-change was chosen
as Hall County’s way of operating a materials exchange, to turn liabilities into assets for
community benefit.
Recommendations The materials exchange component should continue to include materials matching via
EnviroShare X-change and possibly via the Internet through the www.enviroshare.org
web site to those non-profit groups and agencies doing “public works” in Hall County.
This could provide them with needed non-financial resources to benefit the community
while diverting waste from disposal. Ways to facilitate materials exchange with the
general populace should also be explored.
42
Waste Reduction
Recycling Recycling is the process by which waste materials are collected, processed and
manufactured into useful products to be used again. As much as 80 percent of the waste
stream, exclusive of problem wastes, could technically be recovered from the mixed solid
waste stream by recycling and composting. However, household and business
participation, the capture rate of the individual materials, and storage, collection,
processing and transportation costs affect the actual rate of recycling.
Drop-off Recycling Drop off recycling is simply the collection of recyclables by having residents drop them
off at a collection site. The collection sites may be staffed or not. Materials collected at
drop off recycling centers are limited only by imagination and the ability to market the
materials.
Buy Back Centers A buy back center is essentially the same as a drop off center, but with two differences:
1) They are always staffed; and 2) Residents receive payment for the materials they
deliver. There are no known privately owned buy back centers operating in Hall County.
There are other recyclers operating in Hall County as buy back centers, if one considers
scrap metal dealers in this category. Information about these recyclers can be found in
the Appendix in Table B-2.
Curbside Recycling Curbside recycling is the collection of recyclables at the actual curbside. The system may
use one or several bins for separation of materials in the home and placement at the curb.
Materials that have been collected in curbside programs include, but are not limited to,
glass, aluminum cans, tin cans, newspaper, plastics, used motor oil, used corrugated
containers, box board, and household batteries.
Curbside pickup can be either source separated or commingled. Source separation
involves having the generators place recyclable materials into, most frequently, a single
bin. Bins are collected and then the materials separated into various compartments on
43
Waste Reduction
board the collection vehicle while still at the curb. Commingled involves the collection
of recyclables without separation at the curb. Separation is left to take place later at the
processing center.
Source Separated at the Curb or Commingled “Source Separation” is the separation of materials to be recycled from waste at the point
at which waste is generated, be it a household or a commercial/industrial entity. Since
waste is generated wherever human activity occurs, opportunities for source separation
coincide as well. Commonly, source separation has been thought of as an activity
relegated to the single family household. Now, however, that mind-set is changing to
include source separation in multifamily apartments, institutions (schools, banks,
government offices) and businesses.
Disadvantages to source separation are that it may require the use of special vehicles or
modification of existing vehicles to keep the materials separate. This adds to the expense
of the program. In the case of residential curbside collection, residents are required to
separate newspapers, glass, beverage cans, milk jugs, etc. prior to setting them out at the
curb. Collection of source separated recyclables most often results in an “overlay” of a
separate collection system for recyclables overlaid over the existing trash collection
system. This results in the financing, staffing and management of two complete systems.
Advantages to source separation are the materials collected are generally cleaner, may
command a higher price, are easier to market, and are more likely to retain market share
should supply ever exceed demand. As more recycling programs come on line and supply
exceeds the end users needs for secondary materials, those programs producing the
highest quality materials will be more likely to retain their market. For example, paper
mills are basically machines that need a certain amount of paper fiber per day to operate.
Once mills have more material than they need, they can then be selective as to what paper
they choose to accept. It would be natural to accept only the best paper, all other factors
being equal.
44
Waste Reduction
45
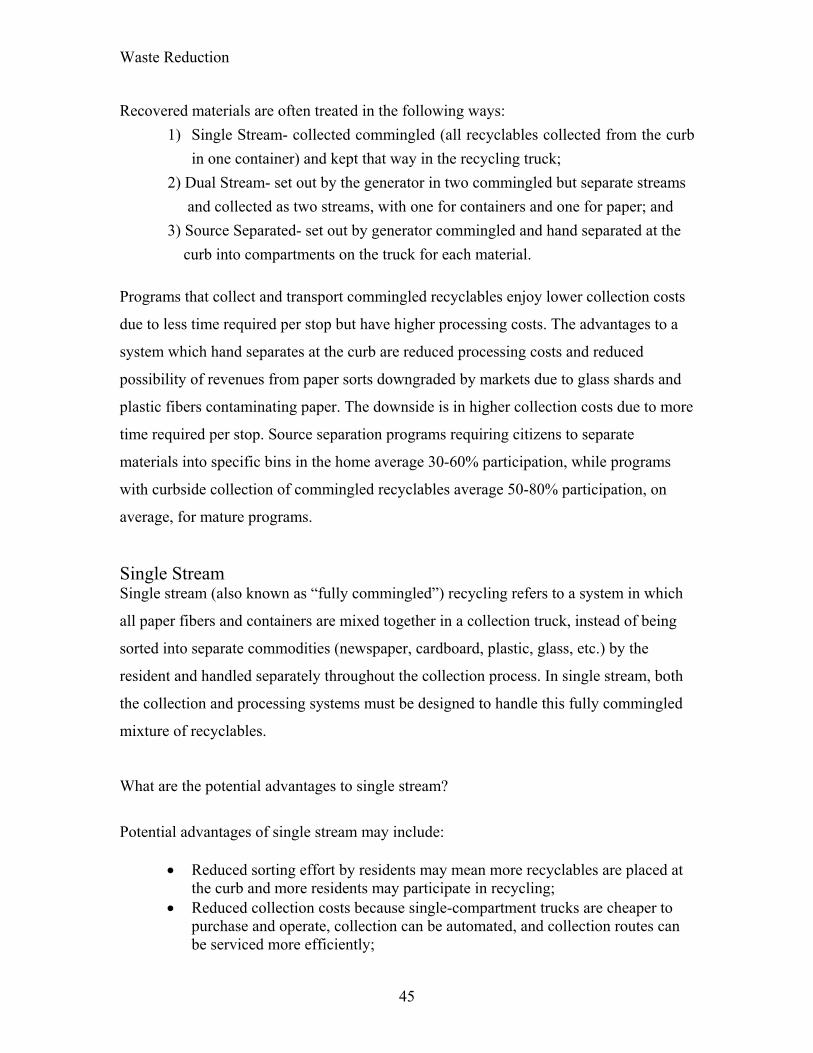
Recovered materials are often treated in the following ways: 1) Single Stream- collected commingled (all recyclables collected from the curb
in one container) and kept that way in the recycling truck; 2) Dual Stream- set out by the generator in two commingled but separate streams
and collected as two streams, with one for containers and one for paper; and 3) Source Separated- set out by generator commingled and hand separated at the curb into compartments on the truck for each material.
Programs that collect and transport commingled recyclables enjoy lower collection costs
due to less time required per stop but have higher processing costs. The advantages to a
system which hand separates at the curb are reduced processing costs and reduced
possibility of revenues from paper sorts downgraded by markets due to glass shards and
plastic fibers contaminating paper. The downside is in higher collection costs due to more
time required per stop. Source separation programs requiring citizens to separate
materials into specific bins in the home average 30-60% participation, while programs
with curbside collection of commingled recyclables average 50-80% participation, on
average, for mature programs.
Single Stream Single stream (also known as “fully commingled”) recycling refers to a system in which
all paper fibers and containers are mixed together in a collection truck, instead of being
sorted into separate commodities (newspaper, cardboard, plastic, glass, etc.) by the
resident and handled separately throughout the collection process. In single stream, both
the collection and processing systems must be designed to handle this fully commingled
mixture of recyclables.
What are the potential advantages to single stream?
Potential advantages of single stream may include:
• Reduced sorting effort by residents may mean more recyclables are placed at the curb and more residents may participate in recycling;
• Reduced collection costs because single-compartment trucks are cheaper to purchase and operate, collection can be automated, and collection routes can be serviced more efficiently;
Waste Reduction
46
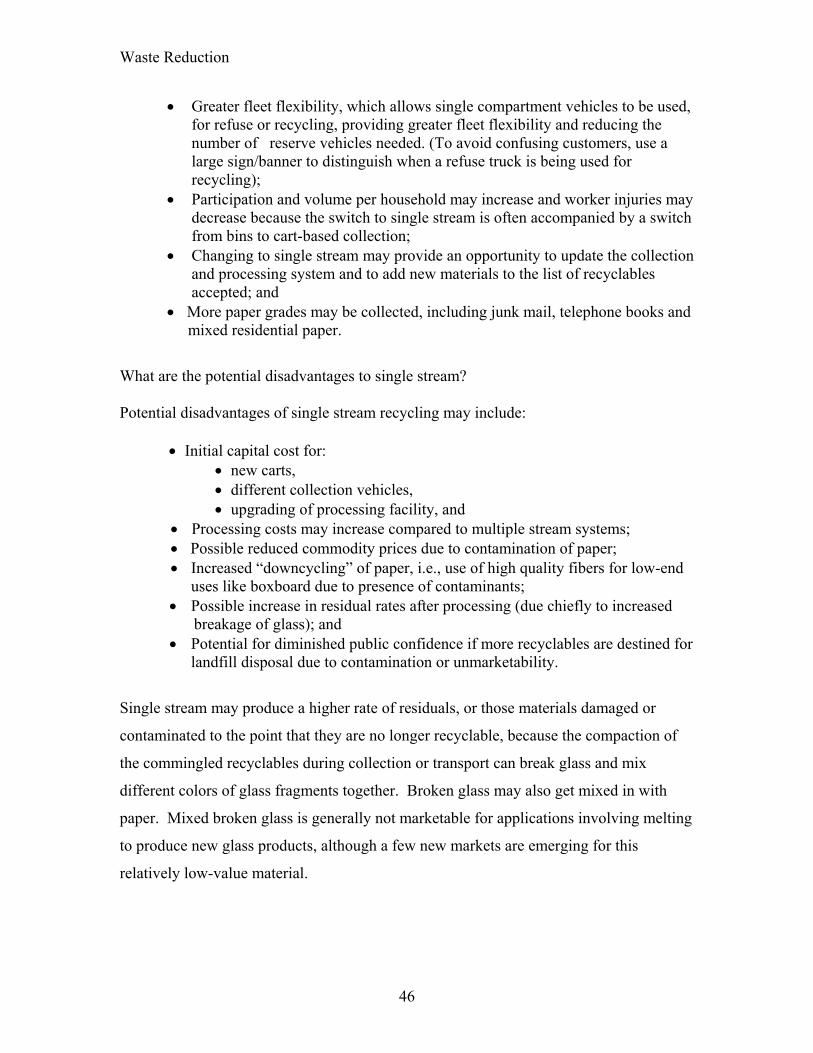
• Greater fleet flexibility, which allows single compartment vehicles to be used, for refuse or recycling, providing greater fleet flexibility and reducing the number of reserve vehicles needed. (To avoid confusing customers, use a large sign/banner to distinguish when a refuse truck is being used for recycling);
• Participation and volume per household may increase and worker injuries may decrease because the switch to single stream is often accompanied by a switch from bins to cart-based collection;
• Changing to single stream may provide an opportunity to update the collection and processing system and to add new materials to the list of recyclables accepted; and
• More paper grades may be collected, including junk mail, telephone books and mixed residential paper.
What are the potential disadvantages to single stream? Potential disadvantages of single stream recycling may include:
• Initial capital cost for: • new carts, • different collection vehicles, • upgrading of processing facility, and
• Processing costs may increase compared to multiple stream systems; • Possible reduced commodity prices due to contamination of paper; • Increased “downcycling” of paper, i.e., use of high quality fibers for low-end uses like boxboard due to presence of contaminants; • Possible increase in residual rates after processing (due chiefly to increased breakage of glass); and • Potential for diminished public confidence if more recyclables are destined for landfill disposal due to contamination or unmarketability.
Single stream may produce a higher rate of residuals, or those materials damaged or
contaminated to the point that they are no longer recyclable, because the compaction of
the commingled recyclables during collection or transport can break glass and mix
different colors of glass fragments together. Broken glass may also get mixed in with
paper. Mixed broken glass is generally not marketable for applications involving melting
to produce new glass products, although a few new markets are emerging for this
relatively low-value material.
Waste Reduction
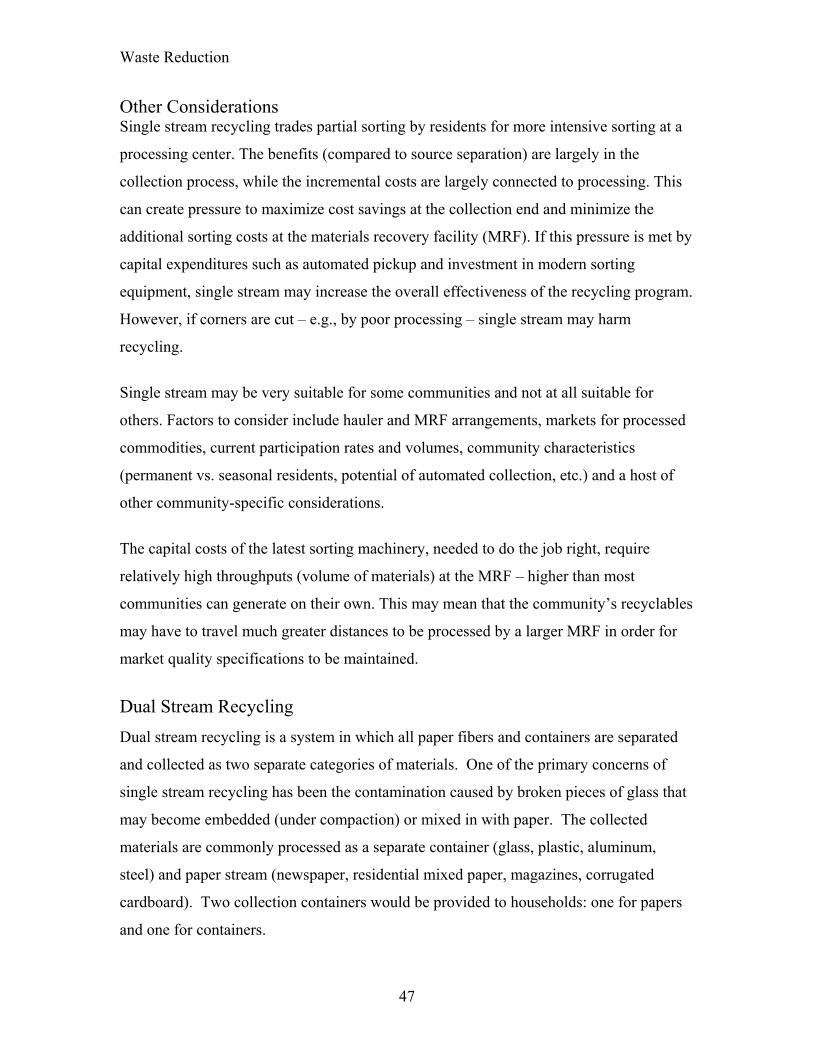
Other Considerations Single stream recycling trades partial sorting by residents for more intensive sorting at a
processing center. The benefits (compared to source separation) are largely in the
collection process, while the incremental costs are largely connected to processing. This
can create pressure to maximize cost savings at the collection end and minimize the
additional sorting costs at the materials recovery facility (MRF). If this pressure is met by
capital expenditures such as automated pickup and investment in modern sorting
equipment, single stream may increase the overall effectiveness of the recycling program.
However, if corners are cut – e.g., by poor processing – single stream may harm
recycling.
Single stream may be very suitable for some communities and not at all suitable for
others. Factors to consider include hauler and MRF arrangements, markets for processed
commodities, current participation rates and volumes, community characteristics
(permanent vs. seasonal residents, potential of automated collection, etc.) and a host of
other community-specific considerations.
The capital costs of the latest sorting machinery, needed to do the job right, require
relatively high throughputs (volume of materials) at the MRF – higher than most
communities can generate on their own. This may mean that the community’s recyclables
may have to travel much greater distances to be processed by a larger MRF in order for
market quality specifications to be maintained.
Dual Stream Recycling
Dual stream recycling is a system in which all paper fibers and containers are separated
and collected as two separate categories of materials. One of the primary concerns of
single stream recycling has been the contamination caused by broken pieces of glass that
may become embedded (under compaction) or mixed in with paper. The collected
materials are commonly processed as a separate container (glass, plastic, aluminum,
steel) and paper stream (newspaper, residential mixed paper, magazines, corrugated
cardboard). Two collection containers would be provided to households: one for papers
and one for containers.
47

Waste Reduction
48
Dual stream recycling may be thought of as a semi-commingled system. The materials
are collected and processed commingled but in two separate streams.
Single Stream Versus Dual Stream The economics of collecting recyclables as a single stream versus two streams (papers
and containers separated) is compelling. A list of cost advantages is as follows:
1) Uses the same equipment that collects trash, i.e., one interchangeable fleet to buy and maintain.
2) Sets the stage for automation of collection which reduces time and eliminates injuries. 3) The truck returns when it is full, not when one compartment is full. 4) Compacting single stream material in garbage truck equipment allows for a
heavier load before returning, i.e., fewer trips. 5) Residents carry one container to the curb. Participation rates increase. 6) Single stream processing equipment allows for more paper grades to be collected (OCC, mixed paper, telephone books, junk mail and all other residential paper).
The American Forest & Paper Association released the results of a study conducted by
Jaakko Pöyry Consulting and Skumatz Economic Research Associates that looked at the
impact single stream collection programs had on recycling operations compared to a dual
stream collection program.
Among the study's findings were:
• Overall systemwide expenses increased an average of $3 per ton for paper collected in single stream programs, which includes costs for collection, processing at materials recovery facilities (MRF) and mill utilization.
• Curbside collection costs are approximately $15 per ton lower for single stream programs.
• Mills incurred increased operating and maintenance costs of approximately $8 per ton when using recovered paper from single-stream programs.
• Sorting costs at MRFs averaged $10 per ton more for single-stream recycling programs.
The Recovered Fiber Executive Committee of the American Forest & Paper Association
(AFPA) funded a study that compared the contamination of single stream news (ONP)
and residential mixed paper (RMP) with dual stream collection. They analyzed paper
samples obtained from 60 U.S. curbside recycling programs. The final report was issued
in October 2002. The overall conclusion was that single stream ONP contained 3.3%
prohibitives vs. 2.0% for dual stream. However, of this, glass and fines were 0.5% for

Waste Reduction
single stream ONP vs. 0.6% for dual stream ONP. The same study also concluded that
single stream RMP had 1.8% prohibitives vs. 1.1% for dual stream RMP. However, of
this, glass and fines were 0.4% for single stream RMP vs. 0.2% for dual stream RMP.
In spite of all the publicity, these contamination level differences have not been
significant enough to curtail sales of single stream OPN or RMP. Furthermore, as time
goes by, the virgin mills that are bothered by glass and other contaminants will put in
cleaning systems that are currently available and have been used for many years by
recycled mills. This should eliminate the contamination issue.
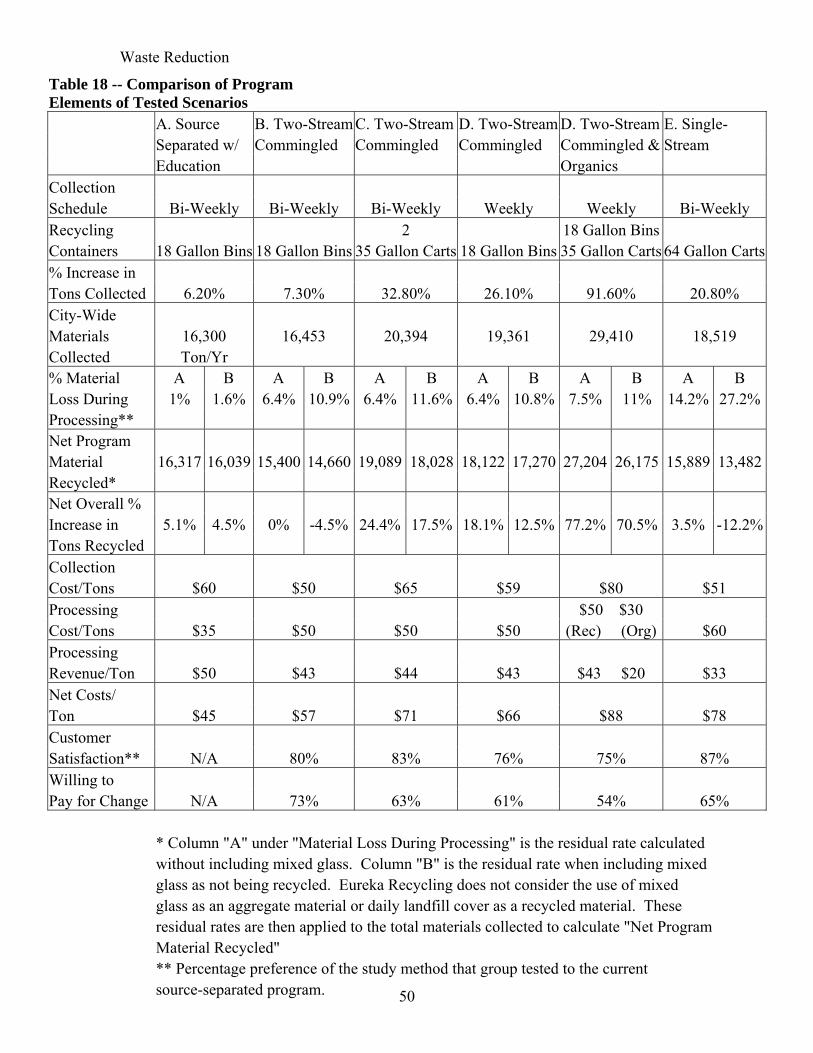
Case Study: Eureka Recycling In May 2002 Eureka Recycling, in partnership with the city of Saint Paul and the
Minnesota Office of Environmental Assistance (MOEA), completed a 14-month study
that took a close look at five different ways to pick up recycling at the curb. The study
examined how sorting method, container size and frequency of pickup affect the success
of the recycling program as measured by environmental results, cost, convenience and
resident satisfaction.
49
Waste Reduction
50
Table 18 -- Comparison of Program Elements of Tested Scenarios A. Source B. Two-Stream C. Two-Stream D. Two-Stream D. Two-Stream E. Single- Separated w/ Commingled Commingled Commingled Commingled & Stream Education Organics Collection Schedule Bi-Weekly Bi-Weekly Bi-Weekly Weekly Weekly Bi-Weekly Recycling 2 18 Gallon Bins Containers 18 Gallon Bins 18 Gallon Bins 35 Gallon Carts 18 Gallon Bins 35 Gallon Carts 64 Gallon Carts% Increase in Tons Collected 6.20% 7.30% 32.80% 26.10% 91.60% 20.80% City-Wide Materials 16,300 16,453 20,394 19,361 29,410 18,519 Collected Ton/Yr % Material A B A B A B A B A B A B Loss During 1% 1.6% 6.4% 10.9% 6.4% 11.6% 6.4% 10.8% 7.5% 11% 14.2% 27.2%Processing** Net Program Material 16,317 16,039 15,400 14,660 19,089 18,028 18,122 17,270 27,204 26,175 15,889 13,482Recycled* Net Overall % Increase in 5.1% 4.5% 0% -4.5% 24.4% 17.5% 18.1% 12.5% 77.2% 70.5% 3.5% -12.2%Tons Recycled Collection Cost/Tons $60 $50 $65 $59 $80 $51 Processing $50 $30 Cost/Tons $35 $50 $50 $50 (Rec) (Org) $60 Processing Revenue/Ton $50 $43 $44 $43 $43 $20 $33 Net Costs/ Ton $45 $57 $71 $66 $88 $78 Customer Satisfaction** N/A 80% 83% 76% 75% 87% Willing to Pay for Change N/A 73% 63% 61% 54% 65% * Column "A" under "Material Loss During Processing" is the residual rate calculated without including mixed glass. Column "B" is the residual rate when including mixed glass as not being recycled. Eureka Recycling does not consider the use of mixed glass as an aggregate material or daily landfill cover as a recycled material. These residual rates are then applied to the total materials collected to calculate "Net Program Material Recycled" ** Percentage preference of the study method that group tested to the current source-separated program.
Waste Reduction
51
Based on the results of this study, Eureka Recycling recommended four main changes to
improve the recycling program in Saint Paul. These conclusions are specific to Saint
Paul, but may be valid in other communities as well.
The study investigated three indicators: 1. Environmental Impacts: Consider which collection method allows residents to
recycle the most materials while having the least amount of materials that have to be thrown out? (Contaminated and damaged materials have to be thrown out.) Consider the recycling collection method that gets the most recycled with the least pollution.
2. Cost: Consider how much the different methods cost and how the cost of each impacts the residents' choice.
3. Convenience/Satisfaction: Consider why, how and what do people want to recycle and what would make them recycle more.
Five collection methods were developed and tested:
1. Scenario A: Source-separated collection system. Residents sorted the materials at the curb into separate categories. Collection occurred bi-weekly.
2. Scenario B: Two-stream collection using two 18-gallon blue bins. Residents sorted materials into two categories or streams: papers (including newspaper, cardboard, paper and mail) and containers (a mix of cans, glass and plastic bottles.) Collection occurred bi-weekly.
3. Scenario C: Two-stream collection, same as above, but using 35-gallon rolling carts to collect and set out their materials. Collection occurred bi-weekly.
4. Scenario D: Two-stream collection with 18-gallon blue bins and the collection of household organics (including food scraps and non–recyclable papers like pizza boxes and paper plates) in a 35-gallon rolling cart. In this neighborhood, recycling and household organics were collected every week.
5. Scenario E: Single-stream collection system using one large 60-gallon rolling cart to collect recyclables. Residents did not sort by stream. Materials were mixed together-cans, glass, plastic bottles and papers-and the entire separation took place at a recycling facility. Collection occurred bi-weekly.
TRecommended Changes to Saint Paul’s Recycling Program for 2004: T
• Implement a “two-stream” sorting system, in which all paper is collected together in one category and all containers in another category.
• Start picking up #1 and #2 plastic bottles at the curb. • Provide weekly collection in 18-gallon recycling bins. • Work toward adding organics collection to the curbside program.
Waste Reduction
Multi-Family Unit Recycling Multi-family units are basically apartment complexes. There are a number of multi-
family residential areas in the planning area. Most of these occur in the larger
municipalities such as Gainesville and Oakwood. The challenge in recycling in these
situations is in dealing with a transient population that may feel less connection to the
solid waste management system than the general population. This transient nature
provides a challenge to education efforts.
For the most part, collection service is provided through landlords contracting with a
private hauler or hauling refuse themselves to the county landfill. This serves to separate
generators from the system and their interaction with it.
Another limitation in dealing with multi-family units is that there may be physical
limitations in storage of recyclables in the household and on the property. Smaller
household containers can help get around space problems in the home. However, the
other problem of space limitations remains outside the residence. In larger complexes, it
is not practical for everyone to place a container at curbside. A central storage location
may be better and may also reduce the possibility of containers being stolen.
Mandatory vs. Voluntary Recycling In general, mandatory recycling programs enjoy a higher participation rate than those that
are voluntary. The Institute for Local Self Reliance, in its 1990 study of 16 mandatory
programs found an average participation rate of 90 percent and among 6 voluntary
programs 54 percent. The same study also found some voluntary programs, with higher
participation rates than some mandatory ones. This indicates that mandatory alone is not
always enough. Other literature sources provide a participation range of 50 to 98 percent
for mandatory programs.
Most mandatory programs have ordinances that have as penalty provisions non-pickup of
refuse containing recyclables and/or fines. A good number of ordinances also have
enforcement provisions for waste haulers, such as fines and loss of disposal privileges.
52
Waste Reduction
53
Many mandatory programs are mandatory in name only, that is, the knowledge that a
program is mandatory (at least early on) is incentive enough, without enforcement.
Enforcement, in fact, can be troublesome. For example, the non-pickup of refuse penalty
is easier to enforce in programs where municipal refuse collection exists, more difficult
where refuse collection is contracted, and most difficult where collection is private, free
enterprise. The reason is simple-- the extent of detachment of enforcers (government) to
enforcement (haulers). The same principle follows through to fining, which requires that
haulers record and report violations to the entity having management authority. No matter
what enforcement mechanisms are in place, if a municipality is sincere in its wishes to
fully enforce a mandatory ordinance, it should probably plan on some direct policing.
Other Factors Affecting Participation Rates There are many factors which affect curbside recycling participation rates, such as
demographics, community spirit, volume based or weight based disposal fees, provision
of containers, convenience, program maturity, frequency of collection, and method of
calculating the participation rate.
Generally, curbside programs which have achieved the highest material recovery rates are those where: ● collection of recyclables occurs once a week and coincides with regular refuse pick up; ● material separation and preparation are made as convenient as possible for the householder; and ● the program is properly advertised and promoted on a regular, ongoing basis.
Mixed Waste Processing Mixed waste processing systems process raw untreated MSW to yield recyclables. The
main advantage to this system is the ease of implementation. It avoids the classic problem
of any new program requiring citizen participation, i.e., resistance to change. Since no
Waste Reduction
change is required, on the part of householders, there is no need for an expensive
education program. There are no separate collection schedules to remember and no need
to learn how to prepare recyclables. There are no separate containers to buy or store. To
the residents, everything is status quo, even after the program has been implemented.
Another advantage is that the same collection schedules, routes and equipment can be
used.
However, such a program also avoids a classic problem of our modern society–
wastefulness. It does nothing to teach people about conservation or wise use of natural
resources. There is no incentive to change from destructive to constructive habits, no
incentive to reduce waste, and no incentive to buy recyclable packaging.
Because there is no source separation, contamination is more of a problem. Some
materials may be contaminated to the point where they cannot be recycled, e.g., soiled or
wet newspaper, partially full peanut butter jars, etc. For this reason, these systems are
often coupled with composting operations in order to divert these normally recyclable
materials from disposal.
Processing costs are high because the total, unsorted waste stream must be processed. It is
very labor and equipment intensive. Facilities may have to be three to four times larger
than facilities handling only recyclables. Environmental impacts of such a facility would
also be greater as all trucks must be routed to the facility resulting in traffic impacts.
Also, potential problems with noise, odors and vector control would have to be
addressed.
Due to the unsorted nature of the incoming refuse, contamination of the compostable
fraction is also more likely. Items such as household hazardous waste, used motor oil,
household batteries, and others may cause contamination of the compost if methods are
not put in place to address their removal up front. The contamination potential would be
further exacerbated by shredding or grinding of the compostable fraction, a common
practice to assist decomposition, in advance of the composting process.
54
Waste Reduction
Processing Systems Regardless of the collection system employed, some processing will be required to make
materials marketable. Processing basically accomplishes two purposes--contaminant
removal, and densification.
Contaminant removal takes the form of further separation of materials (separation of
dissimilar materials and separation from contaminants) and/or some sort of cleansing.
Densification may be accomplished through compaction (baling), breaking/crushing
(glass) or granulation (plastics). Processing is necessary to improve the economics of
transport to market and to present the materials in a form whereby they may be utilized in
a manufacturing process. Some materials may require additional processing by the end
user.
Materials for recycling will require between one and three processing steps prior to reuse.
Processing may occur in the household, at an intermediate processing facility, or broker,
and prior to use in a manufacturing process. Each one of these steps requires energy and
materials and generates some waste, with its attendant environmental impacts.
Recycling In Hall County
As recommended in the 1993 Comprehensive Solid Waste Management Plan,
Gainesville, Oakwood, Flowery Branch, and Clermont have implemented curbside
recycling programs. These all use the source separated approach.
Clermont Clermont operates a once per week voluntary curbside recycling program utilizing
municipal staff and a compartmentalized trailer. Rigid bins (one per household) and a
curbside sort are used. Sorted recyclables are delivered to the Hall County Recycling
Center.
55

Waste Reduction
Clermont reported 8.67 tons of recyclables collected in 2003. A total of 177 tons of waste
was estimated disposed in 2003. This yields an approximate 4.7 % of the waste being
diverted via the city’s curbside recycling program.
Flowery Branch Flowery Branch operates a once per week voluntary curbside recycling program utilizing
a contracted recycler and 18 gallon curbside bins. Recyclables are collected once per
week using a curbside sort.
Table 19 -- 2003 Recycling Tons for Flowery Branch
Month Tons January 1.15 February 1.08 March 1.23 April 1.13 May 1.05 June 1.2 July 1.05 August 1.05 September 1.2 October 1.2 November 1.2 December 1.5 Total 14.04
A total of 1,015 tons of waste was estimated disposed in 2003. This yields an
approximate 1.4% of the waste diverted via the city’s curbside recycling program.
56

Waste Reduction
Gainesville Gainesville operates a voluntary curbside recycling program utilizing a contracted
recycler and rigid curbside bins. Recyclables are collected once per week using a
curbside sort.
Table 20 -- 2003 Recycling Tons for Gainesville
Month Tons January 53 February 49 March 53 April 57 May 65 June 53 July 51 August 49 September 58 October 58 November 57 December 63 Total 666
A total of 8,120 tons of waste was estimated to be disposed in 2003. Therefore, an
estimated 8.2 % of the waste bound for the county landfill was diverted via the city’s
curbside recycling program.
The City should be able to consistently attain 20 percent diversion by increasing the
participation rate and adding to the list of acceptable materials. There are concerns,
however, regarding waste reduction progress among the Hispanic population that may
stem from cultural differences and inadequate communication efforts.
Current (2004) costs for the City’s recycling program are $3.30/household/month as per the BFI contract.
57

Waste Reduction
Gillsville Gillsville does not offer a recycling program. Residents may use the county’s compactor
sites.
Lula Lula does not offer a recycling program. Its residents may use the county compactor sites
if they wish.
Oakwood Oakwood operates a once per week mandatory curbside recycling program utilizing
municipal staff and a compartmentalized trailer. Rigid bins (one per household) and a
curbside sort are used. Sorted recyclables are delivered to the Hall County Recycling
Center.
The total recycling for the City of Oakwood for 2003 was 17.65 tons. A total of 415 tons
of waste was estimated disposed in 2003. This yields an approximate 4.1% of the waste
bound for the county landfill being diverted via the city’s curbside recycling program.
Hall County Currently Hall County is collecting recyclables in custom-designed roll off containers or
trailers located at all the compactor sites and the County Government/Education Building
(see Table B-2 in the Appendix for locations). The custom-designed roll off containers
have separate bins for each category of recyclable material. Trailers are used for
collection of corrugated cardboard at all compactor sites and county office buildings.
They are also used at the County Government/Education Building for collection of
containers. Recyclables are transported to an intermediate processing center (IPC) located
at 1008 Chestnut Street, in Gainesville. At the IPC, the recyclables are processed and
placed on transfer trailers (provided by recyclers) for shipment. The newspaper is
collected at all the sites located in Appendix Table B-1 by SP Recycling Corporation.
58
Waste Reduction
White goods (appliances, etc.) are collected and stored at the county landfill and
eventually recycled by a private contractor on a monthly basis.
As previously noted, there are other recyclers operating in Hall County that deal mostly
with scrap metals. Information about these recyclers can be found in the Appendix in
Table B-2.
Processing/Recovery Centers Hall County operates an intermediate processing center (IPC) at 1008 Chestnut Street in
Gainesville. An IPC essentially processes source separated recyclables. The facility is
located in an industrial area less than one half mile from I-985, which is nearly ideal from
an operational and transportation standpoint.
The facility accepts glass, aluminum cans, aluminum foils, steel cans, corrugated
cardboard, newspaper, office paper, computer paper, mixed paper, junk mail, magazines,
bound books, HDPE and PETE plastics, used motor oil, grease (used cooking oil), and
portable rechargeable batteries. The Resource Recovery Division manages the Hall
County Recycling Center with labor provided by a county inmate work detail from the
Hall County Correctional Institution. Materials are hand-sorted.
Materials are accepted on a voluntary basis. No fees are paid for receipt of materials. The
bulk of the materials come from the county’s recyclables collection areas located at
compactor sites throughout the county. Some materials are also brought in by the public,
businesses, certain cities within Hall County, and some surrounding local governments.
All materials are processed on site, except newspaper, which is collected by SP
Recycling Corp. for processing at their Lawrenceville location and used motor oil, which
is pumped aboard a tanker truck from each collection tank location and hauled by
Universal Refining of Peachtree City. An estimated 3,607 of the total 3,647 tons recycled
in 2003 is estimated to be Hall County sources (excluding cities and sources outside the
county) or approximately 5.1% of the total waste bound for the county landfill.
59
Waste Reduction
Taken as a percentage of waste diverted from the total residential waste collected via
compactor sites—on an equal footing with the analysis done elsewhere for the cities—the
diversion rate stands at approximately 9.1 %.
Private processing/recovery centers consist of scrap metals dealers, which are sometimes overlooked when one thinks about recycling. Such establishments also buy scrap and surplus materials for recycling or reuse. See Table B-2 in the Appendix for scrap metal dealers.
60

Waste Reduction
Table 21 -- Summary of Public Recycling Programs--2003
Local Government Program Type
Waste Tons Collected
Tons Diverted
Percent Diverted
Clermont Public, voluntary curbside
177 8.67 4.7%
Flowery Branch Privatized, voluntary curbside
1,015 14.04 1.4%
Gainesville Privatized, voluntary curbside
8,120 666 8.2%
Gillsville None 68 0 0 Hall County, compactors only (1)
Public, voluntary drop off
26,934 2,705 (est.) 9.1%
Hall County, all in-county (2)
Public, voluntary drop off
26,934 3,607 (est.) 13.4%
Lula None 401 0 0 Oakwood Public,
mandatory curbside
415 17.65 4.1%
Totals 37,321 4,313.36 10.4%
(1) Includes only recycled tons collected from compactor sites. (2) Includes all recycled tons accepted from sources from within Hall County,
excluding that received from Hall County municipalities. Upgrades to Hall County Recycling Center
Since the 1993 Plan, upgrades were made as planned to the Hall County Recycling
Center. These included a horizontal extrusion baler, conveying equipment, custom
compartmentalized recycling roll off containers, building addition, glass crusher and
61
Waste Reduction
other items. The facility currently operates under capacity and has excess processing
capacity remaining.
Hall County Study During 1994 and 1995, the Hall County Resource Recovery Division completed an
analysis of the county’s residential waste stream and residents’ recycling practices.
Due to changing market forces, Hall County has lost some recycling tonnage from
commercial and industrial sources, most notably corrugated cardboard. The waste Hall
County can control—residential waste from compactor sites—represents a resource for
additional recyclable tonnage.
Since the majority of local governments in the county provide waste collection services
for residential waste, that which is leaving the county is largely commercial and industrial
waste. This means that the relative percentage of residential waste has increased from
when the waste stream was surveyed in 1991 during the development of the original
Comprehensive Solid Waste Management Plan. This also means that greater impact on
the amount of waste disposed at the county landfill can now be obtained by focusing on
the reduction of residential waste. This assertion is further bolstered by the foregoing
source of waste survey.
Knowing the amount of each material being recycled from compactor sites and armed
with the data developed by the waste sort, it is possible to calculate recovery rates for
each material.
Good recovery rates exist for newspaper and corrugated cardboard. Over 60 percent of
available newspaper and corrugated cardboard is being recovered for recycling. It is
believed that recovery rates for corrugated cardboard are actually higher. Because brown
kraft paper grocery bags are recyclable with corrugated cardboard, these were also
weighed with corrugated cardboard. It is believed that many residents may not be aware
the two materials are compatible. Grocery bags can also more easily be stuffed in a trash
bag. These two factors together may account for lowered recovery rates for this material.
62

Waste Reduction
It should be noted that since the completion of this study, the market share for paper
grocery bags has been largely supplanted by plastic.
The data show that, at the time of the study, Hall County was attaining an approximate
28% capture rate on those recyclables then accepted for recycling at compactors (glass,
HDPE, PETE, magazines, newspaper, corrugated cardboard, aluminum cans, steel cans).
The recycling program is achieving approximately 14 percent diversion of materials from
disposal at the compactor sites. An 80 percent capture rate on those materials currently
accepted for recycling would yield a diversion rate of nearly 39 percent or more than
double the current rate. Many programs that institute volume based rates experience
recycling increases of 40 percent or so.
Conclusions Due to the exportation of commercial and industrial waste by private waste haulers, the
relative percentage of residential waste disposed of in Hall County has increased.
Therefore, reductions in residential waste are more effective in reducing the waste stream
bound for disposal in Hall County, or more specifically, bound for the Candler Road
Landfill.
Instituting volume-based rates will increase recycling. The question is whether we can
handle the increased pressures on our hauling system, as it currently exists. Since
recyclables are handled in an uncompacted state, every recyclable item diverted from the
waste stream represents an item diverted from a compacted to uncompacted state. The
increase in number of pulls on roll off containers will therefore increase. We must use
this knowledge in making any changes to our current system.
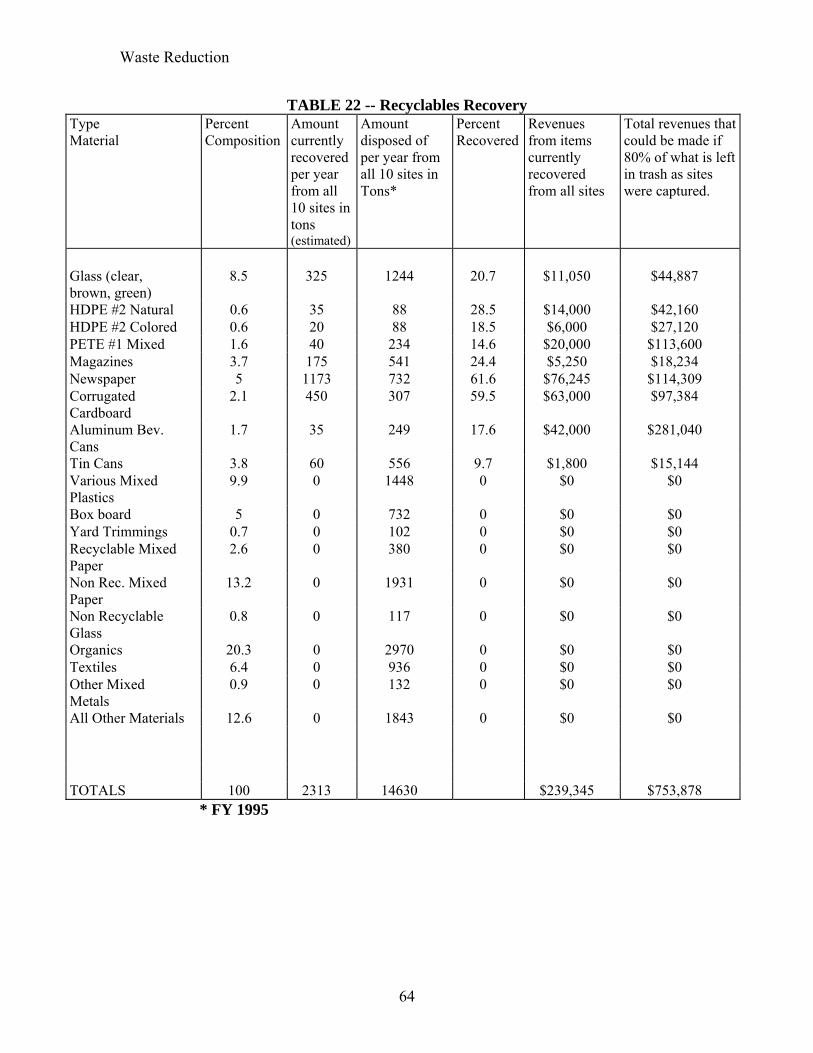
A random waste sort was conducted on waste taken from the Hall County compactor sites
in November 1994, January 1995 and July 1995 in an attempt to determine what
percentage of each material was left in the waste stream that was not being recovered at
the time of the survey. Table 22 shows the results.
63
Waste Reduction
TABLE 22 -- Recyclables Recovery Type Material
Percent Composition
Amount currently recovered per year from all 10 sites in tons (estimated)
Amount disposed of per year from all 10 sites in Tons*
Percent Recovered
Revenues from items currently recovered from all sites
Total revenues that could be made if 80% of what is left in trash as sites were captured.
Glass (clear, brown, green)
8.5 325 1244 20.7 $11,050 $44,887
HDPE #2 Natural 0.6 35 88 28.5 $14,000 $42,160 HDPE #2 Colored 0.6 20 88 18.5 $6,000 $27,120 PETE #1 Mixed 1.6 40 234 14.6 $20,000 $113,600 Magazines 3.7 175 541 24.4 $5,250 $18,234 Newspaper 5 1173 732 61.6 $76,245 $114,309 Corrugated Cardboard
2.1 450 307 59.5 $63,000 $97,384
Aluminum Bev. Cans
1.7 35 249 17.6 $42,000 $281,040
Tin Cans 3.8 60 556 9.7 $1,800 $15,144 Various Mixed Plastics
9.9 0 1448 0 $0 $0
Box board 5 0 732 0 $0 $0 Yard Trimmings 0.7 0 102 0 $0 $0 Recyclable Mixed Paper
2.6 0 380 0 $0 $0
Non Rec. Mixed Paper
13.2 0 1931 0 $0 $0
Non Recyclable Glass
0.8 0 117 0 $0 $0
Organics 20.3 0 2970 0 $0 $0 Textiles 6.4 0 936 0 $0 $0 Other Mixed Metals
0.9 0 132 0 $0 $0
All Other Materials 12.6 0 1843 0 $0 $0 TOTALS 100 2313 14630 $239,345 $753,878
* FY 1995
64

Waste Reduction
Problem Wastes
Special Management Items White Goods Hall County provides a collection area at its landfill for the separate collection and
recycling of white goods. Chlorofluorocarbons (CFC’s) are evacuated and collected from
appliances by a certified recycler. CFC’s are known to be detrimental to upper level
ozone and are prevented from being knowingly released into the atmosphere by federal
legislation. White goods are recycled for their metals content.
Lead Acid Batteries Lead acid batteries are prohibited from disposal in Georgia’s landfills. Therefore, similar
to white goods, these are accepted at a separate area at the landfill property for recycling.
When found in waste delivered to the tipping floor of the receiving building, they are
separated by workers and deposited at the battery recycling area. State law also requires
battery retailers to accept customers used batteries for recycling at point of transfer, i.e.,
sale.
Tires In 1990, Hall County implemented a ban on scrap tires entering the landfill.
Scrap tires, like all solid waste, come in a steady stream. Their waste generation is
estimated at one tire per person per year. In Hall County alone that amounts to over
150,000 tires per year.
Uncovered tires pose a fire hazard and provide habitat for rodents and insects. Covered,
whole tires tend to float to the surface of the landfill and recovering becomes necessary.
Grinding, shredding, chopping, or slitting will solve the floating problem.
In recent years, the state of Georgia has placed an emphasis on proper management of
scrap tires by cleaning up illegal tire piles and providing grant funding to local
governments for local enforcement and education programs. The proper handling of
scrap tires is now heavily regulated.
65
Waste Reduction
However, the funds and funding mechanism for this program have been placed in
jeopardy. The Georgia Legislature has failed to appropriate funds to the Solid Waste
Trust Fund, choosing instead to use them to balance the State budget. In addition, the
$1.00 per tire fee assessed at point of sale is set to sunset in 2005. It is important for all
local governments in Hall County to support continued funding for proper management
of scrap tires in Georgia. Past experience has shown that discontinuing funding will
result in a return of problems, such as illegal tire piles.
Hall County has developed educational materials with state grant monies detailing the
options for management of scrap tires in Hall County. Residents are urged to let their tire
retailer handle their used tires. The second option is to take them to the tire recycling
area at Hall County landfill. The county contracts with a tire recycler for proper
handling.
Used Motor Oil The 1993 plan recommended collecting and recycling the estimated 98,625 gallons of
DIY (do it yourself) used oil in 1992 and the projected 120,322 gallons of used oil by
2002. The method chosen was the placement of used oil collection containers at each
compactor site and the recycling center on Chestnut Street. As of 2004, there are total of
14 collection sites maintained by Hall County. Amounts collected ranged from 10,850
gallons in 1994 to 45,810 gallons in 2003 for an increase of 422 percent since the
program’s inception. The volume collected continues to grow each year.
Should Hall County move forward with conversion to curbside collection in selected
areas, the county should monitor any adverse impacts on volume of used oil collected.
Should the volume of used oil collected be adversely affected, the county should
investigate alternatives to recover the lost volume, including but not limited to, curbside
collection, new drop off locations in affected areas and private sector efforts. Curbside
recycling should be included in the recommended collection system analysis.
66
Waste Reduction
67
Alabama's longstanding and successful, Project R.O.S.E. (Recycled Oil Saves Energy),
provides several examples of metropolitan areas collecting used oil at the curb
with regular garbage pickup. These communities include Tuscaloosa, Huntsville, Athens,
and Decatur. Residents place used oil in a clear leak proof container, then leave it
alongside garbage containers at the curb. City sanitation workers transfer the used oil to a
holding tank at city facilities where it is picked up for recycling. Garbage trucks are
typically retrofitted with storage racks for this collection option.
According to a 1989 brochure from EPA, some other communities that were collecting
oil at the curb at the time include:
•Five cities in California •Minnesota Metropolitan area •Haddonfield, NJ •Mount Olive, NJ •Hamburg, NY •Cary, NC •Over 100 communities in Oregon •Columbia, MO
Regular or periodic curbside collection is certainly an option.
Household Hazardous Waste Hall County has developed a brochure on the topic of how to manage common household
chemicals such as paint, anti-freeze, gasoline, used motor oil and batteries. In keeping
with the national standard, paint appears to be the most common item in this category
among Hall County residents.
Both Gainesville and Hall County Solid Waste Divisions have noted that paints can be a
problem. Cans sometimes break in packer trucks or compactor containers, and may leak
out of moving trucks onto the public’s vehicles. Both indicate paint is not a big enough
concern to justify the cost of doing something else, however.
A collection program to handle paint and related products (stains, paint thinner, varnish,
etc.) had been investigated by the Hall County Resource Recovery Division and the
Waste Reduction
Environmental Management Committee of the Greater Hall Chamber of Commerce. It
was determined that the cost for one single day event could be on the order of $30,000.
A workable funding mechanism could not be found to host a conventional collection
event. See Disposal Element for additional discussion of handling of paints under
“Special Management Items”.
For now, the County provides recommendations for proper management of household
hazardous waste from a publication by the Pollution Prevention Assistance Division
entitled “Guide to Best Management Practices for Household Hazardous Waste and
Radon”.
Electronics Electronics products have gained some attention in recent years both due to the growth of
the personal computer and ancillary equipment market, and the rate at which the
technology becomes antiquated and the search for the next significant source of heavy
metals in the waste stream. Now that lead acid batteries have been banned from landfills
and enjoy a very high recycling rate and mercury use has been highly reduced in alkaline
batteries and fluorescent tubes, the focus has changed to electronics as the next major
source of heavy metals. Lead, mercury, cadmium and chromium comprise some of the
metals of concern found in electronics.
In the United States alone, 20 million or more PCs became obsolete each year, meaning
more than 315 million computers will have been disposed by 2004. Computers, TVs and
other electronic equipment account for 220 million tons of waste each year in the U.S., of
which more than 10% goes straight to landfills (a percentage quickly climbing). As
much as 80% of the PCs and other e-waste collected for recycling in the U.S. happens to
end up in Asia — where it may be unsafely disposed.
Along with Athens/Clarke and Rome/Floyd Counties, Hall County held a one-day
collection event on November 17, 2001 for recycling of PC’s, televisions and VCR’s.
The three jurisdictions were each granted $10,000 by the Georgia Department of
Community Affairs for the event as part of a pilot project to obtain experience in this new
68
Waste Reduction
area of recycling. Hall County had a total of 121 participants bring in an estimated
13,900 pounds of electronics for recycling at its one-day event. Based on the estimated
population of 139,000 at that time, the generation rate was 0.1 pounds per person.
Virtually all of the $10,000 was spent on advertising, operating supplies and contractor’s
fees required for the event. This information could be used as a rough guide for future
events.
Some states have enacted legislation banning disposal of certain electronics waste such as
computer monitors. Other states, such as Georgia, have established ad hoc committees to
investigate the issues and make management and/or legislative recommendations based
on their findings.
The National Electronics Product Stewardship Initiative (NEPSI) is a group coordinating
an agreement among governments, manufacturers and environmentalists on a nationwide
electronic-waste recycling program. Perhaps the biggest issue so far is how to pay for a
national recycling program. In March 2002, the group agreed in principle on the concept
of a "front-end" fee on PC users, i.e., an extra amount to finance its so-called "end-of-
life" costs. Some feel the upfront fee will be less a deterrent to recycling and safe disposal
than the current back-end charges (by most recyclers and manufacturers), which may act
as a disincentive.
While they don't disagree, representatives of the manufacturers are sensitive about the
amount of such a fee. Even adding $25 to $30 to the price tag of PC or other electronic
device could hurt sales or be unevenly applied by different importers, big-name brands or
other manufacturers. In the meantime, manufacturers may act to make a bigger
contribution by designing new products with lesser amounts of lead, mercury and other
toxic materials.
It is unclear how electronics will be managed in Georgia, as this is a developing and
changing issue both nationally and locally. It is enough at this point to monitor
69
Waste Reduction
developments and be open to the possibility of and opportunities for separating selected
electronics materials for recovery via reuse and recycling.
Organics and Yard Trimmings Management Composting is the natural decomposition of organic material by microbial activity under
aerobic conditions. It occurs naturally and unaided all the time in our natural world. It can
also be made to occur under controlled conditions as a means of waste reduction to
produce a usable product, in the form of a soil additive. The end product is a humus
material, which increases moisture retention in sandy soils and porosity in clay soils. This
material may have valuable agronomic uses. Studies have shown that compost may keep
plants free from root rot and other fungal diseases. Compost helps promote plant root
development, thus increasing a plant’s resistance to drought and wind stress. Waste
products in the composting process are heat, water and carbon dioxide. Volume reduction
ranges from 40 to 75 percent of original volume.
Factors affecting the compost decomposition rate are the carbon/nitrogen ratio, moisture
content, oxygen, and internal temperature. Carbon provides energy for the
microorganisms and is released into the atmosphere in the form of carbon dioxide. A
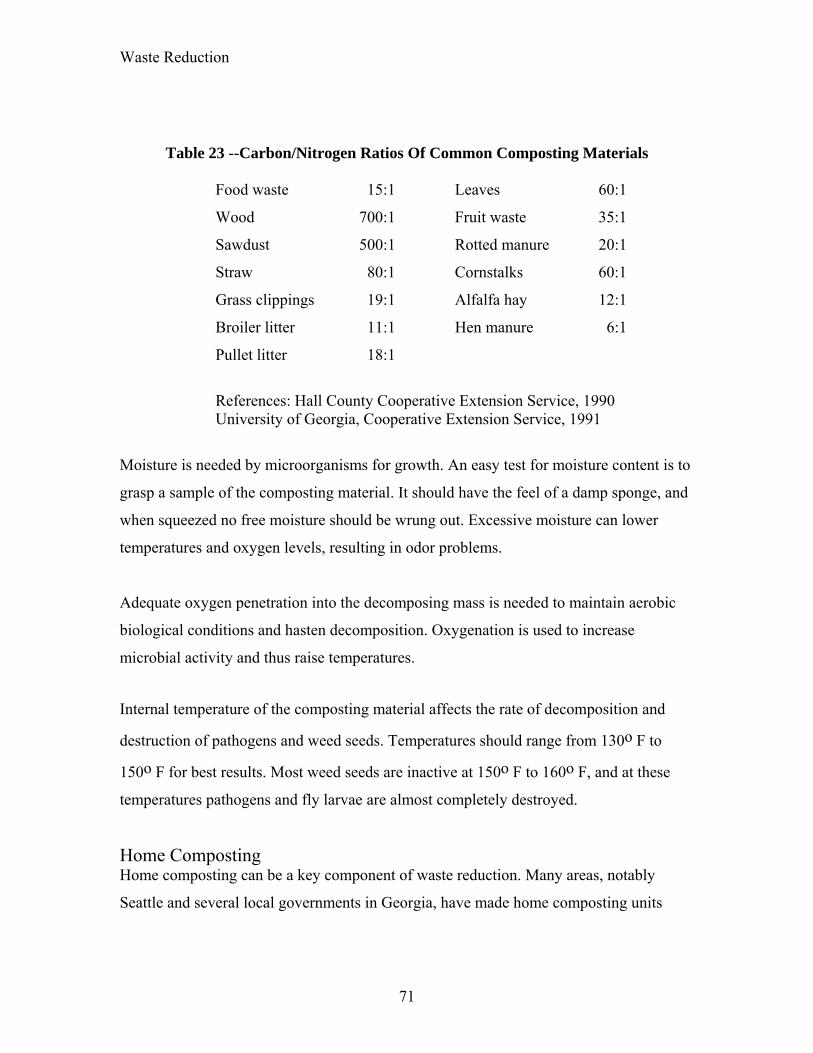
beginning carbon/nitrogen ratio of 25:1 to 30:1 is recommended. Table 23 illustrates
average carbon/nitrogen ratios for selected materials.
70
Waste Reduction
Table 23 --Carbon/Nitrogen Ratios Of Common Composting Materials Food waste 15:1 Leaves 60:1
Wood 700:1 Fruit waste 35:1
Sawdust 500:1 Rotted manure 20:1
Straw 80:1 Cornstalks 60:1
Grass clippings 19:1 Alfalfa hay 12:1
Broiler litter 11:1 Hen manure 6:1
Pullet litter 18:1
References: Hall County Cooperative Extension Service, 1990 University of Georgia, Cooperative Extension Service, 1991
Moisture is needed by microorganisms for growth. An easy test for moisture content is to
grasp a sample of the composting material. It should have the feel of a damp sponge, and
when squeezed no free moisture should be wrung out. Excessive moisture can lower
temperatures and oxygen levels, resulting in odor problems.
Adequate oxygen penetration into the decomposing mass is needed to maintain aerobic
biological conditions and hasten decomposition. Oxygenation is used to increase
microbial activity and thus raise temperatures.
Internal temperature of the composting material affects the rate of decomposition and
destruction of pathogens and weed seeds. Temperatures should range from 130o F to
150o F for best results. Most weed seeds are inactive at 150o F to 160o F, and at these
temperatures pathogens and fly larvae are almost completely destroyed.
Home Composting Home composting can be a key component of waste reduction. Many areas, notably
Seattle and several local governments in Georgia, have made home composting units
71
Waste Reduction
(bins and other enclosures) available to residents in a coordinated effort. Many vendors of
such units are more than willing to assist in this regard.
Home composting may also be done without the use of commercially made bins. In fact,
it can be done with no bin at all. However, a bin does help to maintain a neater
appearance, maintain a higher pile to generate higher internal temperatures and keep out
unwanted animals.
Preprocessing Many times, preprocessing of wastes in advance of composting is desirable. One of the
most common preprocessing methods is to chip wastes. A chipper may be used to chip
woody wastes such as small tree limbs and brush.
A tub grinder may be used to grind organic wastes such as brush, leaves, grass, pallets,
construction waste wood, and tree limbs. Tub grinders consist of a rotating tub into which
materials to be processed are loaded. Beneath the rotating tub is a high-speed
hammermill. Tub grinders may be useful in further size reducing pre-chipped wastes or
can handle a variety of unprocessed wastes.
A drawback to tub grinders is the tendency for the hammers to require frequent replacing
or resurfacing. This may be expensive in materials, labor and lost grinding time.
Materials such as leaves tend to cause rapid wear due to the relatively large amounts of
grit they contain. Tub grinders are also prone to damage by metal contaminants that may
be found in the waste.
High torque shredder/grinders may also be used to process yard wastes. Some grinders
use slowly rotating augers. These need to be resurfaced or replaced less frequently than
hammers in tub grinders. However, particle size may not be as uniform or small as that
produced by tub grinders.
72
Waste Reduction
The main goal of preprocessing is to reduce the size of the material being composted.
Size reducing the material has the benefit of increasing the surface area for microbes to
inhabit, thus increasing their populations and hastening the composting process.
Preprocessing can also serve to mix materials. Mixing is also beneficial in creating
uniformly favorable conditions throughout the composting mass.
Preprocessing may also be an end in itself if the material is to be used for mulching.
Medium and fine textured mulches are less likely to be blown by wind, becoming seated
on the landscape better than course materials. Mulches help conserve moisture, insulate
plants against temperature extremes and help control weeds. They also decompose and
add nutrients to the soil.
Markets Marketing of compost should be considered up front when planning a project. Local
government should have some involvement in marketing, even under a full-service
contract. A year should be allowed to develop a marketing program. Give-away programs
may help move compost, but to the extent possible, compost should be sold. If residents
pay for compost, they are more likely to see it as a valued product. Markets for compost
include landscaping (public and private) projects and horticultural uses. The agricultural
community represents a largely untapped market for compost. Horticultural and
agricultural interests are likely to have more stringent quality standards.
Like recycling, composting should not be looked upon as a money making proposition.
Experts recommend that for budgeting purposes, local governments project zero dollars
from the sale of compost. In Wesley Hills, MA, for example, efforts are made to sell the
4,000 to 5,000 tons of yard waste compost produced each year, but much of it goes to
community projects or is donated to various groups.
Municipal Composting As a municipal program, composting is most likely to be of the low-tech windrow
approach. Front-end loaders are commonly used to turn and aerate the composting
73

Waste Reduction
material. This material is most likely to be leaf and yard waste. Such waste tends to be
high carbon, low moisture material. It does not tend to attract vectors or cause
objectionable odors. High moisture, high nitrogen materials such as grass clippings can
cause objectionable odors if allowed to clump and become anaerobic. To avoid this, the
material must be preprocessed to ensure the clippings are evenly mixed with more
carbonaceous materials.
Central Yard Waste Composting Central yard waste composting is the composting of leaf and yard waste at a centralized
facility. It may be publicly or privately operated. It is likely to be a “low tech” approach,
commonly composted outside using windrows. It presents a low probability for odor
problems; however, care must be taken to break apart grass clumps to avoid these areas
becoming anaerobic. According to the Solid Waste Composting Council (SWCC), there
are approximately 1,400 central yard waste composting projects currently operating in the
U.S. Some have been in existence for over a decade. According to Franklin Associates,
on average more than half of total yard waste may be grass clippings. No central yard
waste composting is being practiced in the planning region. Yard wastes may be collected
for composting either loose or in some form of container at the curb. With container
collection, yard waste may be placed in paper or plastic bags or some type of rigid bin.
Such a collection method offers the advantage of using existing refuse equipment for
collection. A disadvantage is distribution of bags or bins to residents. Loose leaves can
also be collected using special equipment such as “pincer” type buckets attached to front-
end loaders or skid steer loaders. Vacuum machines can also be used.
In-Vessel Composting In-Vessel composting implies composting indoors using specially designed enclosures.
These enclosures may be of various types, such as rotating tubes or concrete stalls. This
method is likely to use forced aeration along with mechanical turning. In-vessel systems
offer greater control of the entire process since it is done in a closed environment free
from outside environmental fluctuations such as precipitation and temperature. Such
systems may also be more energy dependent, i.e., energy is required for forced aeration
74

Waste Reduction
and mechanical turning. The advantage is that these systems produce a finished compost
in the least amount of time. They also offer greater odor control by regulating oxygen
levels, moisture levels, and by using biofilters or other “scrubbers” to remove any
objectionable odors released to the environment. As of 2003, no in-vessel composting is
being done in the planning region.
Municipal Solid Waste (MSW) Composting Most facilities compost yard waste, but increasing numbers are focusing on MSW. In
general, these are higher technology facilities processing mixed MSW as their feedstock.
MSW composting may, of course, also be done on a home composting level.
There is considerable debate regarding source separation versus non-source separation
MSW composting. Some feel that not enough research has been done to definitely say
whether source separation or non-source separation has the least environmental impact
and the lowest total cost. Opponents of mixed MSW composting (sometimes called
“mass composting”) argue that such an approach circumvents the need for source
separation and preprocessing of compostable components. Supporters of mixed MSW
composting point toward the ability to compost the largest fraction of the 60 percent of
the waste stream that is compostable, and that it therefore offers the greatest diversion of
waste from landfills. Common arguments for and against mixed MSW composting are
summarized below:
For: 1. Source separation of compostables is unnecessary. 2. Avoiding separate collections results in cost savings. 3. Environmental impacts of separate collections are avoided. 4. Mixed MSW composting plants can recover recyclables. 5. Mixed MSW composting plants can produce marketable compost. 6. The largest fraction of MSW is composted and therefore offers the greatest waste diversion.
75
Waste Reduction
Against: 1. Recycling materials that can be recycled may be a higher use than composting them. 2. Our throwaway mentality will be reinforced since manufacturers and consumers might find generation of “compostable” discards acceptable. 3. Mixed MSW composting may produce an inconsistent product of questionable quality and limited marketability. 4. There is a question whether current technologies adequately remove non-compostables, recyclables, and hazardous components. 5. Source separation produces higher quality compost. 6. Mixed waste composting provides an easy solution that will weaken reduction and recycling efforts.
The usual approach with mixed MSW composting is to screen out the non-compostable
fraction, such as metals and plastics, at the back end. Both supporters and opponents
agree that the composting process benefits from front-end separation. Where they differ
is on the degree of separation. Table 24 shows data from an unpublished paper by
l’Hermite of concentrations of seven heavy metals in composts produced in Germany
from mixed MSW, from separate collection and from tree and shrub prunings and
agricultural wastes.
Mixed MSW composting systems that preprocess incoming wastes by mechanical
grinding or shredding should be avoided. Such systems offer the greatest risk of
contamination because contaminants may be liberated into the compost. Items such as
dry cell batteries and aerosol cans, if shredded, may provide an avenue of contamination.
It is not clear whether the analysis presented in Table 24 represents results from a system
that utilized shredding of incoming mixed MSW.
76
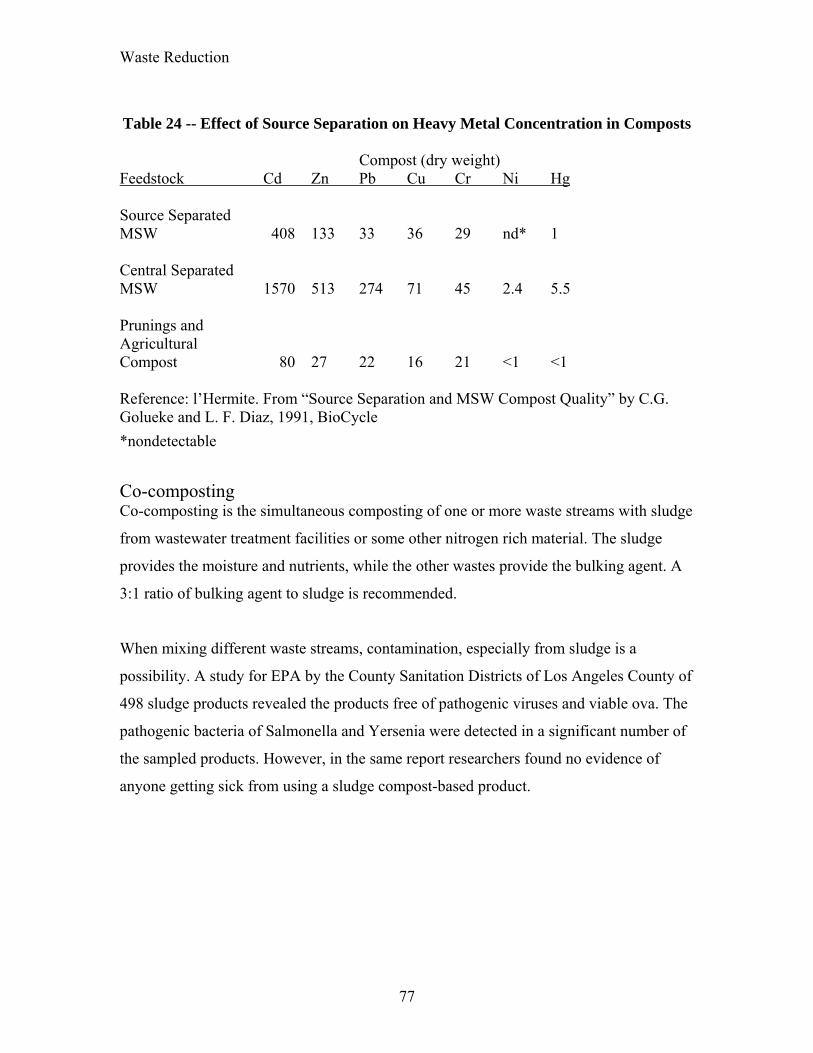
Waste Reduction
Table 24 -- Effect of Source Separation on Heavy Metal Concentration in Composts Compost (dry weight) Feedstock Cd Zn Pb Cu Cr Ni Hg Source Separated MSW 408 133 33 36 29 nd* 1 Central Separated MSW 1570 513 274 71 45 2.4 5.5 Prunings and Agricultural Compost 80 27 22 16 21 <1 <1 Reference: l’Hermite. From “Source Separation and MSW Compost Quality” by C.G. Golueke and L. F. Diaz, 1991, BioCycle *nondetectable
Co-composting Co-composting is the simultaneous composting of one or more waste streams with sludge
from wastewater treatment facilities or some other nitrogen rich material. The sludge
provides the moisture and nutrients, while the other wastes provide the bulking agent. A
3:1 ratio of bulking agent to sludge is recommended.
When mixing different waste streams, contamination, especially from sludge is a
possibility. A study for EPA by the County Sanitation Districts of Los Angeles County of
498 sludge products revealed the products free of pathogenic viruses and viable ova. The
pathogenic bacteria of Salmonella and Yersenia were detected in a significant number of
the sampled products. However, in the same report researchers found no evidence of
anyone getting sick from using a sludge compost-based product.
77
Waste Reduction
Organics or Yard Trimmings Management in Hall County
Clermont Clermont does not provide collection of yard waste to its residents. As a result, residents
must self manage. Local officials speculate that many residents burn yard trimmings in
the fall. There seem to be no feelings among residents to indicate burning as a problem.
Most homes are on one acre lots, as required by the Town. This may help to facilitate on-
site management. Most subdivisions don’t have a lot of trees to create leaves. Grass
clippings are not an issue locally.
Clermont should review its local ordinances to ensure it has a requirement that yard
trimmings not be placed in or mixed with municipal solid waste and should encourage
home composting.
Flowery Branch Flowery Branch provides weekly collection of yard trimmings on Monday. Mulch is
produced and made available to residents.
Gainesville Some passive composting is practiced by cities such as Gainesville that pile the leaves
collected at curbside to compost on their own. Yard trimmings are chipped when
possible. Both mulch and leaf compost are made available to residents free across the
street from the Sanitation office on Altavista Road. Much of the wood mulch is from the
streets department, as a result of right-of-way maintenance and trees across roads and
storm damage. Larger limbs and tree parts that are collected by the streets department are
deposited at Altavista for residents to get for firewood. What is left gets chipped by the
streets department. The yard trimmings collected by sanitation are materials put out at
curbside from yard maintenance and storm debris that comes down on resident’s
property. Gainesville participates in the annual Bring One for the Chipper program to
chip Christmas trees into useful mulch.
78

Waste Reduction
Gillsville Gillsville does not provide for collection of yard trimmings. Residents self manage.
Lula Yard trimmings are chipped by municipal staff at the curbside once per month. Mulch is
made available to residents.
Oakwood Limbs are chipped and mulch given back to residents. Oakwood has a mulch site near
the community building adjacent to the city park on Allen and Railroad Streets. Mulch is
made available to residents.
Hall County Home Composting In March of 1992, Hall County received a grant from the Department of Community
Affairs (DCA) to construct a home composting demonstration site, which was located at
Elachee Nature Science Center. The demonstration site has helped provide a useful
resource in helping to spread the word about home composting. There is a strong
association between home composting and gardening. As a result, it is likely to be much
more prevalent in rural areas.
Mulching Hall County participates in the annual Bring One for the Chipper program to chip
Christmas trees into useful mulch. Hall County has chippers used in right of way
clearing and maintenance. The mulch is provided free to area residents. Hall County
could review the need of offering periodic grinding of yard trimmings as a service to
residents and as an alternative to disposal.
Composting Composting has been studied and promoted by the Chestatee-Chattahoochee Resource
Conservation and Development Council, Inc., using funding from federal, state and local
79

Waste Reduction
sources. The focus has been the evaluation and demonstration of on-farm composting of
poultry litter and dead birds.
Guidelines have been developed for composting dead birds as an alternative to pit
disposal. It can also provide poultry producers an alternative method of utilizing large
quantities of poultry manure.
The use of poultry manure as a nutrient source can be used to enhance the composting
process. It increases pH, decreases the C/N ratio and increases bulk density. Bulk density
is an indicator of the degree of decomposition, as it reflects the decrease in particle size.
Table 25 illustrates the results of a study conducted in Alachua County, FL. The study
showed that higher temperatures were maintained for a longer time when poultry manure
was added to yard waste.
Table 25 -- Properties of Co-Composted Yard Waste and Poultry Manure after
Composting for 16 Weeks and Curing for 3 months
Bulk Density Treatment* pH C/N g/cm3
9:1 6.7 1:28 0.25 10:0 6.4 1:41 0.21 3:1 7.2 1:24 0.34
*9:1 = 9 parts yard waste and 1 part poultry manure (volume basis typical for each) Reference: Alachua County, Florida, 1991
The use of poultry manure can carry with it certain management problems such as flies
and odors. Odor problems can be controlled by not storing poultry manure at the site and
incorporating it into the yard waste as soon as it arrives. Frequent turnings of twice per
week also help. The Florida study showed flies to be a problem at the 25 percent level of
poultry manure; however, fly larvae were never present when 10 percent poultry manure
was used.
80
Waste Reduction
As called for in the County’s Comprehensive Solid Waste Management Plan, in July
1997, Hall County embarked on a grant-funded project to combine waxed coated
corrugated cardboard (WCC) and broiler litter into a composting project. The previous
solid waste plan had identified sources of wax coated corrugated cardboard as primarily
from poultry processing, the county’s largest employer. Prior to beginning this project, a
small pilot project was conducted. It was found that the coated cardboard and poultry
waste provided a mixture feasible for composting. A work group of the Comprehensive
Solid Waste Management Plan Implementation Committee was formed to oversee the
planning and implementation of this project. The workgroup included representatives
from the poultry industry, as well as local governments and UGA.
Leading up to the project, the work group looked into various options for dealing with
wax coated corrugated cardboard boxes. Options considered included recycling, energy
recovery (incineration) and composting. Composting was felt to be the best option, as it
offered a measure of local control.
Once this option was decided upon, a pilot study was conducted. UGA was enlisted to
conduct laboratory testing of various mixtures. WCC was shredded and mixed with
poultry manure to speed the composting process.
A field study was also conducted involving the setting out of shredded WCC/poultry
manure in a row about 4 feet high by 16 feet wide by 300 feet long. A contractor was
hired to compost the material. The pilot proved the feasibility of producing finished
compost in about 3 months. The finished compost was tested in a laboratory and found
to be of very good quality.
The selected site for the full-scale project was the Allen Creek Landfill, which at that
time had been closed for nearly two years. The site opened on May 10, 1999. In addition
to WCC, yard trimmings were also accepted at the site and turned into useful wood
mulch. Hours of operation were Monday through Saturday 8 a.m. to 4 p.m.
81

Waste Reduction
A horizontally fed grinder with a 200 horsepower industrial diesel engine was purchased
for use on the project. Unfortunately, due to unforeseen technical problems involving
equipment and site limitations, the project was discontinued in September 1999.
Lessons learned: 1. A differential of five dollars is enough to provide generators of WCC (wax coated corrugated) incentive to separate and bring the material to a recovery facility. 2. People will pay $5 per ton for wood mulch. 3. There was a good balance between wood waste coming in and mulch going out. 4. The grinder was not adequate to keep up with demand. 5. The grinding of WCC produced a lot of airborne dust (paper fibers) that clogged the radiator and air filter on the grinder. 6. The toughness of the WCC and airborne dust interacted to cause overheating of the grinder’s engine unless closely monitored. 7. The roughly 3.5 acre site was not large enough for the project. 8. Applying gravel to the composting pad was a mistake, as it became incorporated into the compost with turning.
Waste Reduction in Times of Disasters For discussion of waste reduction in times of disasters see “Solid Waste Management In
Times of Disasters” within the Education and Public Involvement Element.
Needs/Goals
Adequacy of Waste Reduction Program While the waste sources that contribute waste to the county landfill have definitely
changed from the 1993 plan, going from heavily weighted to commercial/industrial
(85%) to weighted towards residential (53%) in 2003, Table 5 shows that overall, the
residential portion still remains at approximately 15%. If the goal were to be reduction in
the amount of waste disposed at the county landfill, in order to extend its life, one might
concentrate more on residential waste reduction activities. However, if the goal were to
be working toward achieving the State’s reduction goal, as was the case with the 1993
plan, concentration solely on residential programs will not achieve the State’s 25% per
capita waste disposal reduction goal.
82

Waste Reduction
83
State’s Per Capita Waste Disposal Reduction Goal The Commissioner of the Georgia Department of Community Affairs in 1997 asked the
State Attorney General for an opinion as to whether the State’s waste reduction goal,
which was based on the date of July 1, 1996, was still in effect. The Attorney General’s
Office issued the following official opinion on July 11, 1997:
“Therefore, it is my official opinion that the essential intent of Code Subsection 12-8-21(c) is the reduction of solid waste by 25 percent. This goal remains effective in applying related requirements of the ‘Georgia Comprehensive Solid Waste Management Act,’ notwithstanding that the goal was originally expressed in terms of a calendar date which has passed. Jurisdictions which met the goal should continue the process of maintaining it; jurisdictions which did not meet the goal should continue the effort to reach it.”
The date was ruled to be part of the goal but not the end of it. The Subsection that sets
this goal is a part of the "Georgia Comprehensive Solid Waste Management Act".
The state’s waste reduction goal plays a part in several requirements of the Act. These
include:
1. Each city and county must have a program in its solid waste management plan for meeting the goal;
2. No permit, grant or loan may be issued for a municipal solid waste disposal facility unless the host jurisdiction and other jurisdictions which will contribute waste are actively involved in and have a strategy for meeting the goal;
3. Permits for solid waste handling and for solid waste handling facilities are similarly conditioned; and
4. Local jurisdictions and the Department of Community Affairs are required to report on progress toward meeting the goal.
Table 16 shows the current estimated per capita generation rate at 8.79 lbs/person/day.
The base year 1992 per capita waste generation was an estimated 6.41. To achieve the
25% reduction from the recognized base year or a decrease to 4.8 lbs/person/day would
take a total reduction of nearly 4 lbs. or a 45% reduction from the current generation rate.
It is believed that the base year waste generation rate may be flawed is as much as the
data on out of county waste exports was lacking or its existence unknown during

Waste Reduction
development of the initial plan, and scales were not in place at all disposal facilities
during all of the base year.
That being said, the reduction goal established by the state is a statewide goal to be
measured and achieved on a statewide basis. Therefore, focusing on transferring this to a
countywide basis is not what the Act requires. So long as the planning area has a
meaningful reduction strategy in effect and is actively engaged in implementing it, the
requirement is being met. The reduction measures outlined herein should be adequate to
meet that goal.
Reduction Activity Summary Previous to March 1992, Hall County Government contracted with private firms for
recycling collection and/ or processing. In some instances, the County hauled recyclables
(newspaper) to private processing facilities. This changed on March 6, 1992 when the
County took on collection, processing, and marketing of all recyclables. From late July
1991 to March 6, 1992, Hall County contracted with Sonlight Recycling and Recovery
for recycling services.
Other considerable reduction efforts are ongoing among area businesses and scrap metal
dealers. These are, however, difficult to document since they are not government
programs, and wastes they process may be imported from outside the planning area.
Tables 26 through 30 summarize reduction efforts from inception to 2003.
Table 26
Hall County Recycling Statistics for March 1989 to June 1989
Commodity Tons Recovered % of Total Newspaper 204.47 100 TOTAL 204.47 100
84
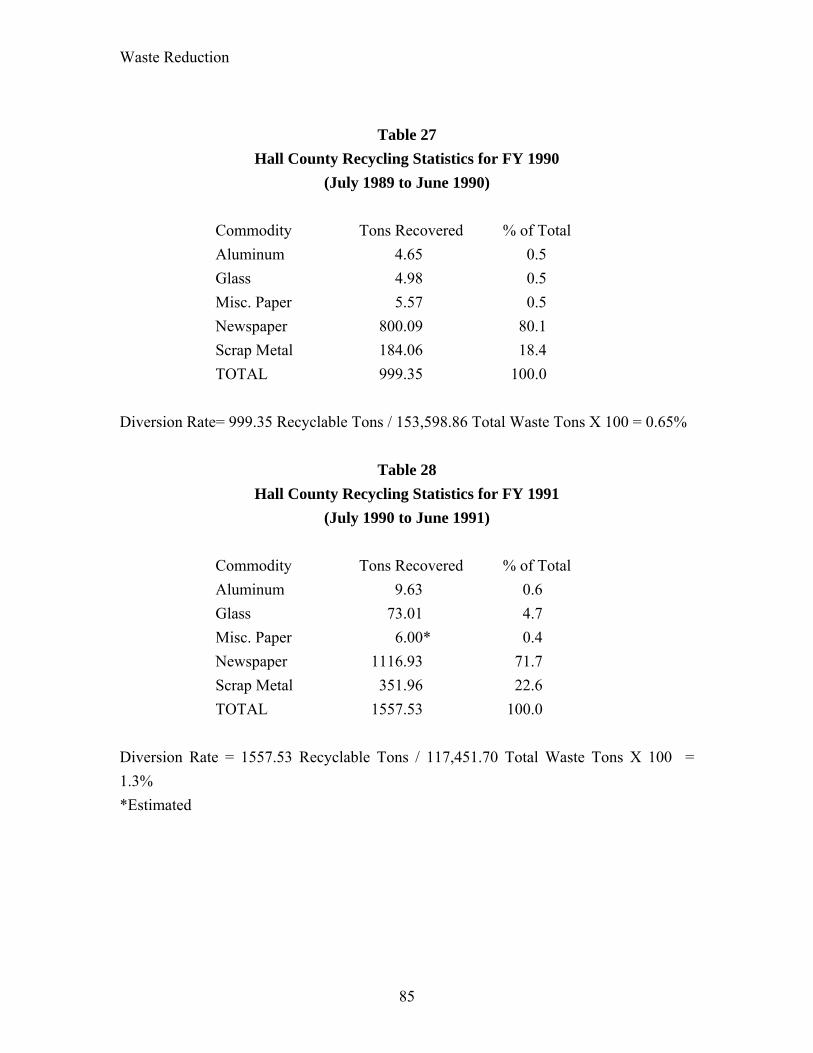
Waste Reduction
Table 27
Hall County Recycling Statistics for FY 1990 (July 1989 to June 1990)
Commodity Tons Recovered % of Total Aluminum 4.65 0.5 Glass 4.98 0.5 Misc. Paper 5.57 0.5 Newspaper 800.09 80.1 Scrap Metal 184.06 18.4 TOTAL 999.35 100.0 Diversion Rate= 999.35 Recyclable Tons / 153,598.86 Total Waste Tons X 100 = 0.65%
Table 28 Hall County Recycling Statistics for FY 1991
(July 1990 to June 1991) Commodity Tons Recovered % of Total Aluminum 9.63 0.6 Glass 73.01 4.7 Misc. Paper 6.00* 0.4 Newspaper 1116.93 71.7 Scrap Metal 351.96 22.6 TOTAL 1557.53 100.0 Diversion Rate = 1557.53 Recyclable Tons / 117,451.70 Total Waste Tons X 100 = 1.3% *Estimated
85

Waste Reduction
Table 29 Hall County Recycling Statistics for FY 1992
(July 1991 to June 1992)
Commodity Tons Recovered % of Total Aluminum 25.00* 0.8 Corrugated Cardboard 42.63 1.4 Glass 305.00* 10.2 Misc. Paper 10.00* 0.3 Newspaper 1,209.80 40.4 Plastics 50.00* 1.7 Scrap Metals 354.05 11.8 Waste Tires 1,000.00 33.4 TOTAL 2,996.48 100.0 Diversion Rate = 2,996.48 Recyclable Tons / 116,272.73 Total Waste Tons X 100 = 2.6% *Includes some estimated weights due to incomplete record keeping during transition
from contracted, privately provided service to publicly provided service.
Table 30 shows an apparent disparity in growth rates between the increase in waste tons
and recyclable tons collected from Hall County compactor sites. Assuming the rate of
recycling among county residents were to remain more or less constant, the rates of
growth should track more consistently. However, the data show this not to be the case.
There must be factors at play that create this phenomenon.
As explained in the Collection Element, the rate of overall recycling at compactors has
lagged behind the growth in waste disposal. The impact of a full compactor is negligible
to the waste disposal customer. However, the same cannot be said about the impact a full
recycling bin has on a customer who has made the extra effort to recycle. The impact is
one of definite negative reinforcement. The result of such negative reinforcement may be
the cessation of recycling in the affected household. By comparison, even if the
compactor is full, the customer disposing of waste is instructed to leave the trash bag(s)
86

Waste Reduction
on the ground near the compactor unit. Since the customer was able to achieve the
desired end result of getting rid of their trash, there is no negative reinforcement and,
consequently, no impact on their future use of the compactor sites for waste disposal.
Further reinforcement of this view is provided by comparing growth in tons of trash and
growth in tons of recyclables (see Table 30).
Recommendation The constraints that are currently placed on the collection of recycling roll offs by
adhering to a set collection schedule has a tendency to act as an arbitrary limit on growth.
If Hall County desires to increase its recycling rate and offer improved customer service
to residents participating in recycling, collection frequency of recycling roll offs should
be increased by changing from collection as determined by a set schedule to collection on
an as needed basis.
Table 30 --Comparison Of Waste Tons And Recyclable Tons From Compactor Sites
Year Waste Tons Recycling Tons(1) OCC Total Recyclables
1995 14,914 2,238 524 2,762 1996 15,930 2,316 565 2,881 1997 18,837 2,405 627 3,032 1998 19,762 2,459 687 3,146 1999 20,942 2,49 754 3,251 2000 23,161 2,640 782 3,422 2001 24,730 2,461 1,403 3,863 2002 25,720 2,453 1,238 3,692 2003 27,145 2,468 1,179 3,647
(1) Excludes corrugated cardboard
Corrugated cardboard was excluded from Table 30 to isolate the comparison to those
recyclables collected in roll off containers with waste collection.
Targeted Reduction Activities In order to be effective at reducing the overall waste generation rate, as discussed
previously, it will still be important to promote and assist with waste reduction in the
87

Waste Reduction
commercial/industrial sectors, as well as construction and demolition wastes, which are
likely due, in large measure, to commercial activity (construction and demolition
contractors). While it is true that many in the business community, especially
manufacturers, have made great strides in reducing their waste output, the data in Table 5
show there is apparently much work in this area left to do. Even though waste reduction
strategies should target these areas, reduction that can be realized in the residential sector
should not be ignored, especially if they can be obtained relatively quickly and easily.
Residential waste reduction will result in life extension to the county landfill, which is
now weighted toward residential waste.
Needs/Goals Summary Possible strategies for obtaining increased waste reduction in the targeted commercial
and industrial sectors could include:
1. Greater presence of EnviroShare program 2. Cooperative marketing of recyclable materials, within EnviroShare program. 3. Partnering with others offering reduction assistance to the target sectors.
P2AD, GA Tech, UGA, others.
4. Increased education on advantages of waste reduction on improved competitiveness.
5. Increased aggressiveness in waste reduction targeted to businesses. This could
take the form of collection of corrugated cardboard, and possibly other
materials, provided by Resource Recovery Division. Rome/Floyd and
Athens/Clarke have done this. Service could be provided to those businesses
that are not currently being serviced by private sector recyclers, so as not to be
seen as competing with the private sector. Former County Commissions have
established such a policy. It is not known whether the County Commission
still holds to this policy. Many businesses are not recycling key, easily
recycled materials such as corrugated cardboard, perhaps due to their being
too small to recycle via the private sector or due to lack of storage space to
88
Waste Reduction
store material for a week or more at a time. A public sector effort might be
able fill a need.
Possible strategies for obtaining increased reduction of residential waste for Hall County and its municipalities could include:
1. Increased education. There are concerns regarding waste reduction progress
due to cultural differences and communications challenges when addressing
the Hispanic community. This is especially the case for Gainesville, which
has a large Hispanic population.
2. Providing residents with recycling and/or composting bins
3. PAYT/curbside recycling. PAYT and curbside recycling should be included in
the recommended collection system analysis.
4. Increased aggressiveness in waste reduction targeting residents.
This could be done by offering to buy (commonly referred to as “buy back”)
certain materials that are accepted at the Hall County Recycling Center. This
has been done by Rome Floyd and Gwinnett County. Buy back could be
limited to materials that are not already being sought by private recyclers in
Hall, in order to avoid competing with the private sector, if that were a
concern.
5. Increase collection frequency of recycling roll offs by changing from collection
as determined by a set schedule to collection on an as needed basis.
Additional Needs/Goals
1. Drop and swaps are one-day events that can be offered for the purpose of
reusing items such as paints and furniture. Such programs have been
successful in other areas. The same could also be done with household
hazardous wastes on a more limited basis. Drop and Swaps could be
advertised via local media resources (see Education Element) and conducted
89
Waste Reduction
one Saturday in the spring and one in the fall by Resource Recovery and Keep
Hall Beautiful. Based on response, the program could be offered more often.
2. Require private haulers to offer recycling service to their customers. Explore
options for enforcing this requirement, such as through business licensing.
Meet with private haulers as issues affecting them arise. Private haulers could
be required to offer recycling service to their customers. An ordinance
requiring that haulers comply must be passed by the County and all
municipalities. The ordinance could be enforced by requiring compliance in
order to receive a business license.
3. Continue and expand the drop off programs at county compactor sites. Add
opportunities for recycling of other materials as feasible.
4. Provide used oil collection in municipalities for use by residents. Drop off
areas should be located such that municipal personnel can supervise the
facility. The alternative of requiring businesses who sell motor oil to
participate with local governments in the program seems to compliment the
activities of other types of businesses in working toward the goal of reuse,
reduce or recycle. Businesses need to be involved to the point of having a
significant role and commitment to the program. Experience has shown in
many cases that the business leaders will accept the responsibility for
protecting the environment and in many cases can provide meaningful input
to local governments in developing programs. A public/private partnership for
DIY used oil recycling should be considered as the alternative that should be
implemented by Hall County municipalities.
Each municipality offering solid waste collection would provide a location for DIY used oil to be collected. The location for a collection container and the container, including maintenance around the site and quality control, would be provided by the municipality. Hall County would provide collection containers at the 13 compactor sites located throughout the county for
90

Waste Reduction
residents in the unincorporated areas and offer to include all municipal collection containers in a contract with a used oil recycler. Municipalities would participate in the cost/revenues of the county contract with a used oil hauler.
A committee of retail business managers who sell motor oil would be
appointed by elected officials to develop a program for offering recycling
opportunities to include incentives and an educational program.
5. Review the need of upgrades to Hall County Recycling Center at 1008
Chestnut Street to accommodate additional volume. The services of a
design firm familiar with layout of facilities for sorting commingled
recyclables should be enlisted in the design of sorting lines or other
improvements.
6. Explore the feasibility of alternatives to wax coated corrugated cardboard that
contributes toward waste reduction. As part of the EnviroShare program,
packaging alternatives to coated corrugated cardboard would be explored.
7. Encourage home composting via implementation of home composting bin
distribution program and utilization of the regional demonstration site at
Elachee Nature Science Center. Low cost or free home composting bins are
available in the form of surplus and discarded pallets. Hall County and
municipalities would be encouraged to distribute bins.
8. Hall County should review the need of offering periodic grinding of yard
trimmings as a service to residents and as an alternative to disposal. Research
via surveys and other methods could be pursued to determine if sufficient
need and interest exists.
9. Examine requiring building codes for including recycling considerations into
new building design. New buildings (office buildings, apartment complexes,
91

Waste Reduction
etc) could be required to include design considerations for recycling.
Considerations would include adequate areas for storage of recyclables.
Ordinances should be passed by the county and all municipalities to include
these requirements in building codes for applicable buildings.
92
Waste Reduction
Sources Consulted: A Comparative Analysis of Applied Recycling Collection Methods in Saint Paul.
Retrieved April 20, from http://www.eurekarecycling.org/inf_studies.cfm Ballard, John B., Jr. (1997). Official Opinion 97-23. Retrieved May 20, 2004, from
Georgia Department of Law, Office of the Attorney General of Georgia Web site: http://ganet.org/ago/read.cgi?searchval=solid%20waste%20reduction%20goal&openval=97-23
Bergin, Dennis. personal interview. August 22, 2003. Chestatee-Chattahoochee Resource Conservation and Development Council, Inc. (1991)
Composting: Nature’s Recycling Process. Gainesville, GA: Author. Doss, Patti. personal interview. August 22, 2003. Enbysk, Monte. Don’t Dump Your PC’s in a Dump. Retrieved April 26, 2004, from
http://www.bcentral.com/articles/enbysk/157.asp
Farmer, Larry. personal interview. January 9, 2004. Frequently Asked Questions About Single Stream Recycling In Wisconsin. Retrieved
April 19, 2004, from Wisconsin Department of Natural Resources, Bureau of Waste Management Web site: http://www.dnr.state.wi.us/org/aw/wm/recycle/issues/singlestream.pdf
Goldsmith, Abby. personal interview. January 9, 2004 Hall County Resource Recovery Division. (1995). Hall County Recycling Participation
Survey and Residential Waste Stream Analysis. Gainesville, GA: Author. Institute for Local Self Reliance. (1990). Beyond 40 Percent: Record Setting Recycling
and Composting Programs. Washington, DC: Author. Institute for Solid Wastes. (1990). Designing and Implementing A Recycling Program.
Chicago, IL: Author. Junior League of Portland, ME, Inc. (1991). WasteCap. (Available from Junior League of
Portland, Inc., 618 Congress Street, Portland, ME 04104).
93
Waste Reduction
Martin, Stanley. personal interview. August 18, 2003. Materials and Waste Exchanges. Retrieved April 30, 2004, from U.S. Environmental
Protection Agency, Jobs Through Recycling Website: http://www.epa.gov/jtr/comm/exchange.htm
McCauley, Jimmy. personal interview. August 22, 2003. McLaurin, W. & Wade, G. (1991). Composting and Mulching: A Guide to Managing
Organic Landscape Refuse (Circular 816). Athens, GA: University of Georgia College of Agricultural and Environmental Services, Cooperative Extension Service.
Owen, Danny. personal interview. August 20, 2003. P2AD Partnership Program. Retrieved May 20, 2004, from Georgia Pollution
Prevention Assistance Division Web site: http://www.p2ad.org/ppl.html. Poole, Larry. personal interview. September 5, 2003. Recycling News. Retrieved April 30, 2004, from Wisconsin Department of Natural
Resources, Bureau of Waste Management Web site: http://www.dnr.state.wi.us/org/aw/wm/publications/recycle/news/fall03.pdf
Rhode Island Source Reduction Task Force. (1987). Source Reduction Task Force
Report. Providence, RI: Author. Turner, Milton. personal interview. September 23, 2003. Winters, B. & Donohue, C. (1990). Paint Drop and Swap: Guidelines for Conducting
Events. Waterbury, VT: Vermont Agency of Natural Resources. Zimmerman, Z. (1988). Solid Waste Management Alternatives: Review of Policy Options
to Encourage Waste Reduction. Springfield, IL: Illinois Department of Energy and Natural Resources.
94