Source: Note - Russell Sage Foundationfigures.pdfPerspective code: CA = classical ... EA = ethnic...
49
Table 2.1 Cross-Generational Mobility and Third-Generation Gap Relative to Non-Hispanic White Attainment, as Implied by Eight Theoretical Approaches to Integration Assimilation-Based Pluralist-Based Pattern of Mobility a (1) (2) (3) (4) (5) (6) (7) (8) MC b PII c CA EA ED R SA WCD S C S C 1 C 2 Generation 1.5 + + 0 0 0 0 + 0 + 0 + Generation 2.0 ++ ++ + + + + ++ 0 ++ + 0 Generation 3.0 +++ +++ ++ + ++ + or ++ +++ 0 +++ 0 + Gap between generation 3.0 and majority 0 0 to + − − − − − or − − 0 − − 0 − − − Source: Authors’ compilations. Note: Mobility key: 0 = no mobility; “+” = slight mobility; “++” = moderate mobility; “+++” = considerable mobility; “−” = some deficit; “− −” = considerable deficit. Perspective code: CA = classical assimilation; EA = ethnic advantage; ED = ethnic disadvantage; R = racialization; SA = segmented assimilation; WCD = working-class delay; MC = multicultural; PII = postindustrial individualistic; S = structural; C = cultural. a Generation 1.0 is the reference category. b This approach implies a distinctive sociocultural profile between the mainstream and immigrant groups. c This approach implies a distinctive sociocultural profile between groups and among individuals within groups, heuristically represented as two group sociocultural profiles distinctive relative to each other and a majority group.
Transcript of Source: Note - Russell Sage Foundationfigures.pdfPerspective code: CA = classical ... EA = ethnic...

Table 2.1 Cross-Generational Mobility and Third-Generation Gap Relative to Non-Hispanic White Attainment, as Implied by Eight Theoretical Approaches to Integration
Assimilation-Based Pluralist-Based
Pattern of Mobilitya
(1) (2) (3) (4) (5) (6) (7) (8)
MCb PIIc
CA EA ED R SA WCD S C S C 1 C 2
Generation 1.5 + + 0 0 0 0 + 0 + 0 +Generation 2.0 ++ ++ + + + + ++ 0 ++ + 0Generation 3.0 +++ +++ ++ + ++ + or ++ +++ 0 +++ 0 +
Gap between generation 3.0 and majority
0 0 to + − − − − − or − − 0 − − 0 − − −
Source: Authors’ compilations.Note: Mobility key: 0 = no mobility; “+” = slight mobility; “++” = moderate mobility; “+++” = considerable mobility; “−” = some deficit; “− −” = considerable deficit. Perspective code: CA = classical assimilation; EA = ethnic advantage; ED = ethnic disadvantage; R = racialization; SA = segmented assimilation; WCD = working-class delay; MC = multicultural; PII = postindustrial individualistic; S = structural; C = cultural.aGeneration 1.0 is the reference category.bThis approach implies a distinctive sociocultural profile between the mainstream and immigrant groups.cThis approach implies a distinctive sociocultural profile between groups and among individuals within groups, heuristically represented as two group sociocultural profiles distinctive relative to each other and a majority group.

42 Parents Without Papers
and cultural dimensions, one cultural dimension in the case of the multi-cultural approach and two in the case of the postindustrial-individualistic approach (although the latter perspective would be expected to show as many “dimensions” as aspects examined).
It is important to note that pluralist-based theoretical approaches to integration do not preclude the possibility of assimilation or other pat-terns of cross-generation integration occurring with respect to structural aspects of integration. This is why we show such a pattern for them in table 2.1. However, pluralist-based approaches (unlike assimilation-based approaches) emphasize that either group-based sociocultural dimensions will be distinctive and important (that is, the multicultural perspective) or individual-based ones (for example, the postindustrial-individualistic perspective) will be. Membership-exclusion dynamics are particularly likely to apply to the economic, spatial, and perhaps linguistic dimen-sions of incorporation but not necessarily to sociocultural facets, for the reasons noted earlier. Immigrants incurring membership exclusion may show mobility on sociocultural facets of integration because of their aspi-rations to belong to the receiving society, although the perspective also implies that there will be individual variation in these. Thus the perspec-tive would not expect correlations across individuals in aspects of socio-cultural integration (that is, someone high on secularism might not be weak on ethnic identity), even though the group as a whole would be expected to show cross-generational variation in such aspects (that is,
Table 2.2 Cross-Generational Mobility and Third-Generation Gap Relative to Non-Hispanic White Attainment, as Implied by the Membership-Exclusion Theoretical Approach
Membership Exclusionb
Pattern of Mobilitya Structural Cultural 1 Cultural 2 Cultural 3
Generation 1.5 + 0 + 0Generation 2.0 + + 0 0Generation 3.0 +++ 0 + 0
Gap between generation 3.0 and the majority
0, − − − − −
Source: Authors’ compilations.Note: Mobility key: 0 = no mobility; “+” = slight mobility; “++” = moderate mobility; “+++” = considerable mobility; “−” = some deficit; “− −” = considerable deficit.aAs implied by the membership exclusion theoretical approach to integration. Generation 1.0 is the reference group.bThe cultural approach implies distinctive sociocultural profiles both between groups and among individuals within groups, here heuristically represented as three sociocultural profiles that are distinctive relative to each other and to that of a hypothetical majority group.

62 Parents Without Papers
substantially understate percentage advancements in schooling. We deal with this problem in the present research by examining third-only- generation groups for males and females separately.
What accounts for the distortion? Recent research suggests it results mostly from selective attrition. Errors in defining the Mexican-origin group become more numerous the more generations are included since immigration. Any sampling frame that depends on ethnic self-identification for inclusion in the sample misses those people who no longer identify as either Hispanic or Mexican. This is particularly true for people with only one or two Mexican-born grandparents. For example, nearly 30 percent of the third-generation children of Mexican-origin parents are not identified as Mexican under the Hispanic question in the Current Population Survey.67 In a separate study of U.S. censuses from 1980 to 2000, Richard Alba and Tariqul Islam also find substantial apparent attrition from the Mexican-origin group.68 Moreover, those who no longer identify as Mexican appear to be highly selected among those whose parents have out-married. Not only is out-marriage fairly com-monplace among Mexican Americans, but it occurs more often among the more highly educated.69 Selective attrition thus produces substantial downward bias in measures of socioeconomic attainment in samples selected on the basis of ethnic self-identification.
Making the Reference Group Comparable
A final issue to consider involves making the reference group (the one being compared with an immigrant generational group for purposes of gauging the degree of incorporation) comparable to the immigrant group in terms of differences in other factors that could affect the education levels of the two groups. In national-level studies, this can be achieved through multivariate analyses employing appropriate controls if the study includes measures of all relevant factors that matter. In other instances, this may be more difficult. For example, because their economies involve
Table 3.1 Average Years-of-Schooling Deficits for Third-Plus and Third-Only Measures of Generation, Males and Females of Mexican Origin, Aged Twenty to Forty, Los Angeles, 2004
Generation Measure
Gender Third Plus Third Only Deficit
Males 13.1 13.5 -0.4Females 13.4 13.8 -0.4
Source: Data from Immigration and Intergenerational Mobility in Metropolitan Los Angeles (see Bean, Leach et al. 2011).
72 Parents Without Papers
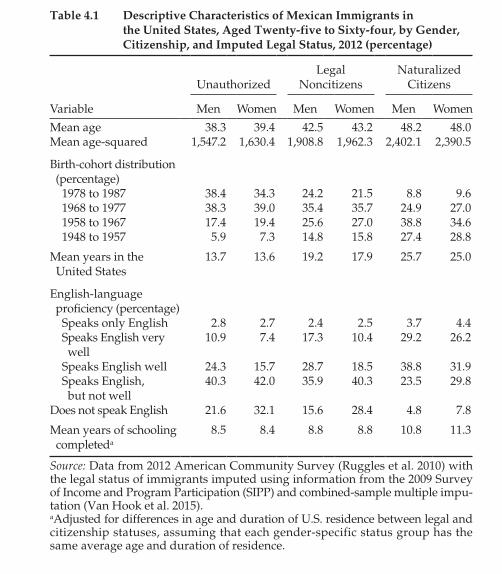
in turn, show a mean age approximately five years younger than natu-ralized Mexican immigrants. Unauthorized Mexican immigrants also report fewer years in the United States relative to legal noncitizens and naturalized citizens. Both unauthorized men and women average nearly fourteen years of U.S. residence, compared with about nineteen and eigh-teen years of residence among LPR men and women, respectively. As one would expect, Mexican immigrants who have obtained U.S. citizenship have been in the country the longest, averaging twenty-six years among naturalized males and twenty-five among naturalized females.
Table 4.1 Descriptive Characteristics of Mexican Immigrants in the United States, Aged Twenty-five to Sixty-four, by Gender, Citizenship, and Imputed Legal Status, 2012 (percentage)
UnauthorizedLegal
NoncitizensNaturalized
Citizens
Variable Men Women Men Women Men Women
Mean age 38.3 39.4 42.5 43.2 48.2 48.0Mean age-squared 1,547.2 1,630.4 1,908.8 1,962.3 2,402.1 2,390.5
Birth-cohort distribution (percentage) 1978 to 1987 38.4 34.3 24.2 21.5 8.8 9.6 1968 to 1977 38.3 39.0 35.4 35.7 24.9 27.0 1958 to 1967 17.4 19.4 25.6 27.0 38.8 34.6 1948 to 1957 5.9 7.3 14.8 15.8 27.4 28.8
Mean years in the United States
13.7 13.6 19.2 17.9 25.7 25.0
English-language proficiency (percentage) Speaks only English 2.8 2.7 2.4 2.5 3.7 4.4 Speaks English very well
10.9 7.4 17.3 10.4 29.2 26.2
Speaks English well 24.3 15.7 28.7 18.5 38.8 31.9 Speaks English, but not well
40.3 42.0 35.9 40.3 23.5 29.8
Does not speak English 21.6 32.1 15.6 28.4 4.8 7.8
Mean years of schooling completeda
8.5 8.4 8.8 8.8 10.8 11.3
Source: Data from 2012 American Community Survey (Ruggles et al. 2010) with the legal status of immigrants imputed using information from the 2009 Survey of Income and Program Participation (SIPP) and combined-sample multiple impu-tation (Van Hook et al. 2015).aAdjusted for differences in age and duration of U.S. residence between legal and citizenship statuses, assuming that each gender-specific status group has the same average age and duration of residence.

74 Parents Without Papers
Table 4.2 Labor Market Outcomes among Mexican Immigrants in the United States, Aged Twenty-five to Sixty-four, by Gender, Citizenship, and Imputed Legal Status, 2012 (percentage)
UnauthorizedLegal
NoncitizensNaturalized
Citizens
Variable Men Women Men Women Men Women
Employment status Employed 87.1 45.9 84.4 45.9 83.7 60.1 Unemployed 5.2 7.4 5.6 6.3 5.7 5.9 Not in the labor force 7.7 46.7 10.1 47.8 10.7 34.0
Occupationa
Management, business, science, and arts
3.8 4.3 6.2 6.6 10.9 15.5
Healthcare 0.2 1.9 0.4 3.0 0.9 6.1 Protective services 0.3 0.1 0.3 0.2 0.7 0.4 Food preparation 12.0 17.7 10.0 15.3 6.5 10.0 Building grounds cleaning and maintenance
14.1 25.6 12.9 23.7 10.9 15.0
Personal care and services 0.4 6.0 0.5 7.8 0.8 8.9 Sales and related 2.6 6.1 2.9 6.3 4.9 9.1 Office and administrative support
2.4 5.2 2.6 6.7 4.9 11.5
Agriculture 9.0 8.5 7.3 6.7 3.5 2.2 Construction and extraction
27.3 1.1 27.3 0.8 18.0 0.5
Installation, maintenance, and repair
4.8 0.2 5.3 0.2 6.9 0.3
Production 12.8 16.1 12.8 15.8 15.2 15.2 Transportation and material moving
10.3 7.2 11.3 7.0 15.9 5.3
Mean hours worked per weekb
40.2 34.5 40.8 35.0 42.3 36.5
Part timec 14.3 34.9 13.0 31.8 8.8 26.4
Mean annual earningsd 23,564 14,866 27,859 17,012 37,852 24,200Median annual earningsd 20,000 13,060 23,960 14,920 31,200 20,000Mean annual earnings (natural log)d
9.8 9.3 10.0 9.4 10.3 9.7
Source: Data from 2012 American Community Survey (Ruggles et al. 2010) with the legal status of immigrants imputed using information from the 2009 Survey of Income and Program Participation (SIPP) and combined-sample multiple imputation (Van Hook et al. 2015).aAmong persons who are currently employed or have worked within the previous five years.bAmong persons who worked during the previous year.cAmong persons who worked fewer than thirty-five hours a week.dAmong persons with positive earned income during the previous year.
The Schooling of Immigrants and Their Offspring 79
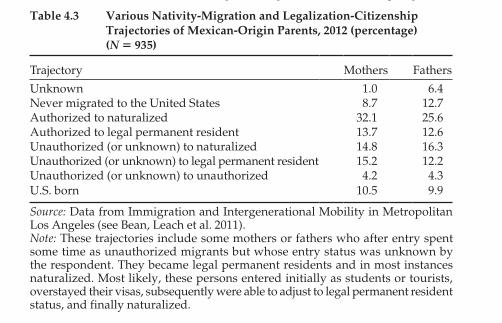
respondents, aged twenty to forty, and information on their parents. The study offers valuable information for a random sample of the children of younger adults in the U.S. city with the largest number of Mexican immigrants in the country (see appendix A for further details about the IIMMLA survey). The data contain questions about the migration status of each parent when that person first entered the United States, as well as the parent’s legal and citizenship status at the time of the interview. The infor-mation obtained enables the comparison of migration statuses for each parent at time of entry and at time of interview. In some cases respondents either had never known one of their parents or did not know their parents’ initial migration status. Other parents had never lived in the United States. Still others had come as unauthorized entrants and then had become legal permanent residents. Some of these eventually naturalized.
The percentage of parents experiencing various individual trajectories are shown in table 4.3. Mexican parents are highly likely to have been unauthorized when they came to the country: 34.2 percent of Mexican mothers and 32.8 percent of Mexican fathers in the sample were unau-thorized at entry. Because a high proportion of Mexican immigrant par-ents at any particular moment may still be making the transition from temporary to permanent immigrant, and because U.S. immigration pol-icy is so complicated that it encourages multiple legal entry strategies,46 Mexicans show more parental trajectory combinations of entry and subsequent legalization or citizenship statuses than other immigrant
Table 4.3 Various Nativity-Migration and Legalization-Citizenship Trajectories of Mexican-Origin Parents, 2012 (percentage) (N 5 935)
Trajectory Mothers Fathers
Unknown 1.0 6.4Never migrated to the United States 8.7 12.7Authorized to naturalized 32.1 25.6Authorized to legal permanent resident 13.7 12.6Unauthorized (or unknown) to naturalized 14.8 16.3Unauthorized (or unknown) to legal permanent resident 15.2 12.2Unauthorized (or unknown) to unauthorized 4.2 4.3U.S. born 10.5 9.9
Source: Data from Immigration and Intergenerational Mobility in Metropolitan Los Angeles (see Bean, Leach et al. 2011).Note: These trajectories include some mothers or fathers who after entry spent some time as unauthorized migrants but whose entry status was unknown by the respondent. They became legal permanent residents and in most instances naturalized. Most likely, these persons entered initially as students or tourists, overstayed their visas, subsequently were able to adjust to legal permanent resident status, and finally naturalized.
80 Parents Without Papers
groups, particularly those of Asian origin.47 Here we examine how Mexican American parental trajectories relate to educational attainment for the male and female children of immigrants separately. We do this by gauging the extent to which children’s schooling varies across parental combinations of migration status categories, controlling for parents’ ante-cedent and respondent’s characteristics.
Parental Combinations of Migration Status Trajectories
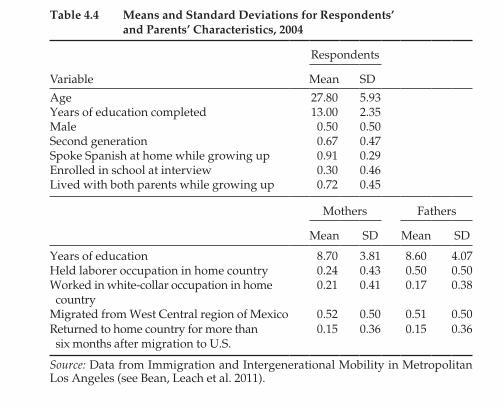
The members of the Mexican immigrant generation and their children show characteristics typical of unskilled labor migrants and their off-spring. For example, nearly three decades or more after migrating to the United States, the Mexican parents still have mostly not finished high school, averaging only a little more than eight-and-a-half years of school-ing (see table 4.4). The Mexican American young adult respondents, by contrast, are much better educated than their parents, having completed thirteen years of schooling on average. Many of these respondents did
Table 4.4 Means and Standard Deviations for Respondents’ and Parents’ Characteristics, 2004
Respondents
Variable Mean SD
Age 27.80 5.93Years of education completed 13.00 2.35Male 0.50 0.50Second generation 0.67 0.47Spoke Spanish at home while growing up 0.91 0.29Enrolled in school at interview 0.30 0.46Lived with both parents while growing up 0.72 0.45
Mothers Fathers
Mean SD Mean SD
Years of education 8.70 3.81 8.60 4.07Held laborer occupation in home country 0.24 0.43 0.50 0.50Worked in white-collar occupation in home country
0.21 0.41 0.17 0.38
Migrated from West Central region of Mexico 0.52 0.50 0.51 0.50Returned to home country for more than six months after migration to U.S.
0.15 0.36 0.15 0.36
Source: Data from Immigration and Intergenerational Mobility in Metropolitan Los Angeles (see Bean, Leach et al. 2011).
84 Parents Without Papers
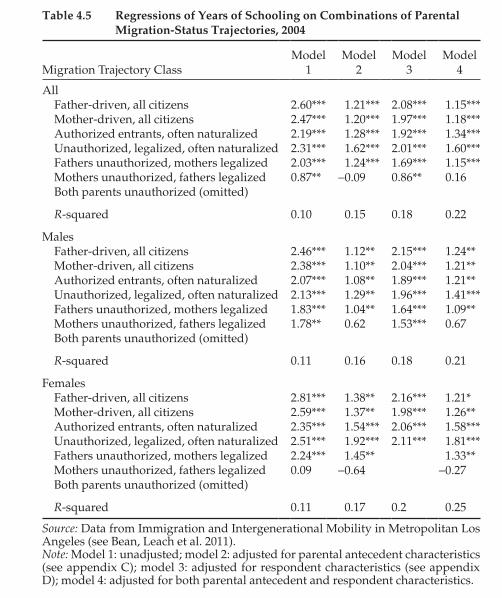
Table 4.5 Regressions of Years of Schooling on Combinations of Parental Migration-Status Trajectories, 2004
Migration Trajectory ClassModel
1Model
2Model
3Model
4
All Father-driven, all citizens 2.60*** 1.21*** 2.08*** 1.15*** Mother-driven, all citizens 2.47*** 1.20*** 1.97*** 1.18*** Authorized entrants, often naturalized 2.19*** 1.28*** 1.92*** 1.34*** Unauthorized, legalized, often naturalized 2.31*** 1.62*** 2.01*** 1.60*** Fathers unauthorized, mothers legalized 2.03*** 1.24*** 1.69*** 1.15*** Mothers unauthorized, fathers legalized 0.87** -0.09 0.86** 0.16 Both parents unauthorized (omitted)
R-squared 0.10 0.15 0.18 0.22
Males Father-driven, all citizens 2.46*** 1.12** 2.15*** 1.24** Mother-driven, all citizens 2.38*** 1.10** 2.04*** 1.21** Authorized entrants, often naturalized 2.07*** 1.08** 1.89*** 1.21** Unauthorized, legalized, often naturalized 2.13*** 1.29** 1.96*** 1.41*** Fathers unauthorized, mothers legalized 1.83*** 1.04** 1.64*** 1.09** Mothers unauthorized, fathers legalized 1.78** 0.62 1.53*** 0.67 Both parents unauthorized (omitted)
R-squared 0.11 0.16 0.18 0.21
Females Father-driven, all citizens 2.81*** 1.38** 2.16*** 1.21* Mother-driven, all citizens 2.59*** 1.37** 1.98*** 1.26** Authorized entrants, often naturalized 2.35*** 1.54*** 2.06*** 1.58*** Unauthorized, legalized, often naturalized 2.51*** 1.92*** 2.11*** 1.81*** Fathers unauthorized, mothers legalized 2.24*** 1.45** 1.33** Mothers unauthorized, fathers legalized 0.09 -0.64 -0.27 Both parents unauthorized (omitted)
R-squared 0.11 0.17 0.2 0.25
Source: Data from Immigration and Intergenerational Mobility in Metropolitan Los Angeles (see Bean, Leach et al. 2011).Note: Model 1: unadjusted; model 2: adjusted for parental antecedent characteristics (see appendix C); model 3: adjusted for respondent characteristics (see appendix D); model 4: adjusted for both parental antecedent and respondent characteristics.
particular stands out for the schooling advantage it conveys: the mother-citizen group. However, closer inspection of the characteristics of the par-ents in this group reveals that two-thirds of the mothers in the class are native born (see appendix D). The other third entered the country as LPRs (none illegally), and all quickly naturalized. And while many of these mothers (40 percent) married unauthorized males, a figure that testifies both to the ubiquity of unauthorized Mexican male labor migration and

The Schooling of Immigrants and Their Offspring 87
In sum, the most noteworthy second-generation schooling attainments occur for those whose parental trajectory classes involve the mother either having entered the country legally or having become legal after entry. Moreover, for the five classes like this, the differences among them in schooling premiums are minimal (with the exception of the class involv-ing two turning points, whose schooling premium is even higher, as would be expected by the life-course framework),52 thus supporting the idea of “catch-up” integration implied by membership exclusion. This result also suggests the possibility of consolidating classes in subsequent analyses. Hence in the analyses of the IIMMLA data presented in the rest of the book, we combine into one category those five classes in which a mother’s legal entry or legalization trajectory occurs, and we combine into another single category the two classes containing mothers whose unauthorized status persisted across time. Henceforth, when we refer to respondents’ “unauthorized background” or “parental unauthorized status,” we mean those respondents whose mothers entered the country and stayed unauthorized.
Summary indications of how far the schooling levels of the legalized fall above those with unauthorized backgrounds are displayed in table 4.6, for males and females. As the membership-exclusion theoretical perspec-tive would expect, both male and female children of immigrants with legal backgrounds show higher schooling premiums over those whose
Table 4.6 Schooling Premiums to Maternal Legalization with and without Adjustments for Background and Personal Characteristics, by Gender, 2004
Maternal TrajectoryModel
1Model
2Model
3Model
4
All Entered or became legal 2.07*** 1.39*** 1.65*** 1.24*** Stayed unauthorized (omitted)
Male Entered or became legal 1.72*** 0.87** 1.48*** 0.94*** Stayed unauthorized (omitted)
Female Entered or became legal 2.48*** 1.96*** 1.92*** 1.68*** Stayed unauthorized (omitted)
Source: Data from Immigration and Intergenerational Mobility in Metropolitan Los Angeles (see Bean, Leach et al. 2011).Note: Model 1: unadjusted; model 2: adjusted for parental antecedent charac-teristics (see appendix C); model 3: adjusted for respondent characteristics (see appendix D); model 4: adjusted for both parental antecedent and respondent characteristics.

76 Parents Without Papers
Source: Data from 2012 American Community Survey (Ruggles et al. 2010) with the legal status of immigrants imputed using information from the 2009 Survey of Income and Program Participation (SIPP) and combined-sample multiple impu-tation (Van Hook et al. 2015).Note: Adjusted estimates are from regression models of logged annual earnings regressed on legal and citizenship status, age, age-squared, English-language proficiency, duration of U.S. residence (years), educational attainment (in years), usual hours worked per week, occupation, and state of residence. *** p < .001; ** p < .01; N.S.: not significantly different from legal permanent residents at the p < .10 threshold.
Perc
enta
ge d
iffe
renc
e in
logg
ed e
arni
ngs
rela
tive
to le
gal p
erm
anen
t res
iden
ts35302520151050
–5–10–15–20
Unadjusted
Men
Adjusted
***
***
***
Perc
enta
ge d
iffe
renc
e in
logg
ed e
arni
ngs
rela
tive
to le
gal p
erm
anen
t res
iden
ts 4035302520151050
–5–10–15–20
Unadjusted
Unauthorized Naturalized
Women
Adjusted
N.S.
**
***
***
***
Figure 4.1 Earnings of Mexican Immigrants in the United States, Aged Twenty-five to Sixty-four, Los Angeles, 2012

82 Parents Without Papers
by membership exclusion imply that it is the lack of membership itself that most handicaps immigrants, suggesting that once membership is obtained, integration processes are likely to proceed more rapidly. Such dynamics would lead us to expect that those whose parents’ trajectory classes involve transitions from unauthorized to legal status will show schooling levels as high as those of persons whose parents came to the country legally to begin with. That is, we would expect the educational attainment of second-generation persons whose parents fall in the two middle trajectory classes (having made the transition from unauthorized entry to legal membership) to rise close to the levels of those with parents in the top two classes. As noted earlier, membership-exclusion dynamics imply that legalization constitutes a turning point after which deficiencies in schooling resulting from parental unauthorized status start to be made up. By contrast, if initial unauthorized status leads to second-generation scarring that persists well beyond the point of legalization, we would not
Source: Data from Immigration and Intergenerational Mobility in Metropolitan Los Angeles (see Bean, Leach et al. 2011).
Father citizen24.1 percent
Mother citizen13.9 percent
Both unauthorized9.3 percent
LPRs17.1 percent
Unauthorizedentrants who
legalized17 percent
Fatherunauthorized,
motherauthorized14.1 percent
Father authorized,mother unauthorized
4.5 percent
Figure 4.2 Distribution of Parental Combinations of Migration-Status Trajectories

Three-Generational Analyses of Structural Integration 93
is it possible to examine the legacy effects of unauthorized migration on third-generation men and women when we do not know which indi-vidual third-generation respondents had grandparents who were un- authorized? In fact we did not collect such information in the Immigration and Intergenerational Mobility in Metropolitan Los Angeles (IIMMLA) survey because pretests showed that many respondents did not know the legal status of their grandparents. Despite this, it is important to esti-mate such legacy effects if possible, because they are likely to exist. We know this from the research literature on intergenerational transmission of inequality, which has recently emphasized the importance of taking multiple-generational sources of influence into account.9 We do this by estimating at the individual level the effects of first-generation unauthor-ized status on the second generation, the results of which are presented in the previous chapter. Now, in turn, we estimate at the aggregate or group level the effects on the third generation that derive from those second-generation deficits. We can calculate these because we have a concrete idea of the degree to which second-generation schooling is dampened by unauthorized status, meaning we can extrapolate into the third genera-tion as a group the extent to which such deficits are intergenerationally transmitted. We present the details of these estimations in appendix E.
Second, how do we know how many of the grandparents’ generation were unauthorized immigrants? While we have no direct measure, accounts of Mexican migration from the 1950s through the 1970s are explicit about the large proportion of the Mexican immigrant population that was unau-thorized.10 We take a range of conservative estimates, the most conserva-tive of which is that the proportion unauthorized among the grandparents’ generation equaled the proportion unauthorized in the parents’ generation.
Third, how can we gauge the experience of being unauthorized two gen-erations ago to that of the parents of the second generation? If anything, the grandparents of the current respondents may have faced greater eth-nic discrimination because they had fewer protections of civil rights. But
Table 5.1 Expected Direction of Education and Income Differences Between the Second and Third Generation under Three Theoretical Perspectives
Males Females
Theoretical PerspectiveEducation Difference
Income Difference
Education Difference
Income Difference
Working-class stagnation 0 + 0 or + +Male racialization 0 0 + +Male and female racialization 0 0 0 0
Source: Authors’ heuristic summary.
Three-Generational Analyses of Structural Integration 95
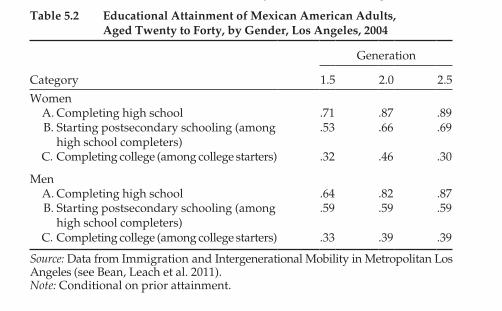
Examining key grade-level transitions and mean completed years of schooling by gender for the 1.5 to 2.5 generations, we find that these theoretical expectations are generally borne out. Among persons in the 1.5 generation, the lower proportion of females versus males graduat-ing from high school, starting college, and finishing college are con-sistent with the idea that more traditional gender roles characterized Mexico when the parents migrated (see table 5.2). In the 2.0 generation, however, among those who have graduated from high school, women show higher proportions on each of these three probabilities, results that are consistent with the advantages that accrue to daughters in the United States.
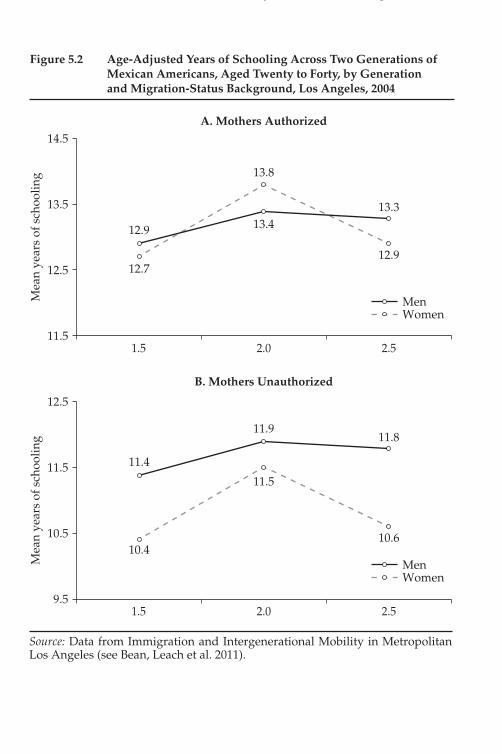
These transition probabilities also translate into similar differences in average years of schooling completed. Thus 1.5 generation females exhibit lower average age-adjusted levels of schooling than males (12.2 years on average compared with 12.4 years for males) (figure 5.1) but higher lev-els in the 2.0 generation (13.6 years compared with 13.3 years) and then lower levels in the 2.5 generation (13.0 versus 13.2 years). This crossover pattern by gender is consistent with the theoretical expectations previ-ously outlined. When we break the results down further by whether per-sons come from legal or unauthorized backgrounds, the expected sharper pattern for women from unauthorized backgrounds does not emerge (see figure 5.2). Instead, the pattern is evident for those from both authorized and unauthorized backgrounds, with a crossover occurring only for the former. The socialization pressures on males and females deriving
Table 5.2 Educational Attainment of Mexican American Adults, Aged Twenty to Forty, by Gender, Los Angeles, 2004
Generation
Category 1.5 2.0 2.5
Women A. Completing high school .71 .87 .89 B. Starting postsecondary schooling (among
high school completers) .53 .66 .69
C. Completing college (among college starters) .32 .46 .30
Men A. Completing high school .64 .82 .87 B. Starting postsecondary schooling (among
high school completers).59 .59 .59
C. Completing college (among college starters) .33 .39 .39
Source: Data from Immigration and Intergenerational Mobility in Metropolitan Los Angeles (see Bean, Leach et al. 2011).Note: Conditional on prior attainment.

Table 5.3 Means and Standard Deviations for Socioeconomic and Control Variables Used in Income Regressions, by Gender and Generational Status, 2004
Generation3+ Non-Hispanic
White
Variable
1.5 2.0 2.5 3.0 3.5
Mean SD Mean SD Mean SD Mean SD Mean SD Mean SD
Men
Annual income
28,674 26,889 29,547 27,939 29,715 20,027 47,370 32,811 36,323 28,656 43,686 43,156
Age 28.89 6.47 26.67 5.31 28.83 6.68 31.96 6.92 29.06 4.93 30.60 5.81In school 0.23 0.42 0.33 0.47 0.29 0.46 0.09 0.29 0.26 0.44 0.18 0.39Works full time
0.73 0.44 0.59 0.49 0.68 0.47 0.96 0.21 0.81 0.40 0.69 0.46
Education (yrs.)
12.55 2.50 13.33 2.03 13.39 1.95 13.78 2.13 13.61 1.94 14.43 2.18
Women
Annual income
23,396 15,378 20,974 19,520 22,826 16,383 35,615 22,366 29,543 29,195 26,716 23,631
Age 29.29 7.07 29.26 6.14 27.44 5.33 29.93 6.06 30.46 6.29 30.98 6.16In school 0.25 0.44 0.25 0.44 0.40 0.49 0.29 0.46 0.15 0.38 0.27 0.45Works full time
0.58 0.50 0.51 0.50 0.58 0.49 0.57 0.50 0.62 0.51 0.50 0.50
Education (yrs.)
12.53 2.95 13.80 2.00 13.07 2.09 14.23 2.83 13.54 1.74 14.99 2.30
Source: Data from Immigration and Intergenerational Mobility in Metropolitan Los Angeles (see Bean, Leach et al. 2011).Note: Generations are weighted to represent the Mexican-origin generational distribution in Los Angeles and adjusted for generational age differences.

Table 5.4 Effect of Migration-Background Status on Years of Schooling Completed, Mexican Americans, Aged Twenty to Forty, by Gender and Generation, Los Angeles, 2004
Men Women
Model 1 Model 2 Model 3 Model 1 Model 2 Model 3
Category B SE B SE B SE B SE B SE B SE
Mother unauthorized −1.54*** 0.289 −1.88*** 0.36 −2.30** 0.33 −2.91+ 0.43
Generation 1.5Generation 2.0 0.90*** 0.23 0.49* 0.23 0.35 0.26 1.42*** 0.25 1.11*** 0.24 0.88*** 0.26Generation 2.5 0.80** 0.29 0.38 0.29 0.18 0.31 0.79* 0.32 0.26 0.32 0.12 0.32Generation 3.0 1.16* 0.47 0.65 0.47 0.55 0.47 2.02** 0.69 1.48* 0.66 1.34* 0.66Generation 3.5 0.91* 0.41 0.39 0.41 0.28 0.42 1.38** 0.45 0.85+ 0.43 0.71 0.44
Unauthorized × 2.0 0.64+ 0.52 1.46* 0.67Unauthorized × 2.5 1.85 1.14
Age (mean-centered) 0.05** 0.02 0.05** 0.02 0.05** 0.02 0.03 0.02 0.03+ 0.02 0.03+ 0.02
Constant 12.41*** 0.17 12.93*** 0.20 13.04*** 0.20 12.15 0.19 12.68*** 0.20 12.82 0.21N 523 523 523 518 518 518R-squared 0.049 0.099 0.105 0.069 0.150 0.157
Source: Data from Immigration and Intergenerational Mobility in Metropolitan Los Angeles (see Bean, Leach et al. 2011).Note: The 1.5 generation is the reference category.***p < .001; **p < .01; *p < .05; +p < .10

Table 5.5 OLS Coefficients from Models of Annual Income (Natural Log), Regressed on Immigrant Generation, Migration-Status Background, and Control Variables, Mexican American Men, Aged Twenty to Forty, Los Angeles, 2004
Model 1 Model 2 Model 3 Model 4 Model 5 Model 6
B SE B SE B SE B SE B SE B SE
Generation 1.5Generation 2.0 0.035 0.109 0.033 0.115 0.261** 0.099 −0.009 0.113 0.223* 0.098Generation 2.5 0.112 0.143 0.110 0.149 0.155 0.126 0.065 0.145 0.120 0.124Generation 3.0 0.717*** 0.221 0.714** 0.226 0.371+ 0.194 0.637** 0.221 0.308 0.190Generation 3.5 0.400* 0.195 0.397* 0.201 0.326+ 0.171 0.337+ 0.196 0.279+ 0.167
Unauthorized background
−0.100 0.135 −0.009 0.143 −0.019 0.122 0.144 0.143 0.106 0.122
Age 0.057*** 0.007 0.052*** 0.007
Enrolled in school −0.034 0.090 −0.116 0.090
Not working (ref.)Works full time 0.828*** 0.104 0.806*** 0.101Works part time 0.234+ 0.139 0.183 0.136
Years of education 0.103*** 0.021 0.088*** 0.019
Constant 9.849 0.085 9.958*** 0.049 9.852*** 0.097 7.589*** 0.223 8.504*** 0.292 6.633*** 0.298
R-squared 0.031 0.001 0.034 0.309 0.077 0.341
Source: Data from Immigration and Intergenerational Mobility in Metropolitan Los Angeles (see Bean, Leach et al. 2011).Note: The 1.5 generation is the reference category.***p < .001; **p < .01; *p < .05; +p < .10
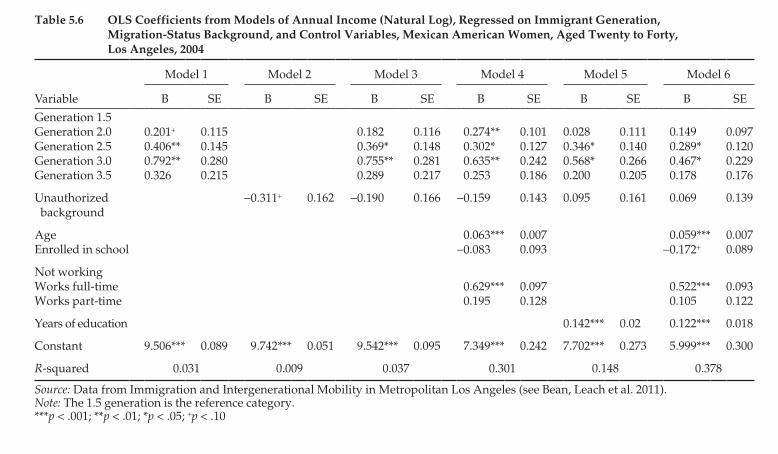
Table 5.6 OLS Coefficients from Models of Annual Income (Natural Log), Regressed on Immigrant Generation, Migration-Status Background, and Control Variables, Mexican American Women, Aged Twenty to Forty, Los Angeles, 2004
Model 1 Model 2 Model 3 Model 4 Model 5 Model 6
Variable B SE B SE B SE B SE B SE B SE
Generation 1.5Generation 2.0 0.201+ 0.115 0.182 0.116 0.274** 0.101 0.028 0.111 0.149 0.097Generation 2.5 0.406** 0.145 0.369* 0.148 0.302* 0.127 0.346* 0.140 0.289* 0.120Generation 3.0 0.792** 0.280 0.755** 0.281 0.635** 0.242 0.568* 0.266 0.467* 0.229Generation 3.5 0.326 0.215 0.289 0.217 0.253 0.186 0.200 0.205 0.178 0.176
Unauthorized background
−0.311+ 0.162 −0.190 0.166 −0.159 0.143 0.095 0.161 0.069 0.139
Age 0.063*** 0.007 0.059*** 0.007Enrolled in school −0.083 0.093 −0.172+ 0.089
Not workingWorks full-time 0.629*** 0.097 0.522*** 0.093Works part-time 0.195 0.128 0.105 0.122
Years of education 0.142*** 0.02 0.122*** 0.018
Constant 9.506*** 0.089 9.742*** 0.051 9.542*** 0.095 7.349*** 0.242 7.702*** 0.273 5.999*** 0.300
R-squared 0.031 0.009 0.037 0.301 0.148 0.378
Source: Data from Immigration and Intergenerational Mobility in Metropolitan Los Angeles (see Bean, Leach et al. 2011).Note: The 1.5 generation is the reference category.***p < .001; **p < .01; *p < .05; +p < .10

Table 5.7 OLS Coefficients from Models of Annual Income (Natural Log), Regressed on Ethnoracial and Generation Group, Migration-Status Background, and Control Variables, Mexican American Men, Aged Twenty to Forty, Los Angeles, 2004
Model 1 Model 2 Model 3 Model 4 Model 5 Model 6
Non-Hispanic White 1.5 Generation Mexican −0.427*** −0.424** −0.357** −0.226+ −0.269* −0.237* 2.0 Generation Mexican −0.392*** −0.391*** −0.095 −0.273** −0.281** −0.017 2.5 Generation Mexican −0.315* −0.314* −0.207+ −0.203 −0.207 −0.123 3.0 Generation Mexican 0.290 0.290 0.019 0.360+ 0.363+ 0.080 3.5 Generation Mexican −0.027 −0.027 −0.025 0.061 0.064 0.048
Unauthorized background −0.009 −0.020 0.154 0.109
Age 0.057*** 0.051***
Enrolled in school −0.005 −0.086
Not working (ref.) Working full time 0.728*** 0.696*** Working part time 0.014 −0.035
Years of education 0.107*** 0.110*** 0.090***
Constant 10.277*** 10.277*** 8.039*** 8.736*** 8.683*** 6.966***
R-squared 0.044 0.044 0.304 0.097 0.098 0.338
Source: Data from Immigration and Intergenerational Mobility in Metropolitan Los Angeles (see Bean, Leach et al. 2011).Note: Non-Hispanic whites are the reference category.***p < .001; **p < .01; *p < .05; +p < .10.

Table 5.8 OLS Coefficients from Models of Annual Income (Natural Log), Regressed on Ethnoracial and Generation Group, Migration-Status Background, and Control Variables, Mexican American Women, Aged Twenty to Forty, Los Angeles, 2004
Model 1 Model 2 Model 3 Model 4 Model 5 Model 6
Non-Hispanic White 1.5 Generation Mexican −0.259* −0.222+ −0.152 0.029 0.022 0.033 2.0 Generation Mexican −0.058 −0.040 0.089 0.080 0.077 0.177+
2.5 Generation Mexican 0.147 0.147 0.152 0.371** 0.373** 0.328** 3.0 Generation Mexican 0.533+ 0.533+ 0.482+ 0.622* 0.623* 0.541* 3.5 Generation Mexican 0.067 0.067 0.092 0.237 0.238 0.220
Unauthorized background −0.190 −0.153 0.045 0.021
Age 0.049*** 0.045***
Enrolled in school −0.101 −0.165*
Not working (ref.) Working full-time 0.762*** 0.680*** Working part-time 0.176* 0.095
Years of education 0.117*** 0.117*** 0.093***
Constant 9.764*** 9.764*** 7.842*** 8.017*** 8.003*** 6.669***
R-squared 0.023 0.025 0.264 0.098 0.098 0.307
Source: Data from Immigration and Intergenerational Mobility in Metropolitan Los Angeles (see Bean, Leach et al. 2011).Note: Non-Hispanic whites are the reference category.***p < .001; **p < .01; *p < .05; +p < .10.

96 Parents Without Papers
Source: Data from Immigration and Intergenerational Mobility in Metropolitan Los Angeles (see Bean, Leach et al. 2011).
Mea
n ye
ars
of s
choo
ling
14.5
13.5
12.5
11.51.5 2.0 2.5
12.4
12.2
13.3
13.6
13.2
13.0
MenWomen
Figure 5.1 Age-Adjusted Years of Schooling Completed by Mexican Americans, Aged Twenty to Forty, by Generation and Gender, Los Angeles, 2004
from migration status and family-related cultural repertoires appear to impinge on the male and female children of Mexican immigrants in ways that boost female education in the entire 2.0 generation, making for a crisscross pattern by gender of advancing education mobility across these generation categories.
Three-Generational Patterns by Migration Status
Four notable patterns emerge when all five generation categories are disaggregated by both gender and legal status background. First, in keeping with the statistically significant and sizable adverse effects of unauthorized background on second-generation schooling shown in the previous chapter, education levels for young adult second-generation persons with unauthorized backgrounds are markedly lower than those for persons with authorized backgrounds (we operationalize unauthor-ized background as having mothers who came illegally and did not sub-sequently legalize). The second notable pattern, as expected based on our ideas about migration and family-based cultural repertoires, is that the differences across generations are larger for women than for men because many families encourage boys to work more rather than pursue addi-tional schooling, especially in the 2.0 and 2.5 generations.
Three-Generational Analyses of Structural Integration 97
Source: Data from Immigration and Intergenerational Mobility in Metropolitan Los Angeles (see Bean, Leach et al. 2011).
Mea
n ye
ars
of s
choo
ling
12.5
11.5
10.5
9.51.5 2.0 2.5
11.4
10.4
11.9
11.5
11.8
10.6
MenWomen
Mea
n ye
ars
of s
choo
ling
14.5
13.5
12.5
11.51.5 2.0 2.5
12.9
12.7
13.4
13.8
13.3
12.9
MenWomen
B. Mothers Unauthorized
A. Mothers Authorized
Figure 5.2 Age-Adjusted Years of Schooling Across Two Generations of Mexican Americans, Aged Twenty to Forty, by Generation and Migration-Status Background, Los Angeles, 2004

98 Parents Without Papers
The third notable result is that even though males from families with legal migration backgrounds attain more years of schooling than those from unauthorized backgrounds, the differences in schooling from the second to the third generation for legal-background males are not sizable. Even look-ing at third-only generation respondents to eliminate any negative effects of selective attrition, the education gains are small (13.6 years of schooling among the 3.0 generation males compared with 13.3 in the 2.0 generation) (figure 5.3). Further analyses on income, presented later in this chapter, sug-gest that an important reason for this may be that third-generation males, as the working-class-delay theoretical perspective would expect, find ways to increase income without acquiring much additional schooling, implying that opportunities to earn more remain possible even without much educa-tion mobility between the second and third generations.
The fourth significant pattern involves Mexican Americans from ethni-cally dense family backgrounds (operationalized here for the 2.0 genera-tion as both parents having been born in Mexico and for the 3.0 generation as all four grandparents being born in Mexico), who show disproportion-ately large increments in educational attainment compared with the 2.5 or 3.5 generations, that is, those who have one U.S.-born parent or one U.S.-born grandparent (who might or might not have Mexican ancestry), respectively. Again, according to labor-migration and family-based cultural repertoire ideas, women should exhibit this pattern more strongly than men, and, in
Source: Data from Immigration and Intergenerational Mobility in Metropolitan Los Angeles (see Bean, Leach et al. 2011).
Mea
n ye
ars
of s
choo
ling
14.5
13.5
12.5
11.51.5 2.5 3.52.0 3.0
12.4
12.2
13.3
13.6
13.2
13.0
14.2
13.6
13.6
13.3
MenWomen
Figure 5.3 Age-Adjusted Years of Schooling Completed by Mexican Americans, Aged Twenty to Forty, by Generation, Los Angeles, 2004

100 Parents Without Papers
Source: Data from Immigration and Intergenerational Mobility in Metropolitan Los Angeles (see Bean, Leach et al. 2011).
B. From Unauthorized Backgrounds
A. From Authorized Backgrounds
Mea
n ye
ars
of s
choo
ling
14.5
13.5
10.5
11.5
12.5
9.51.5 2.5 3.52.0 3.0
11.4
10.4
11.9
11.5
11.8
10.6
13.7
13.313.1
13.0
MenWomen
Mea
n ye
ars
of s
choo
ling
15.0
14.0
13.0
12.01.5 2.5 3.52.0 3.0
12.9
12.7
13.4
13.8
13.3
12.9
14.3
13.7
13.7
13.4
MenWomen
Figure 5.4 Age-Adjusted Years of Schooling Across Three Generations of Mexican Americans, Aged Twenty to Forty, by Migration-Status Background, Los Angeles, 2004

104 Parents Without Papers
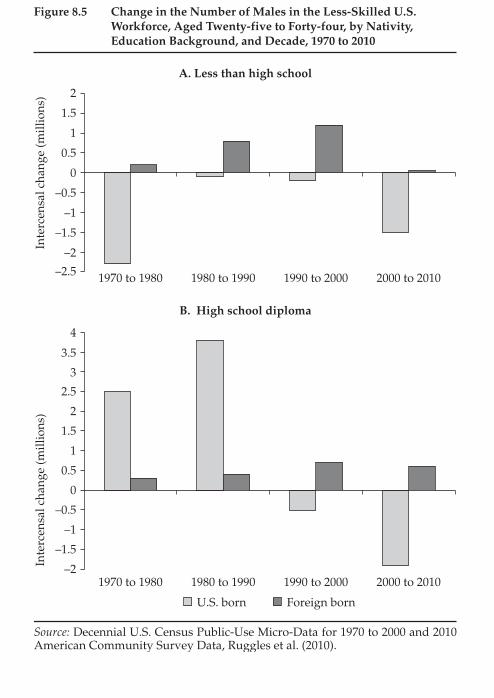
increase of about one-seventh of a year’s schooling for each adjacent gen-eration group. In other words, comparing the 2.5 generation group with the 3.0 group (and all such similar adjacent pairs) yields an average edu-cation difference of 0.151 years of schooling. The most important result is that for authorized background status, which here can be evaluated in terms of its relative importance compared with the family-related ethnic-density variable. Parents being able to legalize raises children’s schooling by almost two years on average (b = 1.85). This is more than six times as large as the ethnic-homogeneity effect for males (bm = 0.26) and almost twice this effect for females (bf = 0.26 + 0.73 = 0.98). In short, legaliza-tion results in the largest consistent positive effect on education, one that increases the schooling premium for both males and females, especially the latter, even in comparison with the sizes of other positive effects.
These results can be illustrated by graphing the generations’ linear effects after removing the positive ethnic-density bumps occurring in the 2.0 and the 3.0 generations for each of the four migration status and gender combinations.17 The graph reveals three patterns (figure 5.5). The first, as we have already seen, is that the schooling levels of both men and women coming from unauthorized backgrounds are lower than those of persons from authorized backgrounds. The second is that those from
Source: Data from Immigration and Intergenerational Mobility in Metropolitan Los Angeles (see Bean, Leach et al. 2011).Note: Adjusted for age and ethnic density differences between generations.
Mea
n ye
ars
of s
choo
ling
14.0
13.0
12.0
11.0
10.01.5 2.5 3.52.0 3.0
12.9
12.9
11.4
10.4
13.1
12.8
11.6
10.5
13.3
12.9
11.8
10.6
13.4
13.313.0
12.7
13.413.7
13.113.0
Authorized menUnauthorized menAuthorized womenUnauthorized women
Figure 5.5 Average Educational Attainment, Mexican-Origin Adults, by Gender, Generation, and Mother’s Migration-Status Background, Los Angeles, 2004

Table 6.1 Neighborhood-Level Integration and Educational Attainment, by Generation and Area of Residence, for Mexican American Respondents and for Metropolitan Los Angeles (percentage)
GenerationTotal for Metro
Los AngelesCharacteristic Area 1.5 2 3
Mean percentage below poverty line Five-county total 21.9 19.1* 15.3** 15.6 L.A., Orange, Ventura 23.3 19.3* 14.6** 15.8 Inland Empire 16.6 18.4 16.8 15.0
Mean percentage high school diploma or more Five-county total 55.1 59.7 69.9** 73.0 L.A., Orange, Ventura 51.9 57.6 69.7** 72.6 Inland Empire 66.9 66.0 70.3 74.6
Mean percentage bachelor’s degree or more Five-county total 11.8 13.5 18.2** 24.4 L.A., Orange, Ventura 11.4 13.7 20.6** 26.3 Inland Empire 13.0 12.7 12.9 16.3
Mean percentage non-Mexican Five-county total 51.7 53.3 65.1** 69.7 L.A., Orange, Ventura 49.7 52.1 66.3** 69.8 Inland Empire 59.3 56.9 62.5 69.4
Source: Data from Immigration and Intergenerational Mobility in Metropolitan Los Angeles (see Bean, Leach et al. 2011) and U.S. Bureau of the Census (2000a, 2000b).*Significantly different from the 1.5 generation at the .05 level.**Significantly different from the 2nd generation at the .05 level.

Table 6.2 Structural and Mobility Change in Neighborhood Ethnicity and Education Level since Respondent’s Youth, by Generation and Part of Metropolitan Los Angeles
Generation
Variable 1.5 2 3
Change in level of neighborhood integration (percentage of non-Mexicans) since age twelve A. Total percentage-point change -6.4 -4.5 -4.1
Los Angeles, Orange, and Ventura counties -8.0 -4.2 -2.5 Riverside and San Bernardino counties -0.2 -5.3 -8.2
B. Percentage-point change owing to inflows of persons of Mexican origin into childhood neighborhood -9.2 -8.5 -10.6 Los Angeles, Orange, and Ventura counties -9.1 -7.5 -9.9 Riverside and San Bernardino counties -9.7 -11.9 -12.2
C. Percentage-point change owing to moving to new neighborhood 2.8 4.0 6.5 Los Angeles, Orange, and Ventura counties 1.1 3.2 7.4 Riverside and San Bernardino counties 9.0 6.9 4.1
Change in neighborhood percentage of high school graduates since age twelve D. Total percentage-point change 2.9 4.3 4.9
Los Angeles, Orange, and Ventura counties 1.2 3.8 5.7 Riverside and San Bernardino counties 9.6 6.3 2.7
E. Percentage-point change owing to influx of less educated people into childhood neighborhood -2.2 -0.7 -0.2 Los Angeles, Orange, and Ventura counties -2.3 -0.5 -0.1 Riverside and San Bernardino counties -1.5 -1.3 -0.6
F. Percentage-point change in level of high school graduates owing to moving 5.1 5.0 5.1 Los Angeles, Orange, and Ventura counties 3.5 4.2 5.8 Riverside and San Bernardino counties 11.2 7.6 3.3
Source: Data from Immigration and Intergenerational Mobility in Metropolitan Los Angeles (see Bean, Leach et al. 2011) and Census CD (2002).

134 Parents Without Papers
Table 6.3 shows the relationship between unauthorized status and neighborhood poverty. While model 1 confirms the significant differ-ence between the 1.5 and later generations, even when controlling for age and gender, model 2 shows that parental unauthorized status accounts for nearly a full percentage point of the difference between the 1.5 and third generations. Persistently unauthorized mothers are associated with a rise of 2.7 percentage points in neighborhood poverty. The other forms of disadvantage, introduced in model 3, have substantial effects on the neighborhood poverty rate apart from unauthorized status. Accounting
Table 6.3 OLS Coefficients of Models of Neighborhood Poverty Rate Regressed on Generation, Family Disadvantage, and Respondent Characteristics, Mexican American Adults, Aged Twenty to Forty, Metropolitan Los Angeles, 2004
Characteristic Model 1 Model 2 Model 3 Model 4
Generation 1.5 (reference) 2 -3.041*** -2.431*** -1.004 -0.035 3 -6.342*** -5.555*** -2.474** -1.383
Ascribed characteristics Age -0.193*** -0.186*** -0.159*** -.033 Female 0.307 0.406 0.401 0.473
Family disadvantage Unauthorized background 2.731*** 3.230*** 0.512 Respondent sends remittances 1.825*** 2.155*** Parents speak poor English 3.218*** 2.710***
Achieved characteristics Living with parents -0.757 Married -2.384*** Has children -0.034 Household income (000s) -0.054*** Finished high school or vocational school
-3.916***
At least some college -4.263*** Has stocks, bonds, or retirement plan
-1.961**
Constant 27.308*** 26.271*** 22.371*** 27.214***R-squared 0.053 .059 0.081 0.177N 1,056 1,056 1,056 1,056
Source: Data from Immigration and Intergenerational Mobility in Metropolitan Los Angeles (see Bean, Leach et al. 2011) and U.S. Bureau of the Census (2000b).*p < .10, **p < .05, ***p < .01, one-tailed test.

Table 6.4 OLS Regression of Neighborhood Education Level on Generation, Family Disadvantage, and Respondent Characteristics, Mexican American Adults, Aged Twenty to Forty, Metropolitan Los Angeles, 2004
High School Diploma Bachelor’s Degree
Characteristic Model 1 Model 2 Model 3 Model 4 Model 1 Model 2 Model 3 Model 4
Generation 1.5 (reference) 2 5.203*** 4.412*** 2.060 0.641 2.020*** 1.535** 0.807 0.039 3 14.037*** 13.016*** 7.850*** 5.926*** 5.964*** 5.338*** 3.714*** 2.543**
Ascribed characteristics Age 0.524*** 0.516*** 0.476*** 0.189* 0.281*** 0.276*** 0.265*** 0.111* Female -0.970 -1.099 -1.102 -0.964 -0.752 -0.831 -0.835 -0.519
Family disadvantage Unauthorized background -3.546** -4.062** -0.512 -2.173** -2.242** -0.474 Respondent sends remittances -3.869*** -4.521*** -1.453** -1.839** Parents speak poor English -4.809*** -3.779*** -1.342** -0.671
Achieved characteristics Living with parents -3.705** -2.974*** Married 2.299* 0.794 Has children -1.529 -1.995** Household income (000s) 0.091*** 0.054*** Finished high school or vocational school
5.698*** 3.076***
At least some college 6.402*** 3.412*** Stocks, bonds, or retirement plan 2.373** 0.179
Constant 40.576*** 41.922*** 48.298*** 46.563*** 4.085** 4.910*** 6.867*** 7.667***R-squared 0.087 0.090 0.107 0.179 0.061 0.050 0.071 0.147N 1,056 1,056 1,056 1,056 1,056 1,056 1,056 1,056
Source: Data from Immigration and Intergenerational Mobility in Metropolitan Los Angeles (see Bean, Leach et al. 2011) and U.S. Bureau of the Census (2000b).*p < .10, **p < .05, ***p < .01, one-tailed test.
Spatial Integration 137
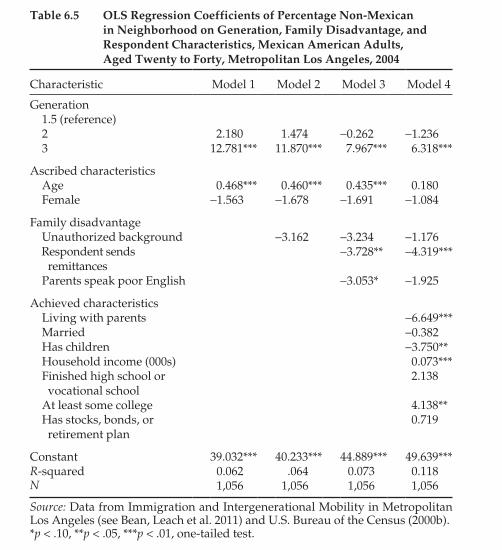
Table 6.5 OLS Regression Coefficients of Percentage Non-Mexican in Neighborhood on Generation, Family Disadvantage, and Respondent Characteristics, Mexican American Adults, Aged Twenty to Forty, Metropolitan Los Angeles, 2004
Characteristic Model 1 Model 2 Model 3 Model 4
Generation 1.5 (reference) 2 2.180 1.474 -0.262 -1.236 3 12.781*** 11.870*** 7.967*** 6.318***
Ascribed characteristics Age 0.468*** 0.460*** 0.435*** 0.180 Female -1.563 -1.678 -1.691 -1.084
Family disadvantage Unauthorized background -3.162 -3.234 -1.176 Respondent sends remittances
-3.728** -4.319***
Parents speak poor English -3.053* -1.925
Achieved characteristics Living with parents -6.649*** Married -0.382 Has children -3.750** Household income (000s) 0.073*** Finished high school or vocational school
2.138
At least some college 4.138** Has stocks, bonds, or retirement plan
0.719
Constant 39.032*** 40.233*** 44.889*** 49.639***R-squared 0.062 .064 0.073 0.118N 1,056 1,056 1,056 1,056
Source: Data from Immigration and Intergenerational Mobility in Metropolitan Los Angeles (see Bean, Leach et al. 2011) and U.S. Bureau of the Census (2000b).*p < .10, **p < .05, ***p < .01, one-tailed test.
neighborhoods. Even when respondents’ education and income are accounted for, model 4 shows the persistent effects of sending remit-tances on living in more-Mexican areas. Of course, it is not possible to determine the mechanism at work here. Remittances reduce the avail-able income for moving, but sending them also signals the persistence of coethnic ties and perhaps some preference for coethnic neighbor-hoods. However, because sending remittances is also associated with living in neighborhoods with greater poverty, evidence suggests the importance of the economic role.

Table 6.6 Odds Ratios of Home Ownership, by Generation, Family Disadvantage, Respondent Characteristics, and Region of Residence, Mexican American Adults, Aged Twenty to Forty, Metropolitan Los Angeles, 2004
Characteristic Model 1 Model 2 Model 3 Model 4 Model 5 Model 6
Generation 1.5 1.173 1.399 1.454 1.763 1.544 1.305 2 1.146 1.205 1.167 1.209 1.082 1.096 3 (reference)
Ascribed characteristics Age 1.144*** 1.141*** 1.139*** 1.103*** 1.104*** 1.106*** Female 0.993 0.966 0.993 0.981 1.026 1.023
Family disadvantage/advantage Unauthorized background 0.546*** 0.729 0.951 0.954** 0.931 Respondent sends remittances 1.032 0.911 0.978 1.001 Parents speak poor English 1.203 1.290 1.366 1.390 Parents own home 2.021*** 1.448* 1.418* 1.391*
Achieved characteristics Married 2.247*** 2.115*** 2.204*** Has children 1.800*** 1.811*** 1.783** Household income (000s) 1.016*** 1.016*** 1.016*** Finished high school or vocational school 1.047 1.105 1.175 At least some college 1.361 1.413 1.453 Has stocks, bonds, or retirement plan 1.583* 1.616* 1.685**
Residence Moved to Inland Empire 3.545*** 1.335 Moved to Inland Empire * 1.5 generation 9.652** Moved to Inland Empire * 2.0 generation 1.293
Constant -4.712*** -4.619*** -5.127*** -6.317*** -6.432*** 0.034***-2 log likelihood 968.584 961.541 943.953 835.082 817.408 807.659N 786 786 786 786 786 786
Source: Data from Immigration and Intergenerational Mobility in Metropolitan Los Angeles (see Bean, Leach et al. 2011).*p < .10, **p < .05, ***p < .01, one-tailed test.
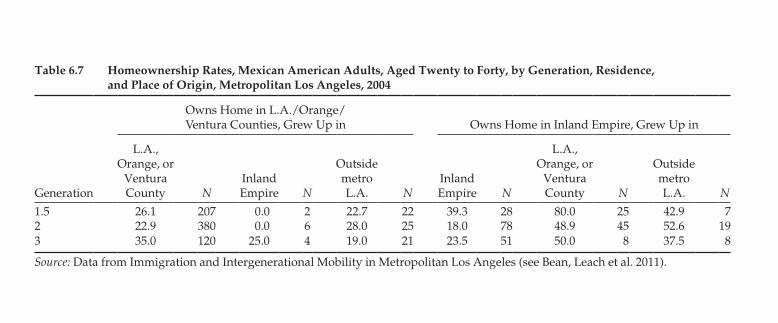
Table 6.7 Homeownership Rates, Mexican American Adults, Aged Twenty to Forty, by Generation, Residence, and Place of Origin, Metropolitan Los Angeles, 2004
Owns Home in L.A./Orange/ Ventura Counties, Grew Up in Owns Home in Inland Empire, Grew Up in
Generation
L.A., Orange, or
Ventura County N
Inland Empire N
Outside metro L.A. N
Inland Empire N
L.A., Orange, or
Ventura County N
Outside metro L.A. N
1.5 26.1 207 0.0 2 22.7 22 39.3 28 80.0 25 42.9 72 22.9 380 0.0 6 28.0 25 18.0 78 48.9 45 52.6 193 35.0 120 25.0 4 19.0 21 23.5 51 50.0 8 37.5 8
Source: Data from Immigration and Intergenerational Mobility in Metropolitan Los Angeles (see Bean, Leach et al. 2011).

122 Parents Without Papers
that spatial integration often occurs independently of economic integra-tion. The theory connecting social, economic, and spatial dimensions of integration dates to the ecological principles of the Chicago School, particularly the observation by Robert Park that spatial relations tend to mirror social relations.16 Originally formulated to describe the dispersion of early-twentieth-century immigrants from the ethnic enclaves in which they initially settled, the concept refers broadly to the residential conver-gence of racial-ethnic groups in general but particularly to the ability of minorities, often immigrant groups, to access the neighborhoods of the majority population.17 As members of an immigrant group acculturate in customs and language and find better jobs, they start to seek better neighborhoods and housing amenities generally associated with higher-status natives. Greater contact with the native born creates opportunities for social and economic inclusion, particularly for children, whose play-mates and schoolmates often live in the same neighborhood.18 Thus the traditional conception of spatial integration holds that it works roughly in tandem with sociocultural and economic dimensions of integration and may be an intermediate step in the overall process of integration. It
Source: Adapted from U.S. Bureau of the Census 2000a.
Percent Mexican0 to 1415 to 2930 to 4445 to 5960 to 100
0 5 10 20 miles
Figure 6.1 Concentration of Mexican-Origin Population in 2000 in the Five-County Area of Metropolitan Los Angeles (percentage)

126 Parents Without Papers
childhood neighborhood context, we used linear interpolation between decennial censuses to estimate the tract-level characteristics for the neigh-borhoods in which respondents lived at the age of twelve. Determination of neighborhood-level mobility from childhood to adulthood is possible only for those respondents who grew up in Los Angeles, but they account for the majority of sample: 90.0 percent of the 1.5 generation, 92.2 percent of the second generation, and 86.3 percent of the third generation.
Figure 6.2 shows the general eastward and northward drift of the Mexican American population across generations. The dispersion ellipse shows the shift from the childhood neighborhoods (triangles) to adult neighborhoods (circles). The distance moved is greatest for the 1.5 gen-eration, who are most likely to have grown up in barrios. Each succes-sive generation moves farther away from the ethnic clusters, increasing the size of the ellipse even as the average distance moved declines. The shape and rotation of the ellipse remain the same, reflecting a continuity
Source: Adapted from Immigration and Intergenerational Mobility in Metropolitan Los Angeles (see Bean, Leach et al. 2011) and Census CD (2002).
3rd generation
2nd generation
1.5 generation
Childhood address
Current address 0 3 6 12 18 24Miles
Figure 6.2 Dispersion of Childhood and Current Residence of the Mexican-Origin Population, by Generation, Metropolitan Los Angeles, 2004
14069-06-CH06_3rdPgs.indd 126 7/24/15 3:19 PM

Table 7.1 Means and Standard Deviations of Sociocultural Indicators, Mexican American Adults and Non-Hispanic Whites, Aged Twenty to Forty, by Generation and Gender, Los Angeles, 2004
1.0 1.5 2.0 2.5 3.0 3.5Non-Hispanic
White
Mean SD Mean SD Mean SD Mean SD Mean SD Mean SD Mean SD
Prefers English at home
0.02 0.13 0.39 0.49 0.57 0.50 0.80 0.40 0.95 0.23 0.99 0.12 0.99 0.25
Speaks Spanish very well
0.98 0.13 0.61 0.50 0.56 0.50 0.35 0.48 0.13 0.34 0.03 0.17 0.00 0.05
Watches Spanish TV less than weekly
0.11 0.32 0.24 0.43 0.37 0.48 0.55 0.50 0.79 0.41 0.93 0.26 0.80 0.40
Ethnicity not important
0.08 0.27 0.13 0.34 0.16 0.37 0.15 0.35 0.32 0.47 0.26 0.44 0.33 0.47
Non-Catholic 0.14 0.35 0.28 0.45 0.35 0.48 0.39 0.49 0.39 0.50 0.57 0.50 0.82 0.38Attends religious services twice a year or less
0.18 0.39 0.18 0.39 0.22 0.41 0.25 0.44 0.32 0.47 0.34 0.48 — —
Ethnicity of marriage partner not important
0.71 0.45 0.81 0.40 0.82 0.39 0.83 0.38 0.84 0.37 0.93 0.26 0.92 0.28
Has non-Hispanic white spousea
0.02 0.15 0.08 0.27 0.10 0.30 0.20 0.40 0.23 0.43 0.42 0.50 0.75 0.43
Number of children ever bornb
2.27 1.35 1.67 1.35 1.29 1.40 1.71 1.45 1.92 1.75 1.14 1.14 0.84 1.14
N 125 308 456 171 38 68 402
Source: Data from Immigration and Intergenerational Mobility in Metropolitan Los Angeles (see Bean, Leach et al. 2011).aRestricted to persons who are married or partnered; sample sizes by generation are: 94 (1.0), 176 (1.5), 199 (2.0), 85 (2.5), 26 (3.0) & 33 (3.5).bRestricted to women; sample sizes by generation are: 54 (1.0), 155 (1.5), 230 (2.0), 85 (2.5), 13 (3.0), 35 (3.5).

Table 7.2 Intercorrelations for Sociocultural Indicators, Mexican American Adults, Aged Twenty to Forty, Los Angeles, 2004
Indicator Means A B C D E F G H I
A Prefers English at home
0.60 1.000
B Speaks Spanish very well
0.46 -0.158 1.000
C Watches Spanish TV less than weekly
0.41 0.421 -0.227 1.000
D Non-Catholic 0.35 0.134 -0.013 0.140 1.000E Attends religious
services twice a year or less
0.22 0.072 -0.082 0.060 -0.023 1.000
F Ethnicity not important
0.16 0.092 -0.096 0.123 0.081 0.051 1.000
G Ethnicity of marriage partner not important
0.82 0.057 -0.062 0.044 0.075 0.048 0.094 1.000
H Has non-Hispanic white spousea
0.07 0.192 -0.035 0.160 0.073 0.028 0.036 0.065 1.000
I Number of children ever bornb
1.14 -0.030 0.058 -0.057 -0.093 -0.116 -0.013 -0.041 0.042 1.000
Source: Data from Immigration and Intergenerational Mobility in Metropolitan Los Angeles (see Bean, Leach et al. 2011).aRestricted to persons who are married or partnered; sample sizes by generation are: 94 (1.0), 176 (1.5), 199 (2.0), 85 (2.5), 26 (3.0) & 33 (3.5).bRestricted to women; sample sizes by generation are: 54 (1.0), 155 (1.5), 230 (2.0), 85 (2.5), 13 (3.0), 35 (3.5).

Table 7.3 OLS Regression Coefficients from Models of Sociocultural Incorporation Indicators Regressed on Immigrant Generation, Migration-Status Background, and Control Variables, Mexican-Origin Adults, Aged Twenty to Forty, Los Angeles, 2004
A B C D E F G H I
1.5 Gen (reference) — — — — — — — — —2.0 Gen 0.143*** -0.001 0.113** 0.040 0.043 0.043 -0.002 -0.005 0.1092.5 Gen 0.350*** -0.226*** 0.296*** 0.101* 0.088* 0.020 0.020 0.043+ 0.1753.0 Gen 0.462*** -0.465*** 0.519*** 0.113 0.164* 0.181** 0.035 0.082+ 0.5073.5 Gen 0.525*** -0.555*** 0.667*** 0.281*** 0.178** 0.138** 0.115 0.144*** -0.294
Unauthorized background
-0.147** -0.203** 0.016 -0.028 0.065 0.021 -0.003 -0.014 0.076
Age 0.007* 0.001 0.001 -0.007** -0.003 0.004+ -0.003 0.005*** 0.108***Education 0.022*** 0.020* 0.017** 0.011 -0.001 0.001 0.006 0.009* -0.174***Number of siblings — — — — — — — — 0.030+
Constant -0.039 0.274* -0.014 0.362** 0.277* 0.008 0.822*** -0.194** 0.484
R-Squared 0.173 0.125 0.150 0.033 0.016 0.018 0.010 0.054 0.300
Source: Data from Immigration and Intergenerational Mobility in Metropolitan Los Angeles (see Bean, Leach et al. 2011).Note: A: Prefers English at home; B: speaks Spanish very well; C: watches Spanish TV infrequently; D: non-Catholic; E: infrequent religious attendance; F: ethnic identity not important; G: not important to marry same race/ethnicity; H: non-Hispanic white spouse; I: number of children ever born.*** p < .001; ** p < .01; * p < .05; + p < .10.

150 Parents Without Papers
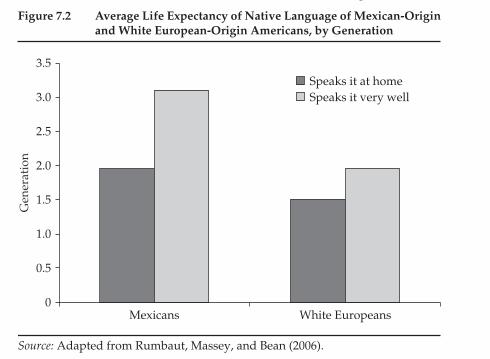
calculate linguistic survival probabilities and language “life expectancies” that “give the average number of generations a foreign language can be expected to survive within the cultural and linguistic milieu of contem-porary Southern California.”9 The conversion of such probabilities to life expectancies enables the statement of results in terms of the average num-ber of generations a language can be expected to “live” (that is, survive). For Mexican Americans, this yields a figure of about three generations on average for continuing to speak Spanish “very well,” as opposed to two generations on average for continuing to prefer speaking mother tongue at home (figure 7.2). The low levels of retention of Spanish proficiency and household usage thus imply that heritage language preservation for later-generation Mexican Americans is minimal in the United States. And in the case of preferring to speak only English at home, a classic assimila-tion pattern of steady increase from the 1.5 to the later generations occurs. As previously noted, this undoubtedly results in large measure from the dynamics of exposure, which clearly are strong enough to override other kinds of influence that might be pushing or pulling linguistic incorpora-tion in other directions.
Source: Data from Immigration and Intergenerational Mobility in Metropolitan Los Angeles (see Bean, Leach et al. 2011).
0.00
0.10
0.20
0.30
0.40
0.60
0.50
0.70
0.80
0.90
1.00
1.0 1.5 2.0Generation in the United States
2.5 3.0 3.5
Prop
orti
on
Mexican Americans
White Europeans
Figure 7.1 Fluency in Mother Tongue, Mexican Americans and White Europeans, by Generation
The Mosaic of Sociocultural Integration 151
Of course, agency is not altogether absent from the process of English acquisition in the case of Mexican Americans. Mexican first- and second-generation immigrants are more likely than those from any other coun-try to show low levels of English proficiency on average (in large part because until recently, most have had little exposure to English in Mexico, either on the street or in school, compared with immigrants from other countries, although this has been changing rapidly).10 For these and other reasons, Mexican immigrants start at the very bottom of the occupational structure in the United States. Because of beginning at such low points, they also have the most to gain from integration, which implies they may be motivated to try especially hard to acquire English. If this were the case, it should be reflected in their patterns of English usage. For exam-ple, Mexican immigrants should be relatively more likely to speak only English under circumstances that seem likely to foster upward mobility, even though in general Mexican immigrants have low levels of educa-tion. In fact, Mexican Americans who are not at the very bottom of the education distribution and who have young children (whose presence we might reasonably expect to motivate English usage at home), are more likely than those with little education and no children to use only English at home (by a difference of 10 percentage points).11 In short, English-only
Source: Adapted from Rumbaut, Massey, and Bean (2006).
0
0.5
1.0
1.5
2.0
2.5
3.0
3.5
Mexicans White Europeans
Gen
erat
ion
Speaks it at homeSpeaks it very well
Figure 7.2 Average Life Expectancy of Native Language of Mexican-Origin and White European-Origin Americans, by Generation

Mexican Migration and Integration 163
0
20
40
60
80
100
120
140
160
180
200
1981 1986 1991 1996 2001 2006 2011
Thr
ee-y
ear
mov
ing
aver
age
(tho
usan
ds)
Mexico
Philippines
China
0
1
2
3
4
5
6
7
8
1990 1995 2000 2005 2010
Mill
ions Mexico
El Salvador
Sources: Hoefer, Rytina, and Baker (2011); Passel and Cohn (2011); Passel, Van Hook, and Bean (2004); U.S. Department of Homeland Security (2003, 2009, 2012); U.S. Immigration and Naturalization Service (1987, 1994, 1999). Adapted from figure 1 in Bean, Bachmeier, Brown, Van Hook, and Leach 2014.aExcludes persons legalized under the provisions of the 1986 Immigration Control and Reform Act (IRCA).bAnnual estimates are shown for Mexicans between 2000 and 2010.
Stock of unauthorized migrants in the United States, by decadeb
Flows of legal permanent residentsa
Figure 8.1 Legal Permanent Residency and Unauthorized Migration from Mexico and from Countries of Next Largest Migration, 1981 to 2010
14069-08-CH08_4thPgs.indd 163 7/24/15 3:19 PM

Source: U.S. Department of Homeland Security, Office of Immigration Statistics. Adapted from figure 2 in Bean, Bachmeier, Brown, Van Hook, and Leach (2014). Note: I-94 only.
Mexico
Japan
United Kingdom
0
2
4
6
8
10
12
14
1993 1995 1998 2000 2002 2004 2006 2008 2010
Fiscal year
Non
imm
igra
nt a
dm
issi
ons
(mill
ions
)
China, Korea, and India
Figure 8.2 Nonimmigrant Admissions to the United States from Japan, Mexico, and the United Kingdom and from China-Korea-India, 1993 to 2009
Source: U.S. Department of Homeland Security, Office of Immigration Statistics. Adapted from figure 3 in Bean, Bachmeier, Brown, Van Hook, and Leach (2014).
0
20
40
1986 1990 1994 1998 2002 2006 2010
60
80
100
120
140
160
180
200
Ad
mis
sion
s (t
hous
and
s)
Specialty occupations (H1B)Seasonal agricultural (H2A)Seasonal nonagricultural (H2B)
Figure 8.3 Temporary Mexican Worker Admissions to the United States, by Visa Type, 1986 to 2011

Mexican Migration and Integration 175
Source: Adapted from Bean, Leach et al. (2011); Decennial U.S. Census Public-Use Micro-Data for 1970 to 2000 and 2010 American Community Survey Data, Ruggles et al. (2010).
0
2
4
6
8
10
12
14
16
1970 1980 1990 2000 2010
Mill
ions
Mill
ions
0
2
4
6
8
10
12
14
16
1970 1980 1990 2000 2010
B. Women
A. Men
Native, less than high school Native, high schoolForeign, less than high school Foreign, high school
Figure 8.4 Trends in the Education Background of the Less-Skilled U.S. Workforce, Aged Twenty-five to Forty-four, by Gender and Nativity, 1970 to 2010
178 Parents Without Papers
Source: Decennial U.S. Census Public-Use Micro-Data for 1970 to 2000 and 2010 American Community Survey Data, Ruggles et al. (2010).
–2
–1.5
–2.5
–1
–0.5
0
0.5
1
1.5
2
1970 to 1980 1980 to 1990 1990 to 2000 2000 to 2010
1970 to 1980 1980 to 1990 1990 to 2000 2000 to 2010
A. Less than high school
–2
–1.5
–1
–0.5
0
0.5
1
1.5
2
2.5
3
3.5
4
B. High school diploma
Inte
rcen
sal c
hang
e (m
illio
ns)
Inte
rcen
sal c
hang
e (m
illio
ns)
U.S. born Foreign born
Figure 8.5 Change in the Number of Males in the Less-Skilled U.S. Workforce, Aged Twenty-five to Forty-four, by Nativity, Education Background, and Decade, 1970 to 2010
14069-08-CH08_4thPgs.indd 178 7/27/15 1:32 PM

Mexican Migration and Integration 179
Source: Decennial U.S. Census Public-Use Micro-Data for 1970 to 2000 and 2010 American Community Survey Data, Ruggles et al. (2010).Note: While the broad preference categories that existed under the McCarran- Walter Act privileged highly skilled immigrants, the Hart-Celler Act empha-sized family reunification criteria as the fundamental bases for immigrant entry. Four of the top five preference categories gave priority to the reunification of families and amounted to nearly three-fourths of the slots (Zollberg 2006). In addition, the law added parents of adult U.S. citizens to the list of immigrants not subject to numerical limitations (Keely 1971). But family-based entries had now to occur within the framework of overall limits. Notably, the new Western Hemisphere cap of 120,000 was less than the average annual migration then occurring from the region. A ceiling of 120,000 visas per year was placed on the total number of legal immigration admissions, which included legal migrants from Mexico.
–3.5
–2.5
–1.5
–0.5
0.5
1.5
2.5
3.5
1970 to 1980 1980 to 1990 1990 to 2000 2000 to 2010
1970 to 1980 1980 to 1990 1990 to 2000 2000 to 2010
A. Less than high school
–3.5
–2.5
–1.5
–0.5
0.5
1.5
2.5
3.5
B. High school diploma
Inte
rcen
sal c
hang
e (m
illio
ns)
Inte
rcen
sal c
hang
e (m
illio
ns)
U.S. born Foreign born
Figure 8.6 Change in the Number of Females in the Less-Skilled U.S. Workforce, Aged Twenty-five to Forty-four, by Nativity, Education Background, and Decade, 1970 to 2010
14069-08-CH08_4thPgs.indd 179 7/27/15 1:32 PM
202 Appendix B
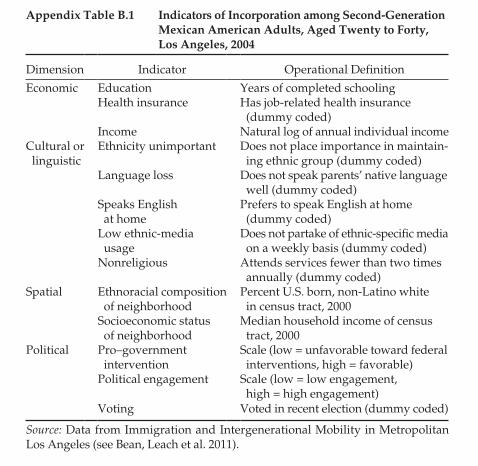
Appendix Table B.1 Indicators of Incorporation among Second-Generation Mexican American Adults, Aged Twenty to Forty, Los Angeles, 2004
Dimension Indicator Operational Definition
Economic Education Years of completed schoolingHealth insurance Has jobrelated health insurance
(dummy coded)Income Natural log of annual individual income
Cultural or linguistic
Ethnicity unimportant Does not place importance in maintain ing ethnic group (dummy coded)
Language loss Does not speak parents’ native language well (dummy coded)
Speaks English at home
Prefers to speak English at home (dummy coded)
Low ethnicmedia usage
Does not partake of ethnicspecific media on a weekly basis (dummy coded)
Nonreligious Attends services fewer than two times annually (dummy coded)
Spatial Ethnoracial composition of neighborhood
Percent U.S. born, nonLatino white in census tract, 2000
Socioeconomic status of neighborhood
Median household income of census tract, 2000
Political Pro–government intervention
Scale (low = unfavorable toward federal interventions, high = favorable)
Political engagement Scale (low = low engagement, high = high engagement)
Voting Voted in recent election (dummy coded)
Source: Data from Immigration and Intergenerational Mobility in Metropolitan Los Angeles (see Bean, Leach et al. 2011).
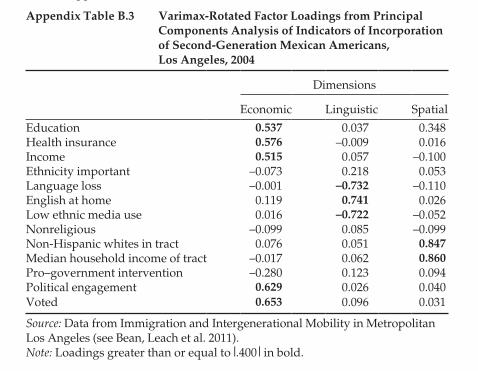
We use a statistical technique called principal components analysis to assess the multidimensionality of the incorporation structure within Los Angeles. This approach helps to reveal both the number of dimensions of incorporation and the extent to which these dimensions take on similar or different structures in accordance with the ideas introduced earlier. It shows which indicators constitute a particular dimension and how tightly they bundle together in doing so. Of course, no absolute criterion exists for determining whether a structure is unidimensional or multidimensional. The answers yielded by our approach depend as much on theoretical as empirical considerations. To some extent, of course, the results also depend on the inputs to the analyses. However, and most important, any unidimensionality that does emerge among a given set of indicators does not depend on the particular inputs. That is, although we start with indicators in four broad integration domains, this does not preclude most or all of the indicators bundling together on a single principal component. We are especially interested in the extent to which indicators do not bundle together. As expected, Los Angeles reveals a multidimensional structure, with three separate multiindicator incorporation

Appendix B 203
components emerging (economicpolitical, spatial, and linguistic) (see appendix table B.3).
To ascertain whether a component (or dimension) was meaningful, we require that it show an eigenvalue greater than 1.10 (implying that the amount of variation explained by its components exceeds chance by 10 percent or more) and that this occur “above the elbow” of a scree plot of eigenvalues for all components.3 Because we have relatively few indicators and many are not continuous, we did not employ confirmatory factor analyses to assess the structure of the components. The first principal component extracted always (by definition) explains the most variance and invariably involves the greatest number of indicators.4 Moreover, the more variance the first component explains, the more the component reflects consolidation toward a unidimensional general pattern, which in the present case would reflect unidimensional integration. It is notable that this does not happen in the analyses, with the first component not markedly overwhelming the other two notable components that emerge.
It is worth noting that political and economic aspects of incorporation bundle closely together in the first component. This implies that the aspects of political incorporation examined here vary as a function of economic incorporation. In
Appendix Table B.2 Means and Standard Deviations for Indicators of Incorporation among Second-Generation Mexican Americans, Aged Twenty to Forty, Los Angeles, 2004
Los Angeles (N = 935)
Mean SD
Economic Education 13.7 2.4 Health insurance 0.53 0.50 Income 8.2 3.8
LanguageCulture Ethnicity unimportant 0.83 0.38 Language loss 0.33 0.47 English at home 0.69 0.43 No ethnic media 0.52 0.50 Nonreligious 0.36 0.48
Spatial NonHispanic whites in neighborhood 0.27 0.21 Median household income in tract 43,975 16,985
Political Pro–government intervention 4.4 1.2 Political engagement 0.0 1.0 Voted 0.38 0.48
Source: Data from Immigration and Intergenerational Mobility in Metropolitan Los Angeles (see Bean, Leach et al. 2011).Note: See table B.1 for variable definitions.
204 Appendix B
other words, the higher the socioeconomic status of the respondent, the more politically involved that person is. It is also worth highlighting that no multiindicator sociocultural dimension emerges, with the exception of one largely defined by linguistic indicators. This does not mean that sociocultural facets of incorporation are unimportant, only that indicators such as ethnic group importance, religious behavior, and language usage do not bundle or covary strongly with one another. The language component reflects the tendency of immigrants everywhere to learn the hostcountry language, irrespective of their other characteristics, especially when that language is English.5 But the sociocultural aspects of incorporation do not hang together among themselves to the same degree as do the aspects of the other major dimensions. This confirms our expectation that we can less readily predict one facet of sociocultural incorporation from another, a result in keeping with postindustrialindividualistic theoretical perspective on integration, which views sociocultural phenomena as having become more independent, “optional,” and situationally fluid in recent decades.
We have focused exclusively on the degree to which indicators of incorporation take on a multidimensional structure, but we have not addressed the degree to which the three dimensions are related to one another. The dimensional structure reported in table B.3 is based on an orthogonal factor rotation solution, which means, by definition, the three incorporation dimensions are perfectly independent of one another (that is, their intercorrelation is zero). Such independence between factors is not assumed, however, when the factor rotation is done using
Appendix Table B.3 Varimax-Rotated Factor Loadings from Principal Components Analysis of Indicators of Incorporation of Second-Generation Mexican Americans, Los Angeles, 2004
Dimensions
Economic Linguistic Spatial
Education 0.537 0.037 0.348Health insurance 0.576 –0.009 0.016Income 0.515 0.057 –0.100Ethnicity important –0.073 0.218 0.053Language loss –0.001 –0.732 –0.110English at home 0.119 0.741 0.026Low ethnic media use 0.016 –0.722 –0.052Nonreligious –0.099 0.085 –0.099NonHispanic whites in tract 0.076 0.051 0.847Median household income of tract –0.017 0.062 0.860Pro–government intervention –0.280 0.123 0.094Political engagement 0.629 0.026 0.040Voted 0.653 0.096 0.031
Source: Data from Immigration and Intergenerational Mobility in Metropolitan Los Angeles (see Bean, Leach et al. 2011).Note: Loadings greater than or equal to |.400 | in bold.

208 Appendix C
Projecting the Educational Profile of Third-Plus Generation Mexican AmericansTo approximate empirically the degree to which historical legacy effects and ethnic attrition have affected the observed educational attainments of the Mexican American third-plus generation, we present in appendix table C.1 results from demographic projections calculated under sets of alternative assumptions. The first objective is to estimate the educational attainment profile of Mexican-origin women aged twenty-five to forty in 2010, using as our starting point the female Mexican-origin population observed in microdata from the 1940 census.8 The 1940 population is thus survived forward using inputs for levels of mortality, fertility (with the assumed rate varying with educational attainment), ethnic attri-tion, immigration from Mexico, and state of residence. We systematically vary these inputs one at a time to gauge their effects on generational differences in
Appendix Table C.1 Prevalence of Education Beyond High School, Mexican-Origin Women, Aged Twenty-five to Forty, by Generation, United States, 2010 (percentage)
Generation 3rd-Plus Deficit or Surplus
Exceeds or Falls Below
Baseline1st 2nd 3rd-Plus
1. Observed (2010 CPS) 23.0 53.0 50.0 -3.0 —2. Baseline percentages 23.6 53.4 50.2 -3.2 -0.23. If everyone lived in Texas 23.6 53.0 47.7 -5.3 -2.14. If everyone lived in
California23.5 53.7 55.7 2.0 5.2
5. If there were no ethnic attrition
23.6 53.8 55.6 1.8 5.0
6. If there were no fertility gradient
23.6 54.6 51.6 -3.0 0.2
7. If there were constant immigration
23.3 52.7 51.6 -1.1 2.1
8. If there were no change in immigrant educational attainment
1.0 50.6 50.2 -0.4 2.8
9. If (4), (5), (6), (7), and (8) above
1.0 51.2 65.4 14.2 17.6
Source: March 2010 Current Population Survey; Bachmeier and Van Hook 2013.Note: The observed results are based on the authors’ analyses of the March 2010 Current Population Survey. The estimated results are based on projections of the Mexican-born population in the United States from 1940 to 2010 under varying assumptions about the effects of state of residence, ethnic attrition, the educa-tional gradient in fertility, the level of Mexican immigration, and the level and educational attainment of Mexican immigrants (Bachmeier and Van Hook 2013).
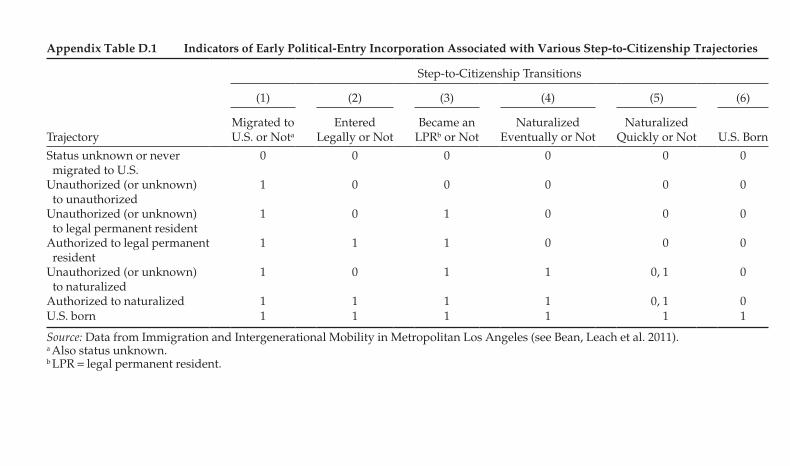
Appendix Table D.1 Indicators of Early Political-Entry Incorporation Associated with Various Step-to-Citizenship Trajectories
Step-to-Citizenship Transitions
(1) (2) (3) (4) (5) (6)
TrajectoryMigrated to U.S. or Nota
Entered Legally or Not
Became an LPRb or Not
Naturalized Eventually or Not
Naturalized Quickly or Not U.S. Born
Status unknown or never migrated to U.S.
0 0 0 0 0 0
Unauthorized (or unknown) to unauthorized
1 0 0 0 0 0
Unauthorized (or unknown) to legal permanent resident
1 0 1 0 0 0
Authorized to legal permanent resident
1 1 1 0 0 0
Unauthorized (or unknown) to naturalized
1 0 1 1 0, 1 0
Authorized to naturalized 1 1 1 1 0, 1 0U.S. born 1 1 1 1 1 1
Source: Data from Immigration and Intergenerational Mobility in Metropolitan Los Angeles (see Bean, Leach et al. 2011).a Also status unknown.b LPR = legal permanent resident.
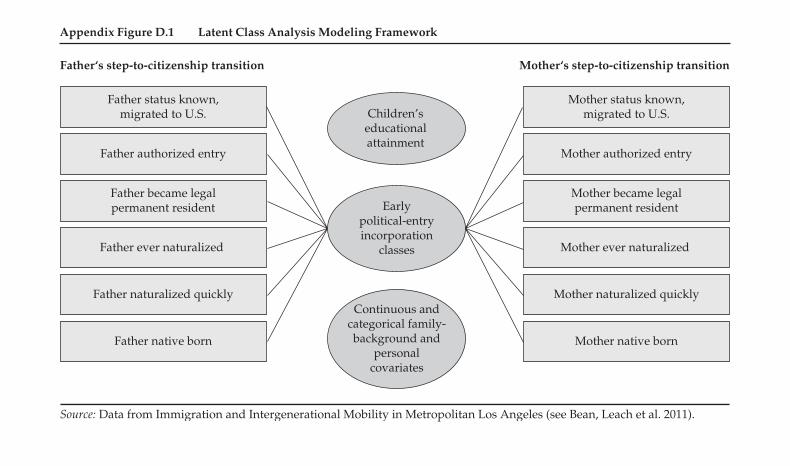
Father‘s step-to-citizenship transition Mother‘s step-to-citizenship transition
Source: Data from Immigration and Intergenerational Mobility in Metropolitan Los Angeles (see Bean, Leach et al. 2011).
Father status known,migrated to U.S.
Father authorized entry
Father became legalpermanent resident
Father ever naturalized
Father naturalized quickly
Father native born
Mother status known,migrated to U.S.
Mother authorized entry
Mother became legalpermanent resident
Mother ever naturalized
Mother naturalized quickly
Mother native born
Continuous andcategorical family-background and
personalcovariates
Children’seducationalattainment
Earlypolitical-entryincorporation
classes
Appendix Figure D.1 Latent Class Analysis Modeling Framework