
Improving the Sound Pressure Level for a Simplified Passenger
Upload
nicklingatongCategory
view
222download
1
8/4/2019 Sound Pressure Level and Power
http://slidepdf.com/reader/full/sound-pressure-level-and-power 1/22
phon A unit of apparent loudness, equal in number to the intensity in decibels of a 1,000-hertz tone perceivedto be as loud as the sound being measured.
Sound Intensity
Sound Intensity is the Acoustic or Sound Power (W) per unit area. The SI-units for Sound Intensity areW/m 2 .
Sound Intensity Level
The dynamic range of human hearing and sound intensity spans from 10 -12 W/m 2 to 10 - 100 W/m 2 . Thehighest sound intensity possible to hear is 10,000,000,000,000 times as loud as the quietest!
This span makes the absolute value of the sound intensity impractical for normal use. A more convenientway to express the sound intensity is the relative logarithmic scale with reference to the lowest humanhearable sound - 10 -12 W/m 2 (0 dB) .Note! In US a reference of 10 -13 watts/m 2 are commonly used.
The Sound Intensity Level can be expressed as:LI = 10 log(I / I ref ) (1)whereLI = sound intensity level (dB)I = sound intensity (W/m 2 )I ref = 10 -12 - reference sound intensity (W/m 2 )The logarithmic sound intensity level scale match the human sense of hearing. Doubling the intensityincreases the sound level with 3 dB (10 log (2)) .
Example - Sound Intensity
The difference in intensity of 10 -8 watts/m 2 and 10 -4 watts/m 2 (10,000 units ) can be calculated in decibelsas
ΔL I = 10 log( (10 -4 watts/m 2 ) / (10 -12 watts/m 2 ) )- 10 log( ( 10 -8 watts/m 2 ) / ( 10 -12 watts/m 2 ) )= 40 dBIncreasing the sound intensity by a factor of
• 10 raises its level by 10 dB• 100 raises its level by 20 dB• 1,000 raises its level by 30 dB• 10,000 raises its level by 40 dB• and so on
Note! Since the sound intensity level may be difficult to measure, it is common to use sound pressure
level measured in decibels instead. Doubling the Sound Pressure raises the Sound Pressure Level with6 dB .
Loudness
Sound intensity and feeling of loudness:
• 110 to 225 dB - Deafening • 90 to 100 dB - Very Loud

8/4/2019 Sound Pressure Level and Power
http://slidepdf.com/reader/full/sound-pressure-level-and-power 2/22
• 70 to 80 dB - Loud • 45 to 60 dB - Moderate• 30 to 40 dB - Faint • 0 - 20 dB - Very Faint
Sound Power, Intensity and Distance to Source
The sound intensity decreases with distance to source. Intensity and distance can be expressed as:I = Lw / 4 π r 2 (2)whereLw = sound power (W)π = 3.14r = radius or distance from source (m)
Sound Intensity and Sound Pressure
The connection between Sound Intensity and Sound Pressure can be expressed as:I = p 2 / ρ c (3)
where p = sound pressure (Pa) ρ = density of air (1.2 kg/m 3 at 20 oC)c = speed of sound (331 m/s)
Sound Power
Sound power is the energy rate - the energy of sound per unit of time (J/s, W in SI-units) from a soundsource.
Sound Power Level
Sound power can more practically be expressed as a relation to the threshold of hearing - 10 -12
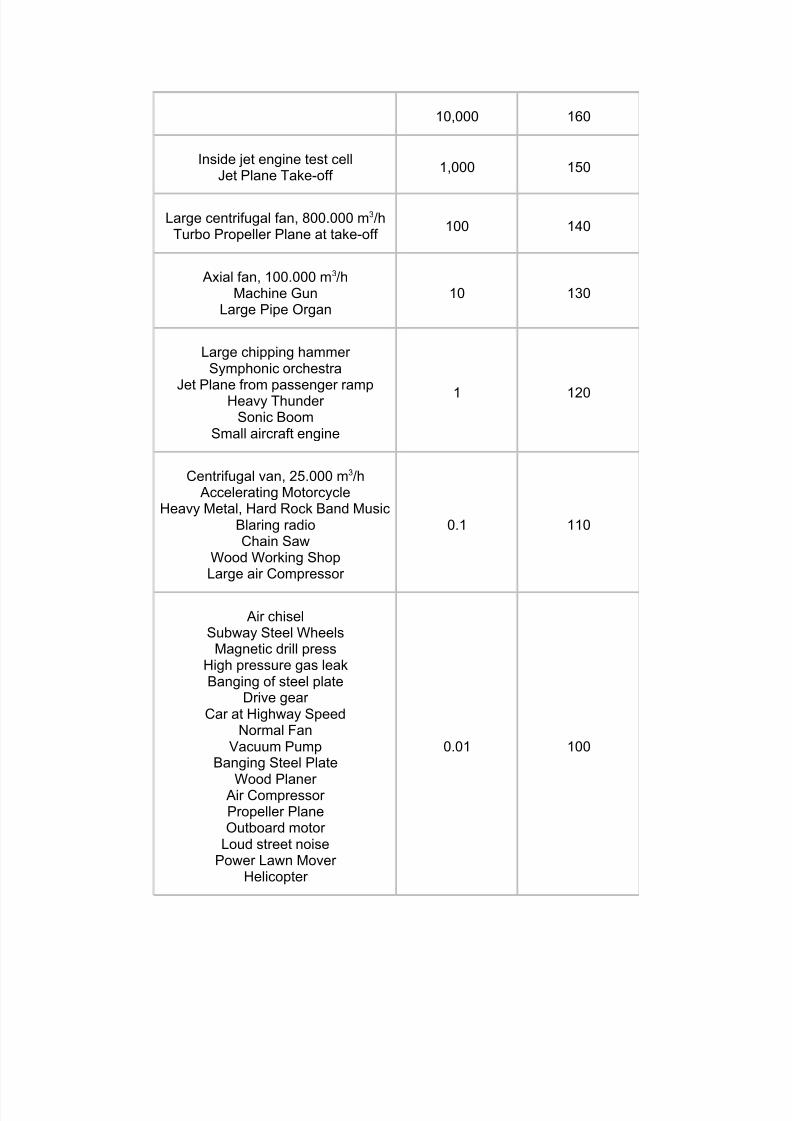
W - in alogarithmic scale named Sound Power Level -Lw , expressed asLw = 10 log (N / N o ) (1)whereLw = Sound Power Level in Decibel (dB)N = sound power (W)N o = 10 -12 - reference sound power (W).Human hearable Sound Power spans from 10 -12 W to 10 - 100 W , a range of 10/10 -12 = 10 13 .The table below indicates the Sound Power and the Sound Power Level from some common sources.
SourceSound Power
- N -
(W )
Sound Power Level- Lw -(dB )(re 10 -12 W )
Saturn Rocket 100,000,000 200
Turbo Jet Plane Engine 100,000 170
8/4/2019 Sound Pressure Level and Power
http://slidepdf.com/reader/full/sound-pressure-level-and-power 3/22
10,000 160
Inside jet engine test cellJet Plane Take-off 1,000 150
Large centrifugal fan, 800.000 m3/hTurbo Propeller Plane at take-off 100 140
Axial fan, 100.000 m3/hMachine Gun
Large Pipe Organ10 130
Large chipping hammer Symphonic orchestra
Jet Plane from passenger rampHeavy Thunder
Sonic BoomSmall aircraft engine
1 120
Centrifugal van, 25.000 m3/hAccelerating Motorcycle
Heavy Metal, Hard Rock Band MusicBlaring radioChain Saw
Wood Working ShopLarge air Compressor
0.1 110
Air chiselSubway Steel WheelsMagnetic drill press
High pressure gas leakBanging of steel plate
Drive gear Car at Highway Speed
Normal FanVacuum Pump
Banging Steel Plate
Wood Planer Air Compressor Propeller PlaneOutboard motor
Loud street noisePower Lawn Mover
Helicopter
0.01 100

8/4/2019 Sound Pressure Level and Power
http://slidepdf.com/reader/full/sound-pressure-level-and-power 4/22
Cut-off sawHammer mill
Small air compressor Grinder
Heavy diesel vehicleHeavy city trafficLawn mover
Airplane Cabin at normal flightKitchen Blender
Spinning MachinesPneumatic Jackhammer
0.001 90
Alarm clockDishwasher 0.0001 80
Toilet FlushingPrinting Press
Inside Railroad Car Noisy Office
Inside AutomobileClothes Dryer
Vacuum Cleaner
0.00001 70
Large department storeBusy restaurant or canteen
Ventilation FanNoisy Home
Average OfficeHair Dryer
0.000001 60
Room with window air conditioner Office Air Diffuser
Quiet OfficeAverage Home
Quit Street
0.0000001 50
Voice, lowSmall Electric Clock
Private OfficeQuiet HomeRefrigerator Bird Singing
Ambient WildernessAgricultural Land
0.00000001 40
Room in a quiet dwelling at midnight 0.000000001 30

8/4/2019 Sound Pressure Level and Power
http://slidepdf.com/reader/full/sound-pressure-level-and-power 5/22
Quiet ConversationBroadcast Studio
Rustling leaves
Empty AuditoriumWhisper Watch TickingRural Ambient
0.0000000001 20
Human Breath 0.00000000001 10
0.000000000001 0
The Decibel
Decibel is a logarithmic unit used to describe physical values like the ratio of the signal level - power,sound pressure, voltage or intensity.The decibel can be expressed as:decibel = 10 log( P / P ref ) (1)whereP = signal power (W)P ref = reference power (W)
Sound Power Level
Sound power is the energy rate - the energy of sound per unit of time (J/s, W in SI-units) from a soundsource.Sound power can more practically be expressed as a relation to the threshold of hearing - 10 -12 W - in alogarithmic scale named Sound Power Level -Lw : Lw = 10 log ( N / N o ) (2)whereLw = Sound Power Level in Decibel (dB)N = sound power (W)
• The lowest sound level that people of excellent hearing can discern has an acousticsound power about 10 -12 W, 0 dB
• The loudest sound generally encountered is that of a jet aircraft with a sound power of 105 W, 170 dB.
Sound Intensity
Sound Intensity is the Acoustic or Sound Power (W) per unit area. The SI-units for Sound Intensity areW/m2.The Sound Intensity Level can be expressed as:LI = 10 log( I / I ref ) (3)whereLI = sound intensity level (dB)I = sound intensity (W/m 2 )
8/4/2019 Sound Pressure Level and Power
http://slidepdf.com/reader/full/sound-pressure-level-and-power 6/22
I ref = 10 -12 - reference sound intensity (W/m 2 )
Sound Pressure Level
The Sound Pressure is the force (N) of sound on a surface area (m 2) perpendicular to the direction of thesound. The SI-units for the Sound Pressure are N/m 2 or Pa.The Sound Pressure Level:L p = 10 log( p 2 / p ref
2 ) = 10 log( p / p ref )2 = 20 log ( p / p ref ) (4)whereL p = sound pressure level (dB)
p = sound pressure (Pa) p ref = 2 10 -5 - reference sound pressure (Pa)
• If the pressure is doubled, the sound pressure level is increased with 6 dB (20 log (2))
Sound Pressure
The Sound Pressure is the force ( N ) of sound on a surface area ( m 2 ) perpendicular to the direction of the
sound. The SI-units for the Sound Pressure are N/m2
or Pa .Sound is usually measured with microphones responding proportionally to the sound pressure - p . Thepower in a sound wave goes as the square of the pressure.(Similarly, electrical power goes as the square of the voltage.) The log of the square of x is just 2 log x, sothis introduces a factor of 2 when we convert to decibels for pressures.
The Sound Pressure Level
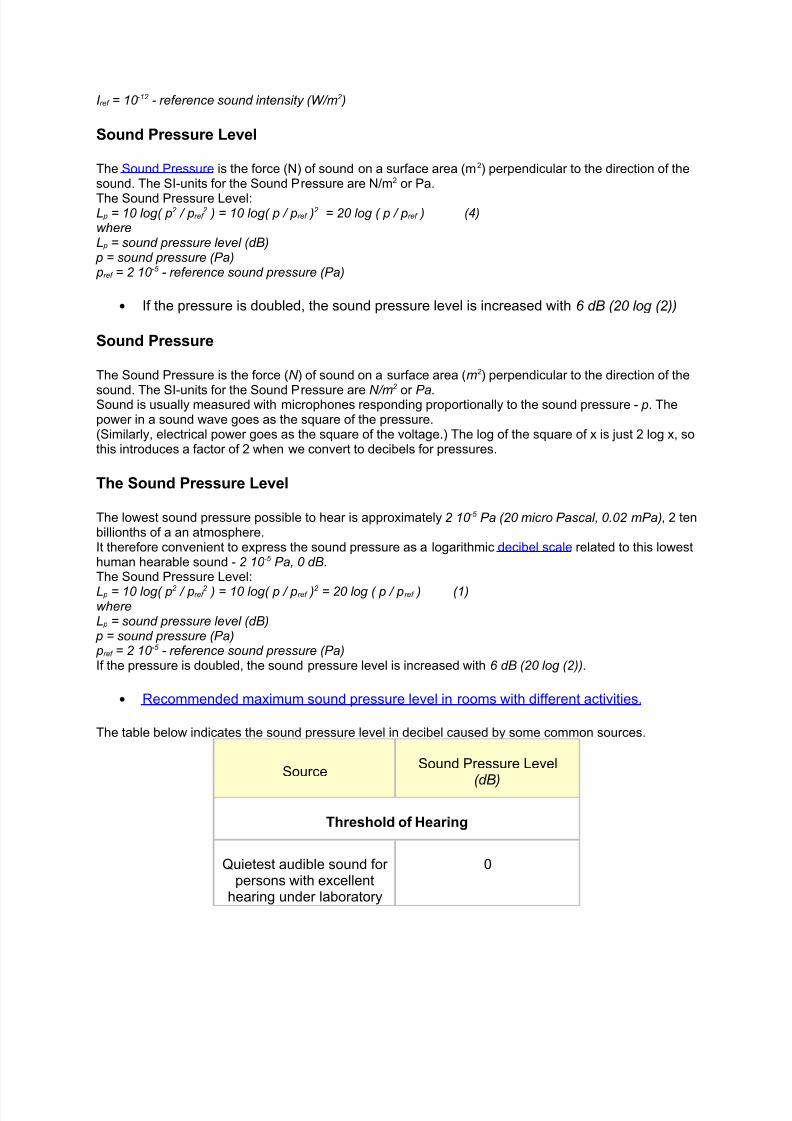
The lowest sound pressure possible to hear is approximately 2 10 -5 Pa (20 micro Pascal, 0.02 mPa) , 2 tenbillionths of a an atmosphere.It therefore convenient to express the sound pressure as a logarithmic decibel scale related to this lowesthuman hearable sound - 2 10 -5 Pa, 0 dB .The Sound Pressure Level:L p = 10 log( p 2 / p ref 2 ) = 10 log( p / p ref )2 = 20 log ( p / p ref ) (1)whereL p = sound pressure level (dB)
p = sound pressure (Pa) p ref = 2 10 -5 - reference sound pressure (Pa)If the pressure is doubled, the sound pressure level is increased with 6 dB (20 log (2)) .
• Recommended maximum sound pressure level in rooms with different activities.
The table below indicates the sound pressure level in decibel caused by some common sources.
Source Sound Pressure Level
(dB)
Threshold of Hearing
Quietest audible sound for persons with excellent
hearing under laboratory
0
8/4/2019 Sound Pressure Level and Power
http://slidepdf.com/reader/full/sound-pressure-level-and-power 7/22
conditions2)
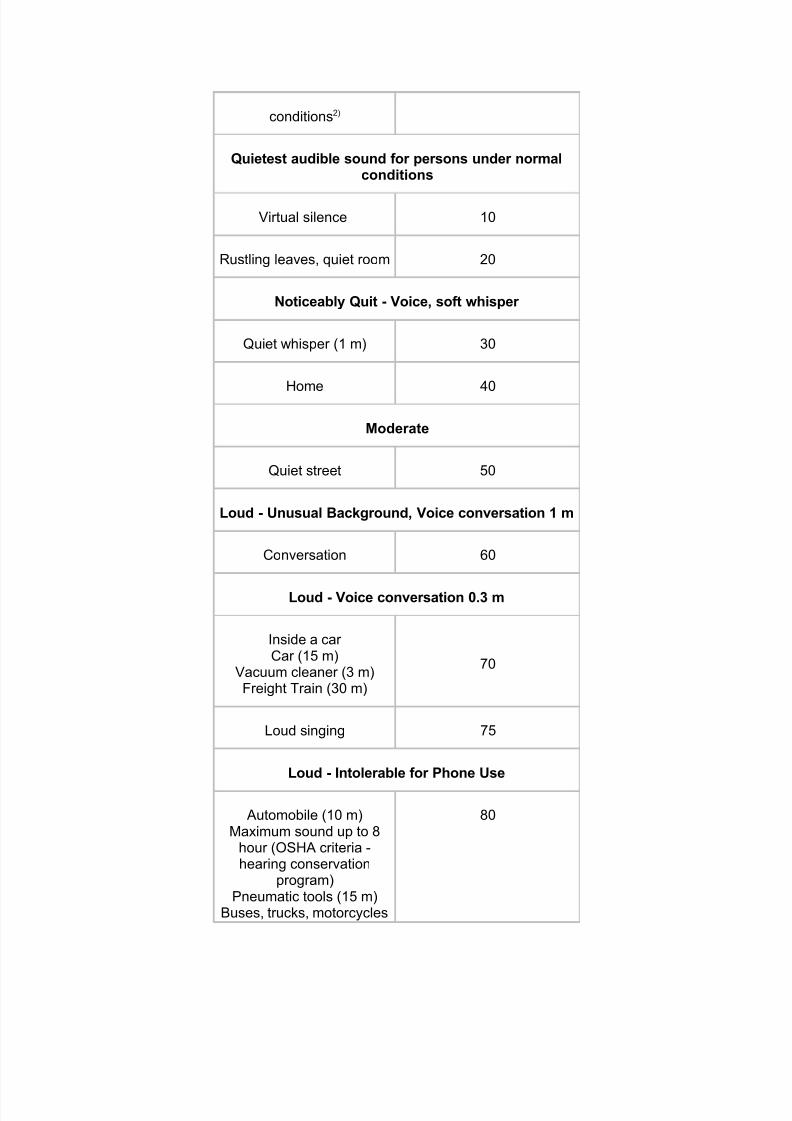
Quietest audible sound for persons under normalconditions
Virtual silence 10
Rustling leaves, quiet room 20
Noticeably Quit - Voice, soft whisper
Quiet whisper (1 m) 30
Home 40
Moderate
Quiet street 50
Loud - Unusual Background, Voice conversation 1 m
Conversation 60
Loud - Voice conversation 0.3 m
Inside a car Car (15 m)
Vacuum cleaner (3 m)Freight Train (30 m)
70
Loud singing 75
Loud - Intolerable for Phone Use
Automobile (10 m)Maximum sound up to 8
hour (OSHA criteria -hearing conservation
program)Pneumatic tools (15 m)
Buses, trucks, motorcycles
80

8/4/2019 Sound Pressure Level and Power
http://slidepdf.com/reader/full/sound-pressure-level-and-power 8/22
(15 m)
Motorcycle (10 m) 88
Food blender (1 m)Maximum sound up to 8hour (OSHA1) criteria -
engineering or administrative noise
controls)Jackhammer (15 m)
Bulldozer (15 m)
90
Subway (inside) 94
Very Loud
Diesel truck (10 m) 100
Lawn mower (1 m) 107
Pneumatic riveter (1 m) 115
Threshold of Discomfort
Large aircraft (150 m over head) 110
Chainsaw (1 m) 117
Deafening, Human pain limit
Amplified Hard Rock (2 m)Siren (30 m) 120
Jet plane (30 m)Artillery Fire (3 m) 130
Short exposure can cause hearing loss
Military Jet Take-off (30

8/4/2019 Sound Pressure Level and Power
http://slidepdf.com/reader/full/sound-pressure-level-and-power 9/22
meter)
Sound Pressure Level and Power
Sound Pressure Level
• ``Threshold of audibility'' or the minimum pressure fluctuation detected by the ear is lessthan of atmospheric pressure or about N/m at 1000 Hz.
• ``Threshold of pain'' corresponds to a pressure times greater, but still less than1/1000 of atmospheric pressure.
• Because of the wide range, sound pressure measurements are made on a logarithmicscale (decibel scale).
•
Sound Pressure Level (SPL) , where N/m .• SPL is proportional to the average squared amplitude.
Sound Power
• Total sound power emitted by a source in all directions.• Measured in watts (joules / second).
• Sound Power Level (PWL) = , where watts.
Sound Intensity
• Rate of energy flow across a unit area.
• Sound Intensity Level (IL) = , where watts/meter .
Multiple Sources
• Two equal sources produce a 3 dB increase in sound power level.• Two equal sources produce a 3 dB increase in sound pressure level, assuming no
interference.• Two 80 dB sources add to produce an 83 dB SPL.
Room acousticsA - Introduction
Much has been written in the popular and professional audio press about the acoustic treatmentof rooms. The purpose of such treatment is to allow us to hear more of the loudspeaker and lessof the room. I am convinced that a properly designed sound system can perform well in a greatvariety of rooms and requires only a minimum of room treatment if any at all.

8/4/2019 Sound Pressure Level and Power
http://slidepdf.com/reader/full/sound-pressure-level-and-power 10/22
To understand this claim let's look at the typical acoustic behavior of domestic size listeningrooms, which have linear dimensions that are small compared to the 17 m wavelength of a 20Hz bass tone, but are acoustically large when compared to a 200 Hz or 1.7 m wavelengthmidrange tone (G1 on the piano keyboard).
Below 200 Hz the acoustics of different locations in the room are dominated by discreteresonances. Above 200 Hz these resonances become so tightly packed in frequency and spacethat the room behaves quite uniformly and is best described by its reverberation time RT60.
Room treatment can be very effective above 200 Hz, but the same result may be obtained moreaesthetically with ordinary furnishings, wall decoration, rugs on the floor and the variety of stuff we like to surround ourselves with. How much treatment is needed, or how short thereverberation time should be, depends on the polar radiation characteristics of the loudspeaker.For my open baffle speaker designs a room becomes too dead when its RT60 falls below 500ms.
B - Loudspeaker directivity and room response
When a loudspeaker is placed in a room we hear both its direct sound, i.e. the sound whicharrives via the shortest path, and the room sound due to the resonances, reverberation andreflections caused by the boundaries of the room and the objects in it. The two soundssuperimpose and influence our perception of timbre, timing and spatial location of the virtualsound source. Thus, the off-axis radiation of the speaker has great influence on the naturalnessof sound reproduction even when you listen on-axis and the more so, the further you sit awayfrom the speaker.
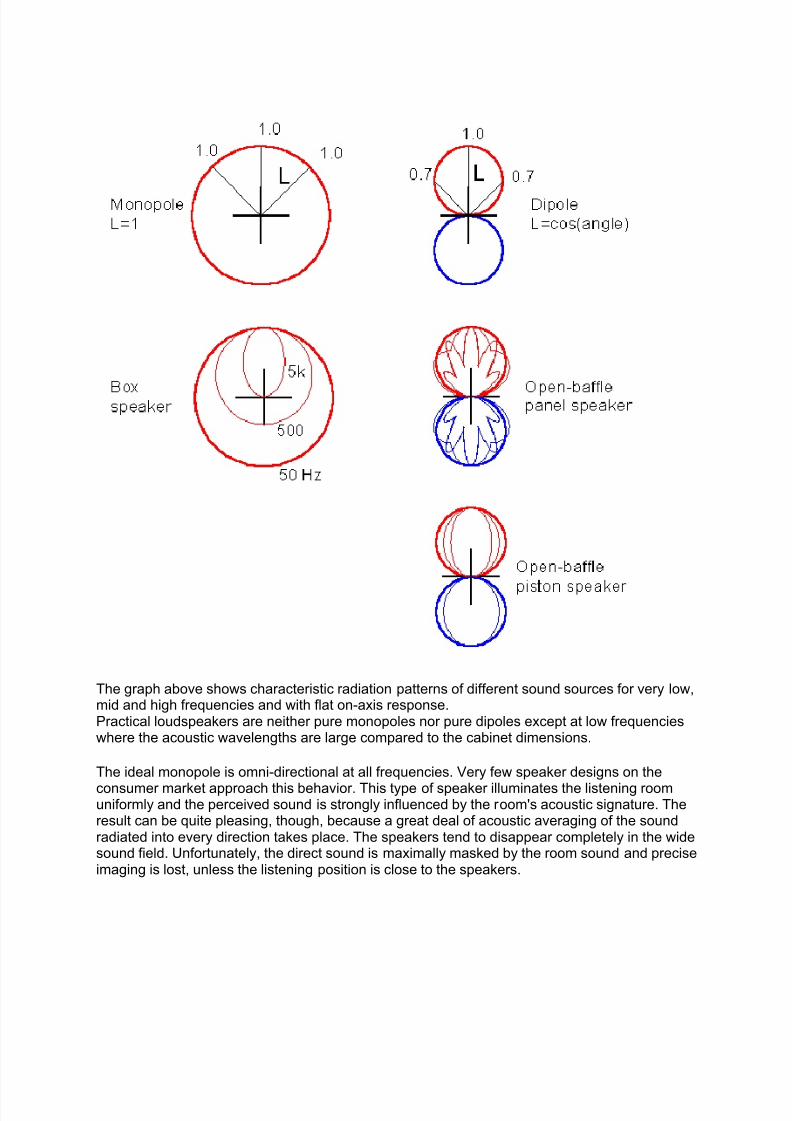
Two basic and fundamentally different sources of sound are the monopole and the dipoleradiator. The ideal monopole is an acoustically small pulsating sphere, and the ideal dipole is aback and forth oscillating small sphere. The monopole radiates uniformly into all directions,whereas the dipole is directional with distinct nulls in the plane vertical to its axis of oscillation.The 3-dimensional radiation or polar pattern of the monopole is like the surface of a basket ball,the dipole's is like two ping-pong balls stuck together. At +/-45 degrees off-axis the dipoleresponse is L = cos(45) = 0.7 or 3 dB down, the monopole is unchanged with L = 1.
8/4/2019 Sound Pressure Level and Power
http://slidepdf.com/reader/full/sound-pressure-level-and-power 11/22
The graph above shows characteristic radiation patterns of different sound sources for very low,mid and high frequencies and with flat on-axis response. Practical loudspeakers are neither pure monopoles nor pure dipoles except at low frequencieswhere the acoustic wavelengths are large compared to the cabinet dimensions.
The ideal monopole is omni-directional at all frequencies. Very few speaker designs on theconsumer market approach this behavior. This type of speaker illuminates the listening roomuniformly and the perceived sound is strongly influenced by the room's acoustic signature. Theresult can be quite pleasing, though, because a great deal of acoustic averaging of the soundradiated into every direction takes place. The speakers tend to disappear completely in the widesound field. Unfortunately, the direct sound is maximally masked by the room sound and preciseimaging is lost, unless the listening position is close to the speakers.

8/4/2019 Sound Pressure Level and Power
http://slidepdf.com/reader/full/sound-pressure-level-and-power 12/22
The typical box speaker, whether vented, band-passed or closed, is omni-directional at lowfrequencies and becomes increasingly forward-directional towards higher frequencies. Evenwhen flat on-axis, the total acoustic power radiated into the room drops typically 10 dB (10x) or more between low and high frequencies. The uneven power response and the associatedstrong excitation of low frequency room modes contributes to the familiar (and often desired :-( )generic box loudspeaker sound. This cannot be the avenue to sound reproduction that is true tothe original.
The directional response of the ideal dipole is obtained with open baffle speakers at lowfrequencies. Note, that to obtain the same on-axis sound pressure level as from a monopole, adipole needs to radiate only 1/3rd of the monopole's power into the room. This means 4.8 dBless contribution of the room's acoustic signature to the perceived sound. It might also mean 4.8dB less sound for your neighbor, or that much more sound to you. Despite this advantage dipolespeakers are often not acceptable, because they tend to be constructed as physically largepanels that interfere with room aesthetics, and they seem to suffer from insufficient bass output,critical room placement and a narrow "sweet spot".
These claims are true to varying degree depending on the specific design of a given panelloudspeaker. Because of the progressive acoustic short circuit between front and rear as thereproduced signal frequency decreases, the membrane of an open-baffle speaker has to movemore air locally than the driver cone of a box speaker for the same SPL at the listening position.This demands a large radiating surface area, because achievable excursions are usually smallfor electrostatic or magnetic panel drive. The obtained volume displacement limits the maximumbass output. Non-linear distortion, though, is often much lower than for dynamic drivers. Largeradiating area means that the panel becomes multi-directional with increasing frequency whichcontributes to critical room placement and listening position.
If the open-baffle speaker is built with conventional cone type dynamic drivers of large excursioncapability, then adequate bass output and uniform off-axis radiation are readily obtainable in apackage that is more acceptable than a large panel, though not as small as a box speaker.Such speakers were built by Audio Artistry Inc. and a DIY project is described on this web site inthe PHOENIX pages. This type of speaker has a much more uniform power response than thetypical box speaker. Not only is its bass output in proportion to the music, because roomresonance contribution is greatly reduced, but also the character of the bass now sounds morelike that from real musical instruments. My hypothesis is that three effects combine to producethe greater bass clarity:1 - An open baffle, dipole speaker has a figure-of-eight radiation pattern and therefore excitesfewer room modes.2 - Its total radiated power is 4.8 dB less than that of a monopole for the same on-axis SPL.Thus the strength of the excited modes is less.3 - A 4.8 dB difference in SPL at low frequencies is quite significant, due to the bunching of theequal loudness contours at low frequencies, and corresponds to a 10 dB difference in loudnessat 1 kHz.Thus, bass reproduced by a dipole would be less masked by the room, since a dipole excitesfewer modes, and to a lesser degree, and since the perceived difference between direct soundand room contribution is magnified by a psychoacoustic effect.,
The off-axis radiation behavior of a speaker determines the degree to which speaker placementand room acoustics degrade the accuracy of the perceived sound. Worst in this respect is the

8/4/2019 Sound Pressure Level and Power
http://slidepdf.com/reader/full/sound-pressure-level-and-power 13/22
typical box speaker, followed by the large panel area dipole and the truly omni-directionaldesigns. Least affected is the sound of the open-baffle speaker with piston drivers. (Ref.1)
Often concern is expressed over the fact that the rear radiation from a dipole is out of phasewith the front radiation, and that thus any sound reflected from a wall behind the speaker wouldcancel sound coming from the front of the speaker. Cancellation can only occur when direct andreflected sounds are exactly of opposite phase (180 degrees) and of the same strength. Sincedirect and reflected sounds travel paths of different length, they undergo different amounts of phase shift. Thus, the phase and magnitude conditions for cancellation are given only at certainfrequencies, if at all. At some other frequencies direct and reflected sounds will add. The samealso applies to a monopole speaker in front of a wall. The only difference is in the frequenciesfor which addition and subtraction occur. The best remedy is to move the speaker away fromthe wall, or to make the wall as sound absorptive or diffusive as possible. (FAQ31)Top
C - Room reverberation time T60
The Reverberation Time - T a - for a room is the time it takes before the sound pressure level hasdecreased with 60 dB after the sound source is terminated.The Reverberation Time - T a - can be calculated as:
Mean sound absorption coefficient α m <= 0.35 :
T a = 0.16 V / A (1)whereT a = reverberation time (s)V = room volume (m 3 )
A = the sound absorption of the room (m 2 Sabine)
Mean sound absorption coefficient α m > 0.35
Reverberation time is the single most important parameter describing a room's acousticbehavior. The following discussion might get a little technical but will illustrate how sound buildsup and decays in a room and the effect it has upon clarity of reproduction.
C1 - Sound waves between two wallsTake the example of a speaker in a wall and a second wall at distance L in front of it. As thecone vibrates it will send out an acoustic wave which gets reflected back by the second wall,returns to the first wall, gets reflected again back to the second wall and so on. If the frequencyof vibration is such that the distance L corresponds to half of a wavelength, then the conemovement is in phase with the reflected wave and the sound pressure keeps building up.Eventually an equilibrium is reached between the energy supplied by the cone movement andthe energy absorbed by the two walls and the air in between.

8/4/2019 Sound Pressure Level and Power
http://slidepdf.com/reader/full/sound-pressure-level-and-power 14/22
This is a standing wave resonance or mode condition and if we change the frequency of conevibration, we trace out the resonance curve that is typical for any simple system containingmass, compliance and energy loss. As frequency is increased another resonance occurs whenL equals to a full wavelength, to 3/2 wavelengths, 4/2 and so on. The lowest possible frequency
isf min = c / (2 L) Hz, where c=343 m/s (1)
If the excitation is applied as a step function, then the sound pressure will rise from 10% to 90%of its steady-state level within a time
Trise = 0.7 / BW (2)
where BW is the width of the resonance curve in Hz at the half power (-3 dB) level. The SPL willdecay to one millionth (-60 dB) of its full level after a time
T60 = 2.2 / BW (3)
The quality factor or Q of the resonance is
Q = n f min / BW (4) with n = 1, 2, 3, etc.
Example 1L=25 ft (7.63 m), then f min = 343/(2*7.63) = 22.5 Hz and no resonance below this frequency. Thenext higher resonance will be at 45 Hz, then 67.5 Hz, 90 Hz, 112.5 Hz and so on.If we had measured Trise = 202 ms at 45 Hz, then from (2) BW = 0.7/0.202 = 3.5 Hz and T60 =2.2/3.5 = 630 ms from (3).
Q = 45/3.5 = 12.9 and if T60 stays constant with increasing frequency, then Q increases, for example Q = 112.5/3.5 = 32.1
C2 - Standing waves in a rectangular, rigid roomIn a rectangular room we have six surfaces and the number of possible standing waves is muchlarger than for the two wall example. The frequencies at which they can occur are calculatedfrom
f = ( c / 2 ) [ ( l / L )2 + ( w / W )2 + ( h / H )2 ]1/2 [Hz] (5)

8/4/2019 Sound Pressure Level and Power
http://slidepdf.com/reader/full/sound-pressure-level-and-power 15/22
l, w, h = 0, 1, 2, 3 etc.
See modes1.xls, a spreadsheet for calculating and plotting room modes and other roomparameters discussed here.
At frequencies below the lowest room resonance the sound pressure will increase at a rate of 12 dB/oct for a closed box speaker that is flat under anechoic conditions, assuming that theroom is completely closed and its surfaces are rigid. This case has some significance for theinterior of automobiles. Under the same circumstances the sound from a dipole speaker will stayflat.Domestic listening spaces are seldom completely closed, nor are sheet rock walls rigid, makinga prediction of very low frequency in-room response extremely difficult.
Note: Calculations of room modes, though popular, are not practical for predicting optimumspeaker placement or listener position. For this one would need to calculate the transfer functionbetween speaker and listener. The transfer function is related to the room modes, but muchmore difficult to determine. Never-the-less, room mode calculations are often invoked to predict"optimum" room dimensions. They fail to take into account any specifics about speaker placement, source directivity and source type (monopole vs. dipole) that determine whichmodes are excited, and in combination with the absorption properties of different room surfaces,to which degree these resonances build up. Some people think that by making the room other than rectangular or using curved surfaces, that they can eliminate standing waves. They merelychange frequencies, shift their distribution and make their calculation a lot more difficult.
Room modes can be identified by peaks and dips in the frequency response of the acoustictransfer function between speaker and listening position, though only at low frequencies (<150Hz) where their density is not too high. Such measurements are location dependent and aredifficult to interpret as to their audible effect. Listening to amulti-burst test signalat differentfrequencies gives audible indication of which room locations and frequency regions suffer thegreatest degradation in the articulation of bass sounds ( Ref.1). With this information in hand it isthen possible to identify and electronically equalize the worst offenders in the acoustic transfer function response.
Several room parameters can be calculated that give insight into the general behavior of aclosed space.
The number of modes N between zero and a given upper frequency limit f m can be estimated(H. Kuttruff, Room Acoustics, 1991) from
N = (4 3) V (f m/c)3 + ( / 4) S (f m /c)2 + (1 / 8) Le (f m /c) (6)
whereV = L W H [m3]S = 2 ( L W + L H + W H ) [m2]Le = 4 ( L + W + H ) [m]
The number of modes increases very rapidly with frequency and they move ever more closelytogether. Their average separation at f m is
f = c3 / ( 4 V f m2 ) [Hz] (7)

8/4/2019 Sound Pressure Level and Power
http://slidepdf.com/reader/full/sound-pressure-level-and-power 16/22
Example 2Take a room with L = 25', W = 16' and H = 9' (7.62m x 4.88m x 2.74m), thenV = 3600 ft3 = 102 m3
S = 1537 ft2 = 143 m2
Le = 200 ft = 61 mBelow f m = 100 Hz, 200, 300 and 400 Hz the number of modes N and their average separation
f at f m are respectively
f m N f 100 Hz 22 3.2 Hz200 Hz 126 0.8 Hz300 Hz 375 0.4 Hz400 Hz 832 0.2 Hz
If we assume that the modes in this room decay at T60 = 630 ms, then each resonance occupiesa 3 dB bandwidth BW = 3.5 Hz from (3) above. Somewhere between 100 Hz and 200 Hz theaverage separation f between modes is 1.2 Hz and thus 3 modes fall within the 3.5 Hz bandwidth resulting from T60. This occurs at fs = 157 Hz as calculated from the simple formulafor 3 overlapping modes per BW:
f s = 2000 ( T60 / V )1/2 [Hz] (8)
The frequency f s is also called the Schroeder frequency and denotes approximately theboundary between reverberant room behavior above and discrete room modes below.
The sound decay time or reverberation time T60 is related to the average wall absorptioncoefficient by Sabine's formula
T60 = 0.163 V / ( S ) [s] (9)
= 18% for the Example 2 room with T60 = 630 ms.
ACD containing unique test signals is available. It allows to evaluate the effect of room modesupon the clarity of sound reproduction.
C3 - Reverberation distanceWhen we consider radiation in the reverberant frequency range above 149 Hz, the sound at thelistening position is composed of the direct sound from the source and the reverberant soundthat is more or less uniformly distributed in the room. The direct sound pressure level decreases
inversely to distance from the source and will equal the reverberant sound pressure at distancexr . The ‘reverberation distance’ xr (also called 'critical distance') is calculated from
xr = 0.1 ( G V / ( T60) )1/2 [m] (10)
where the directionality gain G is unity for a monopole and G = 3 for a dipole radiator. A dipole,thus, has a 3 1/2 = 1.73 times larger reverberation distance.

8/4/2019 Sound Pressure Level and Power
http://slidepdf.com/reader/full/sound-pressure-level-and-power 17/22
A typical reverberation distance is actually quite small, 0.72 m (2.4 ft) for the monopole and 1.24m (4.1 ft) for the dipole in the example room. Never-the-less, the ratio of direct sound Ld toreverberant sound pressure level L r is 4.8 dB greater for the dipole than for a monopole with thesame direct sound output. Thus, at 3 m distance from the source, the direct sound would be20*log(3/0.72) = 12.4 dB below the reverberant sound field for the monopole and only
20*log(3/1.24) = 7.7 dB below it for the dipole.The 4.8 dB lower level of the reverberant field in the case of the dipole significantly reduces themasking influence of the room upon sonic detail. It eliminates the sensation of overload of theroom during loud passages of program material and makes your listening sessions much lessnoisy to your neighbors.You have often experienced the poor intelligibility of spoken words from PA systems in enclosedpublic spaces. Usually a central cluster of loudspeakers aims at the audience. In reality thespeakers are not very directional and too much sound is radiated towards useless spaces, onlyto bounce around and raise the reverberant sound level. It does not help to increase the volumeto obtain more direct sound, because it also raises the reverberant sound level. Speechmodulation gets lost in this, somewhat like the loss of articulation in mywoofer test signal.
C4 - Rooms for multi-channel soundIt has been suggested (R. Walker, BBC, 1998) that the reverberation time T60 over the 200 Hz to4 kHz frequency range be adjusted to
T60 = 0.3 (V/V0)1/3 [s] where V0 = 100 m3 (11)
with a tolerance of +/-50 ms which is allowed to increase linearly to +300 ms between 200 Hzand 63 Hz.The room of Example 2 should thus have T60 = 300 ms +/-50 ms. This makes for a subjectivelyquite dead room, which is fine if the room is dedicated solely to Home Theater and surroundsound, but is in my opinion a very overstuffed environment for normal living. It has the effect of making the reverberation distance xr = 1.04 m for the monopole and xr = 1.8 m for the dipole. Ata viewing/listening distance of 2 m the direct sound is only about 6 dB below the reverberantlevel of the monopole which is good for sound clarity.Instead, you could use a dipole, increase T 60 to a much more livable 600 ms and have the samedirect-to-reverberant ratio as for the monopole for which the specification was developed.
C5 - Amplifier power to obtain Reference LevelWhen you know the equivalent sensitivity Ls of your speaker in dB SPL at 1 W (2.83 V across 8ohm) and 1 m distance and the reverberation time T60 of your room, then you can estimate the

8/4/2019 Sound Pressure Level and Power
http://slidepdf.com/reader/full/sound-pressure-level-and-power 18/22
amount of power Pref required to obtain a specified reference level Lref at the listening distancexl. First calculate the reverberation distance xr from (10). Then the level of the reverberant fieldfor 1 W into the speaker is
Lr(1W) = Ls - 20 log(xr ) [dB SPL] (12)
If the listening distance xl is greater than x r , then the amplifier power in dBW is
Pref = Lref - {Ls - 20 log(xr )} [dBW] for xl > xr (13)
Example 3Ls = 89 dB SPL at 1 W, 1 mLref = 85 dB SPL
Monopole:xr = 1.04 m for T60 = 300 msLr(1W) = 89 - 20 log(1.04) = 88.7 dB SPL
Pref = 85 - 88.7 = -3.7 dBW, equivalent to 10(-3.7/10)
= 0.4 WDipole:xr = 1.8 m for T60 = 300 msLr(1W) = 89 - 20 log(1.8) = 83.9 dB SPLPref = 85 - 83.9 = 1.1 dBW, equivalent to 10(1.1/10) = 1.3 W
With a suggested 20 dB of SPL (= 100 x power) headroom over reference level the monopolerequires 40 W and the dipole 130 W to set up a 105 dB SPL reverberant sound field. Thedipole's direct sound, though, is 4.8 dB higher than the monopole's and will be 105 - 20log(3/1.8) = 100.6 dB SPL at 3 m distance. The increased clarity could be traded off for a morelively room with larger T60 and the same 40 W amplifier power and direct-to-reverberant SPL
ratio as for the monopole.C6 - Room response timeIt takes time to build up the reverberant sound field in a room. Combining the expressions for rise time (2) and T60 (3) we obtain
Trise = 0.32 T60 [s] (14)
You can think of Trise as the time constant of the room. If music or speech varies faster than thetime constant, then the room will not respond fully and you hear predominantly the direct soundfrom the speaker. For 630 ms reverberation time and 200 ms rise time this covers modulationenvelopes of a sound down to 1/200ms = 5 Hz which, in my opinion, is preferable over the 10Hz envelope rate of a T60 = 300 ms room.
In all practical cases the room response time is large compared to the time it takes a reflectedsound to reach the listener and therefore reflections will not be masked by the reverberant field.Depending upon the directivity of the source and the proximity of reflecting surfaces and objectsspecific absorptive or diffusive treatment may become necessary. It should not be overdone,though, because a certain amount of lateral reflection is subjectively desirable to not destroy theimpression of a real space.Top
8/4/2019 Sound Pressure Level and Power
http://slidepdf.com/reader/full/sound-pressure-level-and-power 19/22
D - Loudspeaker and listener placement
It is often assumed that a study of room acoustics can lead to highly specific loudspeaker andlistener placement locations, down to within an inch. Other proponents are not as optimistic andrecommend a 1/3rd rule (FAQ31). I have come to the conclusion that real rooms areacoustically far too complex to predict the transmission of sound from speaker to listener, wherethe sound paths are in three dimensions, have direction and frequency dependent attenuationand diffusion, and can excite the inherent resonance modes of a room to unknown degrees.
From practical experience I recommend the following setups as starting points. They are for ORION, a dipole or bi-directional loudspeaker, and for PLUTO, a monopole or omni-directionalspeaker. Three room sizes are considered. The 180 ft 2 (17 m2) room with 8 ft (2.4 m) ceilingwould seem like the absolute minimum for quality sound reproduction with the ORION. A 400 ft2
(37 m2) or larger room with 10' (3 m) ceiling should be perfect.
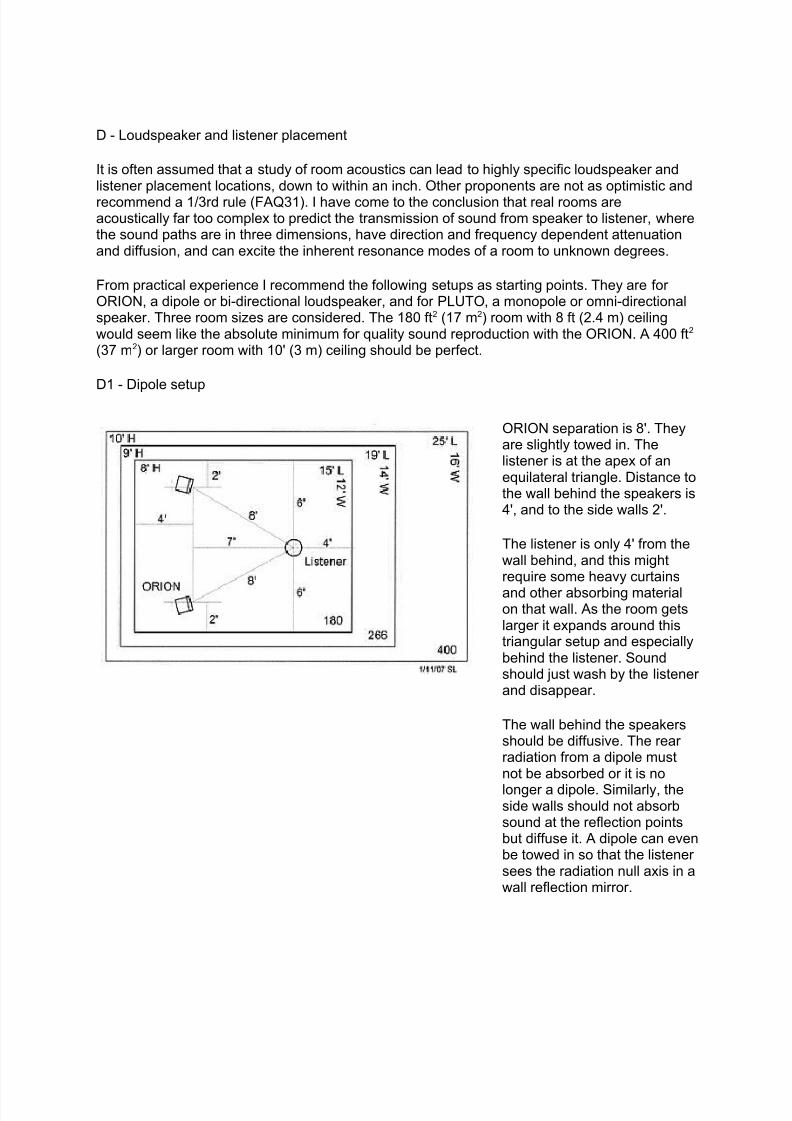
D1 - Dipole setup
ORION separation is 8'. Theyare slightly towed in. Thelistener is at the apex of anequilateral triangle. Distance tothe wall behind the speakers is4', and to the side walls 2'.
The listener is only 4' from thewall behind, and this mightrequire some heavy curtainsand other absorbing materialon that wall. As the room getslarger it expands around thistriangular setup and especiallybehind the listener. Soundshould just wash by the listener and disappear.
The wall behind the speakersshould be diffusive. The rear radiation from a dipole mustnot be absorbed or it is nolonger a dipole. Similarly, theside walls should not absorbsound at the reflection pointsbut diffuse it. A dipole can evenbe towed in so that the listener sees the radiation null axis in awall reflection mirror.

8/4/2019 Sound Pressure Level and Power
http://slidepdf.com/reader/full/sound-pressure-level-and-power 20/22
D2 - Monopole setup
PLUTO setup differs fromORION. The listener sits closer to the speakers. The distance
to the wall behind the speakerscan be slightly less, because of the uniform acousticillumination of the room. Itshould not be less than 3' (<6ms) to separate reflection fromdirect soundpsychoacoustically, and topreserve phantom imaging.
Sidewall reflections should bediffused if treated at all.
Absorbing them is like turningdown the tweeter. Absorbersare not broadband andineffective below a fewhundred Hz.. Besides, lateralreflections are important for sound scene recognition.
Again, larger rooms expandaround the triangle andincrease the space morebehind the listener than in front
of him.
D3 - Pink noise test
Listening topink noise is a revealing test of electrical and acoustic performance of any systemsetup. Pink noise must emanate from both speakers simultaneously in dual mono fashion. Atightly confined phantom image should be heard half-way between the two loudspeakers. Asyou move your head left or right the sound should become brighter sounding and increasinglyso with about a 2 inch (5 cm) periodicity as the lateral head displacement is increased in D1.The image also becomes significantly more diffuse and moves towards the nearest speaker.Pink noise should sound neutral and uncolored, though what that exactly means is hard to
define. Moving around in the room the character of the noise sound should not changesignificantly with speakers like ORION and PLUTO, holding up even when you leave the roomand listen from outside. This is not the case with loudspeakers that have a greatly varying polar response.
Listening to pink noise does not give a reliable indication of system performance at frequenciesbelow 100 Hz and above 10 kHz. Even when pink noise is measured in 1/3rd-octave bands, theresponse graph is not a reliable indicator of speaker performance and should not be used as thebasis for equalization. It seems so obvious that one only needs to have a flat frequency
8/4/2019 Sound Pressure Level and Power
http://slidepdf.com/reader/full/sound-pressure-level-and-power 21/22
response at the listening position and be done. But, room response equalization is a verycomplex subject because it deals with sound in three dimensions of space, with time, withfrequency, and with a highly evolved auditory stimulus processor between the two ears that isnot easily fooled long-term. The response should not be optimized merely at the listeningposition. Fewcommercial products deal with this adequately.
D4 - Room analysis
The modes1.xls spreadsheet that was discussed under C above can be used to analyze thethree hypothetical rooms and to gain some general insights. Depending upon their structuralrigidity, their wall surface textures, floors, floor coverings and objects in different locations, eachroom will have its own unique acoustic signature. Broadly speaking, a room may sound live or dead. The extremes of this would be an unfurnished room with hard walls versus a cocktaillounge full of overstuffed armchairs and soft leather. Neither one would be suited for soundreproduction. The descriptive parameter is the average absorption coefficient of all surfaces andleakage paths. By definition an open window has a 100% absorption coefficient and if that openwindow covered 20% of a room's total surface area, then the average absorption coefficient for the room would be 20%. For the 180 ft2 room example this would be an open window of 169 ft2
area out of a total surface of 847 ft2. Since we usually listen with closed windows and very fewsurfaces have 100% absorption, it takes much more than 169 ft 2 to obtain an overall 20%absorption.
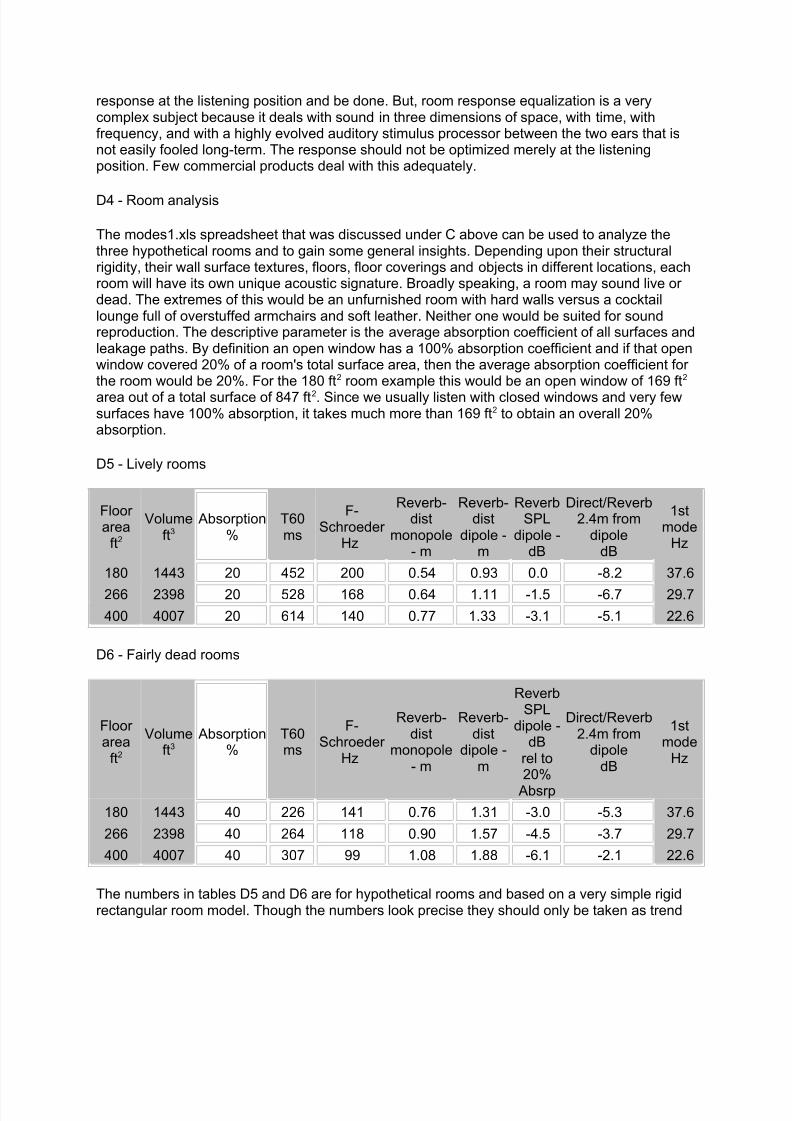
D5 - Lively rooms
Floor area
ft2Volume
ft3Absorption
%T60ms
F-Schroeder
Hz
Reverb-dist
monopole- m
Reverb-dist
dipole -m
ReverbSPL
dipole -dB
Direct/Reverb2.4m from
dipoledB
1stmode
Hz
180 1443 20 452 200 0.54 0.93 0.0 -8.2 37.6266 2398 20 528 168 0.64 1.11 -1.5 -6.7 29.7400 4007 20 614 140 0.77 1.33 -3.1 -5.1 22.6
D6 - Fairly dead rooms
Floor area
ft2Volume
ft3Absorption
%T60ms
F-Schroeder
Hz
Reverb-dist
monopole- m
Reverb-dist
dipole -m
ReverbSPL
dipole -dB
rel to20%
Absrp
Direct/Reverb2.4m from
dipoledB
1stmode
Hz
180 1443 40 226 141 0.76 1.31 -3.0 -5.3 37.6266 2398 40 264 118 0.90 1.57 -4.5 -3.7 29.7400 4007 40 307 99 1.08 1.88 -6.1 -2.1 22.6
The numbers in tables D5 and D6 are for hypothetical rooms and based on a very simple rigidrectangular room model. Though the numbers look precise they should only be taken as trend

8/4/2019 Sound Pressure Level and Power
http://slidepdf.com/reader/full/sound-pressure-level-and-power 22/22
indicators. Note the relatively narrow range from 99 Hz to 200 Hz covered by the Schroeder frequency for the different rooms and absorptions. Below this frequency specific room modescan dominate, down to the 1st mode. Above that frequency the mode density becomes so highthat a room is better described statistically by its reverberation time. For the typical homelistening rooms with relatively large objects and different materials in them, reverberation timeusually changes with frequency regions and is not as solid a descriptor as for concert halls.Below the first room mode the sound level becomes independent of location in the room and isa function of the lumped mechanical properties of the room. Similar to the modal region the levelcan be attenuated or amplified depending on wall surface flexures and leaky openings. Theroom adds to and subtracts from the loudspeaker's direct sound to varying degrees and in avery complex manner over the whole frequency range of the speaker. Thus the tables can onlyshow trends above the Schroeder frequency.
It can be seen in D5 that the reverberant SPL in the 400 ft2 room is 3.1 dB below that of the 180ft2 room and when the absorption is increased to 40% in D6, it drops by another 3 dB for thesame direct sound level. Since we judge loudness by the reverberant sound field this meansthat the volume control setting has to be increased 3.1 dB for the volume in the 400 ft2 room tobe as loud as in the 180 ft 2 room in D5, and by 6.1 dB for the more absorptive room in D6. Still,this is not much of an increase between the small and the large room. It confirms that ORIONand PLUTO can be used in a wide range of room sizes, if volume levels are set for criticallistening in the triangle seat and not for sound reinforcement at a large party.
Under D6 the ratio of direct to reverberant sound level is 3 dB better than for the more livelyrooms under D5 with half the absorption. These numbers are for the dipole which inherently is4.8 dB (3x) better than a monopole. But the monopole in D2 is closer to the listener than thedipole in D1. Thus, in all cases the direct-to-reverberant sound ratio for this monopole at 6.4'(1.92 m) listening distance is only 2.8 dB worse than that for the dipole at 8' (2.4 m).
Despite the poorer signal-to-reverberant ratio I find more lively rooms preferable for music andvoice reproduction. Home Theater installers, though, try to get rooms down to the 200 ms T60region, which is difficult to accomplish for low frequencies.
Reverberation time of a listening room can be measured rather easily with the NTI Acoustilizer ,but a loud hand clap can tell already whether a room is live or dead. Rather than specialproducts for acoustic treatment of a room I prefer the normal stuff of life - books, curtains,pictures, rugs, wall hangings, shelves, cabinets, chairs, sofas, etc. - to establish the acoustics of my living spaces. ORION and PLUTO+ are well adapted to such spaces which also convey afriendly atmosphere to most people.Top