
SOUND OF PADDLE WHEEL ON SEA BASS GROWTH 01, 2009 · SOUND OF PADDLE WHEEL ON SEA BASS GROWTH ......
12
ISSN: 1693-6930 1 SOUND OF PADDLE WHEEL ON SEA BASS GROWTH Sunardi 1 , Anton Yudhana 2 , Ahmad Syahril Mohd Nawi 3 4 , Jafri Din , Saberi Mawi 5 1,2,3,4 Faculty of Electrical Engineering, Universiti Teknologi Malaysia, Johor 81310, Malaysia 1,2 Electrical Engineering Department, Universitas Ahmad Dahlan, Yogyakarta 55164, Indonesia 5 Pusat Penyelidikan dan Ternakan Air payau, Gelang Patah, Johor, Malaysia email: [email protected] Abstrak Tujuan penelitian ini adalah menguji pengaruh suara pada ikan siakap (Sea bass, Cynoscion nobilis). Penelitian ini dilaksanakan pada kolam ikan air payau berukuruan 25x100m, kedalaman 2m, serta 6 buah paddle wheel sebagai sumber suara. Profil suara diukur untuk mengetahui amplituda pada berbagai titik pengukuran dan kedalaman yang berbeda menggunakan hydrophone Cetacean tipe C304. Keluaran hydrophone dianalisis menggunakan software SpectraPlus. Untuk pengukuran kedua, dua buah sangkar dengan ukuran 3x3 m digunakan sebagai habitat ikan. Ikan pada masing-masing sangkar sejumlah 20 ekor, sedangkan ikan diluar sangkar sejumlah 12500. Profil suara kemudian diukur lagi berdasarkan posisi (sangkar tepi/tengah), berdasarkan waktu (pagi/siang/sore), dan berdasarkan titik pengukuran yang berbeda. Data time series, spektrum frekuensi, dan fase dianalisis lagi. Pertumbuhan ikan diukur bulanan untuk setiap sangkar yang ada. Ikan di dalam sangkar ternyata tumbuh secara linier, sedangkan ikan di luar sangkar tumbuh secara eksponensial. Ukuran dan berat ikan dalam kedua sangkar lebih kecil. Dari penelitian ini dapat disimpulkan bahwa suara tidak mempunyai pengaruh yang signifikan terhadap pertumbuhan ikan. Keterbatasan pergerakan untuk mendapatkan makanan dan kondisi stress lebih berpengaruh terhadap pertumbuhan ikan daripada pengaruh suara. Kata kunci: profil suara, air payau, paddle wheel, Siakap, Sea bass Abstract The objective of this research is sound effect for brackish water for Sea bass (Cynoscion nobilis). Breeding farm 25x100m, 2m of depth, and 6 paddle wheels which generate the sound are available for research. Sound profile has been measured to investigate the amplitude at various measurement points at various depths by using Cetacean hydrophone C304. The output of hydrophone has been analyzed by using SpectraPlus software. For the second measurement, two cages which size 3x3m have been used for life fish habitat. Then, fish put in the edge cage (20), center cage (20), and out of cage (12500). Sound profile has been measured for position-based (edge/center cage), time-based (morning/noon/evening), and point-based. Time series, spectrum frequency, and phase have been analysis. Fish growth progress has been monthly measured at every cage. Fish in the cage is growth as linearly, while fish growth for out of cage is exponentially. Size and weight of fish in the both cages is less than out of cage. This research concludes that sound have no significantly effect for fish growth. Limited mobility to look for food and stress are more influences to fish growth than sound effect. Keywords: sound profile, brackish water, paddle wheel, Sea bass 1. INTRODUCTION A wide range of waterborne sound is generated by human activities in aquatic environments. Consequently, fish are subjected to extreme levels of chronic (continuous) and acute (transient) noise which may stress them to the point of reduced growth rate, reduced reproductive performance, increased disease susceptibility and even mortality. A number of studies have focused on fish hearing and perception. However, no study has examined Sound of Paddle Wheel on Sea Bass Growth (Sunardi)
Transcript of SOUND OF PADDLE WHEEL ON SEA BASS GROWTH 01, 2009 · SOUND OF PADDLE WHEEL ON SEA BASS GROWTH ......
ISSN: 1693-6930 1
SOUND OF PADDLE WHEEL ON SEA BASS GROWTH
Sunardi1, Anton Yudhana2, Ahmad Syahril Mohd Nawi3 4, Jafri Din , Saberi Mawi51,2,3,4Faculty of Electrical Engineering, Universiti Teknologi Malaysia, Johor 81310, Malaysia
1,2Electrical Engineering Department, Universitas Ahmad Dahlan, Yogyakarta 55164, Indonesia 5Pusat Penyelidikan dan Ternakan Air payau, Gelang Patah, Johor, Malaysia
email: [email protected]
Abstrak Tujuan penelitian ini adalah menguji pengaruh suara pada ikan siakap (Sea bass,
Cynoscion nobilis). Penelitian ini dilaksanakan pada kolam ikan air payau berukuruan 25x100m, kedalaman 2m, serta 6 buah paddle wheel sebagai sumber suara. Profil suara diukur untuk mengetahui amplituda pada berbagai titik pengukuran dan kedalaman yang berbeda menggunakan hydrophone Cetacean tipe C304. Keluaran hydrophone dianalisis menggunakan software SpectraPlus. Untuk pengukuran kedua, dua buah sangkar dengan ukuran 3x3 m digunakan sebagai habitat ikan. Ikan pada masing-masing sangkar sejumlah 20 ekor, sedangkan ikan diluar sangkar sejumlah 12500. Profil suara kemudian diukur lagi berdasarkan posisi (sangkar tepi/tengah), berdasarkan waktu (pagi/siang/sore), dan berdasarkan titik pengukuran yang berbeda. Data time series, spektrum frekuensi, dan fase dianalisis lagi. Pertumbuhan ikan diukur bulanan untuk setiap sangkar yang ada. Ikan di dalam sangkar ternyata tumbuh secara linier, sedangkan ikan di luar sangkar tumbuh secara eksponensial. Ukuran dan berat ikan dalam kedua sangkar lebih kecil. Dari penelitian ini dapat disimpulkan bahwa suara tidak mempunyai pengaruh yang signifikan terhadap pertumbuhan ikan. Keterbatasan pergerakan untuk mendapatkan makanan dan kondisi stress lebih berpengaruh terhadap pertumbuhan ikan daripada pengaruh suara.
Kata kunci: profil suara, air payau, paddle wheel, Siakap, Sea bass
Abstract
The objective of this research is sound effect for brackish water for Sea bass (Cynoscion nobilis). Breeding farm 25x100m, 2m of depth, and 6 paddle wheels which generate the sound are available for research. Sound profile has been measured to investigate the amplitude at various measurement points at various depths by using Cetacean hydrophone C304. The output of hydrophone has been analyzed by using SpectraPlus software. For the second measurement, two cages which size 3x3m have been used for life fish habitat. Then, fish put in the edge cage (20), center cage (20), and out of cage (12500). Sound profile has been measured for position-based (edge/center cage), time-based (morning/noon/evening), and point-based. Time series, spectrum frequency, and phase have been analysis. Fish growth progress has been monthly measured at every cage. Fish in the cage is growth as linearly, while fish growth for out of cage is exponentially. Size and weight of fish in the both cages is less than out of cage. This research concludes that sound have no significantly effect for fish growth. Limited mobility to look for food and stress are more influences to fish growth than sound effect.
Keywords: sound profile, brackish water, paddle wheel, Sea bass 1. INTRODUCTION
A wide range of waterborne sound is generated by human activities in aquatic environments. Consequently, fish are subjected to extreme levels of chronic (continuous) and acute (transient) noise which may stress them to the point of reduced growth rate, reduced reproductive performance, increased disease susceptibility and even mortality. A number of studies have focused on fish hearing and perception. However, no study has examined
Sound of Paddle Wheel on Sea Bass Growth (Sunardi)

ISSN: 1693-6930 2
waterborne sound characterization in fish farming (aquaculture) conditions and real time conditions.
Fish are exposed to a wide range of waterborne sound in natural and culture conditions. In natural waters, sound is generated by machinery, propulsion systems of large ships and by-flow (wake noise). Even wider ranges of sound are produced in heavy ship traffic areas. Sonar systems, shock tests, boat repairs, underwater explosions and airborne sound (from aircraft and sonic booms) along with offshore construction, auto traffic and coastal and other human activities are significant sources of sounds. The impact of acoustic stresses could be particularly important in coastal zones that are the primary spawning grounds for many commercially important species.
Sound is a mechanical disturbance that propagates through water as a pressure wave in an elastics medium. The pressure waves radiates spherically from its source with the intensity, I decreasingly inversely with the square of distance, R [1]. Sound pressure level (SPL) or sound level is a logarithmic measure of the rms sound pressure of a sound relative to a reference value. It is measured in decibels (dB (SPL), dBSPL, or dBSPL) [2].
Sound Pressure Level (dB) = 20 log (p/pref) (1)
The sound levels to which most mammals are sensitive extend over many orders of magnitude. Brackish water is water that is saltier than fresh water. It is a mixture from fresh water and sea water. Technically, brackish water contains between 0.5 and 30 grams of salt per liter.
The numerous species from many unrelated families produce sounds, and that acoustic exchanges are part of the aggressive and reproductive behavior of many fishes. However, a fish's environment contains far more sounds than those produced by nearby co specifics alone. Furthermore, the degree of auditory acuity a species exhibits is not always positively correlated with the extent to which it uses sound in intra-specific communication [3].
The auditory system is particularly important for aquatic vertebrates when visual orientation is restricted. Sounds from different sources provide them with information relevant for survival, e.g., finding mates and prey or avoiding predators. The natural environment of fishes, especially that of marine fishes but also freshwater habitats is characterized by a permanent background noise of abiotic (currents, rain, seismic events, coastal surf) and biotic (vocalizations of animals, photosynthesis) origin. Most investigations on sound detection in fishes, however, were performed under quiet laboratory conditions, and their results may be ill-suited to information on the ability of fishes to detect signals in their natural environment [4].
Most of the aquaculture research is most interested on freshwater and seawater because there are more popular than brackish water and also the species of fish from this water is more compared to the species from brackish water. Thus, there are some reasons why this project must to be done. The first point is this research will come out with the characteristics of sound pressure level for brackish water and its effect to fish growth. Secondly, with the launching of the National Aquaculture Development Plan, this fundamental research will support the government mission to increase the quantity of production of aquaculture industry.
The objectives of this research are to formulate a novel characterization of sound for brackish water for Sea bass (Cynoscion nobilis) and to characterization aquaculture environment sound for brackish water. The expected outcome this research is a method of improving Sea bass productivity and breeding using underwater audio. By knowing the sound characteristic of fish farming (aquaculture) conditions a method of improving fish productivity and breeding using underwater audio, could be implemented. 2. SOUND PROFILE MEASUREMENT FOR BRACKISH WATER
The perception of underwater sound poses several challenges to fish because of similar acoustic impedance between fish body and its surrounding water medium, it makes fish body almost transparent to passing sound waves. Under such condition the fish body vibrates in sync with the sound wave and no differential movement of body is expected to stimulate sensory hair cells [5].
TELKOMNIKA Vol. 7, No. 1, April 2009 : 1 - 12

TELKOMNIKA ISSN: 1693-6930 ■ 3
Sound of Paddle Wheel on Sea Bass Growth (Sunardi)
Several reports include comprehensive treatments of the characteristics of underwater sound [6]. In any medium, a propagated sound wave has pressure (P), a scalar quantity, as well as the vector properties of acceleration, particle displacement, and velocity (u, a function of displacement and frequency). The relationship between P and u changes with distance from the sound source for a sound wave in water, though not in air. Fishes show great variation in the frequency range they can hear and in their sensitivity over those frequencies, although related species may exhibit similar auditory capabilities if they inhabit similar acoustic environments. Species with poor sensitivity and narrow frequency range come from diverse families and occupy many different habitats [3].
In the aquatic environment, hearing is an important sense for the survival of an animal. Sound travels faster and is much less attenuated in water than in air, making it the perfect means for communication over long distances [7]. The auditory system is wanted to know the fish ability to hearing sound for some range of frequency. Fish detect sound via otolithic endorgans of the inner ear, which respond directly to linear accelerations of the fish induced by particle motion. Indirect stimulation of the inner ear by pressure waves occurs in some species as well. This indirect stimulation is enhanced in species that have specializations connecting the swim bladder or some other gas-filled chamber to the inner ear (hearing specialists), but may also apply to fish that lack such a specialization [5].
By listening to the background noise in an aquatic habitat, an animal can get biotic information about the position of prey or predators, potential mates or competitors, as well as abiotic information about currents, coastlines, torrents, wind, etc [8].
Ambient noise ultimately determines the detect ability of all stimuli impinging on an animal [9]. In dealing with the evolution of hearing capabilities, it is crucial to know how an animal copes with the problem of differentiating relevant acoustic events (signals) from the background noise. This problem cannot be solved simply by enhancing the auditory sensitivity since this would affect both signals and noise detection [10].
Auditory thresholds increased almost linearly with white noise level in the hearing specialists, whereas the hearing generalist was only slightly affected by the higher white noise level applied (spectral level approx. 95 dB). The increase was linear for the most sensitive frequencies but not for the upper and lower ends of the fish's hearing ranges. The masking effect was most pronounced in the most sensitive frequency range, which may explain why we observed significant interactions between noise and frequency, yielding different trends of noise effects at different frequencies [11].
Sound pressure is the adequate measure of the degree of auditory stimulation in pressure-sensitive fishes such as otophysines [12] in any acoustic field. For technical and comparative reasons, the hearing thresholds of European Perch are also given in SPL values, although hearing generalists detect particle motion of sounds. This is acceptable because our study emphasized the effects of the same defined background noise (noise spectra are given in pressure units) on signal detection in different species using the same experimental setup and on relative threshold shifts within a species rather than absolute thresholds. This approach is valid as long as the displacement field is proportional to the pressure field, because in masking studies the ratio of the tone level to the noise level at nearby frequencies is most important [13]. However, that those hearing thresholds should not be regarded as absolute values because the exact proportional factor between the two sound parameters remains unknown.
Basically, hydrophone will be used as important equipment for this project. The hydrophone will be used for measure the sound pressure level. Besides that, there is some method to handle the hydrophone to make sure the data are accurate and reasonable and also to make sure this project going on successful.
A spectrum analyzer is an instrument used to convert a signal from the time domain (amplitude vs. frequency). With an ordinary oscilloscope is a time domain display looks like. A frequency domain display is known as a spectrum. Unless measuring a single tone, an oscilloscope provides little in the way of frequency information; however, a spectrum analyzer clearly reveals this information. An Audio Spectrum Analyzer, by definition, is limited to processing signals in the audio band. The specific frequency limit is determined by the capabilities sound card.
An Audio Spectrum Analyzer is very useful for measuring the fundamental frequency components which are contained in an audio signal. It can measure the frequency of single or multiple tones and the frequency difference between them.

ISSN: 1693-6930 4
The program is conjunction with the sound card on personal computer (PC). The Audio signal plug in to the Line-In or microphone or hydrophone jack on the back of the sound card. SpectraPlus perform an Analog-to-Digital (ADC) conversion on the audio signal. This digitized audio is then passed through a math algorithm known as a Fast Fourier Transform (FFT) which converts the signal from the time domain to the frequency domain. The screenshot of SpectraPlus can be shown in Figure 1. The CPU on computer is used to perform this transformation.
When a .WAV file is opened, the sampling rate and format are changed to match the rate at which the file was recorded - the Sampling Rate must remain constant within a single .WAV file. When the .WAV file is closed, these settings will revert to their previous values. The current sampling rate is always displayed in the status bar along the bottom of the application. List of sampling rate can be listed as shown in Table 1.
Figure 1. Screenshot of SpectraPlus
Table 1. Sampling rate
Sampling Rate (Hz)
Sampling Precision (bits)
Bytes/Minutes
11,025 8 661,500 11,025 16 1,323,000 22,050 8 1,323,000 22,050 16 2,646,000 44,100 8 2,646,000 44,100 16 5,292,000 44,100 24 7,938,000
3. MEASUREMENT DESIGN
Breeding farm of fish was using brackish water which size of 25mx100m and 2m of depth. This breeding farm used brackish water. Total of 6 paddle wheels at edge of breeding farm in order to circulate of water are available in this breeding farm. The operations of these paddle wheels (what the paddle wheel on or off) can be managed.
TELKOMNIKA Vol. 7, No. 1, April 2009 : 1 - 12
TELKOMNIKA ISSN: 1693-6930 ■ 5
Sound of Paddle Wheel on Sea Bass Growth (Sunardi)
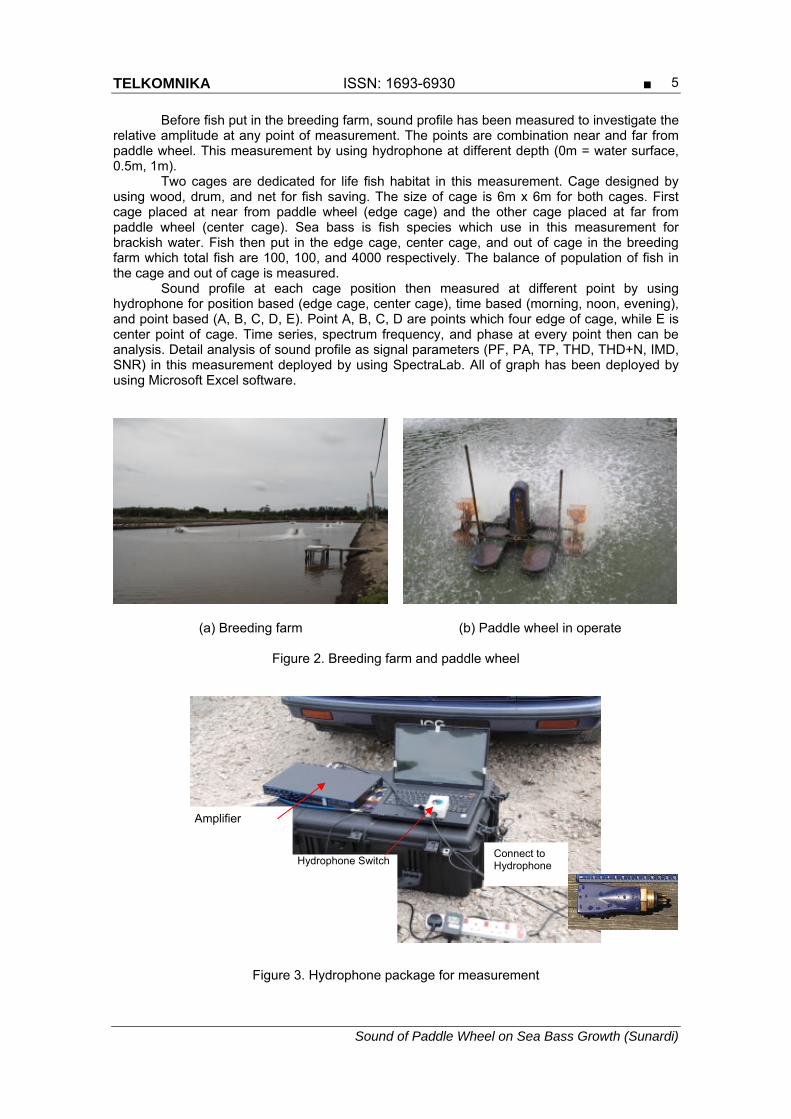
Before fish put in the breeding farm, sound profile has been measured to investigate the relative amplitude at any point of measurement. The points are combination near and far from paddle wheel. This measurement by using hydrophone at different depth (0m = water surface, 0.5m, 1m).
Two cages are dedicated for life fish habitat in this measurement. Cage designed by using wood, drum, and net for fish saving. The size of cage is 6m x 6m for both cages. First cage placed at near from paddle wheel (edge cage) and the other cage placed at far from paddle wheel (center cage). Sea bass is fish species which use in this measurement for brackish water. Fish then put in the edge cage, center cage, and out of cage in the breeding farm which total fish are 100, 100, and 4000 respectively. The balance of population of fish in the cage and out of cage is measured.
Sound profile at each cage position then measured at different point by using hydrophone for position based (edge cage, center cage), time based (morning, noon, evening), and point based (A, B, C, D, E). Point A, B, C, D are points which four edge of cage, while E is center point of cage. Time series, spectrum frequency, and phase at every point then can be analysis. Detail analysis of sound profile as signal parameters (PF, PA, TP, THD, THD+N, IMD, SNR) in this measurement deployed by using SpectraLab. All of graph has been deployed by using Microsoft Excel software.
(a) Breeding farm (b) Paddle wheel in operate
Figure 2. Breeding farm and paddle wheel
Figure 3. Hydrophone package for measurement
Amplifier
Hydrophone Switch Connect to Hydrophone

ISSN: 1693-6930 6
Breeding farm of fish by using brackish water which size of 25 mx100 m and 2m depth
as shown in Figure 2a, while paddle wheel in operate can be shown in Figure 2b. Total of 6 paddle wheels at edge of breeding farm in order to circulate of water are available in this breeding farm. The operations of these paddle wheels (what the paddle wheel on or off) can be managed. Two cages are dedicated for life fish habitat in this measurement. Cage designed by using wood, drum, and net for fish saving. The size of cage is 3 x 3m for both cages. First cage placed at near from paddle wheel (edge cage) and the other cage placed at far from paddle wheel (center cage).
Cetacean hydrophone with the model C304 has been use in this measurement. The range frequency of this model is 7 Hz to 250 kHz. The output from the hydrophone will analyze by using SpectraPlus software. Hydrophone package for measurement can be shown in Figure 3. Mini boat is very useful for mobility on measurement of sound profile, water characteristics, and chemical properties at every point measurement. Sea bass growth progress at every position (edge cage, center cage, out of cage) has been measured by using weighing for monthly. The significance of weight in three positions then can be analysis. 3.1. Amplitude Measurement
The sound pressure level or amplitude will be measured at the area which is expected give a two extreme sound profile. Point measurement selected at 9 points as shown in Figure 4a. Any points are near from paddle wheel (2, 4, 7, 9), meanwhile any points are far from paddle wheel (1, 3, 6, 8). One point (5) is placed in the center of four paddle wheels.
(a) Amplitude measurement (b) Sound profile measurement
Figure 4. Points of measurement
TELKOMNIKA Vol. 7, No. 1, April 2009 : 1 - 12

TELKOMNIKA ISSN: 1693-6930 ■ 7
Sound of Paddle Wheel on Sea Bass Growth (Sunardi)
These sound pressure level will be measured by using Cetacean hydrophone with the model C304. The output from the hydrophone will analyze by using SpectraPlus software. This project focuses on lower frequency only which is 10 Hz until 50 Hz. This range of frequency is actually the range of low frequency for general fish. The amplitude recorded as long as two minutes for every point measurement. Boat is needed to mobility of researcher in the breeding farm in order to cover for all of area measurements. Amplitude recorded at different depth, there are at water surface (0 m), 0.5 m, and 1 m for any measurement points.
3.2. Sound Profile Measurement
The sound pressure level will be measured at the area which is expected give a two extreme sound profile. These sound pressure level will be measured by using Cetacean hydrophone with the model C304. The range frequency of this model is 0.007 KHz to 250 KHz. The output from the hydrophone will analyze by using SpectraPlus software. For this project, we are only focus on lower frequency which is 10 Hz until 50 Hz. This range of frequency is actually the range of low frequency for general fish. The SPL will record 2 minutes for every point measurement. Cages and points for sound profile measurement can be shown in Figure 4b.
3.3. Fish Growth progress
Fish in the edge cage, fish in the center cage, and fish out of cage are measured for its weight. Weighing of 5 kg is enough to measure. The monthly measurement has been done.
Table 2. Relative amplitude at frequency and depth dependence
Frequency (Hz) Depth (meter) 10 20 30 40 50
Point 1 0 -65.53333 -71.44083 -72.84833 -65.99708 -61.44333 0.5 -57.66833 -61.79083 -66.49000 -67.48667 -63.92083 1 -51.85400 -55.23200 -60.22000 -59.64600 -59.09400 Point 2 0 -75.53909 -79.50545 -82.01182 -81.17455 -65.90909 0.5 -64.07077 -69.39231 -72.25000 -73.88538 -66.66923 1 -68.37500 -71.83417 -75.41833 -76.95667 -65.73917 Point 3 0 -61.55231 -65.08615 -67.90308 -71.32923 -59.75846 0.5 -64.22077 -68.24462 -70.09231 -72.29231 -64.22923 1 -67.72500 -71.61250 -75.81250 -81.03250 -65.07250 Point 4 0 -59.12727 -61.73455 -67.83545 -70.25182 -59.73545 0.5 -58.94231 -61.51538 -66.24692 -69.14077 -58.88769 1 -69.31727 -74.12091 -76.80727 -78.61273 -59.19273 Point 5 0 -60.38308 -67.08923 -71.12615 -73.13385 -62.61769 0.5 -62.78077 -64.35385 -68.99615 -71.72538 -63.61538 1 -56.12091 -59.96545 -58.80273 -64.70909 -62.05000 Point 6 0 NA NA NA NA NA 0.5 -63.98364 -66.52273 -67.10545 -69.63273 -62.14000 1 -52.47000 -59.27545 -62.74818 -65.29455 -61.30182 Point 7 0 -62.14000 -65.77143 -71.97857 -73.24429 -60.48571 0.5 -57.29429 -57.50571 -64.50143 -70.06571 -59.15429 1 -46.56100 -52.39500 -57.32100 -58.04100 -54.61400 Point 8 0 -44.21667 -47.47833 -52.55917 -54.54500 -53.19750 0.5 -46.25333 -49.93417 -53.82667 -58.62333 -56.15917 1 -48.33091 -46.51182 -54.19636 -55.84091 -56.52455 Point 9 0 -45.00000 -48.89200 -53.83500 -54.50900 -53.74300 0.5 -54.99364 -59.56455 -66.05545 -65.57182 -60.99636 1 -44.34889 -48.38000 -57.03000 -57.93889 -53.88000

ISSN: 1693-6930 8
The data from the SpectraPlus will analyze using Microsoft Excel to obtain the number of occurrences of SPL and their average value. At least 10 readings from every point of measurement are taking to obtain the average value with 5 seconds time interval. To make the data more useful, the number of occurrences of SPL is taking from two extreme different of sound profile.
4. RESULTS AND DISCUSSION 4.1. Relative Amplitude
Average of relative amplitude (dB) on frequency and depth dependence listed at Table 2. Relative amplitude at various frequencies (10, 20, 30, 40, 50 Hz) and various depths (0, 0.5, 1 meter) then can be analyzed into several point of measurement. No record data in the measurement point 6 at water surface (depth = 0 meter) because the problem of equipment.
Decreasing trend of relative amplitude occur with increasing frequency at frequency 10 until 40 Hz, amplitude will decrease 5 dB for increase 10 Hz of frequency. This trend occurred in the all of depth (0, 0.5, 1 meter) and in the all of measurement point (point 1 until 9). Otherwise, at frequency 50 Hz, amplitude in the all of depth and point of measurement increase than at 40 Hz.
The differences for average of relative amplitude at measurement point which near from paddle wheel (point 2, 4, 7, 9) with average of relative amplitude at measurement point which far from paddle wheel (point 1, 3, 6, 8) can be graphed. Differences divided into depth dependence (0, 0.5, 1 meter) for all of frequency (10, 20, 30, 40, 50 Hz). Note that relative amplitude which at dB unit must be converted to normal value using antilog, then the average of total reconvert to dB unit to get the average of average of amplitude. This conversion must be done because data at dB unit can not to be average directly.
Average of amplitude for measurement points which near from paddle wheel at depth 0 and 0.5 meter less than measurement points which far from paddle wheel for all of frequency. Otherwise, at depth 1 meter only which have no consistence value of amplitude. In other facts, various depths have no significantly correlation with amplitude. The graphs can be shown in Figure 5.
-70
-65
-60
-55
-50
-45
-4010 20 30 40 50
Frequency (Hz)
Ave
rage
of a
mpl
itude
(d
B)
Near from paddle wheel
Far from paddle wheel
-70
-65
-60
-55
-50
-45
-4010 20 30 40 50
Frequency (Hz)
Ave
rage
of a
mpl
itude
(d
B)
Near from paddle wheel
Far from paddle wheel
(a) Depth = 0 m (b) Depth = 0.5 m
-70
-65
-60
-55
-50
-45
-4010 20 30 40 50
Frequency (Hz)
Ave
rage
of a
mpl
itude
(d
B)
Near from paddle w heel
Far from paddle w heel
(c) Depth = m
Figure 5. Average amplitude at near/far from paddle wheel at depth = 0, 0.5, and 1 m
TELKOMNIKA Vol. 7, No. 1, April 2009 : 1 - 12
TELKOMNIKA ISSN: 1693-6930 ■ 9
Sound of Paddle Wheel on Sea Bass Growth (Sunardi)
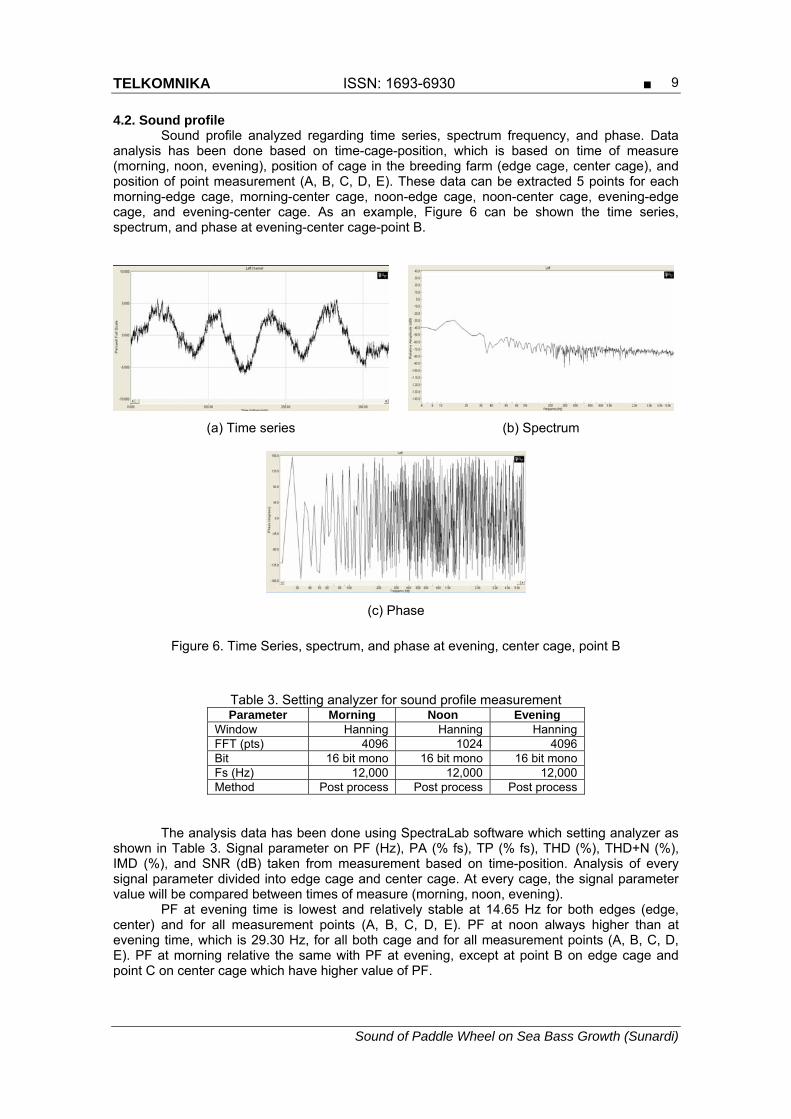
4.2. Sound profile Sound profile analyzed regarding time series, spectrum frequency, and phase. Data analysis has been done based on time-cage-position, which is based on time of measure (morning, noon, evening), position of cage in the breeding farm (edge cage, center cage), and position of point measurement (A, B, C, D, E). These data can be extracted 5 points for each morning-edge cage, morning-center cage, noon-edge cage, noon-center cage, evening-edge cage, and evening-center cage. As an example, Figure 6 can be shown the time series, spectrum, and phase at evening-center cage-point B.
(a) Time series (b) Spectrum
(c) Phase
Figure 6. Time Series, spectrum, and phase at evening, center cage, point B
Table 3. Setting analyzer for sound profile measurement Parameter Morning Noon Evening
Window Hanning Hanning Hanning FFT (pts) 4096 1024 4096 Bit 16 bit mono 16 bit mono 16 bit mono Fs (Hz) 12,000 12,000 12,000 Method Post process Post process Post process
The analysis data has been done using SpectraLab software which setting analyzer as
shown in Table 3. Signal parameter on PF (Hz), PA (% fs), TP (% fs), THD (%), THD+N (%), IMD (%), and SNR (dB) taken from measurement based on time-position. Analysis of every signal parameter divided into edge cage and center cage. At every cage, the signal parameter value will be compared between times of measure (morning, noon, evening).
PF at evening time is lowest and relatively stable at 14.65 Hz for both edges (edge, center) and for all measurement points (A, B, C, D, E). PF at noon always higher than at evening time, which is 29.30 Hz, for all both cage and for all measurement points (A, B, C, D, E). PF at morning relative the same with PF at evening, except at point B on edge cage and point C on center cage which have higher value of PF.

ISSN: 1693-6930 10
TELKOMNIKA Vol. 7, No. 1, April 2009 : 1 - 12
PA at noon time is highest and relatively stable at 0-1 % fs for both edges (edge, center) and for all measurement points (A, B, C, D, E). PF at evening always less than at noon, that is about negative 30-40 % fs, for all both cage and for all measurement points (A, B, C, D, E). PA at morning always lower than at evening with PA about negative 70-80 % fs, except at point C and D on edge cage which have higher value than at evening.
Table 4. Signal parameter at morning for edge cage Parameter Point A Point B Point C Point D Point E
Morning, edge cage PF (Hz) 14.65 38.09 14.65 14.65 14.65 PA (% fs) -47.30 -72.79 -12.98 -18.26 -73.44 TP (% fs) -38.41 -59.91 -5.33 -10.35 -66.91 THD (%) 206.67 149.45 131.78 138.01 199.82 THD+N (%) 144.18 87.70 126.00 204.20 171.25 IMD (%) 171.95 215.68 243.53 300.72 205.40 SNR (dB) -3.18 1.14 -2.01 -2.01 -4.67 Morning, center cage PF (Hz) 23.44 14.65 35.16 20.51 20.51 PA (% fs) -72.18 -41.71 -76.74 -77.81 -78.10 TP (% fs) -63.28 -39.46 -65.50 -64.92 -64.72 THD (%) 158.32 78.31 232.42 354.94 346.40 THD+N (%) 109.90 11.57 159.14 167.97 176.96 IMD (%) 229.25 189.27 213.98 187.36 210.41 SNR (dB) -0.82 18.73 -4.03 -4.51 -4.96 Noon, edge cage PF (Hz) 35.16 29.30 29.30 41.02 29.30 PA (% fs) 0.04 0.67 0.07 0.26 0.00 TP (% fs) 0.09 1.78 0.63 0.55 0.01 THD (%) 100.34 104.34 96.91 81.32 195.20 THD+N (%) 60.23 202.17 146.17 139.38 120.16 IMD (%) 174.90 82.59 96.86 99.14 199.90 SNR (dB) 4.40 -6.11 -3.30 -2.89 -1.60 Noon, center cage PF (Hz) 29.30 70.31 29.30 29.30 29.30 PA (% fs) 0.15 0.07 0.00 0.01 0.07 TP (% fs) 1.12 0.26 0.02 0.05 0.33 THD (%) 124.03 283.84 176.48 90.92 87.91 THD+N (%) 264.29 182.84 130.77 90.24 46.37 IMD (%) 133.26 165.65 213.63 223.16 268.05 SNR (dB) -8.44 -5.24 -2.33 0.89 6.68 Evening, edge cage PF (Hz) 14.65 14.65 14.65 14.65 17.58 PA (% fs) -39.50 -31.02 -42.23 -34.78 -42.48 TP (% fs) -26.88 -25.13 -33.91 -31.28 -37.21 THD (%) 78.06 44.20 197.18 76.10 60.42 THD+N (%) 58.51 278.26 51.32 90.68 124.01 IMD (%) 188.50 271.62 196.98 254.86 233.04 SNR (dB) 4.65 -8.89 5.80 0.85 -1.87 Evening, center cage PF (Hz) 17.58 14.65 14.65 14.65 14.65 PA (% fs) -38.42 -29.64 -35.94 -38.45 -32.32 TP (% fs) -28.80 -28.57 -33.27 -33.47 -21.72 THD (%) 106.80 40.26 61.63 69.59 176.02 THD+N (%) 52.50 9.58 10.36 82.43 140.82 IMD (%) 189.82 196.66 235.03 193.49 295.24 SNR (dB) 5.60 20.37 19.69 1.68 -2.97
TP at noon time is highest and relatively stable at less than 0-2 % fs for both edges
(edge, center) and for all measurement points (A, B, C, D, E). TP at evening always less than at

TELKOMNIKA ISSN: 1693-6930 ■ 11
Sound of Paddle Wheel on Sea Bass Growth (Sunardi)
noon, that is about negative 30 % fs, for all both cage and for all measurement points (A, B, C, D, E). TP at morning always lower than at evening with TP about negative 60 % fs, except at point C and D on edge cage which have higher value than at evening.
THD data have no consistent. However, the trend is evening as lowest (lower than 100%) and morning as highest for both edges (edge, center) and for all measurement points (A, B, C, D, E). THD at noon is between of evening and morning, but have no consistent value.
Generally, profile of THD+N, IMD, and SNR data have no consistent. No consistence at all time of measure (morning, noon, evening), all edges (edge, center) and for all measurement points (A, B, C, D, E) as shown in Table 4.
4.3. Fish Growth Fish growth progress representative by weight has been measured every month for five
months from July until November 2008. The measure of fish divided into fish in the edge cage, fish in the center cage, and fish out of cage. The data can be graphed in Figure 7. Size and weight of fish in cage both edge cage and center cage is less than fish out of cage. Fish in the cage growth is a linear, while fish out of cage growth is like exponentially. Sound not affected to fish growth. Fish growth in the cage is minimal for move or swim to looking for the food. Cage makes fish limited mobility, stress or the psychology is not stable.
The original objectives at the research proposal had not been deployed completely because are not able to record of fish hearing sensitivity then sound profile effect can not to be recorded and sound profile not only influence by paddle wheel but also by season. Sound profile is fluctuation for every day.
y = 147x - 190,752
y = 91x - 117,737
y = 93x - 120,752
0
100
200
300
400
500
600
700
Jul-08 Aug-08 Sep-08 Oct-08 Nov-08
Month
Fish
wei
ght (
g)
Fish in the edge cage
Fish in the center cage
Fish out of cage
Figure 7. Fish growth progress
5. CONCLUSION AND FUTURE WORKS Fish in the edge cage is bigger than the fish in the center cage. It is relate that in the
morning the area in the edge cage receive the sound from paddle wheel higher than the area in the center cage. Signal to Noise Ration (SNR) in the center cage is ten times than edge cage (five times) and these data have been occurred for the morning, noon, and in the evening.
Fish size out of cage is bigger than the fish put in the both of cage (edge cage and center cage). These results can be concluding that the fish outside the cage are freer to moving in the large area to get the food.
ISSN: 1693-6930 12
For excellent results, next research will focus to compare the fish growth with the same condition and the same treatment. The paddle wheel is assumed the noise generator. The noise will be established by the sound generator which has higher power and adjustable frequency.
REFERENCES Amy R. Scholik, Hong Y. Yan, “The effects of noise on the auditory sensitivity of the bluegill sunfish”, Lepomis macrochirus, University of Kentucky, Lexington, KY 40506, USA, 2002.
[1].
Evans, H. D., “The physiology of fishes”, second edition, CRC Press, New York, 1998. [2]. Mann, D.A., Lu, Z. and Popper, A.N., “A clupeid fish can detect ultrasound”, Nature 389(6649): 341, 1997.
[3].
Abby L. Schwarz, “The behavior of fishes in their acoustic environment”, West Vancouver Laboratory, Department of Fisheries and Oceans, Vancouver, British Columbia, Canada, 1985.
[4].
L.E Wysocki, F. Ladich, “Hearing in Fishes under Noise Conditions”, Institute of Zoology, University of Vienna, Althanstrasse 14, 1090 Vienna, Austria, 2005.
[5].
M.S. Weeg . R.R. Fay . A.H. Bass, “Directionality and frequency tuning of primary saccular afferents of a vocal fish”, the plainfin midshipman (Porichthys notatus), 188: 631–641, 2002.
[6].
Popper, A.N. & S. Coombs, “Acoustic detection by fishes”, pp. 403-430. In: M.A. Ali (ed.) Environmental Physiology of Fishes, Plenum Press, New York, 1980.
[7].
Hawkins, A. D. and Myrberg, A. A., Jr., “Hearing and sound communication under water”. In Bioacoustics, a Comparative Approach (ed. B. Lewis), pp.347-405. London: Academic Press, 1983.
[8].
Popper, A. N. and Fay, R. R., “Sound detection and processing by fish: critical review and major research questions”. Brain. Behav. Evol. 41, 14-38, 1993.
[9].
Lagardère, J. P., Bégout, M. L., Lafaye, J. Y. and Villotte, J. P., “Influence of wind-produced noise on orientation in the sole (Solea solea)”. Can. J. Fish. Aquat. Sci. 51, 1258 -1264, 1994.
[10].
Fay, R. R., “Masking of tones by noise for the goldfish”, J. Comp. Physiol. Psychol. 87, 708 -716, 1974.
[11].
Fay, R. R., Ahroon, W. A. and Orawski, A. A., “Auditory masking patterns in the goldfish (Carassius auratus): Psychophysical tuning curves”, J. Exp. Biol. 74, 83-100, 1978
[12].
S. Amoser and F. Ladich, “Are hearing sensitivities of freshwater fish adapted to the ambient noise in their habitats?”
[13]. University of Vienna, Department of Neurobiology and
Behavior, Althanstrasse 14, 1090 Vienna, Austria, 2005.
TELKOMNIKA Vol. 7, No. 1, April 2009 : 1 - 12


![stream geomorp limno [Read-Only] - Oregon State Universityoregonstate.edu/instruct/fw456/lecture/pdf/stream_geomorphology.pdf · (like a horizontal paddle wheel) ... Uniform Flow](https://static.fdocuments.net/doc/165x107/5a730e167f8b9ab1538e2d97/stream-geomorp-limno-read-only-oregon-state-u-like-a-horizontal-paddle.jpg)


