Sorption of nitrogen and water vapor on textile fibers · drying the sample over P20 5• On the...
8
.,.----- U. S. Depa rtment of Commerce National Bureau of Standards Research Paper RP1842 Volume 39, December 1947 Part of the Journal of Research of the National Burea u of Standards Sorption of Nitrogen and Water Vapor on Textile Fibers 1 By John W. Rowen and R. 1. Bla ine :-- Ieas ur ements were m ade of the ad sorptio n of nitrogen and wate r vapor on six puri fi ed text ile fibers and ti taniu m dioxide. It was f ound that all of the fi bers had a relatiYely low cap acity for the ad s orpt ion of nit rogen as co mpare d with thc capaci ty for the adsor ption of ,,'ate r va por. The surface area valu es ra n ged fr om 0,31 sq uar e meter pe r gram fo r nyl on to 0.98 s quar e mete r per gra m for dscose ra yon. Th e values of the fr ee surface ener gieR of adso rp t io n as calc ul ated by the Gibbs adsorptio n equ a tion \\" ere the same for wool, cotton, silk, an d rayon fibers but differ ed for the two synt hetic po lymers, ny lon and acetate r ayon. I. Introduction There is evidence that s urf ace char acteri stics of textile fibers h ave some e ff ect on the properti es of the fmished-textile fa brics. Exa mpl es of such evid ence of surface prop erties are a pp arent in the ph enomenon of w ater-r epellen cy [1, 2],2 in the loss of ligh t -r efl ectance [3] a nd in th e difference in moi s tur e-sorpt ion capa citi es of fabri cs [4 , 5] af te r va rious tr catment s. Although the impor t an ce of surface ch amcteri stics and prop er t ies has long becn r ecognized in the teclmology of colloids a nd other scien ces, th e rel ation of these surf ace prop er ties to the prop er ties of fa brics is no t well under stoo d. Several workers [6, 7, 8, 9, 10, 11 , 12] h ave in- terpr eted the ad orp tion of w ater by some textile · mat erials (s ueh as cellulose, wool, ny lon , etc.) as a ph enomenon in mul timolee ular [1 3] adsorp tion. If one ass umes th at the adsorpt ion is a multilayer ph enomenon , on e may calcul ate th at th e s urf ace ar ea accessible to the fir st l ayer is in the range, from 100 to 200 m 2 jg. This range of valu es is several ord ers of m agni t ud e great er than the v alu e (0.60 m 2 jg) cal cul ated by Emme tt a nd DeWit t [14] from ni trogen adsorption meas ur e- men ts on pap er cellulose. On the other hand , t hi s ra ng e of values is not a ppreeiably great er t han th e v alu e (53 .0 m 2 jg) repor te d by Purves [9 ] et al., working wi th nitro gen on a swollen cotton cellulose. In order to ob tain relia ble s urf ace area meas ur e- ments of textile mat erials it is necess ary to meas ur e the s urfa ce ar ea und er conditions en- I T his paper will also appear in the Dece mber 1947 issue of tbe J, Jnd. and Eng. Chern. , Figures in brackets indicate the literature referen ces at the end of tbis paper. Sorption of Textile Fibers s uring t ru e physical adsorp tion. Bruna uer, Em- m ett, and T eller [13] a nd Hark ins and J ura [15] have shown th at the adsor ption i oth erm s of ni trogen, at - 195 °C (th e boili ng po i nt of nitrogen, at whi ch temp erat ur e ni trogen is ph ysically adso rb ed on solids) m ay be u sed to calcul ate the t ru e surface areas of a great many cr ystalline and a morphous ma te ri als. Kn owledge of the molecular ar ea or s urf ace fLr ea [16] is bclievedn ecessary in ord er to evalu ate such prop er ties as the free s urf ace energy [17] of adso rp tion a nd the work of a dh esion [18] be- tween the liq uid a nd the solid ph ase. It therefore seemed highly desi ra ble th at the s urface areas of the mor e co mmon text il e fibers- cotton, wool, viscose, silk, nylon , and cellulose acetate- be measured. It also seemed des ir able to obtai n the w ater ads orption isotherms of the same sampl es used in th e ni trogen adsorp tion ex p erimen ts. The wor k prese nt ed in the pap er re presents a p ortion of the preliminary work of a l arger pro gram s ponsor ed a nd s uppor te d by the Office of the Quart ermaster General, War Departm ent. 3 It is in tend ed to pro v ide comp arat ive data on the adsorption of the two vapors on SLX differen t purified textile materi als, II. Materials and Their Preparation SLX purified tex tile f ib er s and a sampl e of titanium dioxide (ana tase) were used in t hi s st udy. Th e foul' fib ers, co tton , wool, silk, a nd rfLy on ar e from th e s amples s tudi ed by Wi egerink [19] . Th e tit anium dioxide was employ ed as a reference standard. Th e cot t on was purified by e xtraeting 3 Permi ss ion 1.0 publish t hi s paper was granted by the Oruce of tbe Quarter- mastc!· Gcneral. 479
Transcript of Sorption of nitrogen and water vapor on textile fibers · drying the sample over P20 5• On the...

.,.-----
U. S. Department of Commerce National Bureau of Standards
Research Paper RP1842 Volume 39, December 1947
Part of the Journal of Research of the National Bureau of Standards
Sorption of Nitrogen and Water Vapor on Textile Fibers1 By John W. Rowen and R. 1. Blaine
:-- Ieas urements were made of the adsorption of nit rogen and water vapor on six purified
text ile fibe rs and t itaniu m dioxide. It was found that all of t he fi bers had a relatiYely low
capa city for the adsorption of nitrogen as compared with t h c capacity for t h e adsorption of
,,'ater vapor. T he surface area values ranged from 0,31 sq uare meter per gram for nylon to
0.98 square meter per gram for dscose rayon. The val ues of t he free surfa ce energieR of
adsorp t ion as calculated by the Gibbs adsorption equation \\"ere t he same for wool, cotton,
silk, and rayon fibers b u t differed for t he two synthetic polymers , nylon and acetate rayon.
I. Introduction
There is evidence that surface characteristics of textile fibers h ave some effect on th e proper ties of t he fmish ed- tex tile fabrics. Examples of such evidence of surface proper ties are apparen t in the phenomenon of water-repellency [1, 2],2 in the loss of ligh t-refl ec tan ce [3] and in th e difference in mois ture-sorp tion capacities of fabrics [4 , 5] after various tr catm ents. Al though th e impor tance of surface chamcteristics and proper t ies has long becn r ecognized in the teclmology of colloids and oth er scien ces, the relation of th ese surface proper ties to t he proper ties of fabrics is no t well understood.
Several workers [6, 7, 8, 9, 10, 11 , 12] have interpreted the ad orp tion of water by some textile · materials (sueh as cellulose, wool , nylon, etc.) as a phenomenon in mul timoleeular [1 3] adsorp tion. If one assumes that th e adsorp tion is a multilayer phenomenon, one may calculate that th e surface area accessible to th e first layer is in the range, from 100 to 200 m 2jg. This range of values is several orders of magnitude greater than the v alue (0.60 m 2jg) calculat ed by Emmett and D eWitt [14] from nitrogen adsorption m easuremen ts on paper cellulose. On th e oth er h and, this range of values is not appreeiably greater than the value (53 .0 m 2jg) r eported by Purves [9] et al., working with nitrogen on a swollen cotton cellulose.
In ord er to ob tain relia ble surface ar ea measuremen ts of textile materials it is necessary to m easure the surface area under conditions en-
I T his paper will also appear in the December 1947 issue of tbe J, Jn d. and Eng. Chern.
, Figures in brackets indicate the literature references at the end of tbis paper.
Sorption of Textile Fibers
suring true physical adsorp tion . Br unauer, Emmett, and T eller [13] and Harkins and J ura [15] have shown that th e adsorp tion i oth erms of ni trogen, at - 195°C (th e boiling point of nitrogen, at which temperature nitrogen is physically adsorbed on solids) may be used to calculate th e true surface areas of a grea t many crystalline and amorphous materials.
Knowledge of th e m olecular ar ea or surface fLrea [16] is bclievednecessary in order to evaluate such proper ties as the free surface energy [17] of adsorp tion and th e work of adhesion [18] between the liq uid and the solid phase. It therefore seemed highly des irable that the surface areas of th e more common textile fibers- cotton , wool, viscose, silk, nylon, an d cellulose acetate- be m eas ured. It also seemed desirable to obtain the water adsorption iso therms of th e same samples used in th e ni trogen adsorp tion experimen ts. The work presented in th e paper represents a portion of th e preliminary work of a larger program sponsored and supported by th e Office of the Quartermas ter General , War D epartm ent.3 It is in tended to provide comparative data on the adsorption of th e two vapors on SLX differen t purified tex tile ma terials ,
II. Materials and Their Preparation
SLX purified tex tile fiber s and a sample of titanium dioxide (anatase) were used in this study . The foul' fib ers, co tton, wool, silk, and rfLyon are from the samples studied by Wiegerink [19] . The t itanium dioxide was employed as a r efer en ce standard. The cotton was purified by extraeting
3 Perm ission 1.0 publish this paper was granted by the Oruce of tbe Quartermastc!· Gcneral.
479

with alcohol for 8 hours and with ether for 8 hours, followed by four washings in distilled water at 50° to 60°C. The wool was also extracted with ether and alcohol until th e extracting liq uid was free of residue traces. The wool was then washed at 50° to 60°C in distilled water. The raw silk was degummed in soap solu t ion and then extracted with alcohol and ether. It was then thoroughly washed in distilled water. The viscose rayon was washed four times in a I-percent water solu tion of ammonia at 50° to 60°C and then washed four times with distilled water at the same temperature.
The sample of nylon used in this study was 40 denier, 13 filament yarn, having one-half turn per inch of Z twist. The sample was supplied by th e E. 1. duPont de Nemours Co. It was extracted for 6 hours with ethyl ether. This length of time proved sufficient for the complete removal of the 0.4 percent of oil base lubricant applied during spinning. The acetate rayon was 150 denier, 46 filament yarn having 2% turns pel' inch and was supplied by the American Viscose Co. The sample was washed four times in distilled water at 50° and 60°C.
III. Test Methods
The sorption of water by the textiles was determined gravimetrically using an analytical balance in conjunction with the condi tioning apparatus described by Carson and Worthing-ton [20]. In this apparatus the partial pressure of the water is maintained by m eans of saturated sal t solutions, and the samples may be weighed without removal from the conditioned atmosphere. The moisture vapor pressures were obtained from wet and dry bulb temperatures and also by means of a Dunmore [21] electric hygrometer. The dry weights of th e 5-gram samples of yarn were obtained by placing them over phosphorous pentoxide until constant weight was obtained. This constant weight was attained in about 5 days. It was observed that no loss of weight occurred from the fifth to the thirtieth day. After this drying period , the fibers were in equilibrium wi th an atmosphere whose r elative water vapor partial pressure was less than 0.01. After the dry equilibrium point had b een attained, the moisture content of the sample was determined at a series of increasing relatiye water vapor pressures. The
480
rate of change of weight was plotted against time at each partial pressure, and the equilibrium valu e, usually attained within 24 to 48 hours, was indicated by the rate curve.
The adsorption of nitrogen was determined by a mcthod similar to the one llsed by Brunauer and Emmctt [22]. Th e saturation yapor pressure of th e nitrogen was determined by usc of a yapor pressure thermometer using the purified gas employed for th e adsorption experiment.
The low temperature adsorption tests were made on 20- to 50-gram samples of the fibers . The sample bulb was packed as tightly as possible for each determination to i'edu ce the dead space correction. For the experiments reported in this article, the textile fibers were evacuated for 16 to 20 hours at room temperature (about 25° C) to a pressure of about 10- 6 mm of Hg. Other preliminary tests were mad e in which the temperature of evacuation was higher and one experiment was made of the cotton-fiber surface avai lable to oxygen. For the low temperature adsorption of Ti02 , the temperature of evacuat ion was 200° C. Helium was usrd in eyaluating the dead space in t.he sample bulh.
IV. Results and Discussion
1. Adsorption Mea surements
As shown in figures 1, 2, and 3, tbe adsorption isotherms of both water vapor and nitrogen were found to be s igmoid-shaped, corresponding to th e type II of the five types classified by Brunauer [23]. This type of adsorption curve is characteristic of physical adsorption on rigid solids with pore diameters larger than the molecular diameters of the adsorbed molecules [24]. However, this type of adsorption curve also occurs with nonrigid solids in which the adsorption sites are not restricted to the surface.
It may be noted from figure 1 that the milimoles of water vapor and nitrogen adsorbed by the Ti02 differ only by a small percentage [25] . This is true despite the fact that the nitrogen was adsorbed after thorough evacuation, whereas water vapor was adsorbed from mixtures in air after drying the sample over P 20 5 • On the other hand, comparing the adsorption isotherms of the textile fibers in figures 2 and 3, and the data in table 1 reveals that the order of magnitud e of adsorption capacity of nitrogen and water vapor are not the
Journal of Research
l ________________________________________________________________ _
11 ---
10
~"'o 8 a: -ox ~ 0 7 -
; ~ 6 Q. "-!"t 0 5 -> " ~ ~ 4 V> '" ~ ::5 3 a: Q.
'" 2
a I
N2AT -195 BOC < ...
.. ~---\ ...-- <-
02 03 0 4 0 5 06 07 0 8 REL ATIVE VAPOR PRESSURE PI Po
09 1.0
F I G URE I. - Adsorption isotherms of water and nitrogen on ti tanium dioxide.
same. All the fibers had r elatively low capacity for the adsorption of nitrogen as compared with the relatively high capacity for adsorp tion of water vapor.
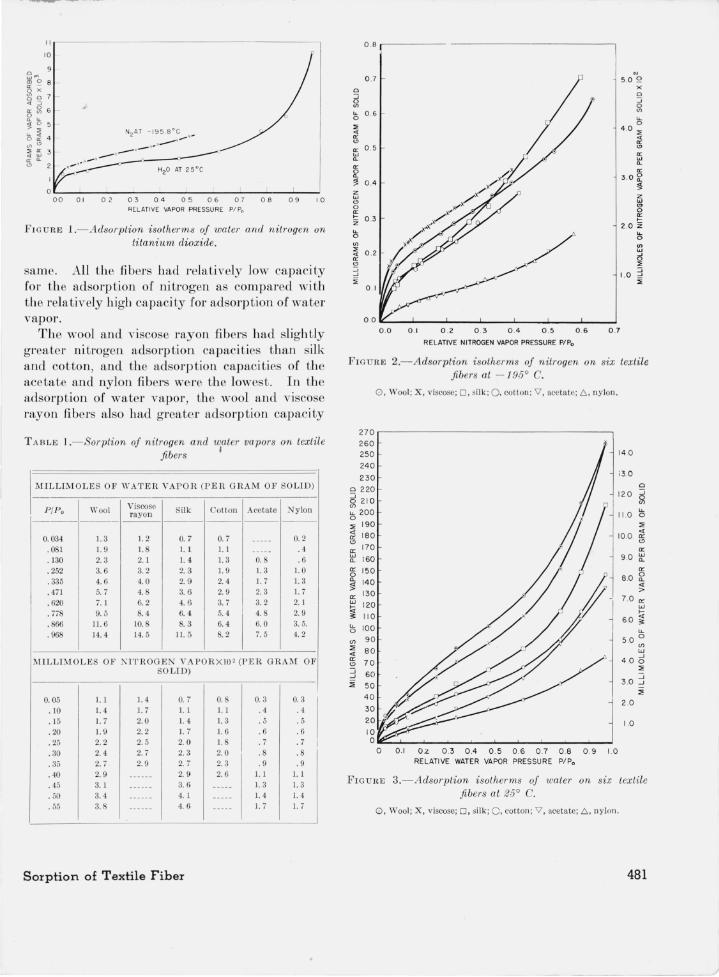
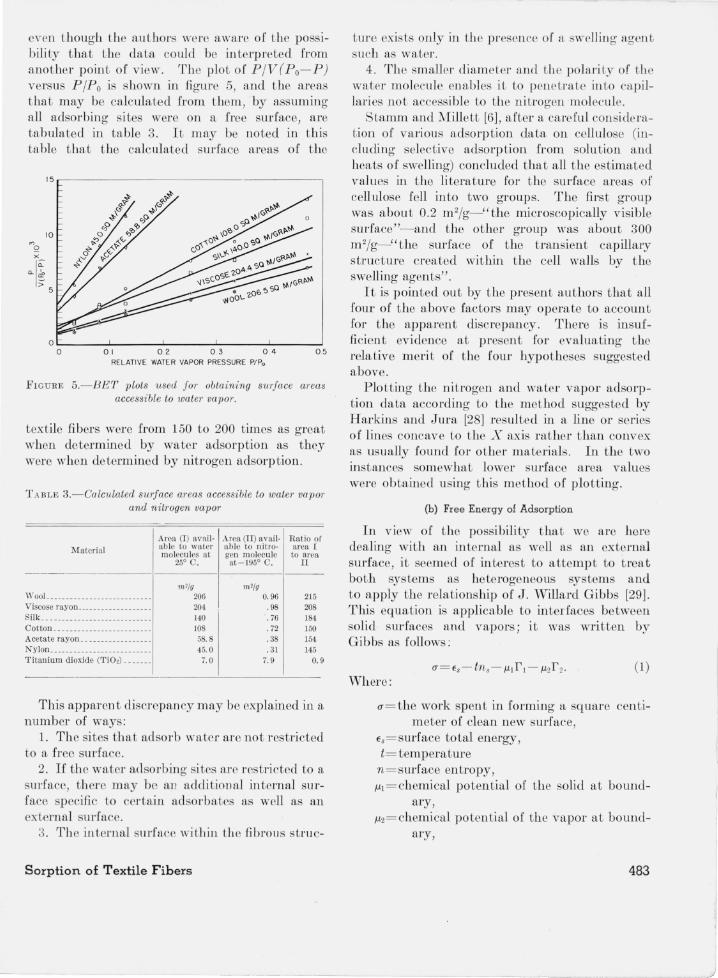
The wool and yiscose ray on fibers had slightly grea ter ni trogen adsorption capacities than silk and cotton, and the adsorption capacities of the acetate and nylon fibers were the lowest . In th c adsorption of water vapor, the wool and viscose rayon fibers also had greator adsorption capacity
T A BLE I .- Sorption of nitrogen and water vapors on textile fi bers '
M ILLlMO L E S OF IrAT E R VAPO R (PE R GR AM OF SOLID)
P IP o Wool Viscose Silk: Cotton Acetate Nylon rayo n - - ----------------------
0. 034 1. 3 1. 2 0. 7 0. 7 ----- 0. 2 . 081 1.9 1. 8 I. l 1.1 ---- . .4 .130 2.3 2. 1 1.4 1. 3 0. 8 . 6 . 252 3. 6 3. 2 2. 3 1. 9 1. 3 1. 0 . 335 4. 6 4. 0 2. 9 2. 4 1. 7 1. 3 . 471 5. 7 4.8 3.6 2.9 2. 3 1.7 . 620 7. 1 6.2 4. 6 3.7 3.2 2. 1 . 778 9.5 8. 4 6.4 5. 4 4.8 2. 9 . 866 11. 6 10.8 8.3 6. 4 6. 0 3.5. . 968 14 . 4 14.5 1.1. 5 8. 2 7.5 4.2
M I LLIM OL E S OF K ITIWGEN VAPO R X lO ' (PER G R AM OF SOLID)
0. 05 1.1 1. 4 0.7 0.8 0.3 0.3 . 10 1.4 1.7 1.1 1. 1 . 4 . 4 . 15 1. 7 2. 0 1.4 1.3 . 5 . 5 .20 1.9 2.2 1.7 1. 6 . 6 .6 .25 2. 2 2. 5 2. 0 1. 8 .7 .7 I . 30 2. 4 2. 7 2. 3 2. 0 .8 . 8 .35 2. 7 2.9 2. i 2.3 . 9 . 9 . 40 2. 9 ------ 2. 9 2.6 1.1 1.1 . 45 3. 1 .--.-. 3. 6 ----- 1. 3 1. 3 .50 3. 4 ------ 4. 1 ----- 1.4 1.4
.55 3.8 ------ 4. 6 ----- 1.7 1.7
Sor p tion of T extile F iber
0 .8r------ ---------------,
.. 5.0 ~
0 x :; 0
s: :; 0
"-VI
0 "-
'" 0
'" 4 .0",
0: '" <.? 0:
0: W
<.?
0: Q. W
0: Q.
0 0: Q. 3 .0 ~ ;;! 0.4 ;;! z w Z <.? W 0 <.? 0: 0 I- 0 .3
0:
Z I-2.0 Z
"- "-0 0 V> VI
'" W
'" 5 0: ;2 '" -' ~ -' 1.0
" " 0 .1
0 .0 1L_.....J. __ ....L... __ L.-_--.l. __ ..l...._--l __ ...J
0 .0 0 .1 0 .2 0 .3 0 .4 0 .5 0 .6 0 .7
RELATIVE NITROGEN VAPOR PRESSURE P/Po
F I GU R E 2.- Aclsorption i sotherms of nitrogen on six textile fibers at - 195° C.
270
26 0 2S0
24 0
230
" 220 ~ 2 10 <f)
LL 200 0
'" 190
'" 18 0 '" '" '" 170
w 160 a.
'" IS O 0 a. 140 ,; '"
130 w 120 ~
" 110 LL 100 0
<f) 90
'" 8 0 .. 0:
70 '" :J 60 -' ::E SO
0, Wool; X, viscose; 0 , sil k; 0, cotton ; \1, aceta te; 6, nylon.
14 0
i3 .0
" 120 :J 0 <f)
11.0 LL 0
::E
10.0 '" '" '" '" 9 .0 w a.
'" 8.0 ~ <l >
- 7 .0 '"
o 0 .1 O.l 0 .3 0.4 0 .5 0 .6 0 .7 0 .8 0 .9 1. 0 RELATIVE WATER VAPOR PRESSURE P/ Po
w
60 ~ "-
S .O 0 <f) w -'
4 .00
'" 3 .0 j
i 2 .0
1.0
F I GU R E 3.- Adsorption isotherms of water on six textile fi bers at 25° C.
0 , Wool; X, viscose; 0 , <ilk ; C, cotton; \1 , acetate; 6 , nylon.
481
)

, -I than silk and cotton, whereas the acetate and
nylon also had the lowest capacities. There was, however, a certain lack of parallelism and shifting of relative position. Sufficient study has not been made to indicate the significance of these differences.
2. C alcula ted Qua ntities
(a) Surface Areas
The surface areas of the fibers available to the nitrogen vapor were calculated according to the BET equation [26], now commonly used for calcula ting the surface areas of solid materials. In evalua ting the quantities of gas required for a monolayer on each of the textile fibers, th e customary method of plotting P jV (Po- P ) versus PjPo was employed [26] . The plot is presented in figure 4. The calculated surface area values are presented in table 2. All of the surface areas
56
52
48
44
4 0
'" 36 :? x 32
I~ 28 0.. '0 0..
- 24 >
20
16
12
4
TABLE 2.- Swjace areas of textile fibe rs
Material
Wool. ..................... .. _ .. . Viscose rayon _______________ ____ _
Silk ...... ..... ...... ......... _ .. . Cotton ......... _ ............. _ .. . Acetate ray a ll ......... ....... _ .. . Nylon ___ ___________________ ____ _
Titanium dioxide (TiO,) .... . _ ...
I Area available to nitrogen molecule at
- 195° C (m '/g)
0.96 .98 . 76 . 72 .38 .3 l
7.90
Purves' exp erimental value sugges ts. The surface area of cotton cellulose thus appears to vary from at least 0.60 to 53.0 m 2jg, depending upon its history. The value for cellulose of 0.60 m 2jg is only slightly larger than values (0.1 - 0.3 m 2 jg) obtained by estimation of areas observed with the microscope and reported by
O ~ ____________ ~ ____________ ~ ______________ ~ __________ ~
o 0 .1 0 .2 0 . 3 0 .4
RELAT IVE NITROGEN VAPOR PRESSU R E P/ Po
FIGURE 4.-BET plots used for obtaining smJace areas accessible to nitrogen.
0, ' Vaa l ; X, viscose; 0 , silk; 0 , cotton; "V, acetate;.6.. nylon.
were less than 1 m 2jg. The value obtained for cotton cellulose- 0.72 m2jg- compares favorably with the 0.60 m 2/g value reported by Emmett and D eWitt [14] . However, i t differs markedly from the value of 53.0 [9] reported by Purvcs for a sample of swollen cotton cellulose. It is pointed out that the surface area available to the nitrogen vapor may be greatly dependent upon the source and treatment as the comparison with
482
Stamm and Millett [6] and Howell and Jackson [27]. It is likely, therefore, that the surface area, as determined with nitrogen , represents a lower limit.
In v iew of the large differences between the adsorption capacities observed in the ,vater isotherm and the nitrogen isotherm, it was of in terest to calculate the "water" areas of the same samples. This calculation was carried ou t
Journal of Research
-~----~----.--------- ._ - ---
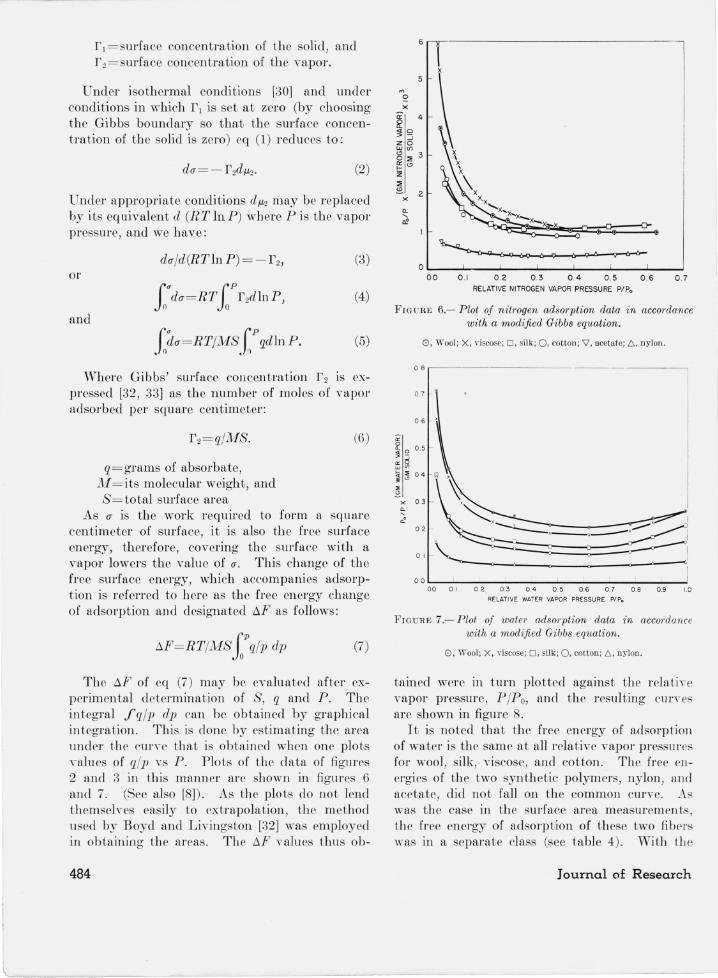
even though the autho rs were aware of the possibility that the data could be interpreted from another point of view. The plot of PIV (Po-P ) versus PIPo is shown in fi gure 5, and the areas that may be calculated from them, by assuming all adsorbing sites were on a free surface, are tabulated in table 3. It may be noted in this table that the calculated surface areas of the
15~------------------------- ----------.
01 0 .2 03 0 .4 0 .5 RELATIVE WATER VAPOR PRESSURE PI Po
F lGUI{E 5.- BET plots used for obtaining surface area~
accessible to water vapor.
textile fibers were from 150 to 200 times as great when determined by wakr adsorption as they were when determined by nitrogen adsorption.
T A BLE 3.-Calculated sU1fac e areas accessible to water valJor and nitrogen vapor
Arca (1) avai l· .~ rca ( [1) avail· Ratio of Material able to water a ble to ni tro· area I
molecules at gcn molecule to area 25° C. at-195° C. II
----- - ·-------------1-------- ---------
m'ly m'ly \\" ooL ... . . .. ................... 206 0.96 215 Viscose rayon. __________________ 204 . 98 208 Silk .. . .. . .......... . ....... . ... 140 .76 184 Cotton . . ....................... J08 .72 150 Acetate rayon .. . ............... 58.8 .38 154 Nylon . . .. ...................... 45.0 _31 145 'ritaniuJTI dioxide (TiO,) ..•.... 7.0 7. 9 0_ 9
This apparel1 t discrepancy may be explained in a number of ways:
1. The sites that adsorb water are not restricted to a free surface.
2. If the water a<1 orbing sites are restricted to a surface, there may be an additiollal internal surface specific to certain adsorbates as well as an external surface.
3. The internal surface within the fibro us struc-
Sorption of Textile Fibers
tUJ'e exists only in the presence of a swell ing agent such as water.
4. The smaller diameter and the polari ty of Lhe water molecule enables it to penetrate into capillaries not accessible to the nitrogen molecule.
Stamm and Millett [6], after a careful co nsideration of various adsorption data on cellulose (including selective adsorp tion from solution and heats of swelling) concluded that all the estimated values in the li terature for the surface areas of cellulose fell into two groups. The first group was about 0.2 m 2/g- " the microscopically visible surface"- and the other group was about 300 m2/g- " the surface of the t ransient capillary structure created within the cell walls by the swelling agents".
It is pointed out by the present authors that all four of the above factors may operate to account for the apparent di crepancy. There is insufficient evidence at present for evaluating the relative merit of the four hypotheses suggested above.
Plotting the nitrogen and water vapor adsorption dftta according to the method suggested by Harkins and Jura [28] resulted in a line or series of lin es concave to the X axis rather than convex as usually found for other materials. In the two instances omewhat lower surface area value were obtained using this method of plotting.
(b) Free Energy of Adsorption
In view of the possibility that we are here dealing with an internal as well as an external surface, it seemed of intere t to attempt to treat both systems as heterogeneous sys tems and to apply the relationship of J . Willard Gibbs [29] . Tlus equation is applicable to interfaces between solid surfftces and vapors ; it was written by Gibbs as follows:
(1) Where:
u= the work spent in forming a square centimeter of clean new surface,
Es= surface total energy, t= temperature
n =surface entropy, f.'1 = chemical potential of the solid at bound
ary, f.'2= chemical potential of the vapor at bound
ary,
483
rl = surface concentration of the solid, and 1'z = surface concentration of the vapor.
Under isothermal conditions [30) and under conditions in which 1'1 is set at zero (by choosing the Gibbs boundary so that the surface concentration of the solid is zero) eq (1 ) reduces to:
(2)
Under appropriate conditions dp,2 may be replaced by its equivalent d (RT In P) where P is the vapor pressure, and we have:
(3) or
(4)
and
(5)
Where Gibbs' surface concentration 1'2 is expressed [32, 33) as the number of moles of vapor adsorbed pel' square centimeter:
q= grams of absorbate, Af= its molecular weight, and S = total surface a,rea
(6 )
As u is the work required to form a square centimeter of surface, it is also the free surface energy, therefore, covering the surface with a yapor lowers the value of rJ . This change of the free surface energy, which accompanies adsorption is referred to here as the free energy change of adsorption and designated t:..F as follows:
t:..F= RT/MS foP q/p dp (7)
The t:..F of eq (7) may be evaluated after experimental determination of S, q and P . The integral Jq /p dp can be obtained by graphical integration. This is done by estimating the area under the cune that is obtained when one plots values of q/p vs P. Plots of th e data of figures 2 and 3 ' in this manner are shown in figures 6 and 7. (See also [8]). As the plots do not lend themselves easily to extrapolation, the method used by Boyd and Livingston [32) was employed in obtaining the areas. The t:..F values thus ob-
484
l_________________ _~ ____ _
'" o x
6.v----------------------------------,
5
a: 4 1t :;3 zo Wv>
g ::< 3
~'" Z ::< ~ 2
x
o ~ __ ~ ____ ~ __ ~ ____ ~ ____ ~ __ ~ __ ~ 0.0 0.1 0 .2 0 .3 0.4 0 .5 0 .6 0 .7
RELATIVE NITROGEN VAPOR PRESSU RE PIP.
FIG URE 6.- Plot of nitrogen adsorption data in accordance with a modified Gibbs equation.
x a. , O!
0 , \Voo1; X , "iscose; 0 , silk; 0 , cotton; 'V, acetate; 6 , nylon.
0 8 ----- ---------- --,
0 .7
0 6 '
01
OO ~ ________________ ~ ________ ~ ______ ~
00 0 .1 02 0 .3 0.4 0 .5 0 .6 0 .7 0.8 0.9 1.0
RELATIVE WATER VAPOR PRESSURE P/Po
FIGURE 7.- Plot of waler ads01'ption data in accorda nce with a mod1:jied Gibbs equati on.
0, \Vool; X, Yiscose; 0 , silk ; 0 , cotton ; D.. , nylon .
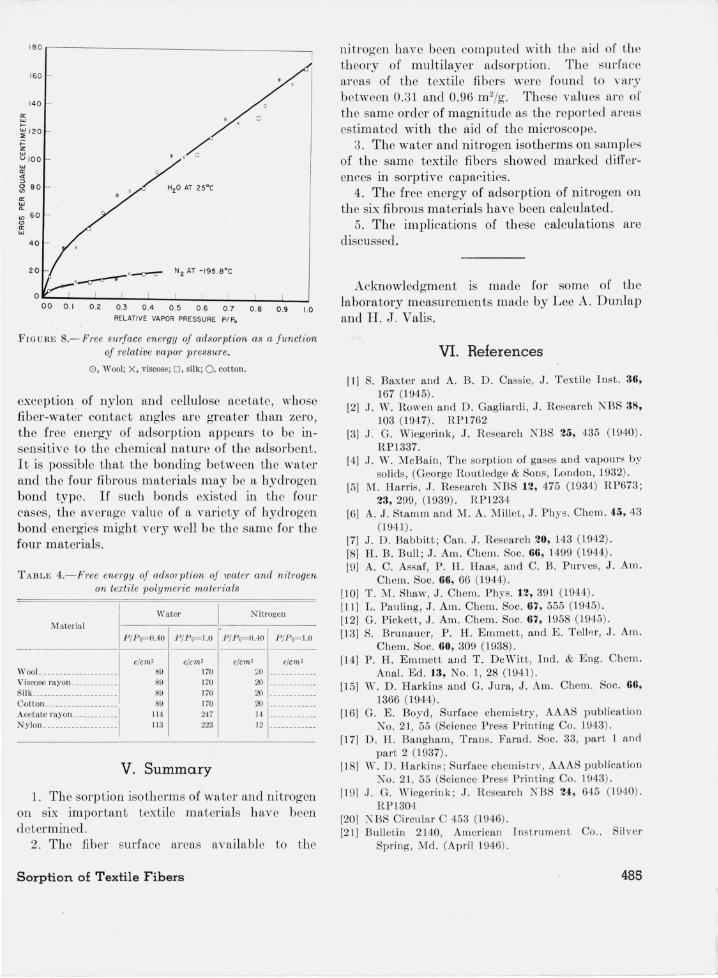
tained were in turn plotted against the rela tiye vapor pressure, P /Po, and the resulting CUITes are shown in figure 8.
It is noted that the free energy of adsorption of water is the same at all relative vapor pressures for wool, silk, viscose, and cotton. The free energies of the two synthetic polymers, nylon, and acetate, did not fall on the common curve. As was the case in the surface area measurements, the free energy of adsorption of these two fibers was in a separate class (see table 4). With th e
Journal of Research
180,-----------__________________________ ~
a: w I-
160
140
~ 120
>= z w u 100 w a:
'" ::> g SO a: w a. <f) 60
'" a: w
40
20 N2 AT -195 .SoC
o I I
0.0 0 .1 0 .2 0 .3 0.4 0 .5 0 .6 0 .7 0 .8 0 .9 1.0
RELATIVE VAPOR PRESSURE PI Po
FIG U RE 8.--Free surface energy of adsorption as a fu.nction of relative vapor pre,~sure.
0. Wool ; X. viscose; D, silk; 0 , cotton.
exception of nylon and cellulose a,cetate, whose fiber-water contact angles arc grcater than zero , the free energy of adsorption appears to be insensitive to the chemical nature of the adsorbent. It is possible that the bonding between the water and the four fibrous materials may be a hydrogen bond type. If such bonds existed in the four cases, the average value of a variety of hydrogen bond energies might very well be the same for the four materials.
T A BLE 4.- Free energy of ads01 pli on of water and nitl'ogen on texti le polymeric materials
Water N itrogen Material
PIP o=Q.40 P IP o=1.0 PIP o=O.40 1'IP o=1.0 --------------- -·-----1------1--------1------
elem' WooL ___________________ 89 Viscose rayon____________ 89 Silk___________________ ___ 89 CottOIl ___ ____________ ____ 89 Acetate rayon ____________ 1 II ,j Nylon __ _ ___ ____ ____ _ ___ _ 11 3
elem> 170 ] 70 170 ]70 247 223
V. Summary
elem' elem' ~O ________ ___ _ 20 _______ ____ • 20 ___________ _
20 1 ___________ _ 14 _______ __ __ _
.12 __________ _ _
1. The sorption iso therms of water and nitrogen on six important textile materials haye been determined.
2. The fib er surface areas available to the
Sorption of Textile Fibers
nitrogen have been computed with th e a id of the theory of multilayer adsorption. The surface areas of the textile fibers were found to vary between 0_ 31 and 0.96 m 2/g. These valu es arc of the same order of magnitude as the reported areas estimated with the aid of the microscope.
3. The waLeI' and nitrogen isotherms on samples of the same textile fibers showed marked differences in sorptive capacities.
4. The free energy of adsorption of nitrogen on the six fibrous materials have been calculated.
5. The implications of these calculations are discussed.
Acknowledgment is made for some of the laboratory measurements made by Lee A. Dunlap and H. J. Valis.
VI. References
[1] S. Baxte r and A. B. D . Cassie, J . T ext ile Inst. 36, 167 (1945) .
[2] J. Vol . Rowen and D. Gagliardi, J. Research NBS 38, 103 (1947). RP1762
[3] J _ G. Wiegerink, .J. R esearch NBS 25, 435 (1940). RP1337.
[4] J . W. McBain , Th e so rption of gases and vapours by solids, (George Rout ledge & Sons, London , 1932).
[5] M. Harris. J . R esea rch N BS 12, 47,,) (1934) RP673 ; 23,299, (1939) . RP1234
[6] A. J . Stamm and M . A. Millet, J. Phys. Chem. <l5, 43 (1941) .
[7] J. D. Babbitt; Can. J . Research 20, 143 (1942). [8] H . B. Bull ; J. Am. Chem. Soc. 66, 1499 (1944). [9] A. C. Assaf, P. H . Haas, and C. B . Purves, J . Am.
Chem. Soc. 66, 66 (1944). [10] T. M . Shaw, J . Chem. Phys. 12, 391 (1944). [11] L. Pauling, J . Am. Chem. Soc. 67, 555 (1945). [12] G. Pickett, J . Am. Chem. Soc. 67, 1958 (1945) . [13] S. Brunauer, P. H. Emmett, and E. T ell 'l l', J. Am.
Chem. Soc. 60, 309 (1938). [14] P. H. Emmett and T. D eWitt, Ind. & Eng. Chem.
Anal. Ed. 13, No.1, 28 (1941). [15] W. D. Harkins and G. Jura, J . Am. Chem. Soc. 66,
1366 (1944). [16] G. E. Boyd, Surface chemistry, AAAS publi catio n
No. 21,55 (Science Press Printing Co. 1943) . [17] D . H. Bangham, Trans. Farad. Soc. 33, part 1 and
part 2 (1937) . [18] W. D . Harkins; Surface chemistry, AAAS publication
No . 21 , 55 (Science Press Prin t ing Co. 1943) . [19] J . G. Wicgerink ; J . Research NBS 2<l, 645 (1940) .
RP1304 [20] NBS Circular C 453 (1946) . [21] Bul letin 2140, Am erican In. t rum ent Co. , Si lver
Spring , Md. (April 1946) .
485

[22] P. H. Emmett, A n ew method for measuring th e surface areas of finely divided materials and for determining the size of particles. Symposium on New M ethods for Particle Size Determ ination in the Subsieve Range, ASTM (1941).
[23] S. Brunauer, The adsorption of gases and vapors, p. 149 (Princeton Univ. Press, Princeton , N. J. , 1943) . Symposium on K e\y Methods for Particl e Size Determinatio n in t he Subsieve Range, AST:\1 (1941).
[24] P. H. Emmct t and :\,1:. Cines, J. Am. Chem . Soc. 68, 2535 (1946).
[25] P. H . Emmett, J. Am. Chern. Soc. 68, 1784 (1946). [26] S. Brunauer, The adsorption of gases and vapors
(Princeton Univ. Press, Princeton, N. J ., 1943).
486
[27] R. Howell and A. Jackson , J . Chem. Soc. (London) 979 (1937) .
[28] ,"Y. D. Harkins and G. Jura, J. Am. Chem. Soc. 66, 1366 (1944) .
[29] J. \Y. Gibbs, Collected works 1, 92 and 315 (Longmans, Green and Co., 1\e\\' York, N. Y. 1928) .
[30] D . H . Bangham. Trans. Farad. Soc. 33, part 1 (1937).
[31] D . H. Bangham and R. K. Razouk, Trans. Farad , Soc. 33, part 2, 1463 (1937).
[32] G. E. Boyd and H . K. Liyingston , J. Am. Chem. Soc . 64, 2383 (1942).
'WASHINGTON, J une 17, 1947.
Journal of Research