Song 11 Endoscopic laser speckle contrast imaging … · Endoscopic laser speckle contrast imaging...
9
Endoscopic laser speckle contrast imaging system using a fibre image guide Lipei Song* and Daniel Elson Hamlyn Centre for Robotic Surgery; Institute of Global Health Innovation and Department of Surgery and Cancer Imperial College London, Exhibition Road, London, SW7 2AZ, UK ABSTRACT There are several challenges when fibre image guides (FIG) are used for endoscopic speckle acquisition: cross talk between fibre cores, FIG fixed pattern noise, the small probe diameter and low sensitivity and resolution due to the decreased number of speckles and their low transmission through the FIG. In this paper, an endoscopic laser speckle contrast analysis system (ELASCA) based on a leached fibre image guide (LFIG) is presented. Different methods of acquiring LASCA images through LFIGs were investigated including the effect of changing the number of speckles per fibre, defocusing the FIG image onto the CCD and processing speckle images with masks and Butterworth filters to deal with the LFIG fixed pattern and noise from the cladding. The experimental results based on a phantom consisting of intralipid suspension pumped at varying speed showed that this system could detect speed changes and that in the case of multiple speckles per fibre the Nyquist frequency criterion need not be applied since the speckle may be transferred through the fibres to some extent. In contrast to the previously reported ELASCA results, this system can both give a map of the observed area and the temporal change in flow. An additional benefit is the small size of the LFIG, which is compatible with current endoscopic instrument channels and may allow additional surgical applications. Keywords: Endoscope, laser speckle contrast, fibre image guide 1. INTRODUCTION Detection of circulatory and perfusional abnormalities is critical to the detection or diagnosis of a number of diseases, including cancer, organ viability and cardiac health. One technique to detect the movement of light-scattering red blood cells is called laser speckle contrast analysis (LASCA), which can allow visualisation of relative changes in blood flow speed or image the network of blood vessels close to the tissue surface. By applying a pseudo colour scale that corresponds to the contrast values of a speckle image, the blood flow speed distribution in the tissue can also be viewed. LASCA has been demonstrated as a technique for preclinical investigation of blood supply related diseases, such as stroke [1] , skin blood perfusion under thermal therapy [2, 3] , and cocaine induced cortical circulation changes [4, 5] . Since LASCA is limited by the penetration depth of the light it has mainly been reported to detect changes in blood circulation in the epidermal layer, or in brain cortical sensing following the surgical thinning of the skull of the tested animal [6, 7] . To increase the number of possible application areas of this technique it would be desirable to construct an endoscopic instrument to view, for instance, the vasculature of the colon wall, or the motion of red blood cells in other organs, both during and after a surgical procedure and for supervision of the recovery. In previous work in this area, Bray et al. [8, 9] tried attaching a high resolution CCD to a standard arthroscopic endoscope to monitor the circulation recovery in the human knees with the LASCA technique, but this setup required the use of a rigid Hopkins lens type endoscope and would not be suitable for following curved paths for intraluminal application. Dmitry et al. [10] used a bundle of optical fibres to detect the change in speckle dynamics during thermally induced tissue changes. However, this probe could not give the contrast distribution across an area of interest. The use of fibre image guides (FIG) is one possibility for acquisition of speckle patterns and images of the target in a flexible probe. One of the limitations of this technology is the cross talk that occurs between neighbouring fibres, which
Transcript of Song 11 Endoscopic laser speckle contrast imaging … · Endoscopic laser speckle contrast imaging...
Endoscopic laser speckle contrast imaging system
using a fibre image guide
Lipei Song* and Daniel Elson
Hamlyn Centre for Robotic Surgery;
Institute of Global Health Innovation and Department of Surgery and Cancer
Imperial College London, Exhibition Road, London, SW7 2AZ, UK
ABSTRACT
There are several challenges when fibre image guides (FIG) are used for endoscopic speckle acquisition: cross talk
between fibre cores, FIG fixed pattern noise, the small probe diameter and low sensitivity and resolution due to the
decreased number of speckles and their low transmission through the FIG. In this paper, an endoscopic laser speckle
contrast analysis system (ELASCA) based on a leached fibre image guide (LFIG) is presented. Different methods of
acquiring LASCA images through LFIGs were investigated including the effect of changing the number of speckles per
fibre, defocusing the FIG image onto the CCD and processing speckle images with masks and Butterworth filters to deal
with the LFIG fixed pattern and noise from the cladding. The experimental results based on a phantom consisting of
intralipid suspension pumped at varying speed showed that this system could detect speed changes and that in the case of
multiple speckles per fibre the Nyquist frequency criterion need not be applied since the speckle may be transferred
through the fibres to some extent. In contrast to the previously reported ELASCA results, this system can both give a
map of the observed area and the temporal change in flow. An additional benefit is the small size of the LFIG, which is
compatible with current endoscopic instrument channels and may allow additional surgical applications.
Keywords: Endoscope, laser speckle contrast, fibre image guide
1. INTRODUCTION
Detection of circulatory and perfusional abnormalities is critical to the detection or diagnosis of a number of diseases,
including cancer, organ viability and cardiac health. One technique to detect the movement of light-scattering red blood
cells is called laser speckle contrast analysis (LASCA), which can allow visualisation of relative changes in blood flow
speed or image the network of blood vessels close to the tissue surface. By applying a pseudo colour scale that
corresponds to the contrast values of a speckle image, the blood flow speed distribution in the tissue can also be viewed.
LASCA has been demonstrated as a technique for preclinical investigation of blood supply related diseases, such as
stroke [1]
, skin blood perfusion under thermal therapy[2, 3]
, and cocaine induced cortical circulation changes [4, 5]
.
Since LASCA is limited by the penetration depth of the light it has mainly been reported to detect changes in blood
circulation in the epidermal layer, or in brain cortical sensing following the surgical thinning of the skull of the tested
animal [6, 7]. To increase the number of possible application areas of this technique it would be desirable to construct an
endoscopic instrument to view, for instance, the vasculature of the colon wall, or the motion of red blood cells in other
organs, both during and after a surgical procedure and for supervision of the recovery.
In previous work in this area, Bray et al. [8, 9]
tried attaching a high resolution CCD to a standard arthroscopic endoscope
to monitor the circulation recovery in the human knees with the LASCA technique, but this setup required the use of a
rigid Hopkins lens type endoscope and would not be suitable for following curved paths for intraluminal application.
Dmitry et al. [10]
used a bundle of optical fibres to detect the change in speckle dynamics during thermally induced tissue
changes. However, this probe could not give the contrast distribution across an area of interest.
The use of fibre image guides (FIG) is one possibility for acquisition of speckle patterns and images of the target in a
flexible probe. One of the limitations of this technology is the cross talk that occurs between neighbouring fibres, which
are separated by a thin cladding layer. In addition, the fixed fibre core pattern and the variation of the transmission and
cross talk with vibration of the FIG have also limited its application to LASCA. In one FIG-based approach Nadkarni et
al. used leached fibre image guides (LFIG) and proved that LFIGs could effectively reduce the cross talk between the
fibre cores and could stabilise the correlation time even when the LFIG was moving at 12 mm/s [11]
. This approach
allowed the temporal dynamics of the movement of scatterers to be studied.
In this paper we introduce a concept for ELSCI which uses a single mode fibre (SMF) for illumination and a LFIG for
transmitting the speckle images. Two distinct speckle size regimes were explored: multiple fibre cores per speckle and
multiple speckles per fibre core. There is a compromise between satisfying the Nyquist frequency (if treating the fibre
cores as the resolution-limiting spatial elements) and the field of view. To achieve the Nyquist frequency and then treat
the fibre cores as integrating the incident light, the speckle size must be no smaller than two fibre cores, which then
places a limit and the number of spatial elements in the processed LASCA image, especially due to the typically low
resolution of FIGs (the number of fibres typically numbers a few 10,000). To achieve a large field of view and a higher
light intensity, the speckle size could be less than one fibre core, but this relies on multiple speckles being transmitted
through one core, and changes in the contrast of the speckles at the input face must be preserved in some way at the
output face. Although the Nyquist frequency criterion is not satisfied in this case, it does not strictly apply due to the
possibility for interference information to be transmitted by the fibres.
These two regimes (multiple speckles per core and multiple cores per speckle) were investigated together with methods
to remove the fixed pattern noise of the LFIG, and also the influence from the varying transmission efficiencies for
different fibre cores. Experimental results were recorded using a phantom consisting of a network of channels with
different diameters, which showed that this system could measure changes in speed and could also image the flow in the
different channels.
2. MATERIALS AND METHODS
This section is divided into two parts corresponding to the two regimes tested – multiple fibres per speckle and multiple
speckles per fibre. The experimental set-up is similar for both cases and is illustrated in Fig 1. The illumination He-Ne
laser beam (660nm, Thorlabs) was coupled into a single mode fibre and delivered to the target. The scattered light from
the target was collected by a plano-convex lens (f=6mm, D=3mm, Edmund) and was divided into two beams by a
splitter. One of the beams passed through a leached FIG (Schott North America) and was imaged onto the CCD
(QImaging Retiga Exi) after being magnified by a combination of 10 x microscope objective lens and a lens of 100 mm
focal length. Another beam was directly captured by a same type of CCD. This two-beam configuration ensured that the
two CCDs captured the same signal. The speckle size was changed by adjusting the aperture size. For large speckle
sizes, the transmission image of LFIG was recorded with white light illumination.
2.1 Multiple fibre cores per speckle
Experiment setup (1)
For speckle size regime one (multiple fibres per speckle) two targets were used: a reflectance standard as a rigid target
and a silicon tube with internal diameter of 1 mm (Fig 2(a)). The reflectance standard was moved by a motor at speed
from 0 to 0.5 mm/s with an increment of 0.05 mm/s. The speckle images were recorded by the two CCDs
simultaneously so that the contrast values calculated from the speckle images through the LFIG and the free space could
be compared. The integration time was 30ms and ten frames were recorded for each speed. Another target was a
silicone tube for imaging speed distribution. The intralipid suspension (intralipid:water=1:2) was pumped into the tube
by a syringe pump (NE-300, World Precision Instruments Ltd.)
When treating the fibres cores comprising the fibre image guide as the spatial resolution-limiting elements, according to
the Nyquist sampling theorem, the speckle size should be no smaller than two fibre cores on the distil end of the FIG [12].
In this case the spatial frequencies of the speckle pattern are lower than that of the hexagonal packed fixed fibre pattern.
Therefore if the proximal end of the FIG is imaged onto a CCD, the fixed fibre pattern can be removed by image
processing using a low pass filter whose cut-off frequency is equal to the highest spatial frequency of the speckle pattern.
Note that defocusing of the LFIG could not be applied in this case as it would not remove the contribution from the
cladding and would be prone to errors from the different fibre transmissions. The speckle size on the distil end of the
FIG can be determined using the following formula, if assuming the use of a plane-wave illumination and single lens
imaging geometry[13]
:
� =� ∙ �
� ∙ �∙ (1 + �)
Where λ is the illumination wavelength, q is the radius of the aperture, f is the focal length and M is the system
magnification. By adjusting the aperture size the speckle size can be changed. Experiments were carried out to test the
influence of the speckle sizes on the LASCA images after processing with a Matlab program.
Data processing
Fig 3 shows the flow chart of the data processing method. The LFIG is a hexagonally assembled fibre bundle, therefore
the fixed fibre pattern was the main contribution to the contrast values in the image of output end of the LFIG. In
addition when the scattered light passes through the FIG, some contributions from the cladding become a source of noise
in the final speckle images. The impact of transmission efficiency of each single fibre core and between different fibre
cores is another factor that should be taken into account for FLSCI. In this paper, a Matlab program combining three
processing steps was used to remove these noises. Firstly the raw speckle images were divided by the image of FIG
acquired with white light illumination to remove the influence of transmission efficiency. Secondly a logical map of the
FIG was multiplied by the speckle images to extract the signal only from the fibre cores. Then after Fourier transform, a
Butterworth filter was applied to remove the contribution from the fibre pattern. The Butterworth filter is a low pass
filter with minimal additional artefacts induced by the shape of the cutting edge. This process was based on the
condition that the speckle size was bigger than the fibre size. When the speckle size was smaller than the fibre size, the
filter size was chosen to match the fibre bundle spatial frequency. After the three steps, contrast was calculated on the
retrieved speckle images.
In this paper global contrast and local contrast were calculated for testing the performance for different purposes. Global
contrast was calculated using all the pixels in a region of interest, and to obtain the highest accuracy the global contrast
was calculated averaged over the 10 frames. Local contrast was performed with a sample window of 5x5 pixels and was
used for calculating LASCA images.
2.2 Multiple speckles per fiber core
Experiment setup (2)
In the experiment for imaging the speed distribution, the splitter and the direct path 1 (as shown in Fig 1) were removed
and the target was changed to a structure of channels with diameters ranging from 0.5 mm to 4 mm (Fig 2(b)). These
structures could introduce different flow modes in these channels. The imaging area was 10 mm in diameter. To avoid
extra data processing and save calculation time, the image of the LFIG on the CCD was defocused slightly to remove the
fibre pattern. The calculated speckle size was 0.18 µm which meant one fibre core contained more than 20 speckles.
However, the limited number of modes for the LFIG fibres meant that the maximum number of speckles per core at the
CCD was approximately 8 [14]
. The exposure time was set to 10 ms and 120 frames were recorded while the intralipid
suspension flow speed was increased from 0 (first 20 frames) to 1.6 ml/min which corresponds to approximately 2 mm/s.
This was repeated twice, once with the proximal facet of the FIG focused on the CCD, and once with it defocused. A
further ten speeds from 0 to 1 ml/min (corresponding to 1.2 mm/s) with an increment of 0.1 ml/min were also tested to
investigate whether the out-of-focus system could detect the small speed changes, with 10 frames captured at each speed.
Display methods
In this experiment the contrast values in the flowing area were in the range of 0 to 0.1. Comparing to the contrast values
in the stationary areas, the change of the contrast due to flow speed was too low to be seen clearly. In this paper the
display range of the contrast map was set between 0 and the FWHM of the Probability Density Function of the contrast
in the first frame when the flow speed was 0 ml/min. The contrast map used a pseudo colour according to the desired
display range and converted from RGB to HSV. All the procedures were finished by a Matlab programme.
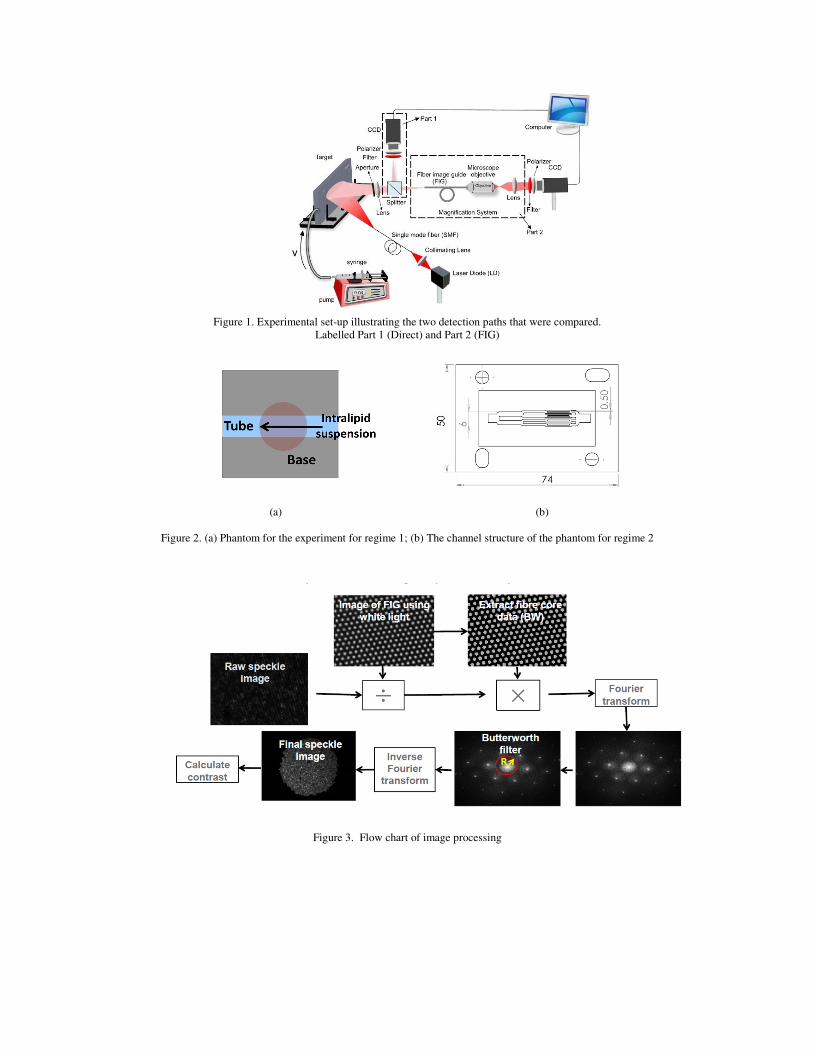
Figure 1. Experimental set-up illustrating the two detection paths that were compared.
Labelled Part 1 (Direct) and Part 2 (FIG)
(a) (b)
Figure 2. (a) Phantom for the experiment for regime 1; (b) The channel structure of the phantom for regime 2
Figure 3. Flow chart of image processing
3. RESULTS
3.1 Multiple fibre cores per speckle
In this experiment the speckles were sampled first by the fibre core pattern and then by the CCD. When the speckle size
was bigger than two fibre cores, this sampling complies with the Nyquist sampling theorem and the signal could be
better preserved. However, at the same time the LFIG structure become the main contributor to the contrast values.
Because the speckle size was larger than the fibre size, the highest spatial frequency of speckles was smaller than that of
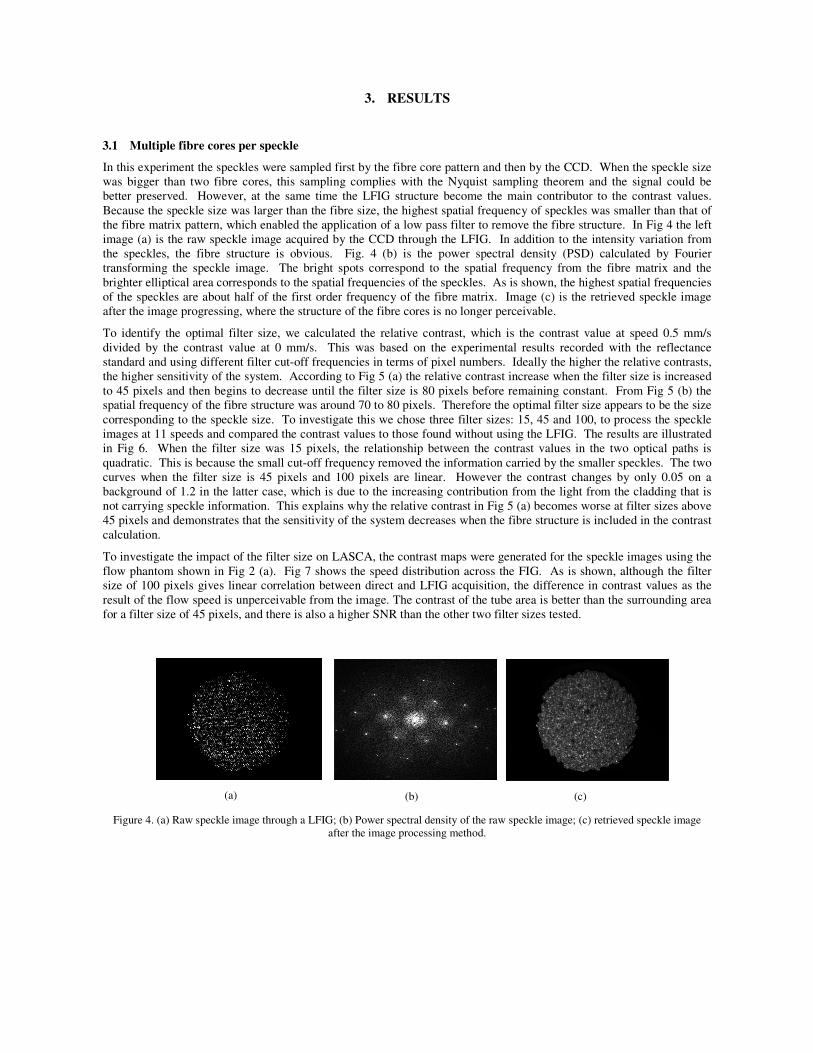
the fibre matrix pattern, which enabled the application of a low pass filter to remove the fibre structure. In Fig 4 the left
image (a) is the raw speckle image acquired by the CCD through the LFIG. In addition to the intensity variation from
the speckles, the fibre structure is obvious. Fig. 4 (b) is the power spectral density (PSD) calculated by Fourier
transforming the speckle image. The bright spots correspond to the spatial frequency from the fibre matrix and the
brighter elliptical area corresponds to the spatial frequencies of the speckles. As is shown, the highest spatial frequencies
of the speckles are about half of the first order frequency of the fibre matrix. Image (c) is the retrieved speckle image
after the image progressing, where the structure of the fibre cores is no longer perceivable.
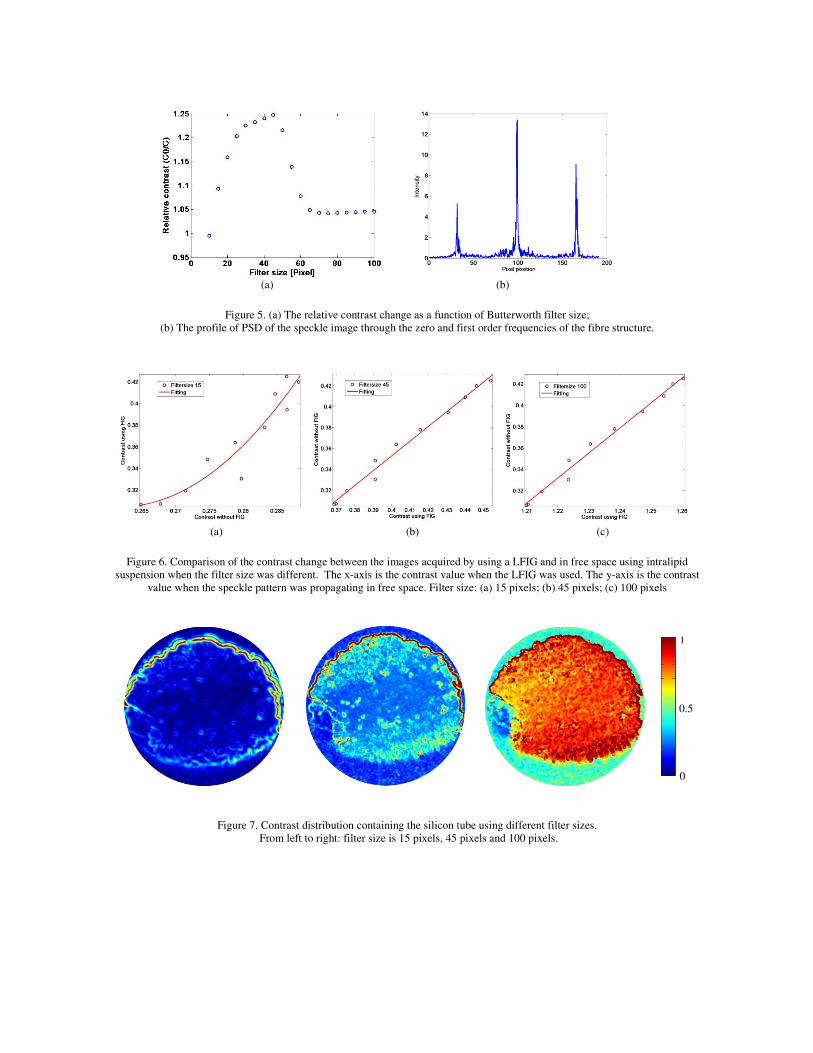
To identify the optimal filter size, we calculated the relative contrast, which is the contrast value at speed 0.5 mm/s
divided by the contrast value at 0 mm/s. This was based on the experimental results recorded with the reflectance
standard and using different filter cut-off frequencies in terms of pixel numbers. Ideally the higher the relative contrasts,
the higher sensitivity of the system. According to Fig 5 (a) the relative contrast increase when the filter size is increased
to 45 pixels and then begins to decrease until the filter size is 80 pixels before remaining constant. From Fig 5 (b) the
spatial frequency of the fibre structure was around 70 to 80 pixels. Therefore the optimal filter size appears to be the size
corresponding to the speckle size. To investigate this we chose three filter sizes: 15, 45 and 100, to process the speckle
images at 11 speeds and compared the contrast values to those found without using the LFIG. The results are illustrated
in Fig 6. When the filter size was 15 pixels, the relationship between the contrast values in the two optical paths is
quadratic. This is because the small cut-off frequency removed the information carried by the smaller speckles. The two
curves when the filter size is 45 pixels and 100 pixels are linear. However the contrast changes by only 0.05 on a
background of 1.2 in the latter case, which is due to the increasing contribution from the light from the cladding that is
not carrying speckle information. This explains why the relative contrast in Fig 5 (a) becomes worse at filter sizes above
45 pixels and demonstrates that the sensitivity of the system decreases when the fibre structure is included in the contrast
calculation.
To investigate the impact of the filter size on LASCA, the contrast maps were generated for the speckle images using the
flow phantom shown in Fig 2 (a). Fig 7 shows the speed distribution across the FIG. As is shown, although the filter
size of 100 pixels gives linear correlation between direct and LFIG acquisition, the difference in contrast values as the
result of the flow speed is unperceivable from the image. The contrast of the tube area is better than the surrounding area
for a filter size of 45 pixels, and there is also a higher SNR than the other two filter sizes tested.
Figure 4. (a) Raw speckle image through a LFIG; (b) Power spectral density of the raw speckle image; (c) retrieved speckle image
after the image processing method.
(a) (b) (c)
(a) (b)
Figure 5. (a) The relative contrast change as a function of Butterworth filter size;
(b) The profile of PSD of the speckle image through the zero and first order frequencies of the fibre structure.
(a) (b) (c)
Figure 6. Comparison of the contrast change between the images acquired by using a LFIG and in free space using intralipid
suspension when the filter size was different. The x-axis is the contrast value when the LFIG was used. The y-axis is the contrast
value when the speckle pattern was propagating in free space. Filter size: (a) 15 pixels; (b) 45 pixels; (c) 100 pixels
Figure 7. Contrast distribution containing the silicon tube using different filter sizes.
From left to right: filter size is 15 pixels, 45 pixels and 100 pixels.
1
0.5
0
3.2 Multiple speckles per fibre core
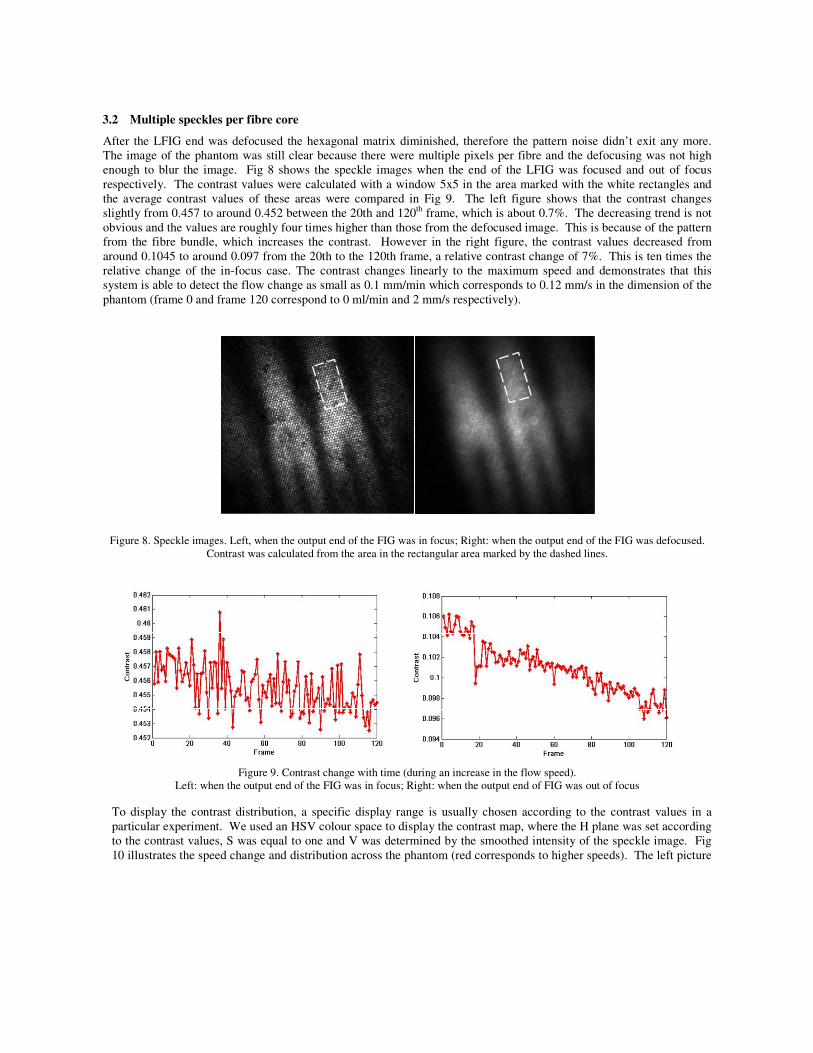
After the LFIG end was defocused the hexagonal matrix diminished, therefore the pattern noise didn’t exit any more.
The image of the phantom was still clear because there were multiple pixels per fibre and the defocusing was not high
enough to blur the image. Fig 8 shows the speckle images when the end of the LFIG was focused and out of focus
respectively. The contrast values were calculated with a window 5x5 in the area marked with the white rectangles and
the average contrast values of these areas were compared in Fig 9. The left figure shows that the contrast changes
slightly from 0.457 to around 0.452 between the 20th and 120th frame, which is about 0.7%. The decreasing trend is not
obvious and the values are roughly four times higher than those from the defocused image. This is because of the pattern
from the fibre bundle, which increases the contrast. However in the right figure, the contrast values decreased from
around 0.1045 to around 0.097 from the 20th to the 120th frame, a relative contrast change of 7%. This is ten times the
relative change of the in-focus case. The contrast changes linearly to the maximum speed and demonstrates that this
system is able to detect the flow change as small as 0.1 mm/min which corresponds to 0.12 mm/s in the dimension of the
phantom (frame 0 and frame 120 correspond to 0 ml/min and 2 mm/s respectively).
Figure 8. Speckle images. Left, when the output end of the FIG was in focus; Right: when the output end of the FIG was defocused.
Contrast was calculated from the area in the rectangular area marked by the dashed lines.
Figure 9. Contrast change with time (during an increase in the flow speed).
Left: when the output end of the FIG was in focus; Right: when the output end of FIG was out of focus
To display the contrast distribution, a specific display range is usually chosen according to the contrast values in a
particular experiment. We used an HSV colour space to display the contrast map, where the H plane was set according
to the contrast values, S was equal to one and V was determined by the smoothed intensity of the speckle image. Fig
10 illustrates the speed change and distribution across the phantom (red corresponds to higher speeds). The left picture
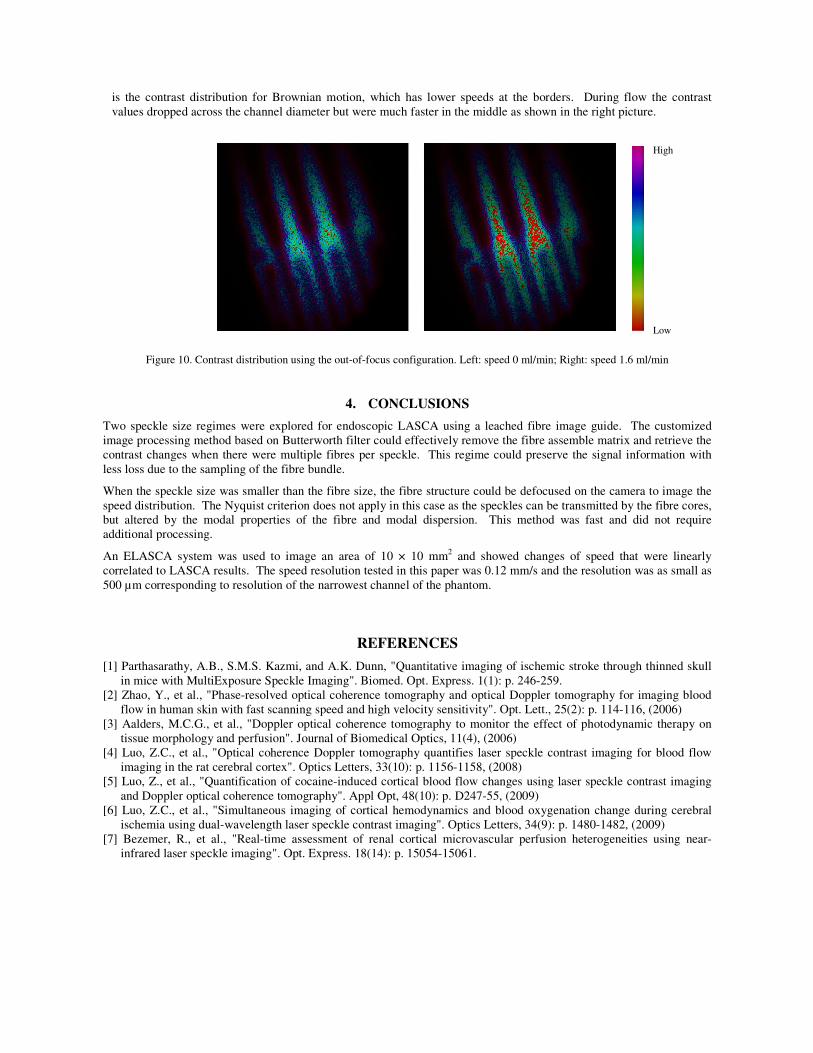
is the contrast distribution for Brownian motion, which has lower speeds at the borders. During flow the contrast
values dropped across the channel diameter but were much faster in the middle as shown in the right picture.
Figure 10. Contrast distribution using the out-of-focus configuration. Left: speed 0 ml/min; Right: speed 1.6 ml/min
4. CONCLUSIONS
Two speckle size regimes were explored for endoscopic LASCA using a leached fibre image guide. The customized
image processing method based on Butterworth filter could effectively remove the fibre assemble matrix and retrieve the
contrast changes when there were multiple fibres per speckle. This regime could preserve the signal information with
less loss due to the sampling of the fibre bundle.
When the speckle size was smaller than the fibre size, the fibre structure could be defocused on the camera to image the
speed distribution. The Nyquist criterion does not apply in this case as the speckles can be transmitted by the fibre cores,
but altered by the modal properties of the fibre and modal dispersion. This method was fast and did not require
additional processing.
An ELASCA system was used to image an area of 10 × 10 mm2 and showed changes of speed that were linearly
correlated to LASCA results. The speed resolution tested in this paper was 0.12 mm/s and the resolution was as small as
500 µm corresponding to resolution of the narrowest channel of the phantom.
REFERENCES
[1] Parthasarathy, A.B., S.M.S. Kazmi, and A.K. Dunn, "Quantitative imaging of ischemic stroke through thinned skull
in mice with MultiExposure Speckle Imaging". Biomed. Opt. Express. 1(1): p. 246-259.
[2] Zhao, Y., et al., "Phase-resolved optical coherence tomography and optical Doppler tomography for imaging blood
flow in human skin with fast scanning speed and high velocity sensitivity". Opt. Lett., 25(2): p. 114-116, (2006)
[3] Aalders, M.C.G., et al., "Doppler optical coherence tomography to monitor the effect of photodynamic therapy on
tissue morphology and perfusion". Journal of Biomedical Optics, 11(4), (2006)
[4] Luo, Z.C., et al., "Optical coherence Doppler tomography quantifies laser speckle contrast imaging for blood flow
imaging in the rat cerebral cortex". Optics Letters, 33(10): p. 1156-1158, (2008)
[5] Luo, Z., et al., "Quantification of cocaine-induced cortical blood flow changes using laser speckle contrast imaging
and Doppler optical coherence tomography". Appl Opt, 48(10): p. D247-55, (2009)
[6] Luo, Z.C., et al., "Simultaneous imaging of cortical hemodynamics and blood oxygenation change during cerebral
ischemia using dual-wavelength laser speckle contrast imaging". Optics Letters, 34(9): p. 1480-1482, (2009)
[7] Bezemer, R., et al., "Real-time assessment of renal cortical microvascular perfusion heterogeneities using near-
infrared laser speckle imaging". Opt. Express. 18(14): p. 15054-15061.
High
Low

[8] Forrester, K.R., et al., "Endoscopic laser imaging of tissue perfusion: New instrumentation and technique". Lasers in
Surgery and Medicine, 33(3): p. 151-157, (2003)
[9] Bray, R.C., et al., "Endoscopic laser speckle imaging of tissue blood flow: Applications in the human knee". Journal
of Orthopaedic Research, 24(8): p. 1650-1659, (2006)
[10] Dmitry A. Zimntakov, A.P.S., "Monitoring of tissue thermal modification with a bundle-based full-field speckle
analyzer", Applied Optics, 45, (2006)
[11] Nadkarni, S.K., et al., "Laser speckle imaging of atherosclerotic plaques through optical fiber bundles". Journal of
Biomedical Optics, 13(5), (2008)
[12] Kirkpatrick, S.J., D.D. Duncan, and E.M. Wells-Gray, "Detrimental effects of speckle-pixel size matching in laser
speckle contrast imaging". Optics Letters, 33(24): p. 2886-2888, (2008)
[13] Yoshimura, T., "Statistical Properties of Dynamic Speckles". Journal of the Optical Society of America a-Optics
Image Science and Vision, 3(7): p. 1032-1054, (1986)
[14] Goodman, J.W. and E.G. Rawson, "Statistics of modal noise in fibers: a case of constrained speckle". Opt. Lett.,
6(7): p. 324-326, (1981)