SOME ASPECTS OF MONOPOLISTIC COMPETITION
54
SOME ASPECTS OF MONOPOLISTIC COMPETITION IN THE LUBBOCK, TEXAS, RETAIL GASOLINE MARKET by DELMAR D. HARTLEY, B.S. A THESIS IN ECONOMICS Submitted to the Graduate Faculty of Texas Technological College in Partial Fulfillment of the Requirements for the Degree of MASTER OF BUSINESS ADMINISTRATION ADDPOVSCI August, 1958
Transcript of SOME ASPECTS OF MONOPOLISTIC COMPETITION

SOME ASPECTS OF MONOPOLISTIC COMPETITION
IN THE
LUBBOCK, TEXAS, RETAIL GASOLINE MARKET
by
DELMAR D. HARTLEY, B.S.
A THESIS
IN
ECONOMICS
Submitted to the Graduate Faculty of Texas Technological College
in Partial Fulfillment of the Requirements for
the Degree of
MASTER OF BUSINESS ADMINISTRATION
ADDPOVSCI
August, 1958

T3
ho.2-3 TABLE OF CONTENTS
Cop. >
CHAPTER PAGE
I. INTRODUCTION 1
Purpose of Study 1
Nature of a Typical Retail Gasoline Market 2
Sampling Procedure 5
Definition of Terms 7
II. THE THEORY OF MONOPOLISTIC COMPETITION . . . . 10
The Model of Monopolistic Competition . . . 10
General Description of the Model 13
Disequilibrating Forces i 7
The Development of Excess Capacity • . 17
Hidden Price Cuts 20
III. THE LUBBOCK MARKET 21
General Description of the Lubbock Market 21
Disequilibrating Forces 29
The Development of Excess Capacity . . 30
Hidden Price Cuts 35
IV. SUMMARY AND CONCLUSIONS 39
BIBLIOGRAPHY 4 3
APPENDIX 4 4
Adequacy of the Sample 45
Summary Questionnaire--Majors 46
Summary Questionnaire--Independents 48

LIST OF CHARTS AND GRAPHS
PAGE
Long-run Equilibrium under Pure Competition 10
Long-run Equilibrium under Monopolistic Competition . . . 11
Short-run Equilibrium under Monopolistic Competition . . 14
Equilibrium with Excess Capacity 19
Cut Off Analysis of Question 3 44
Cut Off Analysis of Question 7 45
1 1 1

LIST OF TABLES
TABLE PAGE
I. Stations with Managers and Manager-Owners . 21
II. Length of Manager's Experience 22
III. Average Number of Pumps 23
IV. Price of Regular Grade Gasoline 25
V. Price of Ethyl Grade Gasoline 26
VI. Volume Change During Price War 27
VII. Stations living Premiums 35
VIII. Purposes of Premiums 36
IV

CHAPTER I
INTRODUCTION
The Purpose of the Thesis
The basic purpose of this thesis is to describe and
discuss the similarities and differences between the real-
world situation and a particular theoretical model of monopo
listic competition. The theoretical model chosen was the
one described by Edward Chamberlin in The Theory of Monopo-
1 listic Competition. The real-world situation selected was
the Lubbock, Texas, retail gasoline market. The retail gas
oline market.wa9 chosen because of the rather common assump
tion that it constitutes one of the few examples of free com-
2 petition left in the economy.
It was the purpose of the survey conducted in the
Lubbock retail gasoline market to provide data to evaluate
the hypothesis that the real->world situation may be des
cribed accurately in terms of the theoretical model of monopo-
Edward Chamberlin, The Theory of Monopolistic Competition, (Harvard University Press, Cambridge, Mass., 1939) Hereafter cited as Chamberlin, Monopolistic Competition.
2 Joel B, Dirlam, "The Petroleum Industry," quoted in
The Structure of American Industry^ ed. Walter Adams (The Macmillan Company, New York, 1954) p. 258. Hereafter cited as Dirlam, "The Petroleum Industry."

listic competition. The two following disequilibrating
forces, described in Chamberlin*s model were considered:
(1) the development of excess capacity, and, (2) the presence
of hidden or "under the board" price cuts within the market.
A comparison of the findings of the survey with the theo
retical model of monopolistic competition was made to show
whether the actual market conformed with the theory in re^
spect to the two disequilibrating forces examined.
The Nature of £ Typical Retftil Gasoline Market
Because of a prevailing two price system, the retail
3 gasoline market is actually two markets in one. The two
price market is composed of two types of stations divided
by price policies into "majors" and "independents". The
majors, in pricing their products, generally maintain a
fixed price policy. The independents maintain a price
differential below the majors in order to draw attention
to their product. These circumstances have led to the two >
price system which prevails.
Majors are large firms, relatively few in number.
3 Harry £. McAllister, "The Elasticity of Demand for
Gasoline," quoted in Readings in Current Economics, eds, Morton C. Grossman, et al. (Richard D. Irwin, Inc., Homewood, Illinois, 1958) p. 200. Hereafter cited as McAllister, "Elasticity of Demand for Gasoline."

and usually of sufficient size to enable them to establish
their products in the minds of the consuming public, and
thus maintain the higher price in the two price system.
Generally a major also has enough power to establish a
price policy in the market. If a change in the price pol
icy of one of the majors results in lowering its price, the
result will be either similar changes in the policies of
other majors or a severe loss of gallonage. An important
feature of this portion of the retail market is that the
majors face a high cross-elasticity for gasoline among
themselves. This fact partially accounts for the advent
of such things as price leadership, surplus buying programs,
and the use of secondary brands as substitutes for straight
4 price competition alone.
The lower price in the two price system is that of
the independents. Independents are usually small non-
integrated firms with relatively meager financing; therefore,
they are not in a position to keep their products in the
public's eye and must find alternative methods to attract
attention to their product. The alternative usually chosen
is a lower price. The independents as a group are selling
4 M c A l l i s t - e r , " E l a s t i c i t y of Demand f o r G a s o l i n e , "
p . 2 0 0 .

a generally homogeneous product with each member of this
group actually accounting for only a small portion of the
total market and individually facing a quite elastic demand
A high degree of cross-elasticity is present among the
independents.
Even though for an individual firm, whether major
or independent, the demand for gasoline is elastic, quite
another situation exists for the sellers as a group. The
total demand in any given market at any given time is re
latively constant; thus, an elastic demand for the product
5 is seen by the group.
The manager of the individual firm sees the rather
elastic demand facing his firm and either overlooks or
ignores the inelastic total demand for the product; thus,
6
he is willing to cut prices at times. The immediate ob
jective of a price cut is to increase the gallonage of the
individual station thus increasing the total revenue and
profit for the owner. Retaliation, the rapidity with
which competitors move to meet the price cut, determines
the ultimate success of the price cut. If an independent
Dirlam, "The Petroleum Industry,•* p. 254.
McAllister, "Elasticity of Demand for Gasoline, p. 200.

is the one to make the first move, he draws the Increased gal
lonage first from other independents. As the differential
widens, some of the majors begin to feel the loss. This
could very easily be the "blunder" which precipitates a "gas
war".
It has been established in this brief introduction to
the nature of the retail gasoline market that, although total
demand is relatively constant and inelastit; the demand
faced by the individual firm in the absence of retaliation
is quite elastic. The success of any move to cut prices
and increase revenue is governed by retaliation from com
petitors. Price cutting and retaliation could quite easily
be the cause of a gasoline price war.
Sampling Procedure
The "universe" in the sample taken for this thesis
was composed of all the outlets for the retail sale of gas
oline located within the city limits of Lubbock, Texas.
This universe was made up of 206 outlets divided into two
groupit 138 majors and 68 independents. Thus the composition
of the universe was 67% majors and 33% independents.
7 McAllister,"Elasticity of Demand for Gasoline,"p.201.

A sample of 50 stations was chosen by means of a systei
atic selection procedure in which each fourth station was 8
chosen for study. The individual stations to be interviewed
were selected in the following manner, A street map of the
city of Lubbock was obtained from the Lubbock Chamber of
Commerce and each station located within the city limits
was recorded on the map. A number was assigned each station
beginning at the south-east corner of the city. The stations
were numbered in a pattern running from east to west the
length of the map, returning to the east and moving west
ward on each street.
Once this part of the process was completed, four
slips of paper numbered one through four were placed in a
hat and one of the slips was drawn. The slip drawn was the
number three. The sample cases then were marked on the map
by number. Beginning with the number three each fourth
number was marked. By following this system approximately
25% of the total cases in the universe were chosen for study.
The sample thus drawn was composed of 17 independents and 33
lo Vernon T, Clover, Business Research, (Rodgers Litho,
Inc., Lubbock, Texas, 1958) p. 215. Hereafter cited as Clover, Business Research.

majors or 34% independents and 66% majors. This closely ap
proximates the universe which was composed of 33% independents
and 67% majors. Likewise the sample was composed of each
fourth station in the universe in numerical order giving a
proportionate sample of the population. (See Appendix I,
p. 44, for the analysis of the sample for adequacy and
findings.)
Definition of Terms
Majors (major stations) may be generally distinguished
by two characteristics. They sell a widely advertised and
known product or may be affiliated with a nationally known
company, and have a price policy which prices their gasoline
above that of the "independents** (for a list of Lubbock
stations classed as majors see Appendix I, p. 45).
Independents (independent stations) generally carry
either unbranded or locally known brands and nearly always
hold their prices below those of the majors.
Pure competition is used in this thesis in the
sam e sense in which it is defined by Chamberlin in The
Theory of Monopolistic Competition. No one firm or group
of firms has any degree of control over the price of the
product. This prerequisite to pure competition may be
analyzed in two phases. "In the first place, there must
be a large number of buyers and sellers so that the influence

8
of any one or of several in combination is negligible....Second
ly, control over price is completely eliminated only when all
producers are producing the identical good and selling it in
9 the identical market."
In monopolistic competition sellers may be selling
slightly different or very different products but "where
there is any degree of differentiation whatever, each
seller has an absolute monopoly of his own product, but is
subject to the competition of more or less imperfect sub-
10 stitutes." Each is a monopolist; yet, each is a competitor
when the product is differentiated.
Equilibrium is used in three different situations.
The first of these is the long-run equilibrium under pure
competition. This is effected when the firm's average
cost curve is, at its minimum point, tangent to the demand
curve. This will be a point of maximum profits for the
firm because it is also the point at which the marginal
cost curve intersects the marginal revenue curve. The
second use will be the short-run equilibrium under monopo
listic competition. This is a situation of short run maximum
9 Chamberlin, Monopolistic Competition, p. 7.
10 Ibid., p. 9,

profits for the firm. At this point the firm is enjoying a
situation of greater than aormal or excess profits. The
third situation is the long-run equilibrium under monopolistic
competition. This also is a profit maximizing point of
production for the firm bu^ there is no pressure exerted
either for firms to enter or leave the field because of the
lack of excess profits and the existence of normal profits.
Disequilibrating factors are any forces which will
cause the firm*s position to vary from an equilibrium situ
ation.

CHAPTER II
THE THEORY OF MONOPOLISTIC COMPETITION
The Model of Monopolistic Competition
The basic objective of this thesis is to compare
Chamberlin*s theoretical model of monopolistic competition
with the real-world situation of the Lubbock, Texas, retail
gasoline market. To gain this objective it is necessary
first to establish the theoretical aspects to be used. Ini-
1
• ^ \ ^
3 ^ < ?
~-~y /^C
/ ^^^^
, AD
r\
QUAf^T/TY
Figure 1, Purely Competitive long-run Eqiiilibrium
Chamberlin, Monopol ist ic Competition .
I b i d , , p . 2 1 .
10

11
tially this chapter seeks to show a skeleton model of the
theory indicating the basic change in demand caused by
monopolistic competition. Subsequently a more elaborate
description of the model will explain its operation and a
the effect of monopolistic competition on the price of the
product. Finally -the disequilibrating factors to be con
sidered for comparison will be introduced and explained.
The model of monopolistic competition, as set up by
Chamberlin, begins with- a purely competitive firm in a
long-run equilibrium position as shown in Figure 1.
OUA/VT/TY BAM Figure 2, Long-run Equilibrium under
Monopolistic Competition"
Chamberlin, Monopolistic Competition, p. 84, The curves MM and NN have been added to Chamberlin»s Figure to emphasize the fact that this is a profit maximizing situation.

12
Moving from the purely competitive situation into the
realm of less than pure competition, we find a change in he
demand curve of the firm. The demand curve becomes a line
(DD) sloping downward from left to right as appears in
Figure 2, The cause of this change in the nature of the
demand curve is some differentiation in the product which
eliminates perfect substitutability and makes the demand
less than perfectly elast^ic, This differentiation may
arise when any significant basis exists for distinguishing
the goods of one seller from those of another; be it price,
personality, reputation, convenient location, or the tone
of his shop, "Where such differentiation exists, ever
though it be slight, buyers will be paired with sellers,
not by chance and at random (as under pure competition), 4
but according to their preferences,"
While the nature of the demand curve for the firm
changes when monopolistic elements become apparent, it is
assumed that the average cost structure or curve will be
approximately the same as for a similar firm under pure
5 competition. Under this assumption then the average cost
curves in Figures 1 and 2 are the same. There is included
4 Chamberlin, Monopolistic Competition, p. 56.
5 Ibid., p. 85,

13
in this cost curve the minimum profit necessary to secure and 6
retain the services of the entrepreneur.
General Description of the Model
An explanation of the model of monopolistic competition
must necessarily begin with a basing point of the individual
firm at long-run equilibrium in a situation of pure com
petition. Figure 1 on page 8 presents an ordinary picture
of long-run competitive equilibrium. Line D is the demand
curve; in this situation it also represents price, marginal
revenue, and average revenue. Line MC is the marginal cost
curve and line AC is the average cost curve.
In the long-run equilibrium situation the position
of each of these curves may be depicted as in Figure 1,
p, 8, The marginal cost curve intersects the marginal
revenue curve at point Q, which is the most profitable
level of output for the firm. In the purely competitive
situation this point (Q) is also the point of tangency
of the minimum level of the average cost curve and the
demand curve—the most efficient or minimum cost level of
production. This is always the situation at long-run com
petitive equilibrium.
Chamberlin, Monopolistic Competition, p, 77.

14
QUA/S/riTV
Figure 3. Short-run Equilibrium under Monopolistic Competition
After some differentiation has been established
certain adjustments of price or of product will occur result
ing in the maximization of profits for the individual seller.
For simplification this thesis assumes no change in product
and consequently no change in costs of production; it will
be concerned exclusively with price adjustments. The price
adjustment which will render maximum profits is shown in
Chamberlin, Monopolistic Competition, p. 89. The curves MM and NN have been added to Chamberlin's figure to emphasize that this is a profit maximizing situation.

15
Figure 3. Line DD is the demand curve and PP is the pro
duction cost curve (this is the same as an average or unit cost
curve). MM and NN, the marginal cost and marginal revenue
curves respectively, interesect at the point of production
which will yield maximum profits for the firm. In Figure
3 quantity OA sold at price OF results in total profit FRHE.
This firm may be said to be operating at a short-run equi
librium realizing a profit in excess of that necessary to
remain in business. In the short-run a substantial increase
in price results from the introduction of differentiation
of the product and subsequent price adjustment to maximize
profits.
Moving into the long-run period, however, further
adjustments take place. These adjustments, the result of
the excess profits being enjoyed (Fig. 3), are the entry
of new firms into the field in order that they too might
enjoy this highly profitable situation. As new firms enter
the field the consequence is a division of demand between
a larger total number of firms. The demand curve facing the
individual firm, as a result of this division of the total
market between a larger number of firms, shifts downward
and to the left. This shift results in a movement along the
cost curve of the firm to the left of the most efficient

16
point of operation. This movement or adjustment will continue
until a new long-run equilibrium has been reached. This
equilibrium position will be a situation of maximum profits.
The demand curve will be tangent to the average cost curve,
thus, yielding only the profit necessary to retain the ser
vices of the entrepreneur; however, the result will be a
price higher than the price at long-run equilibrium under
pure competition.
In Figure 2 on page 9, DD is the demand curve from
Figure 3 on page 11 representing short-run equilibrium demand
with maximum profit at point R. As more firms enter the
field the firm's demand curve shifts to the left and the
series of adjustments culminates ultimately in dd, the
new demand curve. The new demand curve is tangent with PP
(average cost curve) at point Q. Thus, the new level of
output will be OB at price BQ. Note that this solution also
constitutes maximum profits, the new marginal revenue curve
intersecting the marginal cost curve at this level of output.
Output OB is always a smaller quantity at a higher price
than would be found under a purely competitive situation.
In Figure 2 on page 9 point k would be the point of pro
duction under pure competition giving an output OM and a
price MK.
It has been noted that the situation depicted in
17
Figure 2 on page 9 is a long-run equilibrium situation under
mo nopolistic competition. There is no pressure in the case
of a long-run equilibrium for new firms to enter or old
firms to leave the field. Forces causing a disturbance
in this situation may now be introduced.
Some Disequilibrating For ces
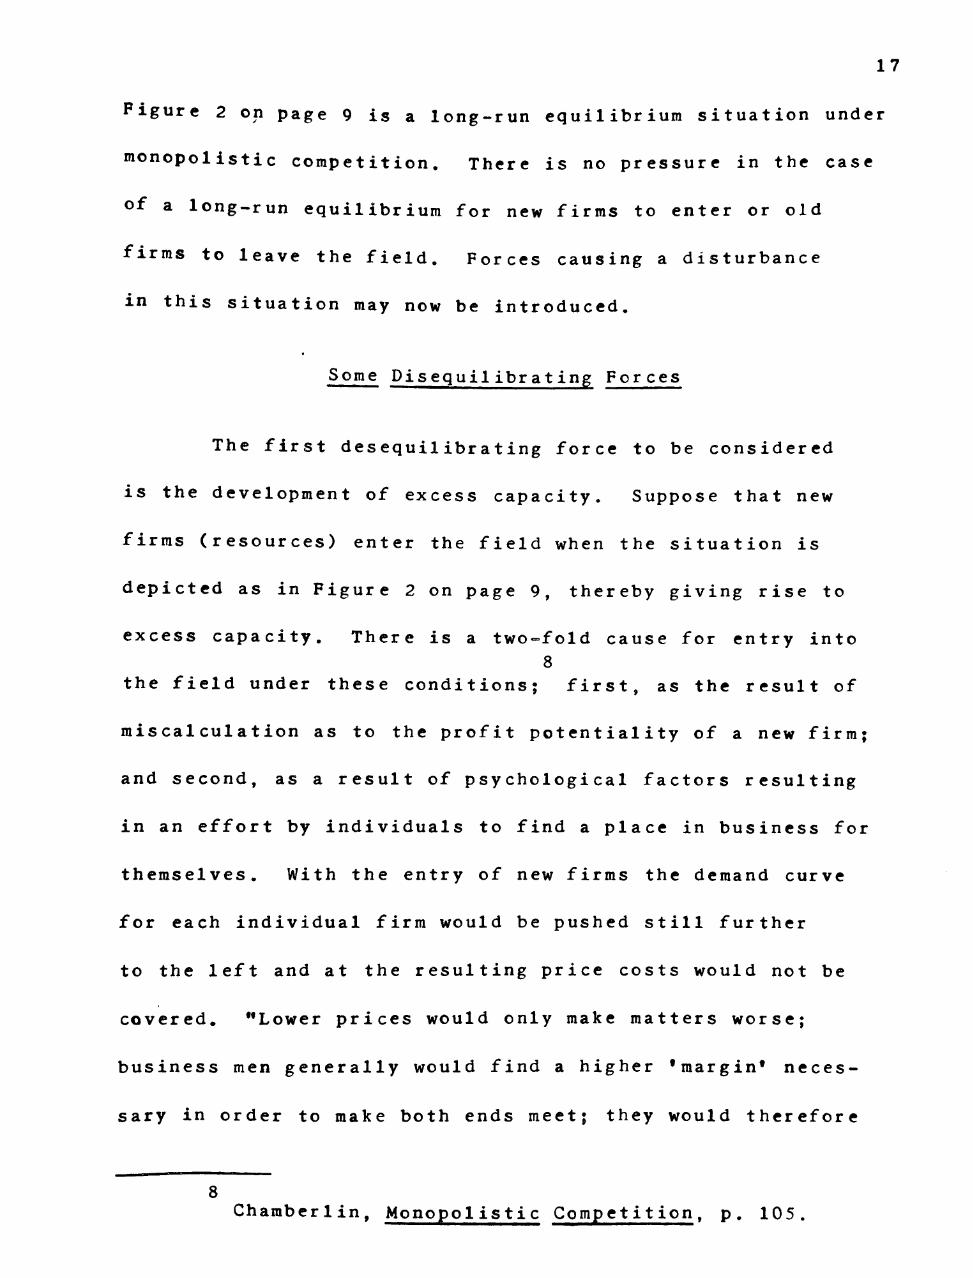
The first desequilibrating force to be considered
is the development of excess capacity. Suppose that new
firms (resources) enter the field when the situation is
depicted as in Figure 2 on page 9, thereby giving rise to
excess capacity. There is a two-fold cause for entry into
8 the field under these conditions; first, as the result of
miscalculation as to the profit potentiality of a new firm;
and second, as a result of psychological factors resulting
in an effort by individuals to find a place in business for
themselves. With the entry of new firms the demand curve
for each individual firm would be pushed still further
to the left and at the resulting price costs would not be
covered. "Lower prices would only make matters worse;
business men generally would find a higher 'margin* neces
sary in order to make both ends meet; they would therefore
8 Chamberlin, Monopolistic Competition, p. 105.
18 9
increase it and prices would again equal costs of production."
This is a case of excess capacity resulting in an increase in 10
prices. This will continue until the demand curve (Figure 4)
is tangent with the cost curve at a very high level.
There is a difference in the nature of the firm's
demand curve in Figure 4 and the demand curves pictured in
Figure 2, page 9, and Figure 3, page 11. A comparison will
readily reveal that the demand curve in Figure 4 is somewhat
less-elastic than those in Figures 2 and 3. The reason for
this change is the introduction of retaliation. Up to this
point in the exposition it has been implicitly assumed that
any change in an individual firm's prices could be effected
without retaliation. Such an assumption results in a highly
elastic demand for the individual firm when viewing this
firm as a price cutter. The introduction of retaliation will,
however, substantially modify this situation and tend to
force the individual's demand curve into the same mold as the
11 group's demand curve, a somewhat inelastic demand.
Chamberlin, Monopolistic Competition, p. 105.
10 Ibid., p. 106.
11 Kenneth E. Boulding, Economic Analysis, (Harper & Bro
thers, New York, 1955) p. 645.

19
Q(/A/vr/ry
Figure 4. Equilibrium with excess capacity 12
An entirely different situation exists when the in
dividual firm is raising its price. If an individual firm
alone raises the price of gasoline, with the market generally
holding prices stable, it faces a highly elastic demand curve.
This is retaliation in the sense that when one firm raises its
price the great bulk of the other firms must also raise their
prices in order to hold each firm's share of total demand
1 2
Chamberlin, Monopolistic Competition, p. 92. For purposes of simplification all lines indicating the process which culminates in DD tangent with PP at point Q have been deleted from Chamberlin's figure.

20
approximately the same. Unless this is done the price raiser
faces a situation of a high cross-elasticity of demand and
will loose the bulk of his market. It may be noted that price
increases with retaliation present result in a highly elastic
demand facing the individual firm while the reverse is true
for the price cutting firm. The actual price range through
which prices may vary as excess capacity becomes evident will
vary with the elasticity of demand but generally will approxi
mate the range from point Q (Figure 2) to point Q (Figure 4 ) .
Another factor which must be considered as an important
disequilibrating force is the hidden price cut. It has been
indicated that in the absence of retaliation the individual
firm faces a rather elastic demand curve. With this in mind,
it follows that if an individual firm can devise some hidden
or "under the board" price cut which can avoid retaliation
it can substantially increase the quantity of gasoline it
sells. These price cuts may be any extra consideration of
13 any sort, premiums, coupons, prizes and the like. The
effect is to give the secret price cutter a somewhat secure
incr ea se in volume of sales because of the reduced possibility
of others following him, thus, holding the general level of 14
prices artificially high.
13
14
Chamberlin, Monopolistic Competition, p. 108.
Ibid., p. 108.

CHAPTER III
THE LUBBOCK MARKET
General Description of_ the Lubbock Market
The Lubbock, Texas retail gasoline market was composed
of two general types of stations, the majors and the indepen
dents. There were 206 outlets, of which 138 (67%) were majors
and 68 (33%) were independents.
Certain contrasts may be noted between the two groups
within the Lubbock market. The independent is often considered
1 the "little" man who owns and operates his own station. Table
TABLE I
Per Cent of Service Stations with managers or manager-owners
in Lubbock, Texas
Type of manager Majors 1 Indep endents
Number |% of | Number of firms;firms lof firms
T
% of firms
Total Number of firms
% of firms
Manager 16 4 8.5 I 10 58.8 26 52
Manager-owner 17 51 .5 41. 2 24 I 48
Total 33 100 17 \ 100 50 jlOO
Ralph Cassady, Jr. and Wylie L. Jones, The Nature of Competition in Gasoline Distribution at the R etail Level, (University of California Press, Berkely and Los Angeles, 1951) p. 81. Hereafter cited as Cassady and Jones, Compet ition at the Retail Leve1.
21

22
I shows that only about forty per cent of the independents
were managed and owned by the same individual. The major
is often considered a company owned station with a hired 2
manager. it was found that over fifty per cent of the
major stations were operated by their owners. Among the
majors it was found that over thirty-three per cent of the
TABLE II
Length of experience of retail service station managers in Lubbock, Texas,
In May, 1958
Length of time
Less than one year
One to two years
Two to three years
Three to five years
Over five years
Total
Majors
Number of firms
9
2
4
3
15
33
% of firms
27.3
6.1
12.1
9.1
45.4
100
Independents
Number of firms
5
4
1
1
6
17
% of firms
29.4
23.5
5.9
5.9
35.3
100
Total
Number of firms
14
6
5
4
21
50
% of firms
28
12
10
8
42
100
p. 71 Cassady and Jones, Competition at the Retail Level.

23
m anagers and manager-owner have been in business two years
or less while over forty-five per cent have been in business
over five years. Among the independents it was found that
TABLE III
Average number of pumps in Lubbock, Texas, by class of service station
Number of Pumps
2
3
4
5
6
7
8
Total
Major s
Number of firms
1
10
11
1
6
1
3
33
% of firms
3
30.3
33. 3
3
18.2
3
9.1
99.9*
Average number 4,48
of pumps
Independents
Number 1 of firms
1
5
6
1
3
1
17
% of firms
3.9
29.4
35 .3
5.9
17.6
5.9
100
4.18
Total
Number of firms
2
15
17
2
9
2
3
50
% of firms
4
30
34
4
18
4
6
100
4.38
* Does not equal 100 due to rounding.
.bout thirty-five percent had been in business over five y*ar.s
It was interesting to note changes in the composition
,f the Lubbock market over the past few years. In 1951 there

24
were 108 majors and 57 independents or 65.45% majors and 34.55% 3
independents. There had been an increase of 24.85% in the
total number of stations by 1958, this growth was made up of
a 27.78% gain in majors and a 19.3% increase in the number of
independents. In 1951 the average number of pumps was 3.11
for majors and 3.91 for independents. The share of total
4 pumps was 60.11% for majors and 39.89% for independents.
The majors in 1958 had an average of 4.48 pumps while the
figure for the independents was 4.18. The share of total
pumps was 67.58% for majors and 32.42% for independents.
The majors had not only increased the relative share of the
market by number of stations but also by the size of the
stations as measured by the number of pumps. In 1951 the
average independent had more pumps than the average major
while in 1958 the reverse was true.
The independent dealers in the regular gasoline market
were maintaining, at the time of this survey, a price differ
ential below the majors of 2.49^ and the average price of
regular gasoline as indicated by the survey was 30.21^.
Robert M. Castle, "A Comparative Study of Standard and Independent Retail Gasoline Service Stations In Five Cities Unpublished Master's Thesis, Texas Technological College, 1951, Hereafter cited as Castle, "Comparative Study," p. 104.
4 Ibid.. p. 104.
25
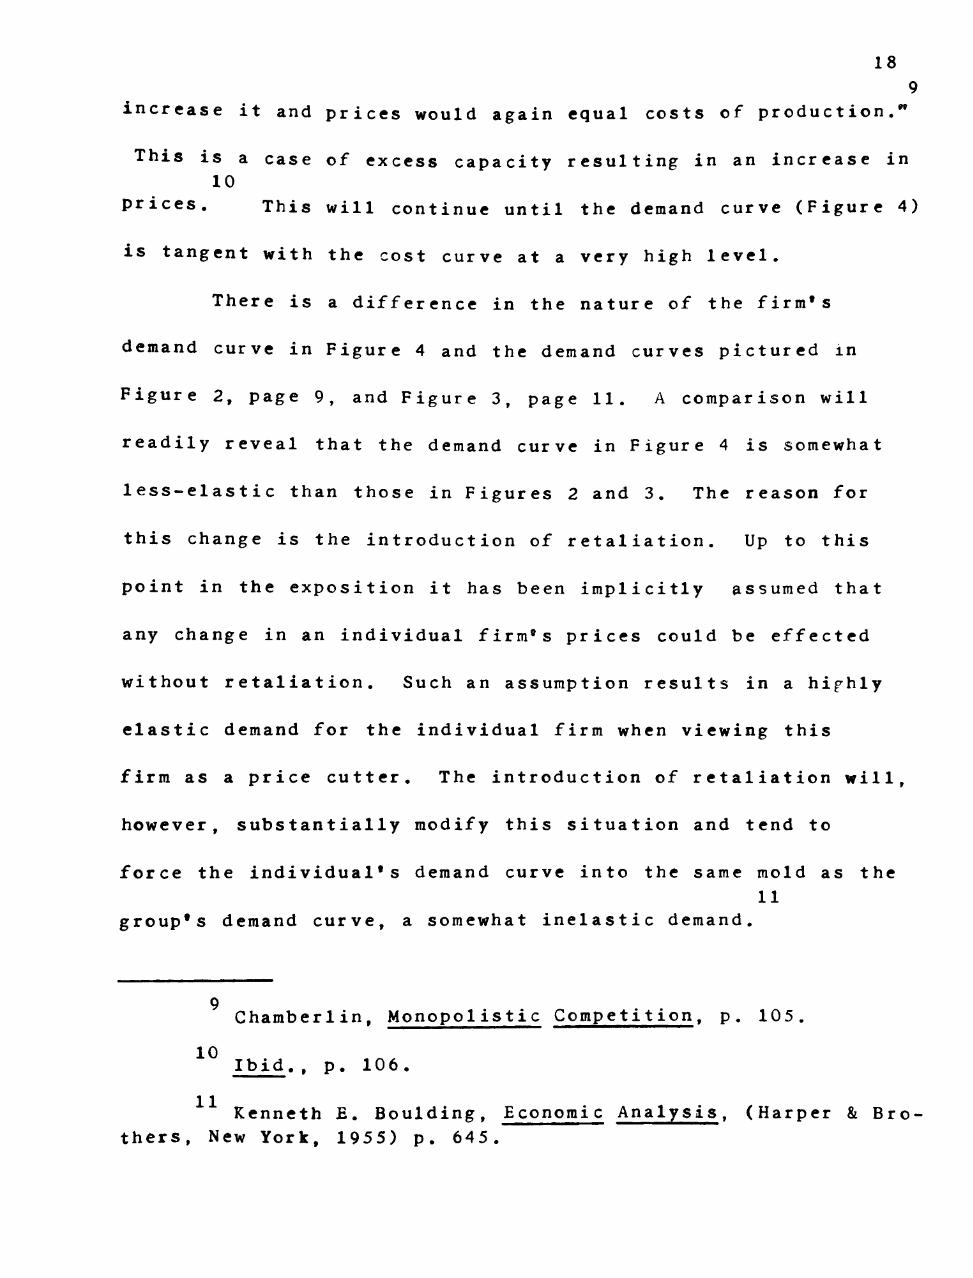
TABLE IV
Average price of regular grade gasoline In Lubbock,Texas by class
of service station
Price per gallon
cents
26.9
27.9
28.9
29.9
30.0
31
Total
Average
1 1 Majors
Number of firms
2*
3
11
16
1
33
% of firms
6.1
9.1
33.3
48.5
3
100
30.21
Independents
Number of firms
3
14
17
% of firms
17.6
82,4
100
27. 72
Total
Number
of firms
3
16
3
11
16
1
50
% of firms
6
32
6
22
32
2
100
29.36
*Two majors pricing with independents because of price cuts made May 28 and 29, 1958
It is interesting to note that throughout the market all
independents generally priced below the lowest major for
both regular and ethyl. The exception to this was the price
cutting that began on the last day of the survey when two
of the interviewed major stations dropped the price of regular
ga soline to 27.9<;i which was the price for the highest of the
independents.
In the ethyl gasoline market at the time of the surve-

26
TABLE V
Average price of ethyl grade gasoline in Lubbock, Texas, by class
of service station
Price per gallon cents
28.9
29.9
30.9
31.9
32.9
33.9
34.9
Total
Averag e
Majors
Number of firms
1
6
12
14
33
% of firms
3
18.2
36.4
42.4
100
34.08
Independents
Number of firms
3
6
8
17
% of firms
17.6
35.3
47.1
100
30.19
Total
Number of firms
3
6
8
1
6
12
14
50
% of firms
6
12
16
2
12
24
28
100
32.76
there was an even greater price differential between the
independents and the majors. The average price of ethyl in
major stations was 34.08^ while it was only 30.19^ in the
independent stations, giving a differential of 3.89^. The
av erage for all stations in the market was 32.76^.
The Lubbock market was similar to the conditions de
scribed in Chapter I in that there were indications that

27
total demand was somewhat inelastic and that some cross-
elasticity as between stations and between the two groups
was present. in answering the query "Did your station ex-
TABLE VI
Change in volume of gasoline pumped in Lubbock, Texas, during
the price war of 1957
Nature of Change
Yes
No
Up
Slight
20-35%
35-5 0%
Down
Slight
20-35%
35-50%
yf=SSS=SSSSSSSS=SS
Majors
Number of firms
24
2
23
12
9
2
1
1
% of firms
72.7
6.1
69.7
36.4
27. 2
6.1
3
3
Independents
Number of firms
9
3
6
3
1
2
3
1
2
% of firms
52.9
17.9
35.3
17.6
5.9
11.8
17.6
5.9*
11.8*
Total
Number of firms
33
5
29
15
10
4
4
1
1
2
% of firms
66
10
58
30
20
8
8
2
2
4
Does not come out even due to rounding.
pcrience any change in volume of gasoline pumped during the
gas war of 1957?" sixty-six per cent of the stations indicated

28
that there was some change in the volume of gasoline pumped.
About 58% of this group indicated that the gallonage increased,
however, over half of these showed only slight increases (possi
bly only the amount which might be expected with the drop in
price relative to the elasticity of demand). Twenty per cent
indicated a 20 to 35% increase while 8% indicated a 35 to 50%
increase. Thus, it may be stated, on the basis of this sample,
that about one fourth of the market will realize substantial
gallonage increases in a price war similar to the one in the
Lubbock market in 1957, On the other hand about 8% of the
market indicated that they realized a drop in gallonage
during this war. Among the stations indicating a drop in
gallonage, 2% indicated a slight drop, 2% indicated a 20 to
35% drop and 4% indicated a 35 to 50% drop. About 73% of the
majors indicated an increase in gallonage during the war while
only 3% indicated a decline. Over 50% of the independents
indicated an increase while nearly 18% showed a decline. While
it is impossible to show the exact increase in gallonage
during a price war, these data do indicate that while there
is some increase it is not substantial.
Elasticity of demand for the individual station is
shown by the sizable increase in volume of gasoline sold at
some stations during a price war and the similar decline in
volume in other stations. Elasticity is implied in the very
29
existence of a price war as such. If cross-elasticity did not
exist then it would be impossible for a price war to develop.
There would be no incentive for one station to follow the
price cut of another because in the absence of elasticity there
would be no loss or gain and thus no motive for the original
cut. The cross-elasticity as between the groups was not so
clearly indicated in these data. The reason for this was
that in the 1957 price war the independents were able to
maintain about the same relative price differential as they
normally held. This in itself removed all but the "prestige"
incentive for customers to defect to the majors during this
period of low prices. (Informal discussion with some operators
indicated that this was not the case in the 1955 price war.
The majors in that war priced very close to the independents
resulting, as these operators indicated, in a 50 to 75% drop
in volume by many of the independent dealers.)
It may be noted that the Lubbock retail gasoline
market displayed similar characteristics to those described
in Chapter I, p. 2-4. For example there was present a two
price system manifest in the prices of the majors and in
dependents, total demand appeared to be somewhat inelastic,
and a cross-elasticity of demand seemed to be present both
between individual stations and between the two groups.
Some Disequilibrating For ces

30
The development of excess capacity as a disequilibrating
force in the retail gasoline market has been selected as one
of the theoretical aspects to be compared with the real-world
situation. Thus the study of the local market was conducted
to show either the presence or absence of the development of
excess capacity within its boundaries. There are several
criteria which are more or less pertinent indicators of the
capacity of the market when shown in relative terms.
The number of firms of a given type within a market
area is commonly considered a base for judgement for whether
a market is "crowded." This criterion has some validity
when considering the over-all market situation, but to
show reliability, it must be related to other criteria.
The following comparison in the Lubbock market is of the
number of stations relative to the total population and to the
number of passenger and commercial vehicles. In 1951 there
. were 165 stations in Lubbock composed of 108 (65.45%) majors 5
and 57 (34.55%) independents. In 1958 there were 206
stations in Lubbock composed of 138 (67%) majors and 68 (33%) 6
independents. In 1951 the population of Lubbock was 71,390
Castle, "Comparative Study," p. 104.
6 United States Bureau of the Census, Statistical Ab
stract of the United States; 1952 (73rd edition) (United States Government Printing Office, Washington 25, D.C.,1952) n. 10.

31
while the 1958 estimated population was 130,000.
In 1951 the average number of Lubbock residents per
service station was 432.67, In 1958, however, this number
had increased to 631.07, indicating a faster growth in popu
lation than in service stations and a relatively larger per
capita market for each station. The number of stations in
Lubbock increased 24.85% from 1951 to 1958, During this
sam e period the market experienced a population increase of
82%. This seems to indicate that the market potential was
increasing much more rapidly than the market capacity. While
the increase of 198.4 residents per station over this period
would seem to indicate that capacity has not increased as
rapidly as demand, other criteria should be examined before
reaching a decision about the question of capacity.
Perhaps the most important measure of capacity within
a market area may be found in the number of consuming units.
Consuming units in the retail gasoline market are the vehicles
employed within the area for transportation purposes. This,
however, does not present a complete picture of the total
mar ket demand. It must be pointed out that vehicles from
outside the market are at times used within the market area
and as a result increase the demand for the product. The
Estimate of the Lubbock Chamber of Commerce, Jan.1,1958

32
a v a i l a b l e d a t a a r e t h e number o f p a s s e n g e r and c o m m e r c i a l
v e h i c l e s r e g i s t e r e d i n t h e c i t y o f L u b b o c k .
In 1 9 5 1 t h e number o f p a s s e n g e r and c o m m e r c i a l v e h i c l e s
r e g i s t e r e d i n L u b b o c k was 4 3 , 2 9 0 or 2 6 2 . 3 6 per s t a t i o n . In
1 9 5 7 , 5 6 , 4 9 7 v e h i c l e s w e r e r e g i s t e r e d g i v i n g an a v e r a g e o f
8 274.26 per station. Thus there was an increase in the number
of vehicles per station over this period.
To examine the situation further, probably the most
valid criterion available to indicate the capacity of the
Lubbock market is an examination of the number of pumps per
station and consuming units per pump. In 1951 there were
3.99 pumps per station while the 1958 survey of the Lubbock
market indicated 4.38 pumps per station, thus, the average
size of the individual station had increased somewhat during
this period. More important, however, was the number of con
suming units per pump. In 1951 there were 77.44 vehicles
registered per pump but in 1957 there was one pump for each
62.44 vehicles. This seemed to indicate a rather sizable
increase in relative capacity over this interval.
Another indication of the capacity within a market
may be the price changes over this time period. In 1951 the
8 Castle, "Comparative Study," p, 104.

33
average price of regular gasoline was 18.40< before taxes in
the major stations and 15.09<;i before taxes in the independent
9 stations. In 1958 the average price of regular gasoline
before taxes was 22.21^ in major stations and 19.72(;i in in
dependent stations. In 1951 the national average price of
regular grade gasoline before taxes was 20.3(;i. In February,
1958, the national average price of regular grade gasoline
had increased to 21.8<;i.-'- Nationally then the price of
regular grade gasoline had increased 7.4% over this period
of time. Since 1951, in the Lubbock market, there had been
an increase of 20.7% in the price of regular grade gasoline
in the majors. In the Independents the price increase in
regular grade gasoline over this period was 30.68%.
Probably the best common denominator which will in
dicate the capacity of the station is the number of pumps
per station. This has increased preceptibly during the
0
United States Department of Commerce, Statisti cal Abstract of the United States, (U.S. Government Printing Office, Washington 25, D.C., 1957='58) p. 550, Per gallon of gasoline in 1951 there was a 4 (;i state and 2<;i federal tax while in 1958 there was a 5<? state and 3<^ federal tax.
United States Department of Commerce, "Survey of Current Business/' (U.S. Government Printing Office, Wash-ington 25, D.C., Ap. 1958) p. S-36.
11 United states Department of Commerce, "1957
Statistical Supplement to the Survey of Current Business," (U.S. Government Printing Office, Washington 25,D.C., 1957)p.l74

34
past seven years. There were 3,39 pumps per station in 1951
while in 1958 there were 4.38 pumps per station or an in
crease of some 29.2% for the period. At the same time there
had been an increase in the price level of gasoline of 20.7%
in the majors and 30.68% in the independents while the nation
al average price increased only 7.4%. In the majors there
had been an increase in the average number of pumps from 3.11
to 4.48 or a growth of 44.05% while in the independents the
number had gone from 3.91 to 4.18 for a gain of 6.91%.
It has been pointed out that the number of stations
per capita had decreased during the 1951-1958 interval while
the number of registered vehicles per station increased some
what. These might seem to indicate that the market had grown
relative to capacity. However, if the number of vehicles per
pump is taken as the most important indicator then the reverse
is more likely to be true as indicated by a substantial de
cline in the number of vehicles per pump. A further indicator
of excess capacity, pointed out by Chamberlin, is that an ex
cess capacity becomes evident a result will be a rise in the
price of the product. The Lubbock market has displayed a
m uch greater increase in price of gasoline for this period
than the increase in the national average price. These last
data seem to incicate the presence of excess capacity in the
Lubbock market.

35
TABLE VII
Lubbock stations giving premiums for purchase of gasoline by type of premium given
Type of Pr emium
Stamps
Prize
Dis count
Other
None
Total
- •• \
Majors
Number of firms
14
1
1
17
33
% of firms
42.4
3
3
51 .5
99.9*
Independents
Number of firms
2
6
3
!*•
5
17
% of firms
11. 8
35.3
17.6
5.9
29.4
100
Total
Number of firms
16
7
4
1
22
50
% of firms
32
14
8
2
44
100
* Does not total 100 due to rounding.
** Favors such as pencils, cigars, gum, etc.
The hidden price cut is the second factor which was
considered as a disequilibrating force in the Lubbock retail
gasoline market. These hidden price cuts were defined as any
extra consideration given for the purchase of gasoline.
It was found that over half of the majors gave no price
cut in the form of premiums while this was true of only about
thirty per cent of the independents. The most prevalent form
of hidden price cutting was the trading stamp. Thirty two
er cent of all stations in the market gave trading stamps

^or the purchase of gasoline while 24%
36
gave some other form of
price cut. These other hidden cuts ranged from an actual re
bate on the price paid for the purchase of gasoline in cash to
such things as cigars, pencils, gum and the like. Fourteen
per cent of the stations interviewed were giving seme type of
prize such as a new car or a boat motor. These were not direct
cuts as found in the other types of hidden cuts but are no less
price cuts in that they were used as devices to induce the
customer into the station to purchase gasoline.
In the total market 56% of the stations gave some type
of a price cut. The major reason for a station to institute
the giving of a hidden price cut was to attract new customers.
It was found that 28% of the stations gave price cuts for this
TABLE VIII
Lubbock stations giving premiums for purchase of gasoline by purpose
Purpose
To hold old
To attract new cus tomers ( .npmon Dracti^.^ other
T^ tal
Majors
Number of firms
2
7 6 1
16
% of firms
6.1
21.2 18.2 3
48.5
Independents Total
Number of firms
7
5*
12
% of ' Number | % of firms |of f irmsj firms
f 1
i 2 : 4
i 41.2 ' 14 28
; 6 12 29.4 6
70.6 1 28
12
56
Three were giving away prizes as advertising measures Two did not know why; they just gave discounts.

37
reason. Of the other 28% which gave price cuts the primary
reason mentioned for giving cuts was to hold their old cus
tomers (retaliation) rather than try to gain new ones. Retal
iation limits the success of the hidden price cut in incre as
ing trade. Among the stations giving any type of premium for
the purchase of gasoline approximately half indicated that
they have been successful in increasing the amount of gaso
line sold.
The data obtained indicated that 56% of the stations
in the market practiced some form of "under the board" price
cutting in struggling for a share of the market. As might be
exoected the stations giving a cash discount were the most
successful in gaining the sought for objective, namely, an
increase in volume. This group was quite small relative to
the total market composing only about 4% of the stations.
Twenty-eight per cent of all stations were successful m trie
attempt to increase volume through hidden price cutting. Of
this 28% substantially over half were only slightly success
ful.
It may be observed that the market conformed to the
general description of a typical market set forth in Chapter
I^ p. 2-4. There is some indication that the individual firm
does face an elastic demand when it can successfully cut its
prices without retaliation. This is indicated by the 10% of

38
•the stations which increased volume from 5 to 25% after the
institution of hidden price cuts. Retaliation was indicated
when other stations within the close proximity of the station
cutting its price also cut their prices in the same manner.
Successful retaliation was indicated when half of the stations
giving any type of premiums pointed out that they experienced
no change in the volume of gasoline pumped at the time they
instituted the practice. It may be safely said then that a
firm faced a relatively elastic demand in the absence of
retaliation but faced a somewhat inelastic demand when re
taliation was present.

CHAPTER IV
Summary and Conclusions
In the theory of monopolistic competition two dis
equilibrating factors were considered and the local market
was examined to determine whether these aspects were present
and if they occured as the theory indicated.
The first disequilibrating factor considered was the
development of excess capacity. In the theory it was stated
that if new resources entered the field when a situation of
long-run monopolistically competitive equilibrium prevailed
the result would be excess capacity. This would be manifest
first in severe price competition among the firms and ultimate
ly in a smaller share of the market for each at a price some
what higher than would otherwise-prevail.
In the Lubbock market statistics were available to in
dicate the market capacity in 1951. These indicators were;
(1) the average price of gasoline in both major and indepen
dent stations; (2) the average size of station in each group
as indicated by the number of pumps; (3) the total number of
stations located within the city limits of Lubbock; (4) the
number of passenger and commercial vehicles registered in
Lubbock; (5) the total population of the city; and (6) the
national average price of regular grade gasoline. A survey
^f the Lubbock market was conducted on May 28,29, and 30, 1958,
39

40
•to determine similar data for that time. A comparison of the
•two sets of data was made and the implications revealed.
It was found that the number of stations had increased
during this period but that there were more vehicles and
people per station in 1958 than in 1956. However, the aver
age station size as measured by the number of pumps was
somewhat larger in 1958. .Therefore the number of vehicles
and people per pump in 1958 was less than in 1951, indicating
a greater market capacity in 1958, and the price of gasoline
in the Lubbock market had increased substantially more than
the national average price over this period. It was found
that a period of severe price competition manifest in a
"gas war" was generally followed by a price increase which
resulted in prices above those prevailing prior to the war.
Similarities between the theory of monopolistic compe
tition and the real world situation were present. The theory
stated that new resources entering a long-run equilibrium
SI tuation would result in excess capacity. In the local
market the new resources found in larger more numerous
stations, indicated excess capacity when related to consuming
units. The theory indicated that severe price competition
wo uld occur. The local market has been plagued by "gas wars"
This too conformed to the theory. The theory indicated that
smaller share of the market for each would result in a

41
higher price. Here too the local market conformed. The fewer
consuming units per pump indicated a smaller share of the total
market and the substantial price rise relative to the national
average seemed to bear this out.
It may be concluded that the real-world situation did
seem to conform with the theory of monopolistic conpetition
with respect to excess capacity.
The second disequilibrating factor considered in the
theory was the hidden price cut. The theory of monopolistic
competition indicated that an individual firm could increase
its volume if it could devise some form of a hidden price
cut which would avoid retaliation.. If retaliation were
apparant, however, the result would be either a very slight
or no increase in volume.
wer e
In the local market several forms of hidden price cuts
found to be present. Such things as trading stamps.
prizes, discounts and various premiums such as gum, candy and
cigars were present. It was found that only a few stations
were able to avoid retaliation and thus increase their
volume. The greater portion of the stations were faced with
immediate retaliation and gained nothing by instituting
pr emiums.
In this portion of the theory of monopolistic compe
tition^ too it seems that the local market conformed by dis-

42
playing gains for some who did not face retaliation and n(
gains for those who did face retaliation.

43
BIBLIOGRAPHY
Bain, Joe S. The Economics of the Pacific Coast Petroleum Industry. Berkeley and Los Angeles: University of California Press, 1944.
Boulding, Kenneth E. Economic Analysis. New York: Harper and Brothers, 1955.
Burns, Arthur Robert. The Decline of Competition. New York: McGraw Hill Book Company, Inc., 1936.
Cassady, Ralph, Jr. Price Making and Price Behavior in the Petroleum Industry. New Haven: Yale University Press, 1954.
Cassady, Ralph, Jr. and Jones, Wylie L. The Nature of Competition in Gasoline Dis tribution at the Retail Level . Berkeley and Los Angeles: University of California Press, 1951.
Castle, Robert Marvin. "A Comparative Study of Standard and Independent Retail Gasoline Service Stations in Five Cities." Unpublished Master's Thesis, Texas Technological College, Lubbock, 1951.
Chamberlin, Edward. The Theory of Monopolistic Competition. Cambridge: Harvard University Press, 1939.
Clover, Vernon T. Business Research. Lubbock: Rodgers
Litho, Inc., 1958. i
Dirlam, Joel B. "The Petroleum Industry," in The Structure ofAmerican Industry, ed. Walter Adams. New York: The Macmillan Company, 1954,
Hamilton, Walton, et_ _al. Price and Price Policies. New York: McGraw Hill Book Company, Inc., 1938.
McAllister, Harry E. "The Elasticity of Demand for Gasoline," in Readings in Current Economics, ed. Morton C. Grossman et al. Homewood, Illinois: Richard D. Irwin, Inc., 1958.

APPENDIX I
Discussion and Analysis of Survey
On May 2S ^ 29, and 30, 1958, a sample survey of the
Lubbock, Texas, retail gasoline market was conducted and com
pleted. During this period fifty stations were interviewed
and the results of these interviews were tabulated in chart
form in the following sections of this appendix.
Upon completion of the interviewing a "cut-off" analy
sis was run to determine whether the sample was of adequate
size. A graphic presentation of two of .the questions is pre
sented to indicate that the answers were falling into a rather
level pattern by the time fifty of the questionnaires were
tabulated.
Question 3: Do you give any type of premium for the
purchase of gasoline?
Percent of Yes Answers
20 30 Numbers
Clover, Business Research, p. 256
44

45
Cuestion 7a: Has there been any change in the price of
gasoline as between the price charged before the war and the
price after the war?
Per cent of Yes Answers
60 50 40 30 20 10
17 IB 30" Number
40 50
is
A further test for the adequacy of size of this sample
found in the standard deviation. This test was applied to
the price of regular grade gasoline and to the number of pumps
in each station. The standard diviation of the price of regular
g rade gasoline was 1.38 and the number of pumps in the average
Stat ion was 1.5
mas
The sample data were compiled by type of station on a
ter questionnaire. The stations which were classed as major
stations are listed in the following chart:
List of Maior Stations
Gulf
Col-Tex
Standard
Texaco
Cono CO
Phillips
Humble
Cities Service
Cosden
The following tables are a presentation of the survey
yestion by question with comments where pertinent about each.

46
Summary Questionnaire
Major Stations
1. How long have you been in the retail gasoline business? (9) Less than 1 year How long in Lubbock? (9)less than 1 yr (2) 1-2 years (2)1-2 years (4) 2-3 years (4)2-3 years (3) 3-5 years (3)3-5 years (15) over 5 years Cl5)over 5 years
2. Compared with other gasoline markets with which you are familiar how would you rate competition in the Lubbock gasoline mar ket? (13) very keen (10) keen (10) moderate ( ) slight
3. Do you give any type of premium for the purchase of gas
ol ine? (16) yes (17) no (14) stamps ( 1) prize ( 1) discount
4. Why did you start giving premiums? (2) hold old customers (7) attract new customers ( 6 ) common p r a c t i c e (1) other-national advertising
5. When you started giving a premium was there any change in the amount of gasoline sold in your station?
(7) yes (4) slight (2) 5% to 15% (1) 15% to 25%
^^ in your opinion who started the gas wars over the past
two years? (10) independents ( 5) majors ( 3) both ( 5) not qualified (in business too short a period of time) /j O) refused to answer

47
« In your opinion why did they start them? ^11) to increase volume ^ 6) surpluses ^ 3) retaliation
^' Has there been any change in the price of gasoline as between the price charged before the war and the price after the war? 1957 war:
(18) yes (18)
( )
up down
(14) l < ; i ( 4) 2<;i
195 6 war: (14) yes
( 1) H (11) K: ( 2) 2<^
(14)
( )
up down
9. Did your station experience any change in volume of gasoline pumped during the gas war of 1957? (24) yes (23) up
. (12) slight ( 9) 20-3 5% ( 2) 35-50%
( 1) down ( 1) slight
10. (16) manager (17) manager-owner
11. Price of gasoline: R egular ( 2) 27.9 ( 3) 28.9 (11) 29.9 (16) 30,9 ( 1) 31.0
Ethyl ( 1) 31.9 ( 6) 32,9 (12) 33.9 (14) 34.9
12. ( 1) (10)
(11) ( 1) ( 6) ( 1) ( 3)
Number 2 3 4 5 6 7 8
of pumps:

48
SUMMARY QUESTIONNAIRE
Independent Stations
1. How long have you been in the retail gasoline business? (5) less than 1 year How long in Lubbock? (5) less than 1 yr. (4) 1-2 years (4) 1-2 yrs, (1) 2-3 years (1) 2-3 yrs. (1) 3-5 years (1) 3-5 yrs. (6) over 5 years (6) over 5 Yrs.
2. Compared with other gasoline markets with which you are familiar how would you rate competition in the Lubbock gasoline market? (4) very keen (4) keen (9) moderate
3. Do you give any type of premium for the purchase of gas
ol ine? (12) yes ( 5) no ( 2) stamps ( 6) prize ( 3) discount ( 1) other-favors such as pencils, cigars, gum etc.
4. Why did you start giving premiums? ( ) hold old customers ( 7) attract new customers ( 5) other-three are giving away prizes as advertising measures
Two do not know why; they just give discounts.
5. When you started giving a premium was there any change in the amount of gasoline sold in your station?
(7) yes-up (5) slight (1) 5% to 15% (1) 15% to 25%
6. In your opinion who started the gas wars over the past
two years? (4) independents (2) majors
(1) G"^^ (4) not qualified (in business too short a period of time) / ) refused to answer

49
7. In your opinion why did they start them? (5) to increase volume
(1) surpluses (1) income tax
8. Has there been any change in the price of gasoline as between the price charged before the war and the price after the war? 1957 war:
(7) yes (7) up (4) l<;i ( ) down
(1) 2<;i (2) 3<;i
1956 war: (6)yes (5) up (1) down
(3) l<;i (1) l(;i
(2) 2<<
9. Did your station experience any change in volume of gas
oline pump during the gas war of 1957?
(9) yes (6) up (3) slight (1) 20-35% (2) 35=50%
10. (10) manager (7) manager-owner
11. Price of gasoline: Regular Ethyl ( 3) 26.9 (3) 28.9 (14) 27.9 (6) 29.9
(8) 30.9
(3)
( )
(1) (2)
down siight 20-35% 35-50%
12.
(1) (5) (6)
(1) (3)
(1)
Number of pumps:
2 3 4
5 6 7
LUBBOCK. TEXAS