Solvents and reagents used - INFLIBNETshodhganga.inflibnet.ac.in/bitstream/10603/12880/11/11_chapter...
106
Page | 88 CHAPTER 5 EXPERIMENTAL • Solvents and reagents used: All the reagents used in the assay procedures were of analytical reagent grade purchased from S. D. Fine Chemicals Ltd. Mumbai and analytical grade solvents were purchased from Rankem, India. Pre-coated HPTLC plates of silica gel GF 254 were obtained from E-Merck, Germany. Reference catechin was purchased from Sigma–Aldrich (Germany). HPLC grade and analytical grade solvents were obtained from Merck (Mumbai, India). Silica gel GF 254 was obtained from (E-Merck, Germany). Reference catechin was purchased from Sigma–Aldrich (Germany). HPLC grade solvents were obtained from Merck (Mumbai, India). Sodium nitroprusside, sulphanilic acid, α-naphthyl-ethylene diamine, trichloroacetic acid (TCA), and DPPH (1,1-diphenyl-2-picrylhydrazyl), were used from Sigma Aldrich (USA). Ferrous sulphate (FeSO 4 ) and acetic acid were obtained from S.D.Fine Chemicals, Mumbai. Folin–Ciocalteau reagent was purchased from Fluka analyticals, Switzerland. MCDB medium, Fetal Bovine serum, L-glutamine, and penicillin/streptomycin mixture were obtained from GIBCO, Invitrogen (Grand Island, NY, USA). ROS assay dye 5-(and-6)-chloromethyl-2′,7′-dichlorodihydrofluorescein diacetate, acetyl ester (CM-H 2 DCFDA), trypsin (0.05%), tryphan blue stain, Endothelial Cell Growth Medium (EGM-2) single Quots, and Endothelial Basal Medium-2 (EBM-2) were also purchased from Invitrogen. WST-1 dye (cell proliferation reagent) was obtained from Roche Diagnostics (Indianapolis, USA). Quant – iT protein quantification kit, EGM-2 single Quots, EBM-2 were also purchased from Invitrogen. Page Ruler prestained protein was obtained from Roche Diagnostics (Indianapolis, USA). PCR primers for NF-E2-related factor-2 (Nrf2), NAD(P)H:quinone oxidoreductase-1 (NQO1), heme oxygenase-1 (HMOX1), glutamate–cysteine ligase catalytic subunit (GCLC) and glutamate–cysteine ligase regulatory subunit (GCLM) were purchased from Invitrogen. Antibodies against Nrf2, were from SantaCruz Biotechnology (Santa Cruz, CA, USA). STZ was purchased from Sigma Aldrich, Germany, trisodium citrate and nicotinamide, were purchased from Merck, India. The pellet diet was obtained from Amrut animal feed suppliers, Mumbai, India.
-
Upload
hoanghuong -
Category
Documents
-
view
244 -
download
3
Transcript of Solvents and reagents used - INFLIBNETshodhganga.inflibnet.ac.in/bitstream/10603/12880/11/11_chapter...
P a g e | 88
CHAPTER 5 EXPERIMENTAL
• Solvents and reagents used:
All the reagents used in the assay procedures were of analytical reagent grade
purchased from S. D. Fine Chemicals Ltd. Mumbai and analytical grade solvents
were purchased from Rankem, India.
Pre-coated HPTLC plates of silica gel GF254 were obtained from E-Merck,
Germany. Reference catechin was purchased from Sigma–Aldrich (Germany).
HPLC grade and analytical grade solvents were obtained from Merck (Mumbai,
India). Silica gel GF254 was obtained from (E-Merck, Germany). Reference
catechin was purchased from Sigma–Aldrich (Germany).
HPLC grade solvents were obtained from Merck (Mumbai, India).
Sodium nitroprusside, sulphanilic acid, α-naphthyl-ethylene diamine,
trichloroacetic acid (TCA), and DPPH (1,1-diphenyl-2-picrylhydrazyl), were used
from Sigma Aldrich (USA). Ferrous sulphate (FeSO4) and acetic acid were
obtained from S.D.Fine Chemicals, Mumbai. Folin–Ciocalteau reagent was
purchased from Fluka analyticals, Switzerland.
MCDB medium, Fetal Bovine serum, L-glutamine, and penicillin/streptomycin
mixture were obtained from GIBCO, Invitrogen (Grand Island, NY, USA). ROS
assay dye 5-(and-6)-chloromethyl-2′,7′-dichlorodihydrofluorescein diacetate,
acetyl ester (CM-H2DCFDA), trypsin (0.05%), tryphan blue stain, Endothelial
Cell Growth Medium (EGM-2) single Quots, and Endothelial Basal Medium-2
(EBM-2) were also purchased from Invitrogen. WST-1 dye (cell proliferation
reagent) was obtained from Roche Diagnostics (Indianapolis, USA).
Quant – iT protein quantification kit, EGM-2 single Quots, EBM-2 were also
purchased from Invitrogen. Page Ruler prestained protein was obtained from
Roche Diagnostics (Indianapolis, USA).
PCR primers for NF-E2-related factor-2 (Nrf2), NAD(P)H:quinone
oxidoreductase-1 (NQO1), heme oxygenase-1 (HMOX1), glutamate–cysteine
ligase catalytic subunit (GCLC) and glutamate–cysteine ligase regulatory subunit
(GCLM) were purchased from Invitrogen. Antibodies against Nrf2, were from
SantaCruz Biotechnology (Santa Cruz, CA, USA).
STZ was purchased from Sigma Aldrich, Germany, trisodium citrate and
nicotinamide, were purchased from Merck, India. The pellet diet was obtained
from Amrut animal feed suppliers, Mumbai, India.
P a g e | 89
CHAPTER 5 EXPERIMENTAL
Avicel PH-102 (directly compressible micro crystalline cellulose- MCC) and
dibasic calcium phosphate (DCP) were purchased from FMC Biopolymers, India.
Talc was purchased from Norwegian GmbH, Germany and croscarmellose was
purchased from Maple Biotech Pvt. Ltd., India.
• Instruments and equipments used
UV- Visible spectrophotometer, Jasco V-530; Roche tablet friabilator, Dissolution
tester USP (XXIII) - Electrolab TDT-06T, Monsanto tablet Hardness tester -
Campbell electronics, Mumbai. Vernier Caliper-Mitutoyo, Japan were used in
analysis of tablet.
HPTLC studies were carried out using CAMAG LINOMAT 5 applicator and
CAMAG SCANNER III with WINCATS III software.
The HPLC analysis was done on a TOSOH-CCPM system equipped with UV-
Visible detector.
Chemwell Auto analyser supplied by Awareness Tech was used for analysis of
serum.
Densitometric analysis of western blotting was carried out with ChemiDoc XRS
(Bio-Rad). MyIQ PCR system (Bio-Rad, Hercules, CA) and MyiQ System
Software, Version 1.0.410 (Bio-Rad Laboratories Inc.) was used for PCR analysis.
P a g e | 90
CHAPTER 5 EXPERIMENTAL
5.1 PROCUREMENT AND AUTHENTICATION OF PLANT MATERIAL
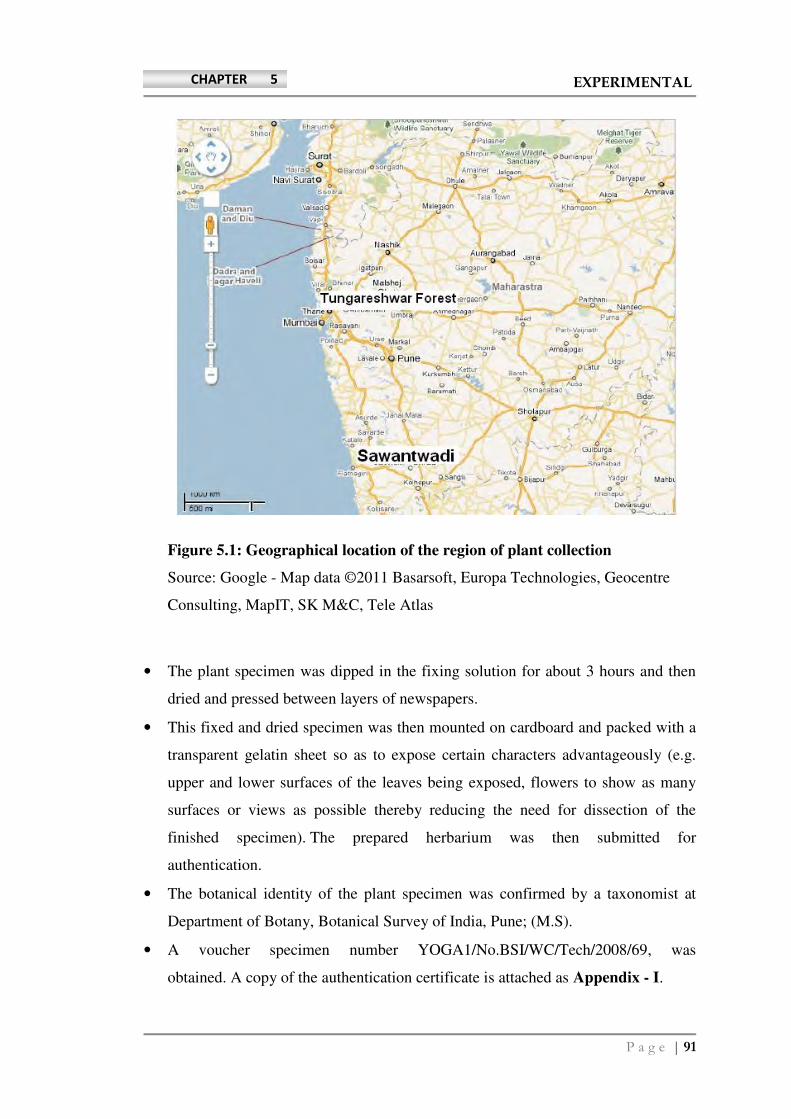
5.1.1 Collection of plant material
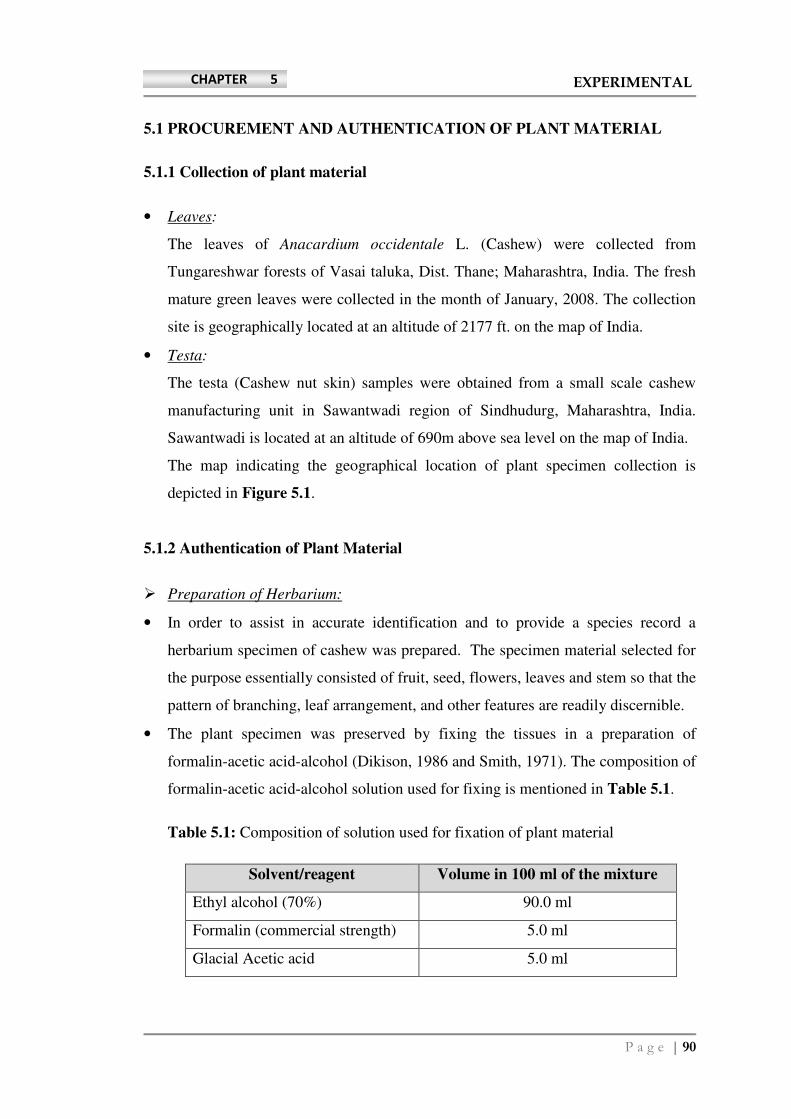
• Leaves:
The leaves of Anacardium occidentale L. (Cashew) were collected from
Tungareshwar forests of Vasai taluka, Dist. Thane; Maharashtra, India. The fresh
mature green leaves were collected in the month of January, 2008. The collection
site is geographically located at an altitude of 2177 ft. on the map of India.
• Testa:
The testa (Cashew nut skin) samples were obtained from a small scale cashew
manufacturing unit in Sawantwadi region of Sindhudurg, Maharashtra, India.
Sawantwadi is located at an altitude of 690m above sea level on the map of India.
The map indicating the geographical location of plant specimen collection is
depicted in Figure 5.1.
5.1.2 Authentication of Plant Material
� Preparation of Herbarium:
• In order to assist in accurate identification and to provide a species record a
herbarium specimen of cashew was prepared. The specimen material selected for
the purpose essentially consisted of fruit, seed, flowers, leaves and stem so that the
pattern of branching, leaf arrangement, and other features are readily discernible.
• The plant specimen was preserved by fixing the tissues in a preparation of
formalin-acetic acid-alcohol (Dikison, 1986 and Smith, 1971). The composition of
formalin-acetic acid-alcohol solution used for fixing is mentioned in Table 5.1.
Table 5.1: Composition of solution used for fixation of plant material
Solvent/reagent Volume in 100 ml of the mixture
Ethyl alcohol (70%) 90.0 ml
Formalin (commercial strength) 5.0 ml
Glacial Acetic acid 5.0 ml
P a g e | 91
CHAPTER 5 EXPERIMENTAL
Figure 5.1: Geographical location of the region of plant collection
Source: Google - Map data ©2011 Basarsoft, Europa Technologies, Geocentre
Consulting, MapIT, SK M&C, Tele Atlas
• The plant specimen was dipped in the fixing solution for about 3 hours and then
dried and pressed between layers of newspapers.
• This fixed and dried specimen was then mounted on cardboard and packed with a
transparent gelatin sheet so as to expose certain characters advantageously (e.g.
upper and lower surfaces of the leaves being exposed, flowers to show as many
surfaces or views as possible thereby reducing the need for dissection of the
finished specimen). The prepared herbarium was then submitted for
authentication.
• The botanical identity of the plant specimen was confirmed by a taxonomist at
Department of Botany, Botanical Survey of India, Pune; (M.S).
• A voucher specimen number YOGA1/No.BSI/WC/Tech/2008/69, was
obtained. A copy of the authentication certificate is attached as Appendix - I.
P a g e | 92
CHAPTER 5 EXPERIMENTAL
5.2 STANDARDIZATION OF PLANT MATERIAL
5.2.1 Introduction
The Ayurvedic system of medicine has been prevalent in India since a number of
decades, and still remains the mainstay of medical relief to over 60 per cent of the
population of the nation. In earlier times, the practitioners of Ayurveda collected
herbs and other ingredients for preparing medicines by themselves. For the
purpose of acquiring raw materials the Ayurvedic practitioners now depend on
commercial organizations trading in crude herbal drugs. Since past few decades a
number of Ayurvedic pharmaceutical units have come up for the manufacture of
Ayurvedic drugs and formulations on commercial scale.
Under the circumstances and responding to opinions of the scientific community,
the Govt. of India began a series of measures to introduce a quality control system
for western medicine. The Government of India introduced an amendment in 1964
to the Drug and Cosmetics Act 1940, to control to a limited measure the
Ayurvedic, Siddha and Unani drugs. Gradually, the development of standards for
the identity, purity and strength of single drugs and those of formulations at a later
stage, assumed importance for the effective enforcement of the provision of the
Act. If the raw materials to be used in a medicine and stage-by-stage processes of
manufacturers are standardized, the final product namely, the compound
formulation could be expected to conform to uniform standards. Arrangements to
evolve and lay down physical, chemical and biological standards, wherever even
necessary, to identify the drugs and ascertain their quality and to detect
adulterations are an urgent necessity of the health care related profession
(Harbone, 1998).
Ayurvedic, Unani and Homoeopathic Pharmacopoeias published by the Govt. of
India have prescribed various standards to be followed for herbal drugs. In 2002
Govt. of India published Good Laboratory Practices (GLP) guidelines to guide the
drug analysts in maintaining high scientific and professional standards for
ensuring that, only drugs of the highest quality are produced and marketed. In
2003, government issued notification of Good Manufacturing Practices (GMP) to
ensure authentic, contamination free quality raw material, manufacturing process
and product with desired quality standards.
P a g e | 93
CHAPTER 5 EXPERIMENTAL
5.2.2 Background of the study
Standards for quality control of herbal products are based on pharmacognostic,
physicochemical, phytochemical and biological parameters. Although cashew has
been explored for varied pharmacological and phytochemical investigations, there
have been no reports based on the standardization of cashew (Konan, 2007; Abas,
2006; Kudi, 1999; Goncalves, 2005 and Kamtchouing, 2001).
5.2.3 Tests for phytochemical analysis
The process and parameters employed in standardization of cashew leaves and
testa are described below: (The Ayurvedic Pharmacopoeia of India, 2008;
Khandelwal, 1999; Trease, 1983 and Harbone, 1998)
A. Sampling of plant material:
• The leaves obtained after collection were washed, cleansed and made free of any
foreign material. Only mature green leaves were selected for further processing
and kept in shade until dried.
• The dried testa obtained was also cleansed manually and made free of any foreign
material.
• The plant materials were then crushed to coarse powder mechanically, sieved
through sieve no. 44 and stored in air tight containers and used for further
analysis.
B. Identification Tests
a) Organoleptic characterization:
• In order to determine the organoleptic characters of the drug, the colour, odour
and taste of the plant material were estimated by visual and sensory evaluation.
b) Macroscopic characteristics:
• To study the macroscopic characters of fresh leaves the following characteristics
were noted: size and shape, colour, surfaces, venation, presence or absence of
petiole, the apex, margin, base, lamina, texture, odour and taste.
P a g e | 94
CHAPTER 5 EXPERIMENTAL
c) Microscopic analysis and powder characteristics:
• Microscopic analysis shows the unit structures in distinct manner and helps to
draw conclusions about the drug characteristics. The recognition of discrete and
disoriented tissue components helps to ascribe them to their correct source.
• In order to perform the microscopy studies of cashew leaves the green fresh
mature leaves were boiled in chloral hydrate solution. The sections of treated
leaves were stained with phloroglucinol and concentrated HCl and mounted with
glycerin and observed under a compound microscope with suitable magnification
(Tatke, 2009).
• Powder characteristics of the material were studied by making it free from any
cellular debris by treatment with suitable reagents. A part of the treated material
was then mounted upon slides and observed under the microscope.
• Fluorescence characters of powdered plant material with different chemical
reagents such as phluroglucinol were determined under ordinary and ultraviolet
light.
C. Physicochemical analysis
a) Determination of Moisture Content (Loss on Drying):
• The procedure mentioned below is used for substances appearing to contain water
as the only volatile constituent.
• About 10.0 g of drug (i.e. leaves and testa powder) (without preliminary drying)
were placed separately after accurately weighing in tared evaporating dishes.
• After placing the above said amount of the drugs in the tared evaporating dishes,
the drugs were dried at 1050 in a Hot Air Oven for 5 hours and weighed.
• The drying and weighing procedure was continued at one hour interval until
difference between two successive weighing corresponded to not more than 0.25
per cent w/w.
• When two consecutive weighings after drying and cooling for 30 mins intervals in
a desiccator, showed not more than 0.01 g difference in weight, then it was
considered that a constant weight.
P a g e | 95
CHAPTER 5 EXPERIMENTAL
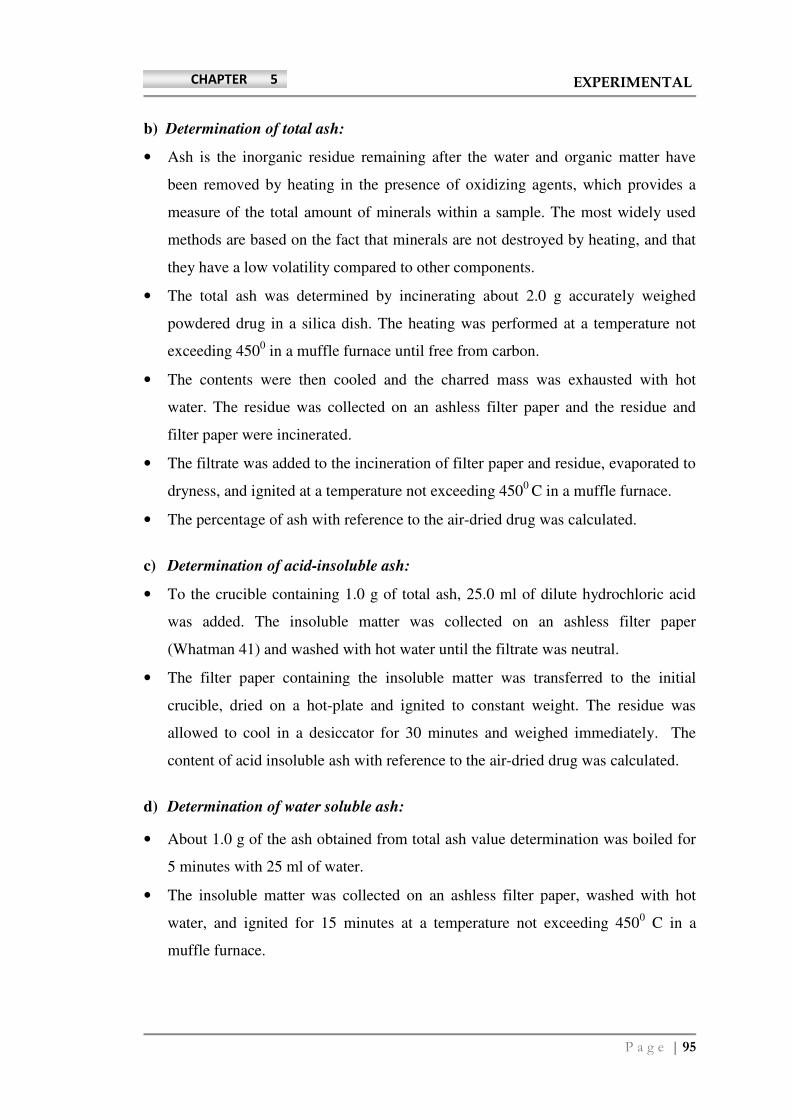
b) Determination of total ash:
• Ash is the inorganic residue remaining after the water and organic matter have
been removed by heating in the presence of oxidizing agents, which provides a
measure of the total amount of minerals within a sample. The most widely used
methods are based on the fact that minerals are not destroyed by heating, and that
they have a low volatility compared to other components.
• The total ash was determined by incinerating about 2.0 g accurately weighed
powdered drug in a silica dish. The heating was performed at a temperature not
exceeding 4500 in a muffle furnace until free from carbon.
• The contents were then cooled and the charred mass was exhausted with hot
water. The residue was collected on an ashless filter paper and the residue and
filter paper were incinerated.
• The filtrate was added to the incineration of filter paper and residue, evaporated to
dryness, and ignited at a temperature not exceeding 4500
C in a muffle furnace.
• The percentage of ash with reference to the air-dried drug was calculated.
c) Determination of acid-insoluble ash:
• To the crucible containing 1.0 g of total ash, 25.0 ml of dilute hydrochloric acid
was added. The insoluble matter was collected on an ashless filter paper
(Whatman 41) and washed with hot water until the filtrate was neutral.
• The filter paper containing the insoluble matter was transferred to the initial
crucible, dried on a hot-plate and ignited to constant weight. The residue was
allowed to cool in a desiccator for 30 minutes and weighed immediately. The
content of acid insoluble ash with reference to the air-dried drug was calculated.
d) Determination of water soluble ash:
• About 1.0 g of the ash obtained from total ash value determination was boiled for
5 minutes with 25 ml of water.
• The insoluble matter was collected on an ashless filter paper, washed with hot
water, and ignited for 15 minutes at a temperature not exceeding 4500 C in a
muffle furnace.
P a g e | 96
CHAPTER 5 EXPERIMENTAL
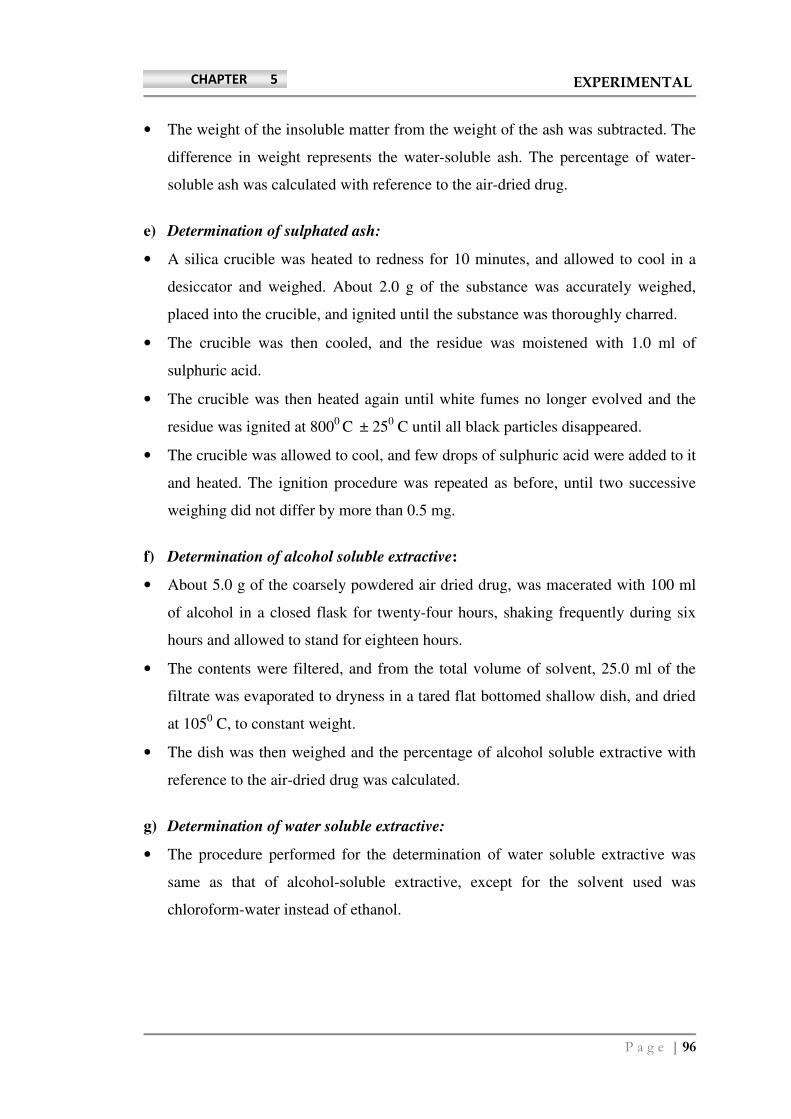
• The weight of the insoluble matter from the weight of the ash was subtracted. The
difference in weight represents the water-soluble ash. The percentage of water-
soluble ash was calculated with reference to the air-dried drug.
e) Determination of sulphated ash:
• A silica crucible was heated to redness for 10 minutes, and allowed to cool in a
desiccator and weighed. About 2.0 g of the substance was accurately weighed,
placed into the crucible, and ignited until the substance was thoroughly charred.
• The crucible was then cooled, and the residue was moistened with 1.0 ml of
sulphuric acid.
• The crucible was then heated again until white fumes no longer evolved and the
residue was ignited at 8000
C ± 25
0 C until all black particles disappeared.
• The crucible was allowed to cool, and few drops of sulphuric acid were added to it
and heated. The ignition procedure was repeated as before, until two successive
weighing did not differ by more than 0.5 mg.
f) Determination of alcohol soluble extractive:
• About 5.0 g of the coarsely powdered air dried drug, was macerated with 100 ml
of alcohol in a closed flask for twenty-four hours, shaking frequently during six
hours and allowed to stand for eighteen hours.
• The contents were filtered, and from the total volume of solvent, 25.0 ml of the
filtrate was evaporated to dryness in a tared flat bottomed shallow dish, and dried
at 1050 C, to constant weight.
• The dish was then weighed and the percentage of alcohol soluble extractive with
reference to the air-dried drug was calculated.
g) Determination of water soluble extractive:
• The procedure performed for the determination of water soluble extractive was
same as that of alcohol-soluble extractive, except for the solvent used was
chloroform-water instead of ethanol.
P a g e | 97
CHAPTER 5 EXPERIMENTAL
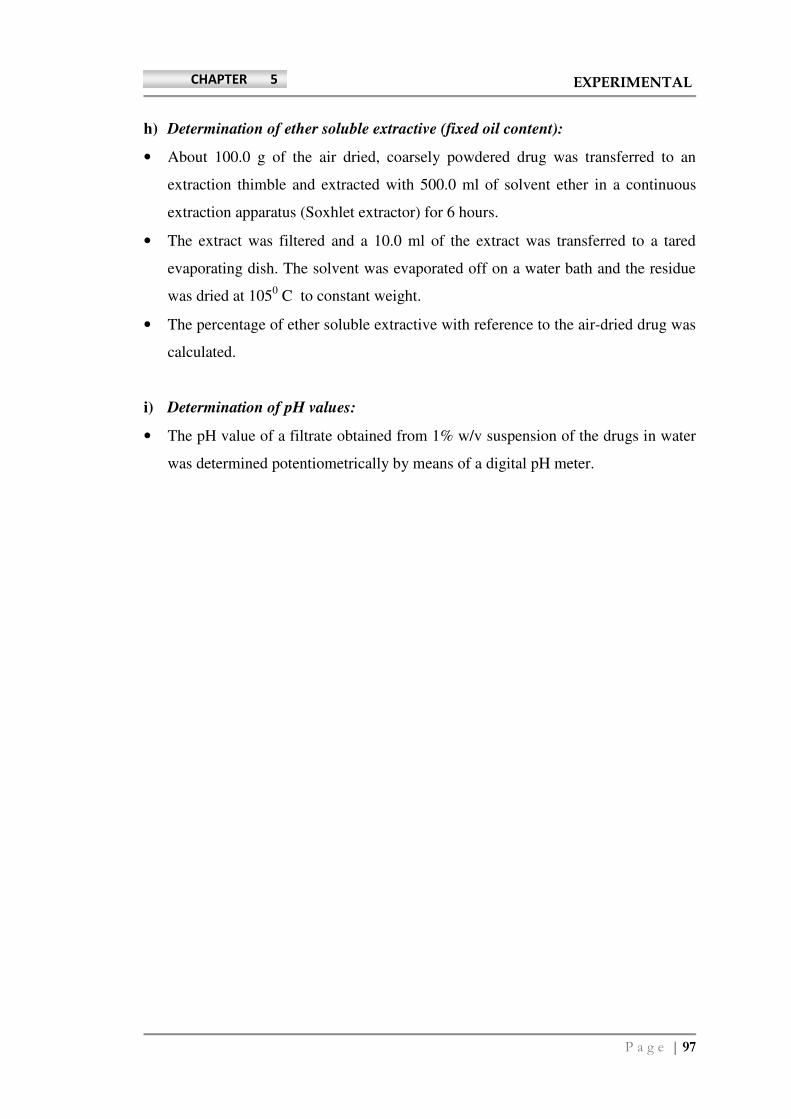
h) Determination of ether soluble extractive (fixed oil content):
• About 100.0 g of the air dried, coarsely powdered drug was transferred to an
extraction thimble and extracted with 500.0 ml of solvent ether in a continuous
extraction apparatus (Soxhlet extractor) for 6 hours.
• The extract was filtered and a 10.0 ml of the extract was transferred to a tared
evaporating dish. The solvent was evaporated off on a water bath and the residue
was dried at 1050 C to constant weight.
• The percentage of ether soluble extractive with reference to the air-dried drug was
calculated.
i) Determination of pH values:
• The pH value of a filtrate obtained from 1% w/v suspension of the drugs in water
was determined potentiometrically by means of a digital pH meter.
P a g e | 98
CHAPTER 5 EXPERIMENTAL
5.3 EXTRACTION OF PLANT MATERIAL
5.3.1 Introduction
Extraction, as the term is used pharmaceutically, involves the separation of
medicinally active portions of plant or animal tissues from the inactive or inert
components by using selective solvents in standard extraction procedures. The
purposes of standardized extraction procedures for crude drugs are to attain the
therapeutically desired portion and to eliminate the inert material by treatment
with a selective solvent known as ‘menstruum’. The extract thus obtained can be
used as a medicinal agent in the form of tinctures and fluid extracts, it can be
further processed to be incorporated in any dosage form such as tablets or
capsules, or it can be fractionated to isolate individual chemical entities. Thus,
standardization of extraction procedures contributes significantly to the final
quality of the herbal drug (Handa, 2008 and Tandon, 2008).
5.3.2 Background
Based upon the literature survey for cashew and the pharmacological activity
envisaged in the project, the solvents were selected for each of the plant part, viz.
testa and leaves of cashew.
5.3.3 Methodology
Based upon the nature of the solvents conventional and Microwave assisted
extraction technique was also applied for extraction of leaves and testa with
various solvents. A comparison of the conventional extraction technique i.e.
Soxhlet extraction and Microwave Assisted Extraction Process (MAEP) was
carried out based upon the extractive yields of extracts. The further processing
(i.e. drying and concentration of the extract) was based upon the nature of the
solvent used. The drug : volume of solvent ratio was optimized so as to obtain
maximum extractive yield.
P a g e | 99
CHAPTER 5 EXPERIMENTAL
A. Hot Continuous Extraction (Soxhlet Extraction)
a) Principle:
• In this method, the finely ground crude drug is placed in a porous bag or
“thimble” made of muslin cloth, and is placed in the Soxhlet apparatus. The
extracting solvent in flask is heated, and its vapors condense in condenser. The
condensed extractant drips into the thimble containing the crude drug, and extracts
it by contact. This process is continuous and is carried out until a drop of solvent
from the siphon tube does not leave residue when evaporated, indicating
completion of the extraction process.
• The advantage of this method is that large amounts of drug can be extracted with a
much smaller quantity of solvent. This affects economy in terms of time, energy
and consequently financial inputs (Tandon, 2008).
b) Procedure:
• The dried and coarsely powdered drug, was passed through sieve no. 44 was used
for extraction.
• The temperature range for extraction was 40-450C using a calibrated heating
mantle for heating.
• The drug was continuously extracted for a period of 18 hours and the resultant
solution was filtered. The marc was discarded and the filtrate was concentrated on
a rotary evaporator under vacuum.
• Several ratios of drug: solvent ratios were used to optimize the extraction
procedure. Drug: solvent ratios of 1:1, 1:3 and 1:5 were tried for leaves and testa
in order to obtain maximum extractive yield.
• The ratio of 1:5 and 1:3 (drug: solvent) was found to give maximum yield for
cashew leaves, and testa, respectively. These optimized proportions were used for
further extractions.
• Ethanol extract of leaves and ethanol and methanol extract of testa were prepared
by this process.
P a g e | 100
CHAPTER 5 EXPERIMENTAL
B. Decoction
a) Principle:
In this process, the crude drug is boiled in a specified volume of water for a
defined time; it is then cooled and strained or filtered. This procedure is suitable
for extracting water-soluble, heat-stable constituents. The starting ratio of crude
drug to water is fixed. The filtrate obtained is then concentrated and used further.
b) Procedure:
• The dried and coarsely powdered drug, passed through sieve no. 44 was extracted
at 40-450C in a round bottom flask with distilled water as the solvent for
extraction.
• The drug was continuously extracted for a period of 3 hours and the resultant
solution was filtered through muslin cloth and then through filter paper to avoid
any suspended particles in the extract.
• The marc was discarded and the filtrate was concentrated by lyophilisation.
• The drug: solvent ratio of 1:3, was found to be optimum for extraction of leaves
and testa by decoction to obtain the maximum extractive yield.
• Aqueous extract of leaves and aqueous extract of testa were prepared by this
process.
P a g e | 101
CHAPTER 5 EXPERIMENTAL
C. Microwave-assisted Extraction
a) Principle:
• Microwave radiation interacts with dipoles of polar and polarizable materials.
Polar molecules try to orient in the changing field direction and hence get heated.
In non-polar solvents without polarizable groups, the heating is poor (dielectric
absorption only because of atomic and electronic polarizations).
• This thermal effect is practically instantaneous at the molecular level but limited
to a small area and depth near the surface of the material. The rest of the material
is heated by conduction.
• In microwave-assisted extraction (MAE) the extraction takes places by five basic
steps:
i) The heat of the microwave irradiation being directly transferred to the solid
without absorption by the microwave-transparent solvent;
ii) The intense heating in step 1 causing instantaneous heating of the residual
microwave - absorbing moisture in the solid;
iii) The heated moisture evaporates, creating a high vapor pressure;
iv) The vapor pressure generated by the moisture breaks the cell; and
v) Breakage of cell walls releases the trapped constituents within it.
• The major advantages of microwave heating are increased extraction / recovery,
reduced processing costs, significantly faster extraction, lesser energy usage, and
less solvent consumption.
b) Procedure:
The coarsely ground powders of leaves and testa were extracted with methanol
and water as extracting solvents in a microwave synthesizer at low (140 Watts)
and high power (700 Watts). The drug:solvent ratio used for extraction of testa
and leaves was 1:2. The mass thus obtained after extraction was filtered,
concentrated and dried.
P a g e | 102
CHAPTER 5 EXPERIMENTAL
c) Optimization of Microwave-assisted extraction (MAE)
• Influential parameters of MAE namely, microwave power, irradiation time, and
amount of extracting solvent were studied for optimization of extraction protocol.
The experiments were carried out in triplicates and the results were represented as
Mean ± SEM.
• The experiments were carried out separately for leaves as well as testa powder.
However, the extractive yield of testa did not show any change in the extractive
yield as compared to the conventional processes. Whereas, the leaves of cashew
exhibited considerable change in the extractive yields and thus was used for
further experiments.
• Aqueous and methanol extracts of leaves of cashew were prepared by MAE.
• These extracts were further analysed for total phenolics and catechin content to
estimate the effect of microwave irradiation on the same.
P a g e | 103
CHAPTER 5 EXPERIMENTAL
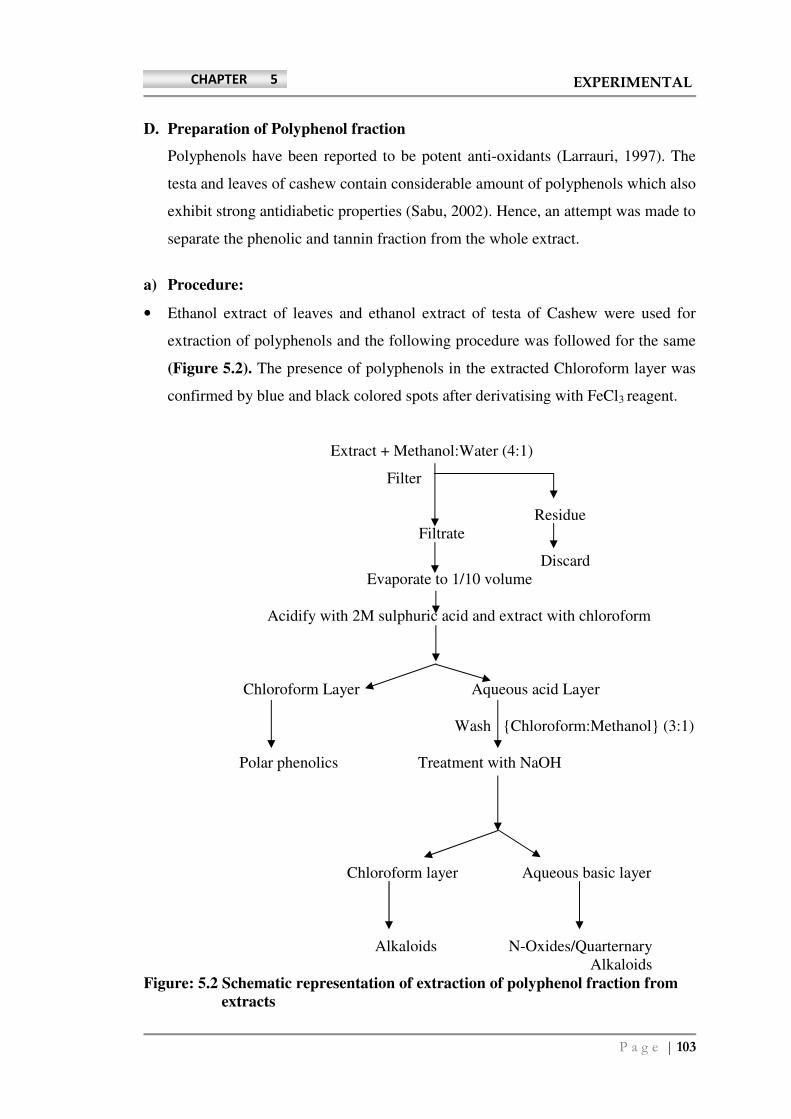
D. Preparation of Polyphenol fraction
Polyphenols have been reported to be potent anti-oxidants (Larrauri, 1997). The
testa and leaves of cashew contain considerable amount of polyphenols which also
exhibit strong antidiabetic properties (Sabu, 2002). Hence, an attempt was made to
separate the phenolic and tannin fraction from the whole extract.
a) Procedure:
• Ethanol extract of leaves and ethanol extract of testa of Cashew were used for
extraction of polyphenols and the following procedure was followed for the same
(Figure 5.2). The presence of polyphenols in the extracted Chloroform layer was
confirmed by blue and black colored spots after derivatising with FeCl3 reagent.
Extract + Methanol:Water (4:1)
Filter
Residue
Filtrate
Discard
Evaporate to 1/10 volume
Acidify with 2M sulphuric acid and extract with chloroform
Chloroform Layer Aqueous acid Layer
Wash {Chloroform:Methanol} (3:1)
Polar phenolics Treatment with NaOH
Chloroform layer Aqueous basic layer
Alkaloids N-Oxides/Quarternary
Alkaloids
Figure: 5.2 Schematic representation of extraction of polyphenol fraction from
extracts
P a g e | 104
CHAPTER 5 EXPERIMENTAL
5.4 PRELIMINARY PHYTOCHEMICAL SCREENING OF EXTRACTS
5.4.1 Introduction
Phytochemicals are non-nutritive secondary plant metabolites that have protective
or disease preventive properties. There are many known phytochemicals quoted in
scientific publications. It is well-known that plants produce these chemicals to
protect themselves but recent research demonstrates that these phytochemicals can
protect not only plants but also humans against diseases. Some of the well-known
phytochemicals are lycopene in tomatoes, isoflavones in soy and flavonoids in
fruits. Phytochemicals have a number of effects in humans like
antioxidant activity, Hormonal action, Anti-bacterial effect etc.
Only a few years ago, the term "phytochemical" was barely known. But doctors,
nutritionists, and other health care practitioners have long advocated a low-fat diet
that includes a variety of fruits, vegetables, legumes, and whole grains.
Historically, cultures that consume such a diet have lower rates of certain cancers
and heart disease. Since the passage of the Dietary Supplement Health and
Education Act (DSHEA) in the United States in 1994, a large number of
phytochemicals are being sold as dietary supplements (Chang, 2000).
a) Significance of phytochemical screening approaches
• The goal in surveying plants for biologically active or medicinally useful
compounds should be to isolate one or more constituents responsible for a
particular activity. Hence phytochemical screening techniques can be a valuable
aid in selection of a specific plant for pharmacologic approaches (Tatke, 1999).
• Certain investigators feel that an initial selection of investigational plants should
be made not on evidence that extracts elicit a particular and interesting biological
activity, but rather on the basis that certain chemicals are present in the plant, and
compounds/constituents closely related to them can usually be associated with
biological activity.
• Tests for the presence of these compounds in plants are simple, can be conducted
rapidly, and are reasonably reliable, and they help in making extraction and
isolation procedures easier.
P a g e | 105
CHAPTER 5 EXPERIMENTAL
• In addition, economics, as well as other factors associated with biological testing,
often force the investigation to pursue a phytochemical group that can be selected
for investigation.
5.4.2 Background
There are few reports stating the pharmacological effects of some extracts of
cashew leaves and testa (Kamath, 2007; Konan, 2007; Abas, 2006 and Gonçalves,
2005). However, there are no reports published for the phytochemical
investigations of the extracts selected in this study. Hence a detailed and
systematic phytochemical screening of the prepared extracts of leaves and testa of
cashew was carried out by qualitative chemical tests.
5.4.3 Procedure
One gram of each of the extracts of testa and leaves of cashew were dissolved in
100 ml of respective solvents used for extraction to obtain a stock of concentration
1% (v/v). The extracts thus obtained were subjected to preliminary phytochemical
screening following the methodology described below (Harborne, 1998 and
Khandelwal 1999).
A. Test for Carbohydrates
a) Molisch's test
The test solution is treated with few drops of alcoholic alpha-naphthol. About 0.2
ml of conc. Sulfuric acid was slowly added through the sides of the test tube.
Formation of violet ring indicates the presence of carbohydrates.
b) Benedict's test
The test solution is treated with few drops of Benedict's reagent (alkaline solution
containing cupric citrate complex) and boiled on water bath, to check the presence
of reducing sugars.
c) Fehling's test
Equal volume of Fehling's A (Copper sulfate in distilled water) and Fehling's B
(Potassium tartarate and Sodium hydroxide in distilled water) reagents are mixed
P a g e | 106
CHAPTER 5 EXPERIMENTAL
and few drops of sample are added and boiled. A brick red precipitate of cuprous
oxide forms, if reducing sugars are present.
d) Barfoed’s test
Equal volumes of Barfoed’s reagent and test solution are mixed. The solution is
heated in a boiling water bath for 1-2 mins and cooled. Red precipitate indicates
the presence of monosaccharides.
e) Test for pentoses:
An equal amount of test solution is mixed with HCl and a crystal of
phloroglucinol was added to it. If red colour appears it indicates the presence of
pentoses.
f) Selwinoff’s test
About 1 ml of the test solution is added to 3ml of Selwinoff’s reagent and boiled
in a boiling water bath for 1-2 mins. Fructose gives red color within half minute.
The test is sensitive to 5.5mmol / liter if glucose is absent, but if glucose is present
it is less sensitive and in addition of large amount of glucose can give similar
color. Hydrochloric acid reacts with ketose sugar to form derivatives of
furfuraldehyde, which gives red color indicating the presence of ketoses.
g) Tests for non-reducing polysaccharides
About 3.0ml of the test solution is taken and few drops of dilute iodine solution
were added to it. A blue color disappears on boiling and develops on cooling
indicating the presence of starch.
h) Test for Gums
The test solution is hydrolysed using dilute HCl and Fehling’s test was performed.
A red color development indicates the presence of gums.
i) Test for mucilage
The powdered drug is treated with aqueous KOH. If the solution of powdered
drug swells, it indicates the presence of mucilage.
P a g e | 107
CHAPTER 5 EXPERIMENTAL
B. Tests for Proteins
a) Millons test
Test solution is mixed with 2ml of Millons reagent (Mercuric nitrate in nitric acid
containing traces of nitrous acid). If a white precipitate appears, which turns red
upon gentle heating, it indicates the presence of proteins.
C. Tests for Amino Acids
a) Ninhydrin test
About 3.0 ml of test solution is boiled with few drops of with 5% solution of
Ninhydrin (Indane 1, 2, 3 trione hydrate), in a boiling water bath. The
development of violet color indicates the presence of proteins.
D. Test for Fats and Fixed Oils
a) Stain test
A small quantity of extract is pressed between two filter papers. If the filter paper
is stained then it indicates the presence of fixed oils.
b) Saponification test
Few drops of 0.5N of alcoholic potassium hydroxide is added to small quantities
of various extracts along with a drop of phenolphthalein separately. The mixture
is heated on a water bath for 1-2 hrs. The formation of soap or partial
neutralization of alkali indicates the presence of fixed oils and fats.
E. Test for Sterols and Triterpenoids
a) Libermann- Buchard test
The test sample is treated with few drops of acetic anhydride, boiled and cooled.
Con. Sulfuric acid is added from the sides of the test tube. A brown ring at the
junction of two layers and the upper green colored layer shows the presence of
steroids and formation of deep red color indicates the presence of triterpenoids.
F. Test for Glycosides
The extract is tested for free sugars. The extract is hydrolyzed with dilute HCl and
then tested for the glycone and aglycone moieties.

P a g e | 108
CHAPTER 5 EXPERIMENTAL
a) Legal’s test for Cardiac Glycosides
About 1.0 ml of the extract is treated with 1.0 ml pyridine and 1.0 ml alkaline
sodium nitroprusside solution. Pink to red color appears indicating presence of
cardiac glycosides.
b) Keller Killiani test [for deoxy sugars]
The test solution is treated with 0.4ml of glacial acetic acid containing a drop of
5% ferric chloride and 0.5ml of concentrated sulphuric acid is added by the sides
of the test tube. The appearance of blue color in the acetic acid layer indicates the
presence of deoxy sugars.
c) Froth Test for Saponin Glycosides
About 1ml of aqueous solution of extract in water is shaken well and noted for a
stable froth. A stable froth indicates the presence of saponins.
d) Hemolysis test for Saponin Glycosides
About 0.2ml solution of drug solution (prepared in 1% normal saline) is added to
0.2ml of v/v blood in normal saline on a glass slide. If hemolytic zone appears it
indicates the presence of saponins.
e) Sodium picrate test (grignard reaction) for Cyanogenetic Glycosides
About 200mg of drug is placed in a conical flask and moistened with few drops of
water. A piece of picric acid paper is moistened with sodium carbonate solution
(5% aqueous) and suspended by means of cork in the neck of the flask. The flask
is then warmed gently at about 37°C. The change in color is observed. Hydrogen
cyanide is liberated from cyanogenetic glycoside (if present) by the enzyme
activity and reacts with sodium picrate to form the reddish purple sodium
isopicrate.
f) Tests for Coumarin Glycosides
The test solution is made alkaline and the colour change is observed. The
development of blue or green color fluorescence indicates the presence of
Coumarin Glycosides.
P a g e | 109
CHAPTER 5 EXPERIMENTAL
G. Test for Flavonoids
a) Shinoda test (Magnesium Hydrochloride reduction) To the test solution, few
fragments of Magnesium ribbon are added and concentrated hydrochloric acid is
added drop wise. A pink scarlet, crimson red or occasionally green to blue color
appears after few minutes if flavanoids are present.
b) Alkaline reagent test for Flavonoids
To the test solution few drops of sodium hydroxide solution are added. The
formation of an intense yellow color, which turns to colorless on addition of few
drops of dil. acid, indicates presence of Flavonoids.
H. Tests for Alkaloids
a) Dragendorff’s test
To 2-3 ml of test solution, few drops of Dragendorff’s reagent [Potassium bismuth
iodide solution] were added. Alkaloids give orange brown precipitate if present.
I. Test for Tannins and Phenolic Compounds
a) Ferric chloride test: To the test solution few drops of 5% FeCl3 solution are
added. The development of blue black color indicates the presence of tannins and
phenolics.
J. Tests for organic acids
a) Calcium chloride test
To 2.0 ml of test solution, few drops of 5% CaCl2 solution are added and color
changes are observed.
P a g e | 110
CHAPTER 5 EXPERIMENTAL
5.5 ISOLATION OF CATECHIN
5.5.1 Introduction
Plants contain a large amount of structurally and functionally diverse components.
Medicinal plants serve as an important source to invent potential and safe drugs.
Numerous novel bioactive compounds have been isolated and identified from
plants. Considerable efforts have been directed towards the isolation and
identification of compounds from medicinal plants, which are most likely to be
responsible for the reported bioactivities. However, isolation and purification of
pure compounds from plants is usually difficult, tedious and expensive process.
Reports on the identification of novel compounds from plants are available in
significant numbers; however research publications on the quantitative analysis of
novel bioactive compounds are relatively few, due to the lack of standard
compounds. Thus, isolation of bioactive compounds is of great significance in the
field of phytochemistry.
The quality control of active constituents or marker compounds in the herbal
extract is of great importance in medicinal and dietary applications. The isolation
and identification of marker compounds in herbal medicines is a prerequisite in
quality control since most of these compounds are not commercially available.
Extraction and isolation methods including various chromatographic methods to
obtain marker compounds from herbal medicines have been extensively reported
(Hendriks, 2005).
5.5.2 Background
Catechin is a potent bioactive antioxidant compound present in a number of
plants. Testa of cashew is a rich source of polyphenols and tannins. Testa of
cashew is a byproduct of cashew manufacturing industry and hence can serve as
an economical and low cost source for isolation of catechin. Moreover, isolation
through Preparative Thin Layer Chromatography (P-TLC) method, used in this
research work can serve as an economic and alternative method to currently
available isolation techniques (Deore, 2010 and Mahajan, 2010).
P a g e | 111
CHAPTER 5 EXPERIMENTAL
5.5.3 Procedure
A. Preparation of solutions of extracts and catechin standard
Solutions (50 mg/ml) of ethanol extract of testa were prepared in methanol and
used for isolation of catechin by thin layer chromatography. Working solution of
catechin (1mg/ml) was used for location of catechin spot from the extracts. All
solutions were prepared freshly prior to analysis.
B. Preparative Thin layer Chromatography technique
• A slurry of silica gel GF254 was prepared by addition of Silica gel GF254 in distilled
water and mixing it well to form a slurry with pourable consistency. The slurry
was poured on the glass plates while avoiding the entrapment of air bubbles and
spread to form a uniform layer of optimum thickness.
• Preparative TLC plates of optimum layer thickness were prepared. The plates
were air dried for 30 minutes and then dried in an oven at 1100 C for 30 minutes
before use.
• A concentrated band of ethanolic extract of testa (previously defatted with
hexane) was then applied at a distance of 1cm from bottom edge, by using glass
capillaries. A band of standard catechin was also applied on the same plate to
serve as a reference for detection and separation of catechin band.
• After drying of the applied bands, the plate was placed in developing chamber
pre-saturated with mobile phase for 15mins. The solvent system used for
chromatography was toluene: ethyl acetate: methanol: formic acid (6:6:1:0.1).
After the chromatographic run, the plate was air dried.
• The band which corresponded to marker catechin was scrapped out. Several plates
were prepared in similar manner and the band corresponding to catechin was
collected.
• The silica gel containing the component thus obtained was, sonicated with
methanol as solvent with minimum exposure to heat and light. The suspension
was then allowed to stand and the supernatant was collected. The supernatant was
then concentrated to 1/3rd
of its volume, filtered and evaporated to obtain crude
catechin. Crude catechin thus obtained was then recrystallised with hot water and
the yield was calculated.
P a g e | 112
CHAPTER 5 EXPERIMENTAL
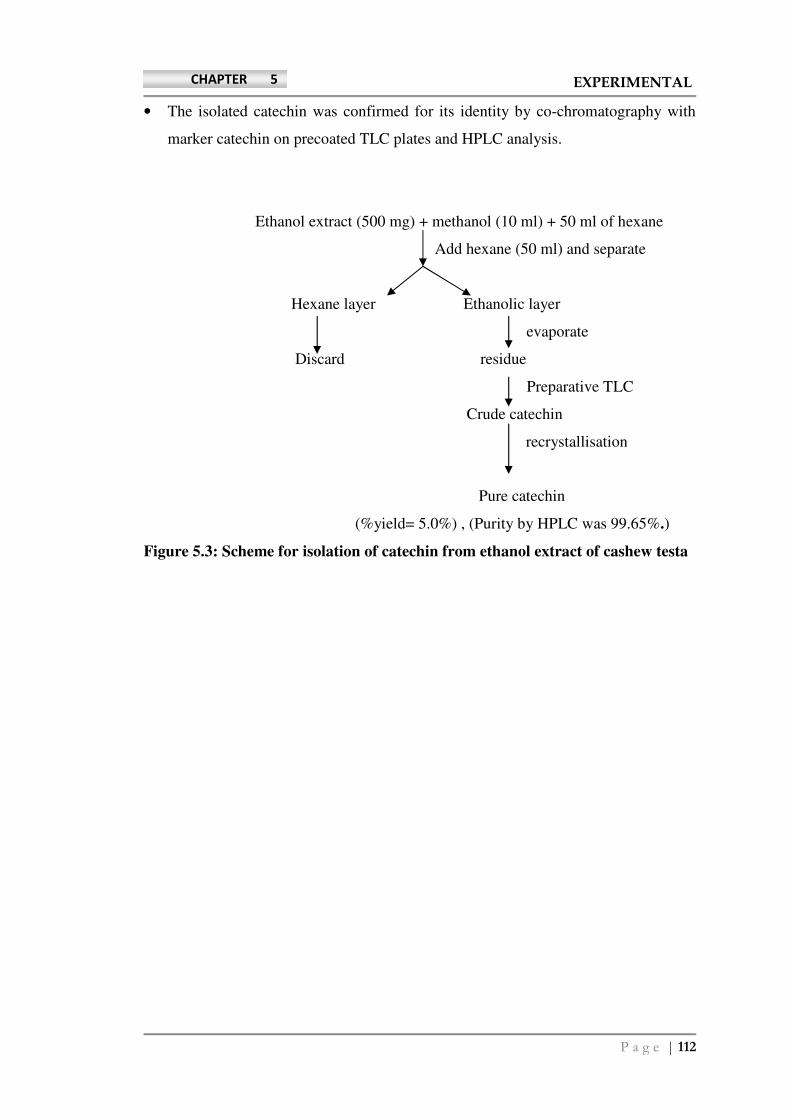
• The isolated catechin was confirmed for its identity by co-chromatography with
marker catechin on precoated TLC plates and HPLC analysis.
Ethanol extract (500 mg) + methanol (10 ml) + 50 ml of hexane
Add hexane (50 ml) and separate
Hexane layer Ethanolic layer
evaporate
Discard residue
Preparative TLC
Crude catechin
recrystallisation
Pure catechin
(%yield= 5.0%) , (Purity by HPLC was 99.65%.)
Figure 5.3: Scheme for isolation of catechin from ethanol extract of cashew testa
P a g e | 113
CHAPTER 5 EXPERIMENTAL
5.6 CHROMATOGRAPHIC STUDIES
5.6.1 Introduction
With gaining popularity of herbal remedies worldwide, the need of assuring safety
and efficacy of these products increases as well. By nature they are complex
matrices, comprising a many compounds, which are prone to variation due to
environmental factors and manufacturing conditions. Furthermore, many
traditional preparations compose of multiple herbs, so that only highly selective,
sensitive and versatile analytical techniques will be suitable for quality control
purposes. Recently, chromatographic fingerprint technique has been accepted by
WHO as a strategy for the quality assessment of herbal medicines (WHO, 2005).
Chromatographic techniques such as HPLC and HPTLC have recently gained
increasing importance due to their emphases on the characterization of the
complete sample composition (Liang, 2004). The methods developed by use of
these techniques can also be applied to determination of standard compounds as
markers, bioactive components and enhancement of herbal medicinal product
quality (Mahady, 2001).
The analysis of constituents in plants is a challenging task because of
their chemical diversity, usually low abundance and variability even within the
same species. Considering the fact that many traditional herbal preparations
contain not one but several medicinal plants, only highly selective and sensitive
methods will be suitable for controlling their composition and quality. Sensitivity
is the major issue when using various analytical techniques for detection of
phytoconstituents. Thus, most commonly chromatographic techniques in
combination with different detectors are employed for this purpose. Due to
extremely small sample volumes and the attributes mentioned above, high
performance liquid chromatography (HPLC) and high performance thin layer
chromatography (HPTLC) are still the preferred separation techniques for the
analysis of natural products (Liang, 2004).
Chromatographic methods, especially HPTLC and HPLC help in the quality
control of botanicals. Identification of phytoconstituents can be carried out by
these techniques by comparison of a sample with a reference. It is an advantage of
HPTLC that not only the entire sample can be seen but also several samples can
P a g e | 114
CHAPTER 5 EXPERIMENTAL
easily be compared at the same time. The prevailing value of HPTLC fingerprints
is the visual impression, which can be further expanded by multiple detection
(visualization of compounds prior to and after derivatization). A broad spectrum
of constituents can be detected at the same time in a single run in an experiment.
Therefore, the use of HPLC and HPTLC for the qualitative and quantitative
analysis of constituents in medicinal plants steadily has gained importance in the
last few decades (Liang, 2004).
5.6.2 Background
There have been no reports published for the HPTLC fingerprinting and HPLC
profiling of the extracts of cashew testa and leaves. Moreover performing HPTLC
and HPLC analysis helps in identifying various phytoconstituents present in the
extracts. Thus, HPTLC and HPLC methods were developed and optimised for
various extracts of leaves and testa of cashew.
5.6.3 Procedure
A. Preparation of solutions of extracts and catechin
Stock solutions (1mg/ml) of reference catechin were prepared in methanol.
Working solutions of catechin were prepared by appropriate dilutions of the stock
solution with methanol. All solutions were prepared freshly prior to analysis.
Working solutions of extracts (5mg/ml) of cashew leaves and testa were prepared
with methanol. All solutions were prepared freshly prior to analysis.
B. Development and optimization of TLC parameters
a) Preparation of TLC plates
Preparative TLC plates were prepared by pouring the silica gel GF254 slurry on the
glass plates of 10x 20 cm dimension. Prepared TLC plates were then made free of
the moisture associated with thin layers by drying the thin layer plates, for 30
minutes in air and then in an oven at 1100C for another 30 minutes. The extracts
of testa and leaves dissolved in methanol were applied in a row along one side of
chromo plate, about 1 cm from the edge, by using sealed glass capillaries.
b) Selection of mobile phase
To make a choice of suitable solvent system, initially the elutropic series of
different solvents was tried by running on the TLC plates. Neat solvents of
P a g e | 115
CHAPTER 5 EXPERIMENTAL
varying polarity and solvents in different combination ratios were used to
optimize elution of various components and a combination of solvents that gave
better resolution of maximum number of components in extracts was selected.
Formic acid was used as a modifier to affect better resolution of bands.
c) Optimization of saturation time
Various time periods from 10-25 minutes (10, 15, 20, 25 mins) were attempted to
select the optimum saturation time, suitable for maximum resolution and faster
development of the TLC plate.
d) Development of plates
The samples were applied at 1cm distance from the bottom on the TLC plates and
the solvent front was marked at 8 cm distance from the application position. The
plates were allowed to dry and then placed in chambers saturated with the solvent
system (mobile phase) for a period of 20 min prior to placement of plates. The
qualitative evaluation of the plate was done by determining the migrating behavior
of the separated substances by calculating Rf value.
e) Derivatisation/visualization of plates
Derivatising agent was selected based upon the class of phytoconstituents found in
the preliminary phytochemical screening tests. The derivatising reagent helps in
visualization as well as confirmation of the identity of the phytoconstituents.
C. High performance thin layer chromatography (HPTLC) analysis
a) Pre-conditioning of plates
Precoated HPTLC plates used for analysis were preconditioned by overnight
washing with methanol in a twin trough chamber. Preconditioning in methanol has
been shown to be effective for layer cleaning. The prewashed plates were then
heated at 1050C for 5 minutes before use.
b) Optimized chromatographic parameters
The optimized TLC conditions to be used in HPTLC analysis were as follows:
Stationary Phase: Precoated, aluminum backed HPTLC plates (20cm×20
cm, 0.2mm thickness, 5–6µm particle size.
Mobile phase: toluene:ethyl acetate:MeOH:formic acid (6:6:1:0.1v/v/v/v)
P a g e | 116
CHAPTER 5 EXPERIMENTAL
Saturation time: 15 mins.
Development distance: 80 mm
Derivatising agent: 5% alcoholic FeCl3 solution
c) HPTLC analysis
The analysis was performed in air-conditioned room maintained at 220C and 55%
humidity. TLC was performed on precoated silica gel GF254 aluminum backed
HPTLC plates (20cm×20 cm, 0.2mm thickness, 5–6µm particle size, E-Merck,
Germany). Five microlitres of the sample solutions were spotted as bands of 6mm
width by using a 100µl Hamilton syringe. The plates were developed using
toluene: ethyl acetate: methanol: formic acid (6:6:1:0.1v/v/v/v) as the solvent
system with saturation time of 15 minutes in a CAMAG twin-trough plate
development chamber. The developed plates were air dried and scanned. A
spectro-densitometer (Scanner 3, CAMAG) equipped with ‘win CATS’ planar
chromatography manager (version 1.3.0) software was used for the densitometry
measurements, spectra recording and data processing. Absorption/remission were
done in the measurement mode at a scan speed of 20mm/s. Densitograms were
recorded at the wavelength of 254 nm for catechin and various components of
extracts.
D. Development and optimization of HPLC parameters
a) Preparation of sample
The extract samples (0.1 g) were dissolved in 10mL methanol by sonication. The
resultant solutions were filtered through a 0.45 µm PVDF filter into an amber
sample vial for HPLC fingerprinting analysis. These stock solutions were further
diluted with appropriate dilutions for analysis.
b) Selection of stationary phase
The aqueous, and ethanolic extracts of cashew leaves and aqueous, ethanolic and
methanolic extracts of testa contained majority of tannins and polyphenols as their
constituents, which are polar in nature. Hence a nonpolar stationary phase would
to be required to elute the constituents. Thus, a reverse phase C18 (octadecylsilane)
column was selected for analysis.
P a g e | 117
CHAPTER 5 EXPERIMENTAL
c) Selection of mobile phase
The HPLC separation conditions, such as choice of mobile phase and
isocratic / gradient program, were further optimized. To make a choice of suitable
solvent system, initially neat solvents with relatively polar nature were tried. Then
mobile phases of solvents in different combination ratios were used to optimize
retention of various components. A number of mobile phases with different ratios
were screened in order to obtain a reliable chromatogram with most peaks at
acceptable resolution and balance for the HPLC fingerprinting and to obtain
baseline separation of catechin in a relatively short analytical time for the HPLC
quantitation.
d) Selection of detection wavelength
The choice of detection wavelength is crucial for developing a reliable fingerprint
and for accurate quantitative analysis of marker compounds in the herb.
Chromatographic detection was carried out at 254 nm, 273 mn (λ max of catechin)
and at 280nm (~λ max of catechin). Optimal signal-to-noise ratios for UV
detection was obtained at 254 nm with a good resolution for maximum number of
peaks. Hence, the optimal detection wavelength in the HPLC analysis was
determined to be 254 nm. At this wavelength, more characteristic peaks in the
chromatogram were observed, with a good resolution for catechin that was used as
a marker (Fracassetti, 2011).
E. HPLC analysis
The HPLC profiling was carried out on a C18 column (Phenomenex C18,
4.6mm×250 mm, 5µm) equipped with an extended guard column at ambient
temperature with a sample injection volume of 10µL. An isocratic elution was
carried out with methanol:water (90:10 v/v). Flow rate was 1ml/min flow rate.
The fingerprint chromatograms were recorded at a wavelength of 254 nm.
The optimized parameters for HPLC analysis were:
Solvent system: methanol:water (90:10 v/v)
Flow rate: 1ml/min
Column: C18 column (Phenomenex)
Detection wavelength: 254 nm
P a g e | 118
CHAPTER 5 EXPERIMENTAL
F. Calibration curve of catechin
Standard stock solutions were prepared by dissolving the reference standard in
methanol to obtain a concentration of 1mg/mL for catechin. The concentrations of
catechin reference standard used for calibration were in the range 0.3 – 1.4µg/µL
in methanol, respectively. The peak in HPLC chromatograms were identified by
comparing the retention times in the chromatograms of extracts with those of
reference standard catechin peak.
G. Limit of detection (LOD) and limit of quantitation (LOQ)
The LOD and LOQ were determined as signal to noise ratio using the equations
LOD= 3.3 σ/S and LOQ=10 σ/S where, σ is standard deviation of response and S
is the slope of calibration curve. The LOD and LOQ were 0.1 and 0.3 µg
respectively for catechin.
H. Quantitation of catechin in various extracts by HPTLC analysis
The extracts were dissolved in methanol and the solution of concentration 5µg/µL
was filtered through 0.45 µm PVDF filter and HPTLC was performed under the
conditions optimized for the reference compound. The plates were scanned at 254
nm and the UV–vis spectra of the bands corresponding to catechin were recorded.
The amount of catechin in the extracts was quantified by comparison with
catechin bands from solutions of known concentration. After scanning at 254 nm,
the plates were dipped in 5% alcoholic FeCl3 solution for 5 s and then kept at
1000C for 5 min for visualization of tannins and polyphenols. Bluish black colored
bands indicate the presence of tannins and polyphenols.
I. Quantitation of catechin in various extracts by HPLC
Standard stock solutions were prepared by dissolving the reference standard in
methanol to obtain a concentration of 1µg/µL for catechin. The concentrations of
catechin reference standards used for calibration were 0.6, 0.7, 0.8, 0.9, 1.0 µg/µL,
respectively. The peaks in HPLC chromatograms were identified by comparing
the retention times in the chromatograms of extracts with those of reference
standard catechin peak.
P a g e | 119
CHAPTER 5 EXPERIMENTAL
5.7 EFFECT OF VARIOUS DRYING METHODS ON THE POLYPHENOL
CONTENT AND ANTIOXIDANT ACTIVITY OF CASHEW LEAVES
5.7.1 Introduction
The leaves of plants are often dried before extraction to reduce moisture content.
Dehydration of herbs can be performed using different methods. The most popular
method is convective drying. Extraction yields of phenolics from plant tissues
depend on the various extraction conditions like pH and temperature. The method
of drying usually has a significant effect on the quality and quantity of the
phytoconstituents from such plants (Yag, 1999).
5.7.2 Background
In recent years, the drying behaviors of different plants and culinary herbs have
been studied by many investigators. However, studies on the drying characteristics
of cashew leaves are not found in the literature, particularly the traditional sun
drying properties as well as microwave drying properties of plants are not
adequately investigated. The aim of the work was to determine the sun, oven and
microwave drying characteristics of cashew leaves and to compare traditional sun
drying and conventional oven drying methods to the microwave drying method,
which reduces drying time considerably, and to determine the effects of these
different drying techniques on total phenolic content.
5.7.3 Procedure
• Fresh leaves of cashew were exposed to various drying conditions viz. sun drying,
shade drying, oven drying, and their aqueous extracts were prepared.
• The various conditions of drying are detailed as below:
A. Oven drying: The fresh green mature leaves of cashew were collected, cleaned,
washed and dried. The drying of the leaves was carried out in a Hot air oven at
800 C for about 30 minutes until dry.
B. Sun drying: The naturally dried, shredded mature leaves of cashew were
collected, cleansed and used for extraction.
P a g e | 120
CHAPTER 5 EXPERIMENTAL
C. Shade drying: The fresh mature green leaves of cashew were collected and
cleansed. The leaves were dried in shade for 8-10 days until dry and were then
powdered and used for extraction.
D. Fresh leaves: The mature green leaves of cashew were collected, cleansed and
used for extraction without drying.
• The leaves obtained from various drying conditions were then powdered to coarse
size and extracted with water as solvent at 400 C for 3 hours. The mass was then
filtered and the filtrate was concentrated and extractive yield was calculated.
• The total polyphenol content in the extracts were determined by Folin - Ciocalteu
method and the antioxidant activity was determined by DPPH. radical scavenging
assay and Greiss assay. The procedure for the determination of total phenolic
content and antioxidant assays is detailed in subsequent chapters (Giustarini,
2008; Etsuo, 2010 and Vernon, 1999)
P a g e | 121
CHAPTER 5 EXPERIMENTAL
5.8 EVALUATION OF ANTIOXIDANT ACTIVITY
5.8.1 Introduction
Aerobic organisms produce a number of reactive free radicals (molecules or atoms
having unpaired electrons) continuously in cells during respiration, metabolism
and phagocytosis. It has been found that fruits and vegetables, rich in
antioxidants, decrease the risk of oxidative stress. A number of herbal
formulations used in traditional Indian medicines are also some of the potent
antioxidants which need to be explored. The approach to the development of
antioxidants has in general been based on macroscopic biochemical changes by
both in vitro and in vivo studies and from such studies several phytochemicals
have been reported as potent antioxidants (Bisby, 1993; Tatke, 2011).
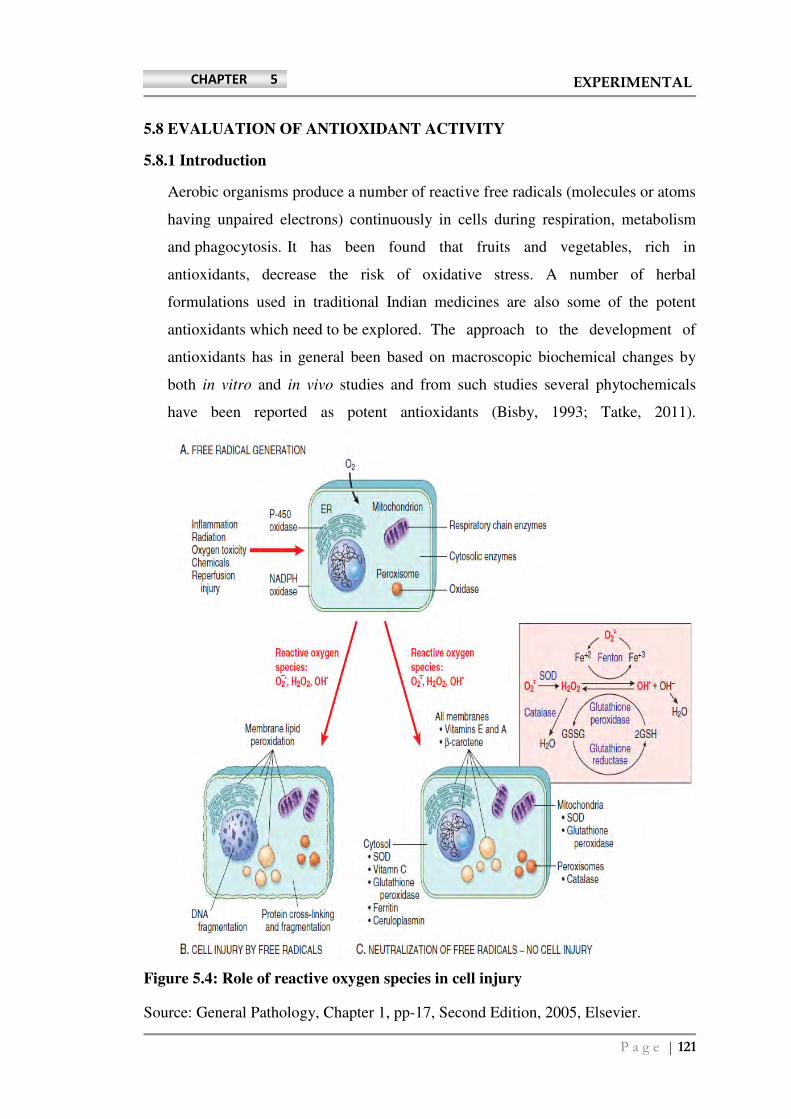
Figure 5.4: Role of reactive oxygen species in cell injury
Source: General Pathology, Chapter 1, pp-17, Second Edition, 2005, Elsevier.
P a g e | 122
CHAPTER 5 EXPERIMENTAL
The effects of these reactive species are wide-ranging, but following three
reactions are particularly relevant to cell injury:
• Lipid peroxidation of membranes: Free radicals in the presence of oxygen may
cause peroxidation of lipids within plasma and organellar membranes. Oxidative
damage is initiated when the double bonds in unsaturated fatty acids of membrane
lipids are attacked by oxygen-derived free radicals, particularly by OH. The lipid–
free radical interactions yield peroxides, which are themselves unstable and
reactive, and an autocatalytic chain reaction continues (called propagation), which
can result in extensive membrane, organellar, and cellular damage.
• Oxidative modification of proteins: Free radicals promote oxidation of amino
acid residue side chains, formation of protein-protein cross-linkages (e.g.,
disulfide bonds), and oxidation of the protein backbone, resulting in protein
fragmentation.
• Lesions in DNA: Reactions with thymine in nuclear and mitochondrial DNA
produce single-stranded breaks in DNA. This DNA damage has been implicated
in cell aging and in malignant transformation of cells.
Cells have developed multiple mechanisms to remove free radicals and thereby
minimize injury: A series of enzymes acts as free radical–scavenging systems and
break down hydrogen peroxide and superoxide anion. These enzymes are located
near the sites of generation of these oxidants and include the following:
• Catalase, present in peroxisomes, which decomposes as given below:
H2O2 (2 H2O2 O2 + 2 H2O )
• Superoxide dismutases are found in many cell types and convert superoxide to
H2O2 (2 O2- + 2 H H2O2 + O2). This group includes both manganese
superoxide dismutase, which is localized in mitochondria, and copper-zinc–
superoxide dismutase, which is found in the cytosol.
• Glutathione peroxidase also protects against injury by catalyzing free radical
breakdown (H2O2 + 2 GSH GSSG [glutathione homodimer] + 2 H2O, or
2 OH + 2 GSH GSSG + 2 H2O).
The intracellular ratio of oxidized glutathione (GSSG) to reduced glutathione
(GSH) is a reflection of the oxidative state of the cell and is an important aspect of
the cell’s ability to detoxify reactive oxygen species.
P a g e | 123
CHAPTER 5 EXPERIMENTAL
5.8.2 Assessment of Free Radical Scavenging Capacity in vitro
The free radical scavenging capacity of antioxidant in vitro has been evaluated by
several different methods under different conditions. The “antioxidant capacity”
often means different things at different occasions and to different people.
Recently, the capacity of antioxidants for scavenging free radicals has been
assessed more often and widely by either the reaction with stable reference radical
or by competition methods using conventional UV-Visible absorption
spectrophotometer. It is difficult to prove but the mechanisms and dynamics of
antioxidant action found in vitro may be applied to biological systems if the
factors which affect them are properly considered (Etsuo, 2010).
A. DPPH (1, 1, diphenyl 2-picryl hydrazyl) Assay
a) Principle:
The capacity of antioxidant compounds for scavenging free radicals should be
assessed by two factors, that is, rate of scavenging radicals and number of radicals
each antioxidant molecule can scavenge, which are determined inherently by the
chemical structure of the antioxidant compound and also the free radicals. These
two parameters can be measured by following the reaction with stable reference
free radical such as 2,2-diphenyl-1-picrylhydrazyl (DPPH) ((Brand, 1995).
Many antioxidants react with DPPH by hydrogen atom transfer (Reaction 1) or
electron transfer, followed by proton transfer (Reaction 2), depending on the
antioxidant, radical, and also reaction environment. The reaction of antioxidants
with DPPH is followed from a decrease in their absorption at 520 nm. The relative
reactivity and stoichiometric number can be assessed easily from a rate of
decrease in absorption induced by the antioxidants or mixtures.
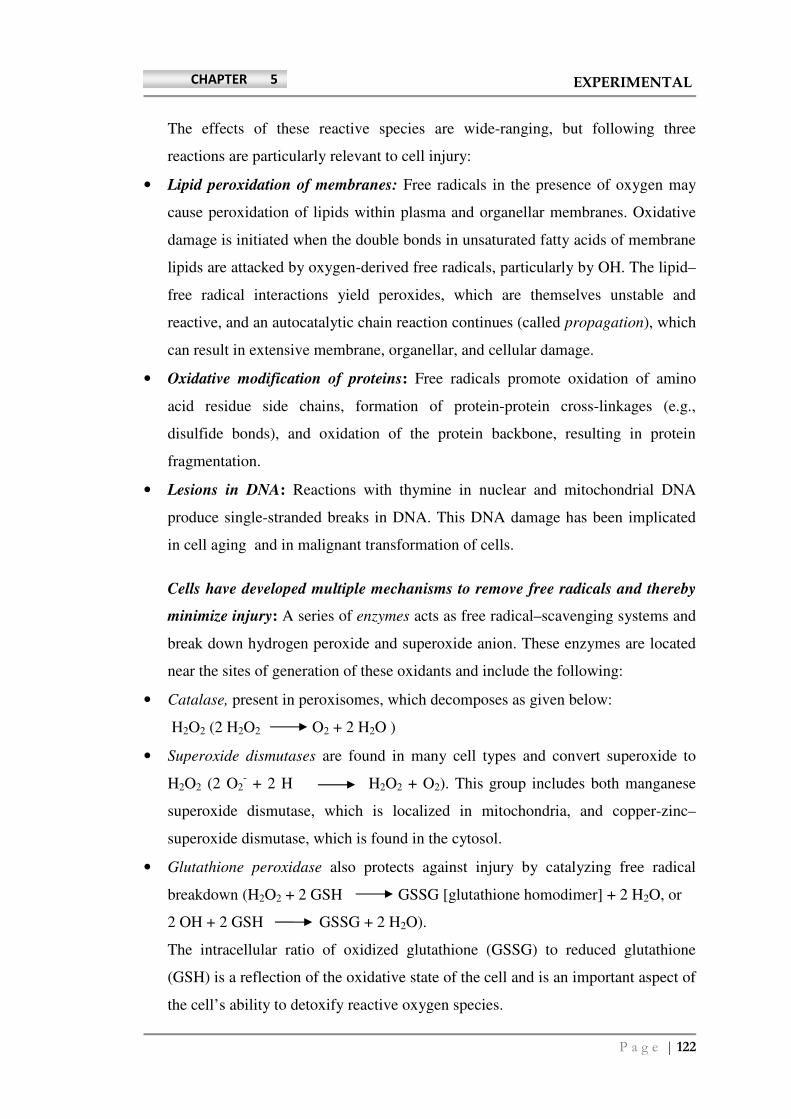
X· + IH XH + I· (Reaction - 1)
X· + IH X- + IH
.+ XH + I· (Reaction - 2)
Where, Free radical scavenging antioxidants - (IH)
Active free radicals - (X·)
Stable compound - (XH)
Antioxidant-derived radical (I·)
P a g e | 124
CHAPTER 5 EXPERIMENTAL
This is probably the simplest way to assess the relative capacity for scavenging
radicals. However, this assay may not be used when the test compounds have
absorption overlapping that of DPPH. The hydrogen atoms or electron-donating
ability of the extracts was determined from the bleaching of purple-colored
methanol solution of DPPH. This activity is given as percent DPPH radical
scavenging, which is calculated with the equation:
% DPPH radical scavenging = (Control Absorbance - Sample Absorbance) × 100
----------------------------------------------------
Control Absorbance
b) Procedure
• Radical scavenging activity of the testa and leaf extracts was evaluated using
DPPH.(1,1-diphenyl-2-picrylhydrazyl) method.
• Varying volumes of 0.2 mg/mL the extracts of testa and leaves of cashew were
added to 200 µL of (0.36 mg/mL concentration) DPPH. solution in methanol. A
series of concentrations ranging from 2 to 16 µg of dried extracts were tested.
• The mixtures were shaken vigorously and incubated in the dark for 30 min after
which the reduction of DPPH. absorption was measured at 517 nm.
• Percent inhibition by sample treatment was determined by comparison with the
methanol-treated control group. The IC50 values denote the concentration of each
sample required to give 50% of the optical density shown by the control, using a
non-linear regression analysis. All test analyses were run in triplicate and average
values were reported. Ascorbic acid was used as positive control.
P a g e | 125
CHAPTER 5 EXPERIMENTAL
B. Nitric Oxide Scavenging Activity
a) Principle
NO is very unstable in biological systems and has a physiological half life of only
1–40 s. A colorimetric simple and accurate method for measuring total NO
species is known as the Griess assay. This assay is based on reducing NO species
to nitrite and then detecting the nitrite. The Griess assay can be used for most
biological systems, including organs, tissues, cells, and subcellular compartments.
The Griess assay detects the red–pink color produced by the reaction of Griess
reagent with nitrites. Therefore, all nitrates in the sample should be reduced to
nitrite to be detected in this assay. After reduction to nitrite, samples are reacted
with the Griess reagent consisting of equal volumes of sulfanilamide solution and
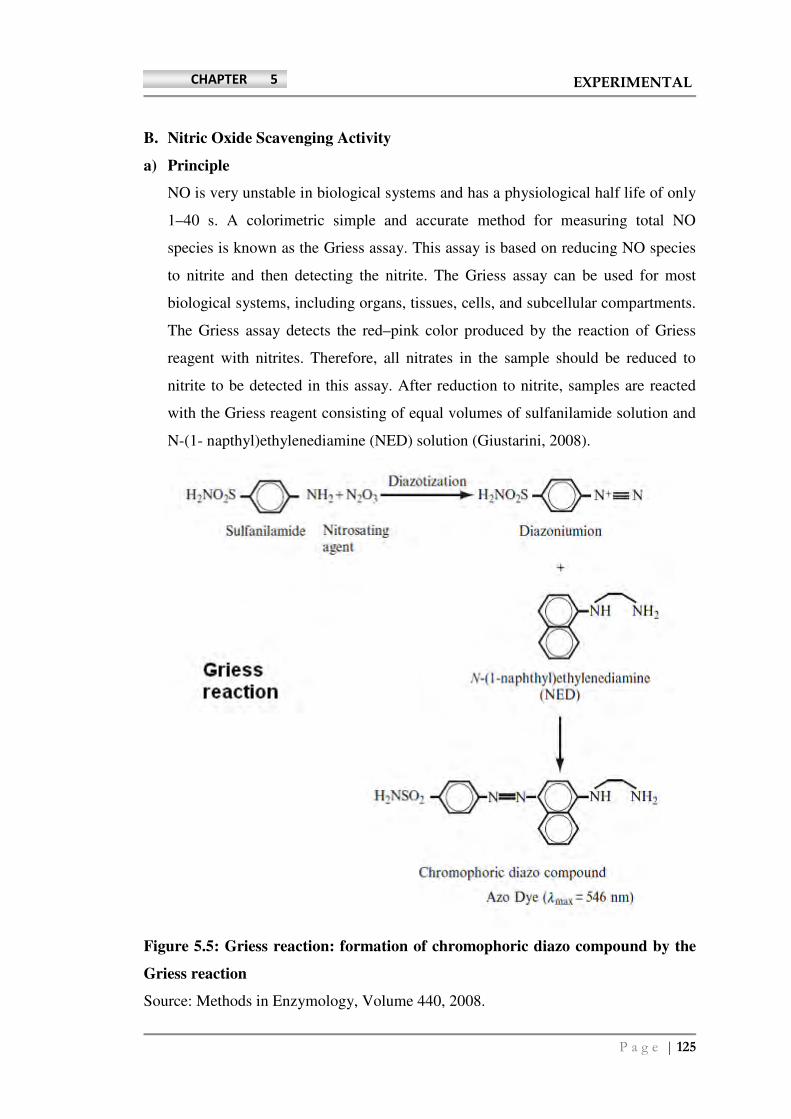
N-(1- napthyl)ethylenediamine (NED) solution (Giustarini, 2008).
Figure 5.5: Griess reaction: formation of chromophoric diazo compound by the
Griess reaction
Source: Methods in Enzymology, Volume 440, 2008.
P a g e | 126
CHAPTER 5 EXPERIMENTAL
b) Procedure
• Nitric oxide scavenging activity of testa and leaf extracts of cashew was evaluated
through Griess Assay method.
• Griess reagent was prepared by mixing equal volumes of reagents (a) and (b).
Reagent (a) is 1% sulfanilamide in 5% phosphoric acid , prepared by adding 3.5
mL of 85% H3PO4 to 100 mL with distilled water and then dissolving 1.0 g of
sulfanilamide.
Reagent (b) is 0.1% N-1-naphthylethylenediamine dihydrochloride, prepared by
dissolving 100 mg of NEDD in 100 mL of distilled water.
• Accurately 2.0 mL of 10 mM sodium nitroprusside and 5.0 mL of phosphate
buffer (pH 6.5) were mixed with 0.5 mL of different concentrations of the plant
extracts and incubated at 250C for 150 min.
• The samples were run as above but the blank was replaced with the same amount
of water. After the incubation period, 2mL of the above incubated solution was
added to 2 mL of Griess reagent and incubated at room temperature for 30 min.
• The absorbance of the chromophore formed was read at 540 nm. Ascorbic acid
was used as positive control and results were expressed as percentage inhibition of
nitric oxide. All determinations were performed in triplicates.
P a g e | 127
CHAPTER 5 EXPERIMENTAL
5.8.3 Determination of Antioxidant Capacity against Lipid Peroxidation
A. Thiobarbituric acid Reacting substances (TBARS) test
a) Introduction
The capacity of antioxidant for inhibition of lipid peroxidation can be assessed by
measuring the extent of suppression of lipid peroxidation by the test antioxidant.
Many oxidizable substrates have been used in thiobarbituric acid-reactive
substances (TBARS) determination, including free fatty acids, LDL and fluids
(urine, serum) from cells or tissues.
b) Principle
Malondialdehyde formed from the breakdown of polyunsaturated fatty acid reacts
with thiobarbituric acid to form thiobarbituric acid reacting substance (TBARS),
the end product of lipid peroxidation, a pink to red colour trymethionine complex
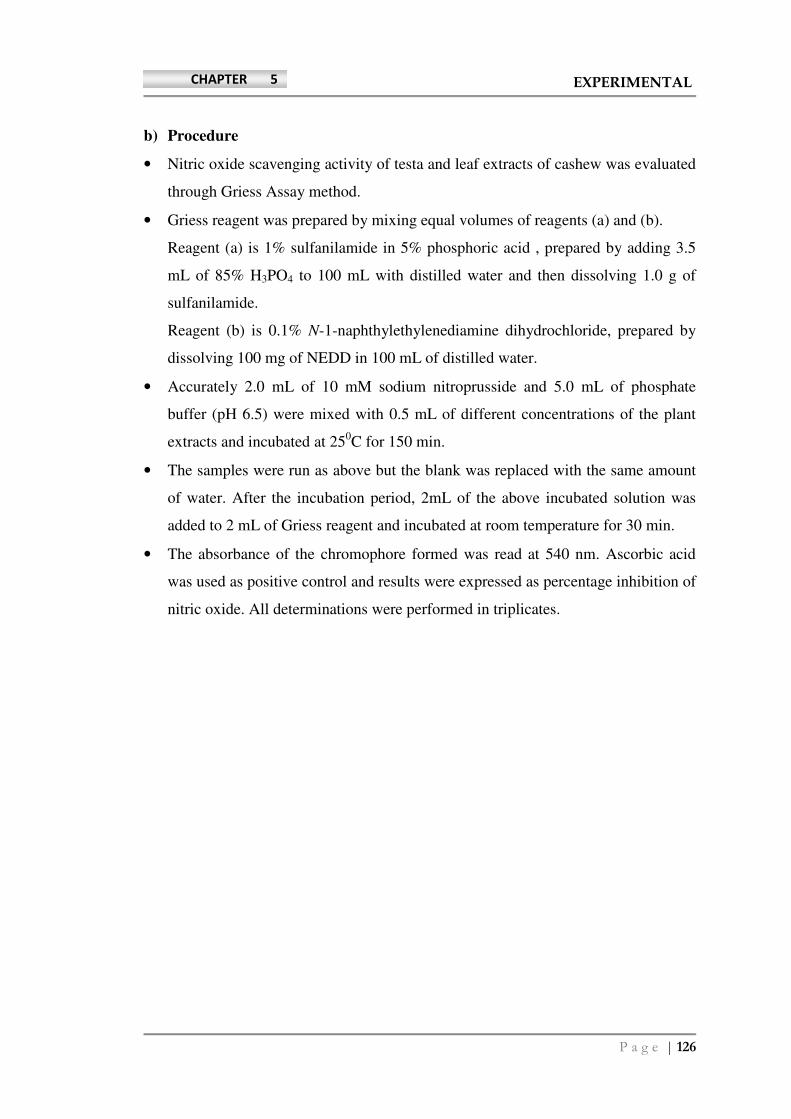
exhibiting an absorption maximum at 530-535 nm species (Laguerre, 2007).
Figure 5.6: Formation of TBA Chromophore
Source: Progress in Lipid Research, 46, 2007.
P a g e | 128
CHAPTER 5 EXPERIMENTAL
c) Procedure
• Preparation of tissue homogenate: Mice (previously fasted overnight) were fixed
on the operation table with ventral side up and then dissected. Liver was perfused
with normal saline through hepatic portal vein. Liver was harvested and its lobes
were briefly dried between filter papers (to remove excess of blood) and were cut
thin with a heavy-duty blade. These small pieces were then transferred to the glass
Teflon homogenizing tube and the homogenate (1 g, w/v) was prepared in
phosphate buffer saline (pH 7.4) in cold condition. It was centrifuged at 2000g, for
10 min. Supernatant was collected and finally suspended in PBS to contain
approximately 0.8-1.5 mg protein in 0.1 ml of suspension to perform the in vitro
experiment.
• An incubation mixture containing 1 ml potassium chloride (150mM), 0.3 ml of
10% liver homogenate as lipid source and various concentration of test compound
(extracts of testa and leaves of cashew) in a volume of 0.5 ml.
• Peroxidation was initiated by adding 0.1 ml FeSO4. After incubating for 20
minutes of 37°C, reaction was stopped by adding 1 ml Trichloroacetic acid(TCA)
in 50 % acetic acid , followed by heating at for 30 mins in a boiling water bath,
cooled, centrifuged at 1000 rpm for 10 minutes and absorbance of the supernatant
liquid was recorded at 535 nm.
• The percentage of anti-lipid peroxidation effect (% ALP) or % inhibition was
calculated.
P a g e | 129
CHAPTER 5 EXPERIMENTAL
5.8.4 Determination of Total Phenolic Content by Folin - Ciocalteu reagent
method
a) Introduction
Phenols occurring in nature and the environment are of interest from many
viewpoints (antioxidants, astringency, bitterness, browning reactions, color,
oxidation substrates, protein constituents, etc.). Phenols are responsible for the
majority of the oxygen capacity in most plant-derived products, such as wine. An
antioxidant effect can be from competitive consumption of the oxidant, thus
sparing the target molecules being protected, and from quenching the chain
reaction propagating free radical oxidation. Antioxidants become oxidized as they
interfere with the oxidation of lipids and other species. Free radicals are very
reactive molecules with an unpaired electron. Encountering another free radical
from any source the two combine to form a new covalent bond, terminating any
chain reaction caused by extraction by the free radical of an electron from an
intact molecule to generate another free radical. The unpaired electron in a
semiquinone can resonate among the former hydroxyl and the positions ortho and
para to it (two, four, or six of the ring). A mixture of dimerized products results as
the new bonds form. If the new bond is to one of the ring carbons, the phenolate is
regenerated. Oxidation may then not only be repeated, but the regenerated phenol
is often oxidized more easily than the original one. If the important property of
oxidizability is to be the basis for the quantitation of phenols, the reaction must be
brought quickly to a conclusion to minimize such regenerative polymerization.
That the phenolate ion is important is shown by the fact that the uptake of oxygen
by phenols can be rapidly complete near or above the pK of the phenol (usually
about pH 10). Reaction at alkaline pH is indicated for assay purposes (Vernon,
1999).
b) Principle
The Folin-Ciocalteu reagent (FCR) or Folin's phenol reagent or Folin-Denis
reagent, also called the Gallic Acid Equivalence method (GAE), is a mixture
of phosphomolybdate and phosphotungstate used for the colorimetric assay of
phenolic and polyphenolic antioxidants. It works by measuring the amount of the
substance being tested needed to inhibit the oxidation of the reagent.
P a g e | 130
CHAPTER 5 EXPERIMENTAL
However, this reagent does not only measure total phenols and will react with any
reducing substance. The reagent therefore measures the total reducing capacity of
a sample, not just the level of phenolic compounds. Copper complexation
increases the reactivity of phenols towards this reagent.
Folin-Ciocalteu’s phenol reagent reacts with phenols and nonphenolic reducing
substances to form chromogens that can be detected spectrophotometrically. The
color development is due to the transfer of electrons at basic pH to reduce the
phosphomolybdic/phosphotungstic acid complexes to form chromogens in which
the metals have lower valence (Vernon, 1999).
b) Procedure
• Total phenolic content of extracts of leaves and testa was determined by Folin-
Ciocalteu reagent test.
• The reaction mixture was composed of 0.1 mL of extract, 7.9 mL of distilled
water, 0.2 mL of the Folin-Ciocalteu’s reagent, and 1.5 mL of 20% sodium
carbonate.
• The resultant solution was mixed and allowed to stand for 2 hours, the absorbance
was measured at 765 nm in a Shimadzu UV- Spectrophotometer.
• The total phenolic content was determined as gallic acid equivalents (GAE)/mg of
extract.
P a g e | 131
CHAPTER 5 EXPERIMENTAL
5.8.5 Cellular defense mechanisms against oxidative stress
a) Introduction
Cultured cells have often been used as a substrate to elucidate the underlying
mechanisms of oxidative stress and also to evaluate the protective effects of
antioxidants against various oxidative stressors. The advantage of using cultured
cells is that various different stressors and cell types including model systems for
some specific disease can be used for evaluation of the antioxidant effects. The
effects of antioxidants have been measured against oxidative stress in cultured
cells for the suppression of ROS formation, oxidation of lipids, proteins and
DNA, and cell death.
b) The Nrf2-antioxidant response element signaling pathway and its activation
by oxidative stress
A major mechanism in the cellular defense against oxidative or electrophilic stress
is activation of the NF-E2-related transcription factor 2 (Nrf2) - antioxidant
response element signaling pathway, which controls the expression of genes
whose protein products are involved in the detoxication and elimination of
reactive oxidants and electrophilic agents through conjugative reactions and by
enhancing cellular antioxidant capacity. It is well established that Nrf2 activity is
controlled, in part, by the cytosolic protein Keap1, but the nature of this pathway
and the mechanisms by which Keap1 acts to repress Nrf2 activity remain to be
fully characterized (Kaspar, 2009). Nrf2 is a nuclear transcription factor that
controls the expression and coordinated induction of a battery of defensive genes
encoding detoxifying enzymes and antioxidant proteins.
c) Antioxidant-response element and Nrf2
Promoter analysis identified a cis-acting enhancer sequence designated as the
antioxidant-response element (ARE), which controls the basal and inducible
expression of antioxidant genes in response to xenobiotics, antioxidants, and UV
light. Nrf2 binds to the ARE and regulates ARE mediated antioxidant enzyme
gene expression and induction in response to a variety of stimuli. The importance
of this transcription factor in upregulating ARE-mediated gene expression has
been demonstrated by several in vivo and in vitro studies and results indicate that
Nrf2 is an important activator of phase II antioxidant genes (Kaspar, 2009).
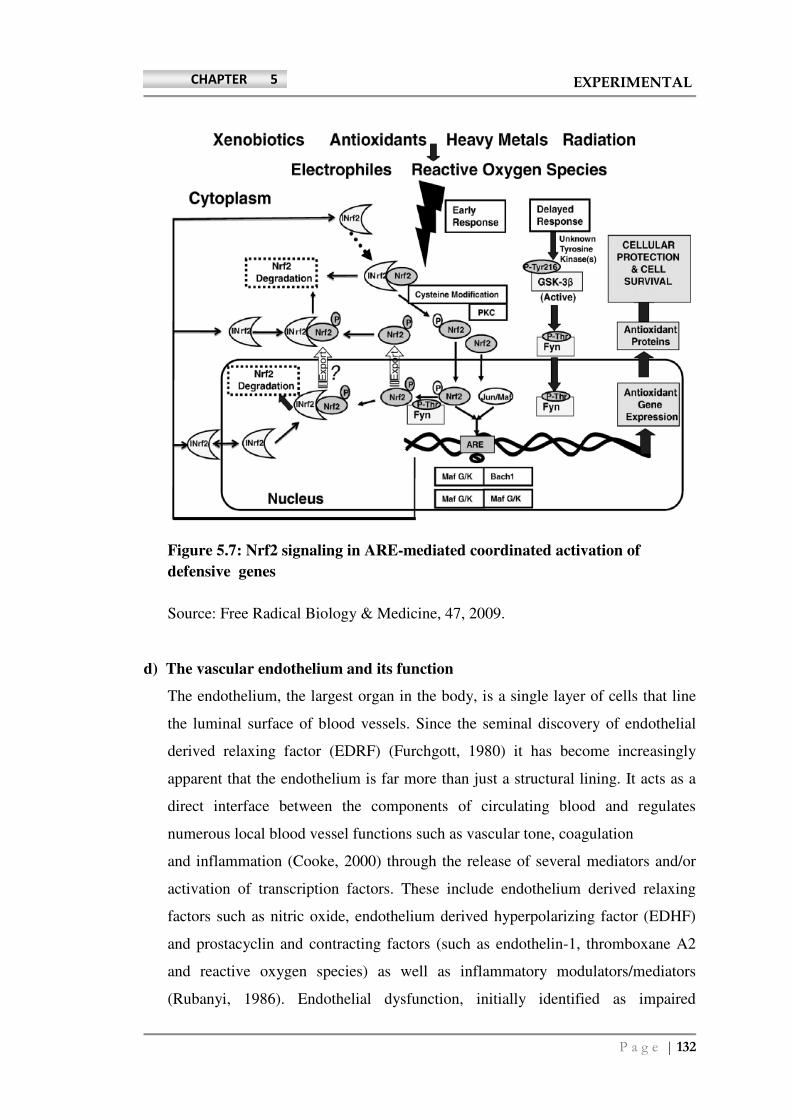
P a g e | 132
CHAPTER 5 EXPERIMENTAL
Figure 5.7: Nrf2 signaling in ARE-mediated coordinated activation of
defensive genes
Source: Free Radical Biology & Medicine, 47, 2009.
d) The vascular endothelium and its function
The endothelium, the largest organ in the body, is a single layer of cells that line
the luminal surface of blood vessels. Since the seminal discovery of endothelial
derived relaxing factor (EDRF) (Furchgott, 1980) it has become increasingly
apparent that the endothelium is far more than just a structural lining. It acts as a
direct interface between the components of circulating blood and regulates
numerous local blood vessel functions such as vascular tone, coagulation
and inflammation (Cooke, 2000) through the release of several mediators and/or
activation of transcription factors. These include endothelium derived relaxing
factors such as nitric oxide, endothelium derived hyperpolarizing factor (EDHF)
and prostacyclin and contracting factors (such as endothelin-1, thromboxane A2
and reactive oxygen species) as well as inflammatory modulators/mediators
(Rubanyi, 1986). Endothelial dysfunction, initially identified as impaired
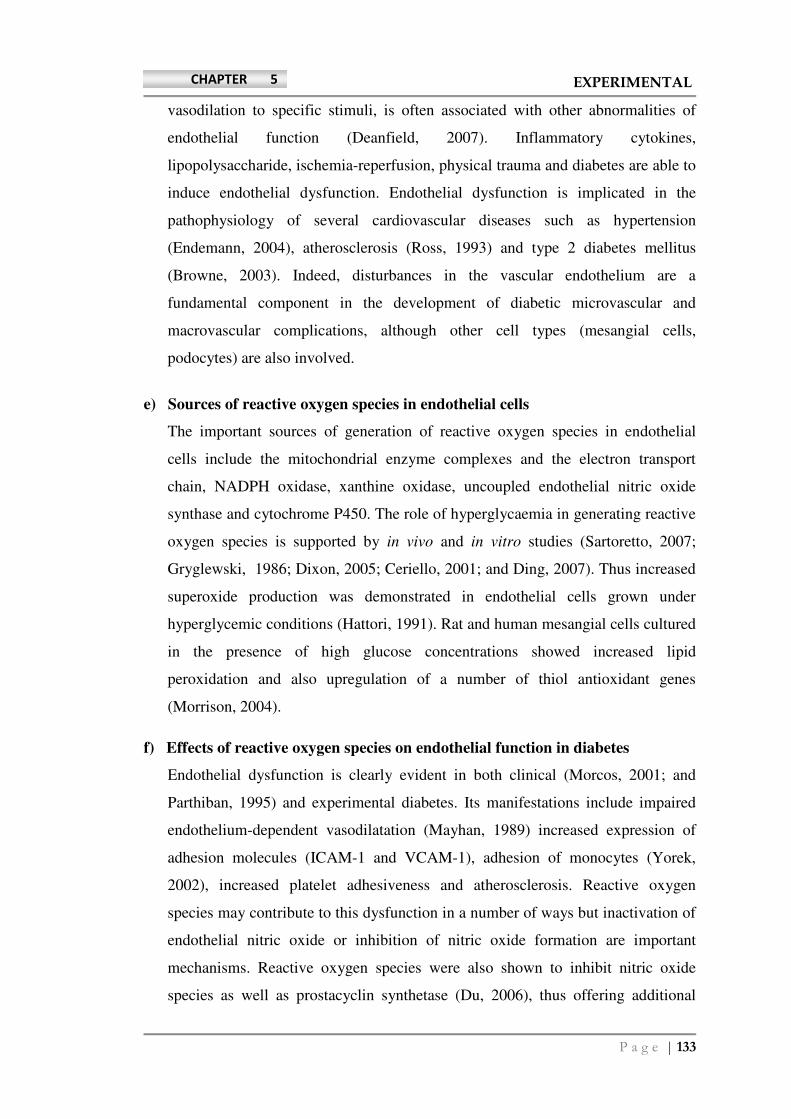
P a g e | 133
CHAPTER 5 EXPERIMENTAL
vasodilation to specific stimuli, is often associated with other abnormalities of
endothelial function (Deanfield, 2007). Inflammatory cytokines,
lipopolysaccharide, ischemia-reperfusion, physical trauma and diabetes are able to
induce endothelial dysfunction. Endothelial dysfunction is implicated in the
pathophysiology of several cardiovascular diseases such as hypertension
(Endemann, 2004), atherosclerosis (Ross, 1993) and type 2 diabetes mellitus
(Browne, 2003). Indeed, disturbances in the vascular endothelium are a
fundamental component in the development of diabetic microvascular and
macrovascular complications, although other cell types (mesangial cells,
podocytes) are also involved.
e) Sources of reactive oxygen species in endothelial cells
The important sources of generation of reactive oxygen species in endothelial
cells include the mitochondrial enzyme complexes and the electron transport
chain, NADPH oxidase, xanthine oxidase, uncoupled endothelial nitric oxide
synthase and cytochrome P450. The role of hyperglycaemia in generating reactive
oxygen species is supported by in vivo and in vitro studies (Sartoretto, 2007;
Gryglewski, 1986; Dixon, 2005; Ceriello, 2001; and Ding, 2007). Thus increased
superoxide production was demonstrated in endothelial cells grown under
hyperglycemic conditions (Hattori, 1991). Rat and human mesangial cells cultured
in the presence of high glucose concentrations showed increased lipid
peroxidation and also upregulation of a number of thiol antioxidant genes
(Morrison, 2004).
f) Effects of reactive oxygen species on endothelial function in diabetes
Endothelial dysfunction is clearly evident in both clinical (Morcos, 2001; and
Parthiban, 1995) and experimental diabetes. Its manifestations include impaired
endothelium-dependent vasodilatation (Mayhan, 1989) increased expression of
adhesion molecules (ICAM-1 and VCAM-1), adhesion of monocytes (Yorek,
2002), increased platelet adhesiveness and atherosclerosis. Reactive oxygen
species may contribute to this dysfunction in a number of ways but inactivation of
endothelial nitric oxide or inhibition of nitric oxide formation are important
mechanisms. Reactive oxygen species were also shown to inhibit nitric oxide
species as well as prostacyclin synthetase (Du, 2006), thus offering additional
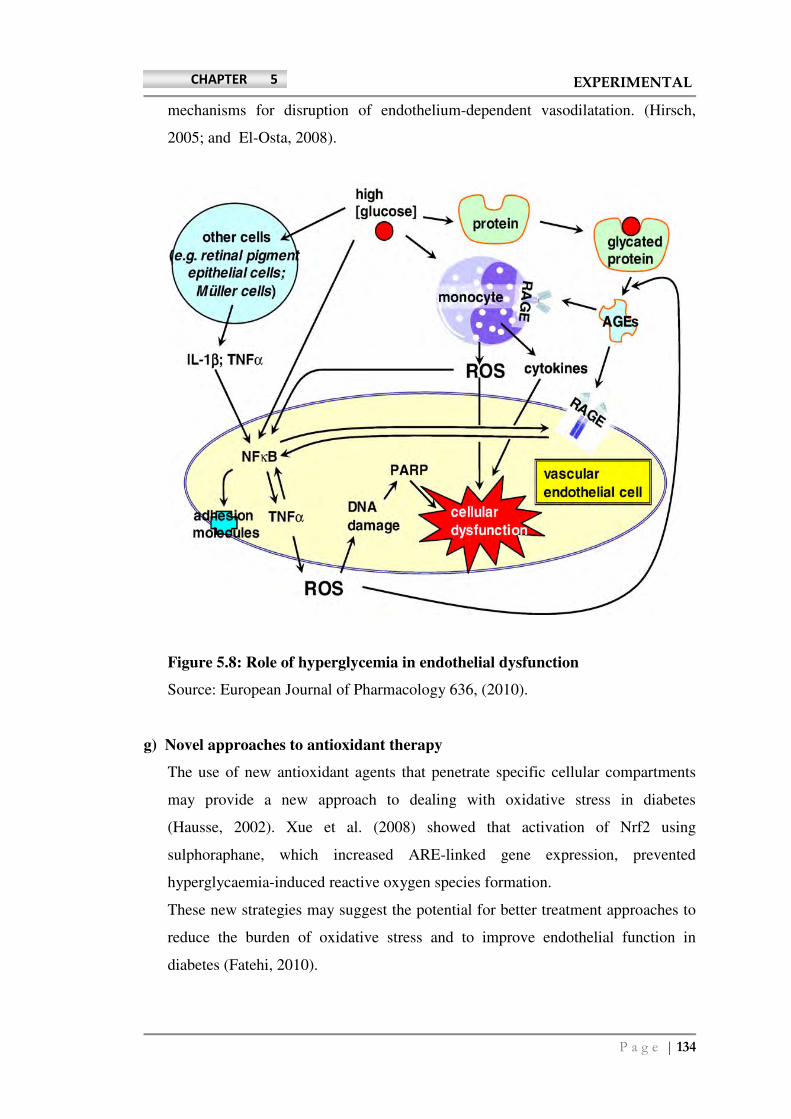
P a g e | 134
CHAPTER 5 EXPERIMENTAL
mechanisms for disruption of endothelium-dependent vasodilatation. (Hirsch,
2005; and El-Osta, 2008).
Figure 5.8: Role of hyperglycemia in endothelial dysfunction
Source: European Journal of Pharmacology 636, (2010).
g) Novel approaches to antioxidant therapy
The use of new antioxidant agents that penetrate specific cellular compartments
may provide a new approach to dealing with oxidative stress in diabetes
(Hausse, 2002). Xue et al. (2008) showed that activation of Nrf2 using
sulphoraphane, which increased ARE-linked gene expression, prevented
hyperglycaemia-induced reactive oxygen species formation.
These new strategies may suggest the potential for better treatment approaches to
reduce the burden of oxidative stress and to improve endothelial function in
diabetes (Fatehi, 2010).
P a g e | 135
CHAPTER 5 EXPERIMENTAL
h) Hydrogen peroxide in regulating cellular signals
Most biological sources of hydrogen peroxide involve the spontaneous or catalytic
breakdown of superoxide anions (O2-), produced by the partial reduction of
oxygen during aerobic respiration and following the exposure of cells to a variety
of physical, chemical, and biological agents. Increased levels of hydrogen
peroxide in cells can result in oxidative stress and cause cellular damage. Indeed,
such damage is associated with the initiation and progression of many diseases,
including neurodegenerative disorders, diabetes, atherosclerosis, and cancer.
However, studies in higher eukaryotes have revealed that hydrogen peroxide is
also used as a signaling molecule to regulate many different cellular processes.
The association of oxidative stress with disease and the aging process has led to
great interest in utilizing antioxidants to protect against oxidative stress induced
damage. This should be taken into consideration in the design of future strategies
to treat and prevent oxidative stress-associated cell damage and disease.
P a g e | 136
CHAPTER 5 EXPERIMENTAL
5.8.6 Effect of Cashew Extracts and Fractions on The Antioxidant Defense of
Cultured Endothelial Cells.
A. Background of the studies on HMEC Cells
Much evidence in literature suggests that oxidative stress represents a major
pathogenic mechanism underlying the development and the progression of
cardiovascular diseases. Hypertension, diabetes, hypercholesterolemia and
smoking are all independent risk factors for cardiovascular disease. In both
physiologic and pathophysiologic conditions, endothelial cells, vascular smooth
muscle cells, and monocytes/macrophages are subjected to a close interplay of
oxidant and antioxidant influences (Gomez, 2001). Keap1 has been identified as a
cytosolic binding protein for Nrf2 (Nguyen, 2004). Different countries have
distinct herbal traditions, each with their indigenous plants and unique practices.
Herbs contain compounds with remarkable properties that make them potentially
powerful medicines (Balogun, 2003; Lee, 2003; Na, 2008; and Kensler, 2000).
B. Aims and objectives
To study the effect of bioactive plant extracts on the antioxidant defence of
cultured endothelial cells, specifically, the intracellular mechanism that is
governed by Nrf2. Several compounds, including known Nrf2 activators,
bioactive extracts, of leaves and testa of cashew, phenolic fractions and catechin
were tested for their potential to reduce hydrogen peroxide-induced oxidative
stress and its detrimental effects.
P a g e | 137
CHAPTER 5 EXPERIMENTAL
C. ROS Assay:
a) Principle
The cell-permeant 2',7'-dichlorodihydrofluorescein diacetate (H2DCFDA), also
known as dichlorofluorescin diacetate, is commonly used to detect the generation
of reactive oxygen intermediates in neutrophils and macrophages. Upon cleavage
of the acetate groups by intracellular esterases and oxidation, the nonfluorescent
H2DCFDA is converted to the highly fluorescent 2',7'-dichlorofluorescein (DCF).
Oxidation of H2DCFDA is reportedly not sensitive to singlet oxygen directly, but
singlet oxygen can indirectly contribute to the formation of DCF through its
reaction with cellular substrates that yield peroxy products and peroxyl radicals. In
a cell-free system, H2DCF has been shown to be oxidized to DCF by peroxynitrite
anion (ONOO–), by horseradish peroxidase (in the absence of H2O2) and by
Fe2+
(in the absence of H2O2). Furthermore, the oxidation of H2DCF by Fe2+
in the
presence of H2O2 was reduced by the HO• radical scavenger formate and the iron
chelator deferoxamine. In addition, DCF itself can act as a photosensitizer for
H2DCFDA oxidation, both priming and accelerating the formation of DCF.
Although other more specialized ROS probes have been and continue to be
developed, H2DCFDA and its chloromethyl derivative CM-H2DCFDA remain the
most versatile indicators of cellular oxidative stress.
The cell-permeable dye 2',7'-dichlorofluoresceindiacetate (H2DCFDA) is oxidized
by hydrogen peroxide, peroxinitrite (ONOO-), and
hydroxyl radicals (OH
•) to
yield the fluorescent molecule 2'7'-dichlorofluorescein. Thus, dye oxidation is an
indirect measure of the presence of these reactive oxygen intermediates, calculated
by difference in the mean fluorescence of a treated sample to that of the untreated
one.
b) Cell culture
HMEC cells were cultured in Molecular, Cellular, and Developmental Biology
(MCDB) medium supplemented with 5% 200mM L-glutamine, 10,000 Units/ml
penicillin/ 10,000 µg/ml streptomycin and Fetal Bovine Serum mixture at 37ºC in
a 5% CO2 atmosphere.
c) Procedure
Cultured HMEC cells were washed with PBS and incubated at 37ºC for 30
P a g e | 138
CHAPTER 5 EXPERIMENTAL
minutes with ROS (CM-H2DCFDA) dye previously dissolved in DMSO and
diluted in PBS to a final concentration of 10 µM.
• After incubation, the dye mixture was replaced with 100 µl/well EGM-2 and the
cells were again incubated at 37ºC for 30 minutes. Background fluorescence was
measured in a Fluroskan Ascent fluorometer at 510nm.
• HMEC’s were treated with plant extracts, incubated for 1 hour at 37ºC and then
the plate was measured to obtain the baseline fluorescence measurement.
• Next, the cells were subjected to tert-butyl hydrogen peroxide (tbH2O2) or vehicle
and the plate was measured after incubation times of 3 hours.
• The final normalized values were obtained by subtracting the baseline
fluorescence values from the fluorescence values obtained after tert-butyl
hydrogen peroxide (tbH2O2) stimulation.
• The background noise subtraction was carried out by subtracting the fluorescence
values obtained after stimulation of cells with plant extracts from the initial
fluorescence values obtained by stimulation of cells with dye.
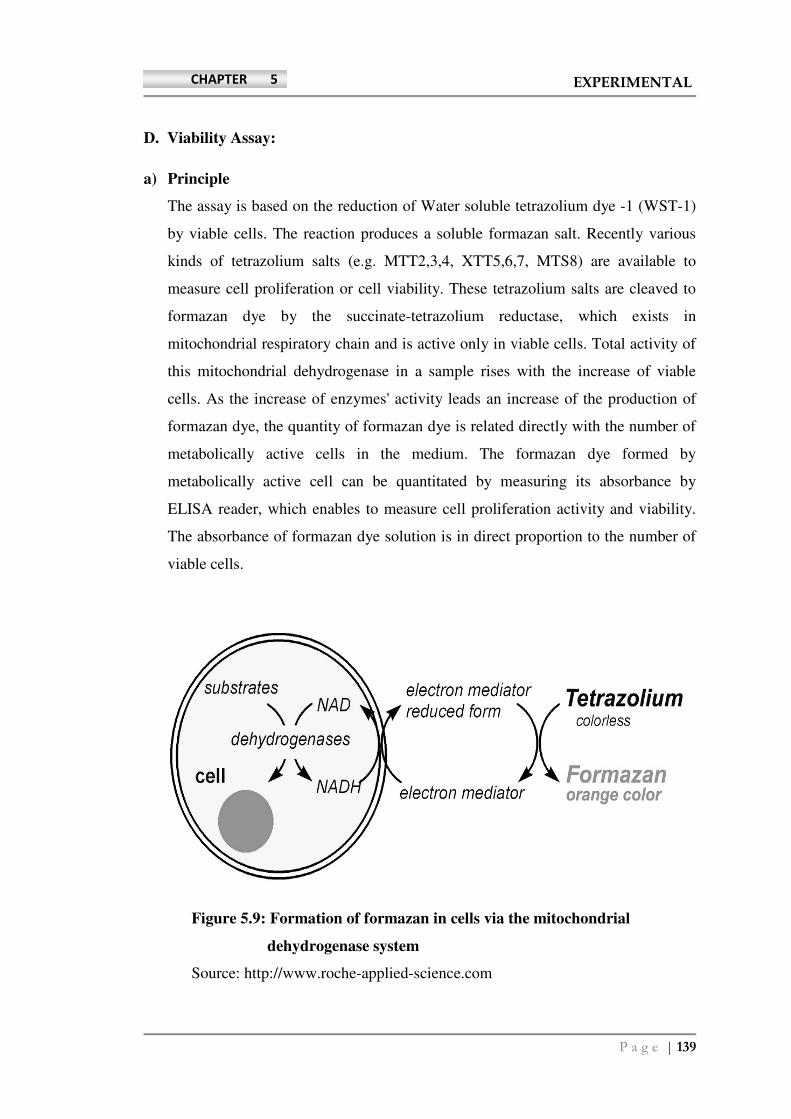
P a g e | 139
CHAPTER 5 EXPERIMENTAL
D. Viability Assay:
a) Principle
The assay is based on the reduction of Water soluble tetrazolium dye -1 (WST-1)
by viable cells. The reaction produces a soluble formazan salt. Recently various
kinds of tetrazolium salts (e.g. MTT2,3,4, XTT5,6,7, MTS8) are available to
measure cell proliferation or cell viability. These tetrazolium salts are cleaved to
formazan dye by the succinate-tetrazolium reductase, which exists in
mitochondrial respiratory chain and is active only in viable cells. Total activity of
this mitochondrial dehydrogenase in a sample rises with the increase of viable
cells. As the increase of enzymes' activity leads an increase of the production of
formazan dye, the quantity of formazan dye is related directly with the number of
metabolically active cells in the medium. The formazan dye formed by
metabolically active cell can be quantitated by measuring its absorbance by
ELISA reader, which enables to measure cell proliferation activity and viability.
The absorbance of formazan dye solution is in direct proportion to the number of
viable cells.
Figure 5.9: Formation of formazan in cells via the mitochondrial
dehydrogenase system
Source: http://www.roche-applied-science.com
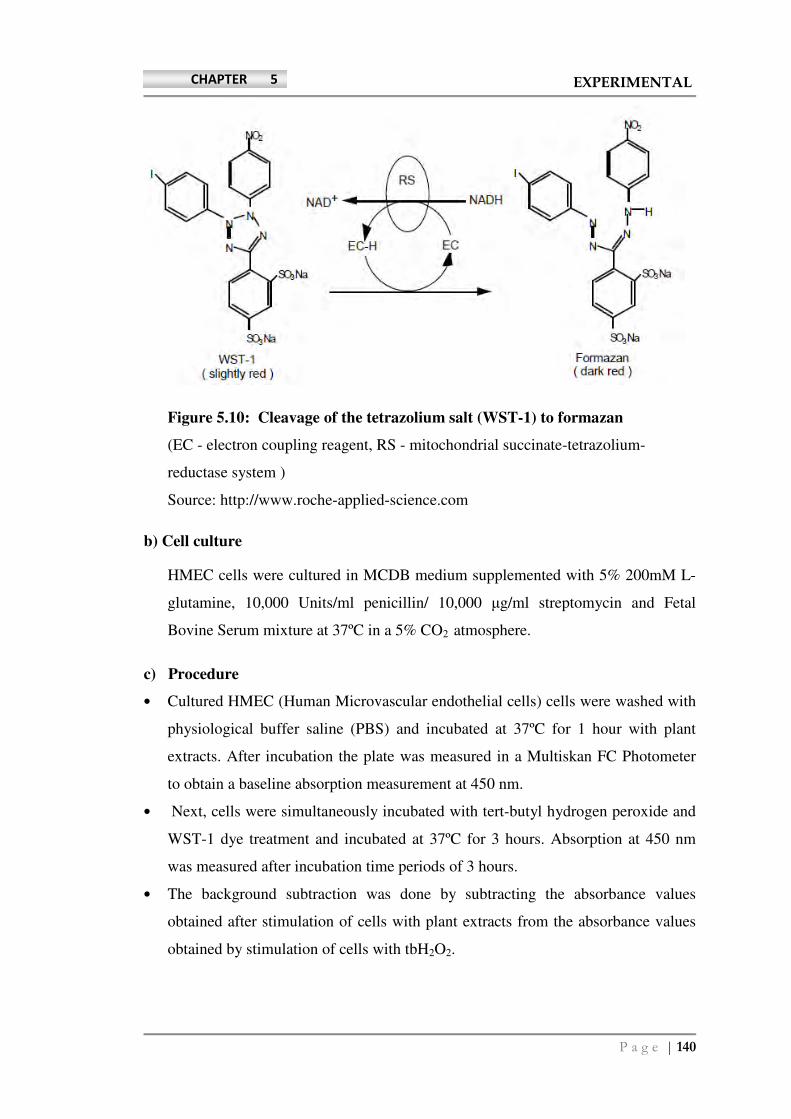
P a g e | 140
CHAPTER 5 EXPERIMENTAL
Figure 5.10: Cleavage of the tetrazolium salt (WST-1) to formazan
(EC - electron coupling reagent, RS - mitochondrial succinate-tetrazolium-
reductase system )
Source: http://www.roche-applied-science.com
b) Cell culture
HMEC cells were cultured in MCDB medium supplemented with 5% 200mM L-
glutamine, 10,000 Units/ml penicillin/ 10,000 µg/ml streptomycin and Fetal
Bovine Serum mixture at 37ºC in a 5% CO2 atmosphere.
c) Procedure
• Cultured HMEC (Human Microvascular endothelial cells) cells were washed with
physiological buffer saline (PBS) and incubated at 37ºC for 1 hour with plant
extracts. After incubation the plate was measured in a Multiskan FC Photometer
to obtain a baseline absorption measurement at 450 nm.
• Next, cells were simultaneously incubated with tert-butyl hydrogen peroxide and
WST-1 dye treatment and incubated at 37ºC for 3 hours. Absorption at 450 nm
was measured after incubation time periods of 3 hours.
• The background subtraction was done by subtracting the absorbance values
obtained after stimulation of cells with plant extracts from the absorbance values
obtained by stimulation of cells with tbH2O2.
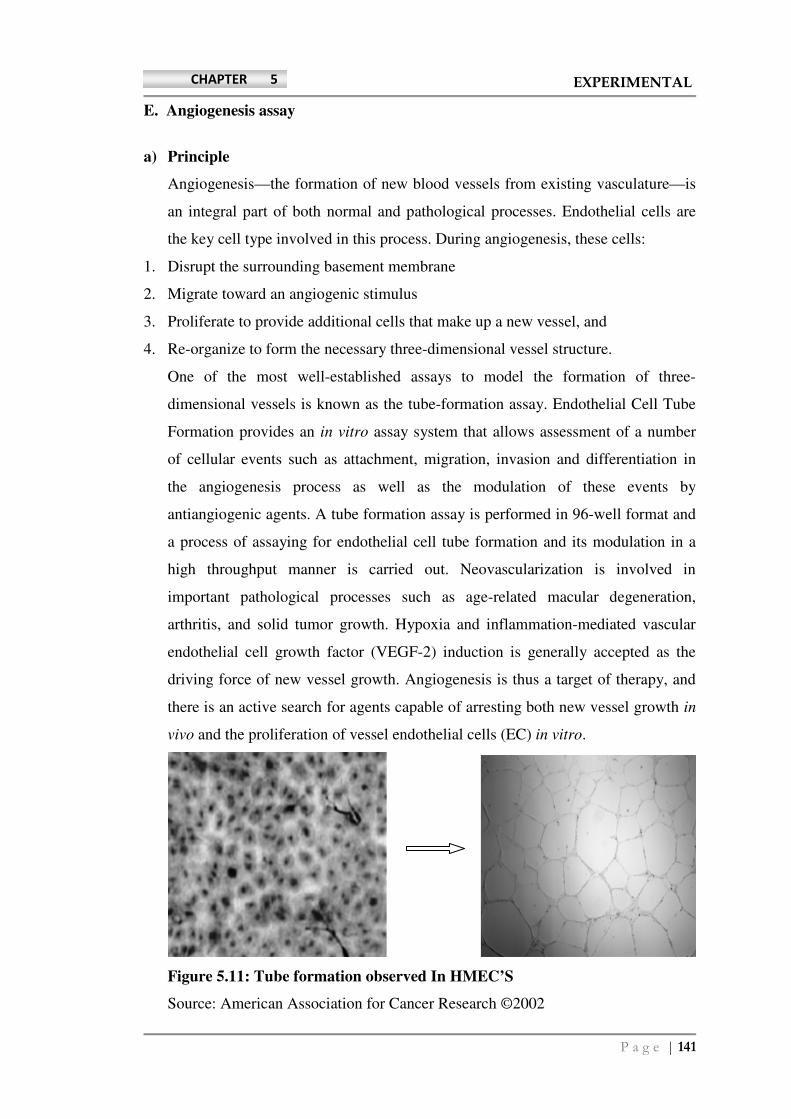
P a g e | 141
CHAPTER 5 EXPERIMENTAL
E. Angiogenesis assay
a) Principle
Angiogenesis—the formation of new blood vessels from existing vasculature—is
an integral part of both normal and pathological processes. Endothelial cells are
the key cell type involved in this process. During angiogenesis, these cells:
1. Disrupt the surrounding basement membrane
2. Migrate toward an angiogenic stimulus
3. Proliferate to provide additional cells that make up a new vessel, and
4. Re-organize to form the necessary three-dimensional vessel structure.
One of the most well-established assays to model the formation of three-
dimensional vessels is known as the tube-formation assay. Endothelial Cell Tube
Formation provides an in vitro assay system that allows assessment of a number
of cellular events such as attachment, migration, invasion and differentiation in
the angiogenesis process as well as the modulation of these events by
antiangiogenic agents. A tube formation assay is performed in 96-well format and
a process of assaying for endothelial cell tube formation and its modulation in a
high throughput manner is carried out. Neovascularization is involved in
important pathological processes such as age-related macular degeneration,
arthritis, and solid tumor growth. Hypoxia and inflammation-mediated vascular
endothelial cell growth factor (VEGF-2) induction is generally accepted as the
driving force of new vessel growth. Angiogenesis is thus a target of therapy, and
there is an active search for agents capable of arresting both new vessel growth in
vivo and the proliferation of vessel endothelial cells (EC) in vitro.
Figure 5.11: Tube formation observed In HMEC’S
Source: American Association for Cancer Research ©2002
P a g e | 142
CHAPTER 5 EXPERIMENTAL
b) Cell culture
HMEC cells were cultured in MCDB medium supplemented with 5% 200mM L-
glutamine, 10,000 Units/ml penicillin/ 10,000 µg/ml streptomycin and Fetal
Bovine Serum mixture at 37ºC in a 5% CO2 atmosphere.
c) Procedure
• Cultured HMEC cells were pre-incubated with varying conditions of plant extract
treatment or medium as control for 1 hr, trypsinized and added on to IBDI slides
previously filled with 10 µl of Matrigel.
• In total, 10.000 cells were added to each well in a 50 µl volume of culture medium
containing varying concentrations of hydrogen peroxide or vehicle.
• The angiogenic capacity of the cells subjected to various conditions mentioned
above were then evaluated using Angioquant software (Company) by measuring
tube length and junction formation after incubation period of 2, 4, and 24 hrs.
P a g e | 143
CHAPTER 5 EXPERIMENTAL
F. Western blot analysis
a) Principle
It is an analytical method wherein a protein sample is electrophoresed on an SDS-
PAGE (SDS polyacrylamide gel electrophoresis) and electrotransferred onto
nitrocellulose membrane. The transferred protein is detected using specific
primary antibody and secondary enzyme labeled antibody and substrate.
A protein sample is subjected to polyacrylamide gel electrophoresis. After this the
gel is placed over a sheet of nitrocellulose and the protein in the gel is
electrophoretically transfered to the nitrocellulose. The nitrocellulose is then
soaked in blocking buffer (3% skimmed milk solution) to "block" the nonspecific
binding of proteins. The nitrocellulose is then incubated with the specific antibody
for the protein of interest. Then the nitrocellulose is incubated with a second
antibody, which is specific for the first antibody. The second antibody will
typically have a covalently attached enzyme which, when provided with a
chromogenic substrate, will cause a color reaction. Thus the molecular weight and
amount of the desired protein can be characterized from a complex mixture (e.g.
crude cell extract) of other proteins by western blotting.
b) Cell culture
HMEC cells were cultured in MCDB medium supplemented with 5% 200mM
L-glutamine, 10,000 Units/ml penicillin/ 10,000 µg/ml streptomycin and Fetal
Bovine Serum mixture at 37ºC in a 5% CO2 atmosphere.
c) Procedure
• Treated HMEC cells were washed with PBS and lysed in a lysis buffer containing
EDTA-free protease inhibitor mixture (Roche, USA).
• Following centrifugation at 23,000g for 15 min, the supernatant was collected and
stored at -20ºC until used. The protein concentration was determined by using the
Quant-iT protein assay kit (Invitrogen, UK ).
• After addition of sample loading buffer, proteins were resolved by 10.0% SDS–
bisacrylamide gel electrophoresis. The proteins were transferred to polyvinylidene
difluoride membranes at 300 mA for 1.5 h.
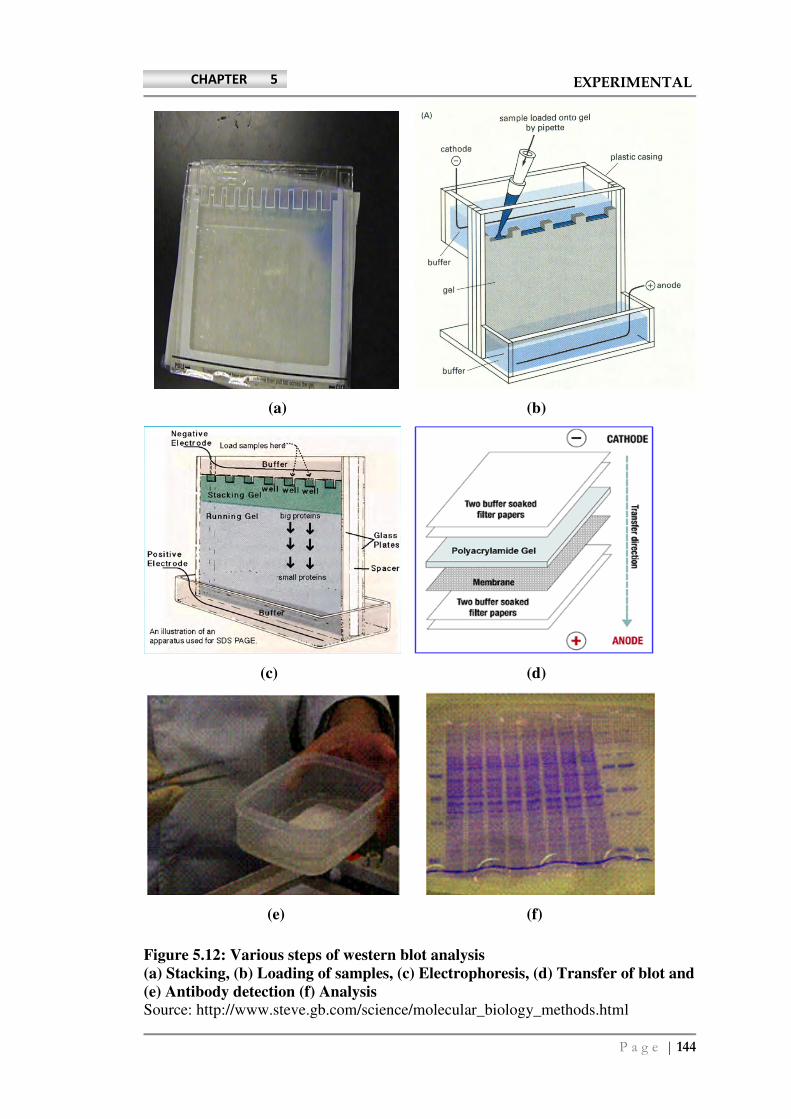
P a g e | 144
CHAPTER 5 EXPERIMENTAL
(a) (b)
(c) (d)
(e) (f)
Figure 5.12: Various steps of western blot analysis
(a) Stacking, (b) Loading of samples, (c) Electrophoresis, (d) Transfer of blot and
(e) Antibody detection (f) Analysis
Source: http://www.steve.gb.com/science/molecular_biology_methods.html
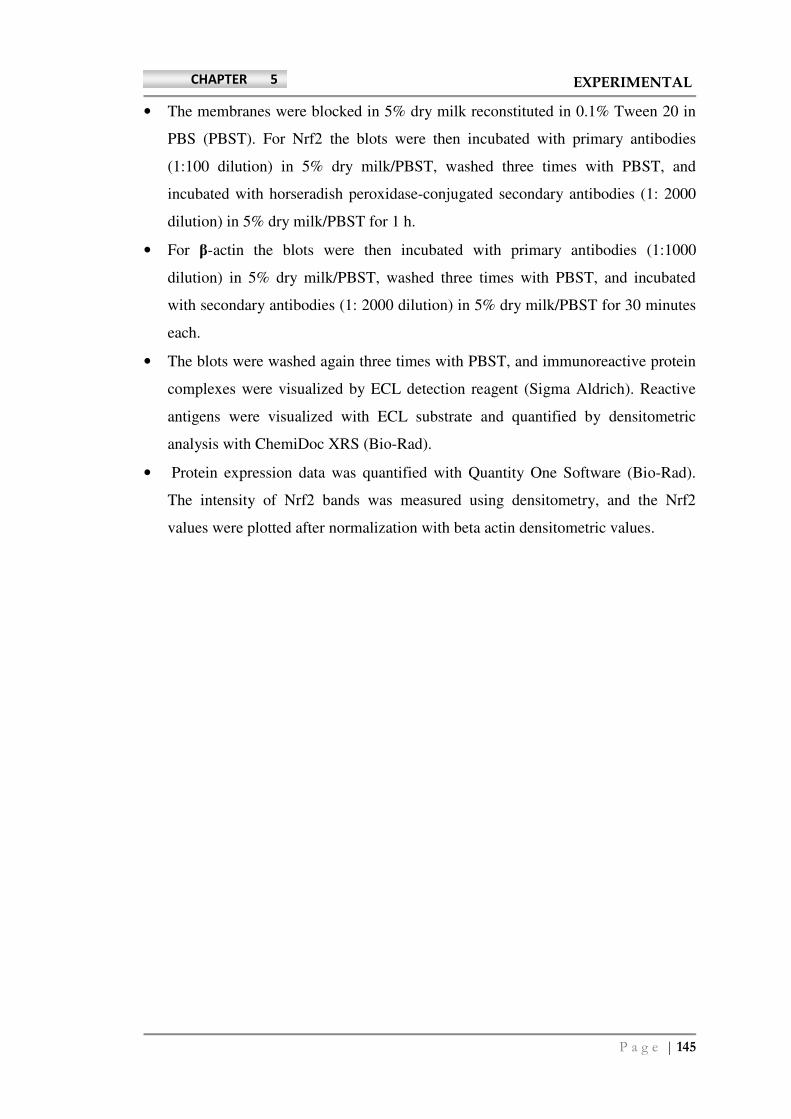
P a g e | 145
CHAPTER 5 EXPERIMENTAL
• The membranes were blocked in 5% dry milk reconstituted in 0.1% Tween 20 in
PBS (PBST). For Nrf2 the blots were then incubated with primary antibodies
(1:100 dilution) in 5% dry milk/PBST, washed three times with PBST, and
incubated with horseradish peroxidase-conjugated secondary antibodies (1: 2000
dilution) in 5% dry milk/PBST for 1 h.
• For β-actin the blots were then incubated with primary antibodies (1:1000
dilution) in 5% dry milk/PBST, washed three times with PBST, and incubated
with secondary antibodies (1: 2000 dilution) in 5% dry milk/PBST for 30 minutes
each.
• The blots were washed again three times with PBST, and immunoreactive protein
complexes were visualized by ECL detection reagent (Sigma Aldrich). Reactive
antigens were visualized with ECL substrate and quantified by densitometric
analysis with ChemiDoc XRS (Bio-Rad).
• Protein expression data was quantified with Quantity One Software (Bio-Rad).
The intensity of Nrf2 bands was measured using densitometry, and the Nrf2
values were plotted after normalization with beta actin densitometric values.
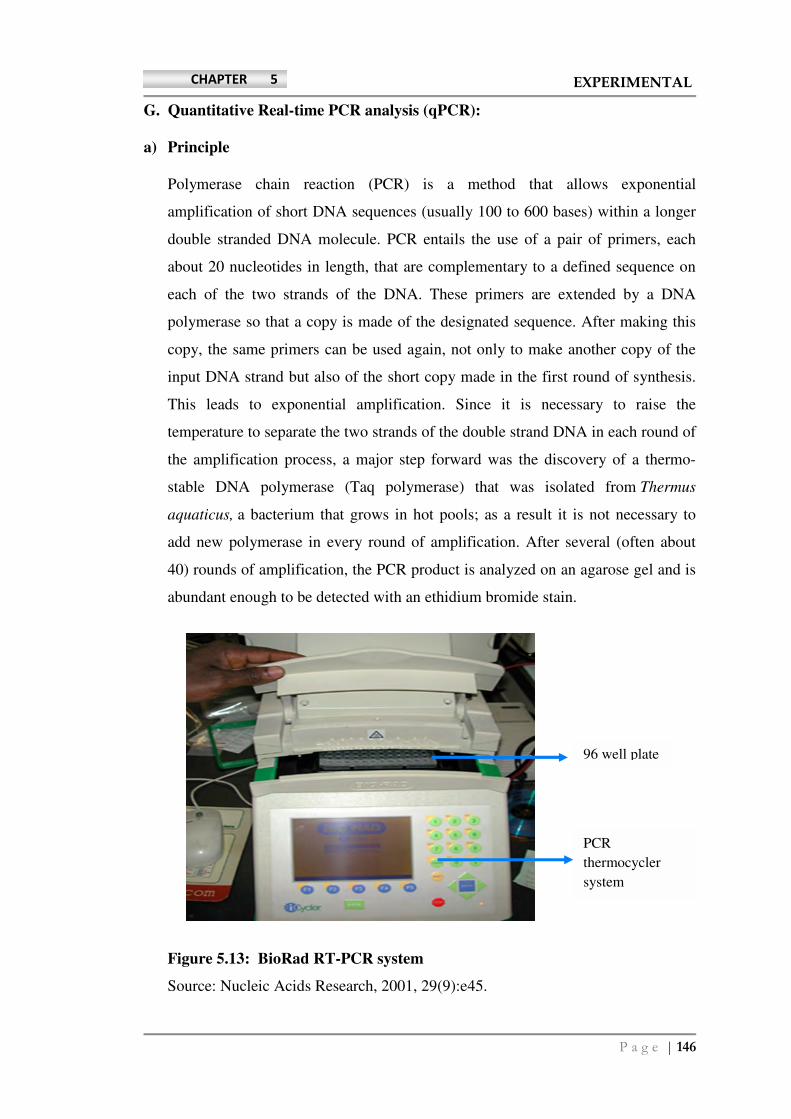
P a g e | 146
CHAPTER 5 EXPERIMENTAL
G. Quantitative Real-time PCR analysis (qPCR):
a) Principle
Polymerase chain reaction (PCR) is a method that allows exponential
amplification of short DNA sequences (usually 100 to 600 bases) within a longer
double stranded DNA molecule. PCR entails the use of a pair of primers, each
about 20 nucleotides in length, that are complementary to a defined sequence on
each of the two strands of the DNA. These primers are extended by a DNA
polymerase so that a copy is made of the designated sequence. After making this
copy, the same primers can be used again, not only to make another copy of the
input DNA strand but also of the short copy made in the first round of synthesis.
This leads to exponential amplification. Since it is necessary to raise the
temperature to separate the two strands of the double strand DNA in each round of
the amplification process, a major step forward was the discovery of a thermo-
stable DNA polymerase (Taq polymerase) that was isolated from Thermus
aquaticus, a bacterium that grows in hot pools; as a result it is not necessary to
add new polymerase in every round of amplification. After several (often about
40) rounds of amplification, the PCR product is analyzed on an agarose gel and is
abundant enough to be detected with an ethidium bromide stain.
Figure 5.13: BioRad RT-PCR system
Source: Nucleic Acids Research, 2001, 29(9):e45.
96 well plate
PCR
thermocycler
system
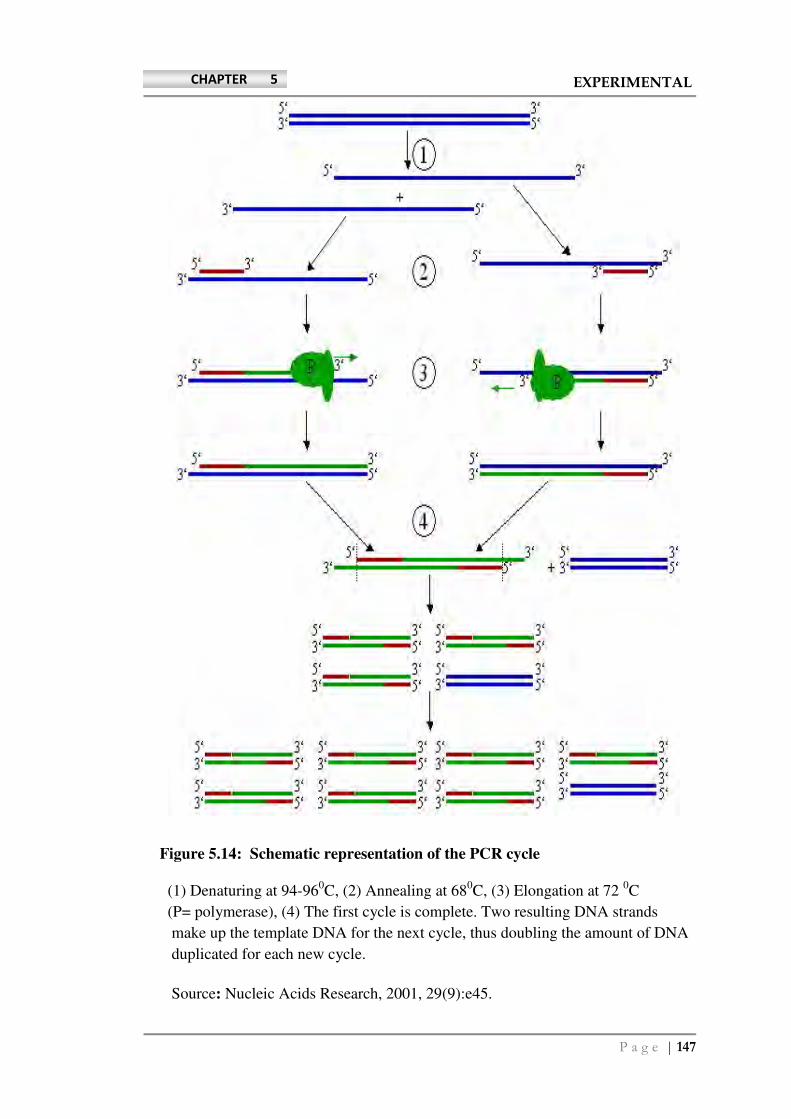
P a g e | 147
CHAPTER 5 EXPERIMENTAL
Figure 5.14: Schematic representation of the PCR cycle
(1) Denaturing at 94-960C, (2) Annealing at 68
0C, (3) Elongation at 72
0C
(P= polymerase), (4) The first cycle is complete. Two resulting DNA strands
make up the template DNA for the next cycle, thus doubling the amount of DNA
duplicated for each new cycle.
Source: Nucleic Acids Research, 2001, 29(9):e45.
P a g e | 148
CHAPTER 5 EXPERIMENTAL
b) Cell culture :
HMEC cells were cultured in MCDB medium supplemented with 5% 200mM L-
glutamine, 10,000 Units/ml penicillin/ 10,000 µg/ml streptomycin and Fetal
Bovine Serum mixture at 37ºC in a 5% CO2 atmosphere.
c) Procedure
• Total RNA was isolated using TRIzol Reagent (Cat. No. 15596-018, Invitrogen
Life Science Technologies), quantified by spectrophotometry (ND-1000,
Nanodrop technologies) and first-strand cDNA was synthesized using the
iScript™cDNA Synthesis Kit (Cat. No. 170-8891, Bio-Rad, Hercules, CA)
according to the manufacturer’s instructions.
• Specific primers for heme oxygenase-1 (decycling) (HO-1), NAD(P)H
dehydrogenase [quinone]-1 (NQO1), glutamate-cysteine ligase, catalytic subunit
(GCLC), glutamate-cysteine ligase, regulatory subunit (GCLM) and nuclear factor
(erythroid-derived 2)-like 2/NF-E2-related factor (Nrf2) were designed, as well as
primers for several housekeeping genes (B2MG, HPRT, PPIA, 18S, P0).
• Primers were designed to work at an annealing temperature of 60 degrees Celsius,
in cases where primers functioned sub-optimally, the optimal annealing
temperature was empirically established by setting a temperature gradient on the
thermocycler.
• The real-time PCR analysis was performed with iQ™ Sybr Green Supermix (Cat.
No. 170-8885, Bio-Rad, Hercules, CA), conducted according to the instructions of
the manufacturer. The final reaction volume was set at 15 uL.
• The samples were processed in MyIQ PCR system (Bio-Rad, Hercules, CA) and
analyzed using MyiQ System Software, Version 1.0.410 (Bio-Rad Laboratories
Inc.).
• After a hot start of 3 min, each cycle consisted of a denaturation step at 95 °C for
20 s, an annealing step specific for each set of primers for 30 s and an elongation
step at 72 °C for 30 s.
• After 45 cycles a melting curve was obtained by increasing the temperature with
0.5 °C increments from 65 °C to 95 °C. With every run, as internal calibration, a
10-fold dilution series of reference cDNA was included, attained by mixing equal
amounts of cDNA from each sample and subsequently diluting the mixture in
nuclease free water.
P a g e | 149
CHAPTER 5 EXPERIMENTAL
• The reaction efficiency was calculated by using the formula 10–1/slope
(Rasmussen, 2001). Data were analyzed using the efficiency corrected Delta-
Delta-Ct method (Pfaffl, 2001).
• The Fold-change values of the genes of interest (GOIs) were normalized using the
geometric average of the Fold-change values of multiple housekeeping genes. The
best house-keeping genes were selected by implementing the pair-wise variance
algorithm introduced in (Vandesompele, 2002) using the geNorm applet
(http://medgen.ugent.be/~jvdesomp/genorm/).
• Additional house-keeping genes were included until an M-value of <0,15 was
achieved. To illustrate the behavior of the different house-keeping genes with
regard to each other (Pfaffl, 2004), a pair-wise non-parametric (spearman)
correlation matrix between the house-keeping genes was computed, using
GraphPad Prism, Version 5.0.
• Expression values were subsequently analyzed across biological replicates by
using an experiment-mean centered approach (Kubota, 1988), using a one-way
analysis of variance (ANOVA) with Tukey’s post test for determining the p-value.
P a g e | 150
CHAPTER 5 EXPERIMENTAL
5.9 PHARMACOLOGICAL INVESTIGATIONS OF CASHEW EXTRACTS
FOR ANTIDIABETIC ACTVITY
5.9.1 Acute oral Toxicity Studies
The acute toxic class method set out in the OECD Guideline 423 is a stepwise
procedure with the use of 3 animals of a single sex per step. Depending on the
mortality and/or the mortality status of the animals, on average 2-4 steps may be
necessary to allow judgment on the acute toxicity of the test substance. This
procedure is reproducible, uses very few animals and is able to rank substances in
a similar manner to the other acute toxicity testing methods (Test Guidelines 420
and 425). The acute toxic class method is based on biometric evaluations with
fixed doses, adequately separated to enable a substance to be ranked for
classification purposes and hazard assessment. The method as adopted in 1996
was extensively validated in vivo against LD50 data obtained from the literature,
both nationally and internationally (OECD guidelines, 2001).
a) Background
The bioactive extracts of cashew leaves and testa were to be tested for antidiabetic
activity. Prior to any pharmacological activity it is essential to determine the LD50
of the candidate extracts, hence acute oral toxicity study was carried out.
b) Principle
The test is based on a stepwise procedure with the use of a minimum number of
animals per step, sufficient information is obtained on the acute toxicity of the test
substance to enable its classification. The test substance is administered orally to a
group of experimental animals at one of the defined doses. The substance is tested
using a stepwise procedure, each step using three animals of a single sex
(normally females). Absence or presence of compound-related mortality of the
animals dosed at one step will determine the next step, i.e.;
− no further testing is needed,
− dosing of three additional animals, with the same dose
− dosing of three additional animals at the next higher or the next lower dose
P a g e | 151
CHAPTER 5 EXPERIMENTAL
level.
The method enables a judgement with respect to classifying the test substance to
one of a series of toxicity classes defined by fixed LD50 cut-off values.
A. Methodology
a) Selection of animal species
Female Albino mice (Wistar strain) were selected for the study. Healthy young
animals, 2 months old and 20-25g weight range of commonly used laboratory
strains were employed in the study. Females used were nulliparous and non-
pregnant. Normally females are used for the study, because literature surveys of
conventional LD50 tests show that, although there is little difference in sensitivity
between the sexes, in those cases where differences are observed females are
generally slightly more sensitive.
b) Housing and feeding conditions
The temperature in the experimental animal room was 22ºC (±3ºC) with the
relative humidity around 30%. Lighting was artificial, the sequence being 12
hours light, 12 hours dark. For feeding, conventional laboratory diet was used
with an unlimited supply of drinking water. Animals were caged based upon
various groups of plant extracts by dose, such that the number of animals per cage
must not interfere with clear observations of each animal.
c) Preparation of animals
The animals were randomly selected, marked to permit individual identification,
and kept in their cages for 5 days prior to dosing to allow for acclimatization to
the laboratory conditions. Animals were procured from Haffkine’s Research
Institute, Mumbai.
d) Preparation of doses
The extract was administered in a constant volume over the range of doses to be
tested by varying the concentration of the dosing preparation. Care was taken, not
to exceed 1.0 mL i.e. the maximum dose volume for administration. The extracts
were suspended in 0.05% CMC for administration. Doses were prepared freshly
prior to administration.
P a g e | 152
CHAPTER 5 EXPERIMENTAL
e) Administration of doses
The test extracts were administered as a single dose by oral gavage using a
suitable intubation canula and observed for a period of 14 days.
a) Number of animals and dose levels
Three animals were used for each step for individual extracts in the study. Dose
limit at 2000 mg/kg (single dose) was administered to mice and observed for 14
days. Groups of 3 animals (control and test group), each were formed. The
animals in the control group received water.
B. Observations
Animals were observed individually after dosing at least once during the first 30
minutes, periodically during the first 24 hours, with special attention given during
the first 4 hours, and daily thereafter, for a total of 14 days, except where they
need to be removed from the study and humanely killed for animal welfare
reasons or were found dead.
All observations were systematically recorded with individual records being
maintained for each animal. Additional observations like that of tremors,
convulsions, salivation, diarrhea, lethargy, sleep and coma were observed when
toxic symptoms were seen in animals. Animals found in a mortality condition
were humanely killed. When animals were killed for humane reasons or found
dead, the time of death was recorded as precisely as possible.
• Body weight and food intake
Animals treated with extracts of cashew leaves and testa were observed for body
weight gain and food intake throughout the study. Individual weights of animals
were determined shortly before the test extracts were administered and daily
thereafter. Weight changes were calculated and recorded. At the end of the test
surviving animals were weighed and humanely killed.
P a g e | 153
CHAPTER 5 EXPERIMENTAL
5.9.2 Evaluation of The Effect Of Cashew Leaves And Testa Extracts In
Streptozotocin-Nicotinamide Induced Type-II Diabetic Rats
A. Introduction
Although streptozotocin (STZ) is commonly used to produce an experimental
model of diabetes in laboratory animals, the destruction of the pancreatic islet cell
is an undesirable side effect when STZ is employed as a chemotherapeutic agent
in treatment of tumors. Therefore, suitable protective substances have been
sought, which will allow STZ to retain its complete anticancer activity but also
preserve normal pancreatic function in treated animals. Figure 5.15 illustrates the
mechanistic pathway of STZ showing the sites of action of protective agents,
several of which have nutritional importance. In reports published till date it is
observed that 2- deoxyglucose and 3-O-methyl glucose completely protected
against STZ action in rats which is probably due to structural similarity to STZ
and inhibition of the drug into the pancreatic cell. Nicotinamide, picolinamide,
theophylline and several benzamides all inhibit islet poly (ADP ribose) synthetase
hence do not deplete pancreatic NAD concentrations. The antioxidants vitamin E
and dimethyl urea also have protective effects in rodents. It has been postulated
that STZ can act as an oxidant and can initiate changes in the redox state of the
islet cell. Indeed, a fall in reduced glutathione and rise in the oxidized form occurs
in rat islet cells in vitro. As a result, lowered amounts of pyridine nucleotides are
produced by the hexose monophosphate shunt (HMPS). The role of STZ as a free
radical generator, however, remains controversial since neither superoxide
dismutase, nor vitamin C, both having antioxidant properties, demonstrated
significant protective effects (Ganda.1976).
It should also be mentioned that modification of STZ-induced diabetes by
nicotinamide and other protective agents may be of primary benefit over a limited
time span and over a longer period may actually potentiate the well known
oncologic action of STZ. To this point, researchers have demonstrated a dramatic
increase in β-cell tumors of surviving animals one year after administration using
poly (ADP ribose) synthetase inhibitors and STZ in rats (Okamoto, 1983). The
retardation of prompt DNA repair seems to be closely related to this phenomenon.

P a g e | 154
CHAPTER 5 EXPERIMENTAL
Nicotinamide can exert a partial protection against the β cytotoxic effect of
streptozotocin. This model appears closer to human type 2 diabetes than other
available models (neonatally STZ- injected rats,GK rats),with regard to insulin
responsiveness to glucose and sulphonyl ureas (Okamoto, 1983).
Figure 5.15 Mechanistic pathway of STZ showing the sites of action of
protective agents
Source: Journal of Biological Chemistry, 257: 6084, 1982.
Figure 5.15 illustrates the protecting mechanism against action of streptozotocin
on pancreatic β-cells. As indicated in the figure, vitamin E and dimethyl urea may
protect against DNA strand breaks through antioxidant action, poly (ADP-ribose)
synthetase inhibitors such as nicotinamide, picolinamide, theophylline, etc. may
protect streptozotocin-induced depression of proinsulin synthesis by inhibiting
NAD degradation through poly (ADP-ribose) and 2 deoxyglucose and 3-O-methyl
glucose may protect by inhibiting cellular uptake of streptozotocin.

P a g e | 155
CHAPTER 5 EXPERIMENTAL
B. Background
From the seven extracts prepared from leaves and testa of Cashew, three extracts
were selected for STZ - Nicotinamide Induced Type 2 Diabetes Mellitus model
based upon the acute toxicity study and antioxidant effects and IC50 values. The
doses of the extracts were selected based upon the literature available for the
cashew leaves and testa extracts.
C. Preparation of reagents
• Preparation of STZ and Nicotinamide solution
STZ is stable in citrate buffer (pH 4.5). A solution of STZ was prepared by
dissolving a weighed quantity of STZ in freshly prepared ice cold buffer pH (4.5)
solution and administered intra peritoneally. Nicotinamide was dissolved in
normal saline. The STZ in sodium citrate buffer was prepared freshly and injected
within 5 min so as to avoid degradation. Nicotinamide was administered 15 min
before STZ administration.
D. Experimental
• Animals groups
Healthy adult albino rats aged between 2 and 3 months of age, weighing 250–
300g were used for the pharmacological studies. The animals were housed in
polypropylene cages, maintained under standard conditions (12/12h light and
dark) at 25±3◦C and 35–60% humidity. They were fed with standard rat pellet diet
and water ad libitum. The study protocol was approved by Institutional animal
Ethical Committee (Approval No: CUSCP/IAEC/29&31/09-10). Animals were
procured from Haffkine’s Research Institute, Mumbai, and acclimatized with free
access to food and water for at least 1 week (Barik, 2008 and Shirwaikar, 2004).
P a g e | 156
CHAPTER 5 EXPERIMENTAL
• Two study groups for standardization of STZ-Nicotinamide dose were as follows:
Group 1: Streptozotocin: 60 mg/kg (i.p) and nicotinamide: 120 mg/kg (ip)
Group 2: Streptozotocin: 60 mg/kg (i.p) and nicotinamide: 100 mg/kg (ip)
• The study groups for interventional study of STZ-nicotinamide model containing
six animals each were as follows:
Group 1: Normal control [treated with saline]
Group 2: Positive control [treated with Glibenclamide 0.45 mg/kg]
Group 3: Diabetic control [treated with streptozotocin (60 mg/kg i.p) 15 min after
the administration of (100 mg/kg i.p) nicotinamide]
Group 4: Treatment group [treated with ethanol extract of Cashew testa
175 mg/kg]
Group 5: Treatment group [treated with polyphenol fraction of Cashew testa
50 mg/kg]
Group 6: Treatment group [treated with ethanol extract of Cashew leaves
100 mg/kg]
Group 7: Treatment group [treated with ethanol extract of Cashew testa
350 mg/kg in divided doses]
E. Methodology - Induction of Experimental diabetes
a) Standardization of Streptozotocin–Nicotinamide (STZ-NA) dose to induce
Type II Diabetes condition– NIDDM in rats
• All the animals had free access to water and food. A rat model of type 2 diabetes
mellitus (non-insulin dependent diabetes mellitus, NIDDM) was induced in
overnight-fasted rats by a single intraperitoneal injection of streptozotocin (60
mg/kg) 15 min after the intraperitoneal administration of nicotinamide (100 mg/kg
i.p)
• Blood samples were obtained from the retro-orbital plexus in both streptozotocin-
injected and control animals at 72 hours and on day 7 after an overnight fast.
Hyperglycemia was confirmed by elevated blood glucose levels determined at
72 h and then on day 7 after injection. Only rats confirmed to have permanent
NIDDM were used for the antidiabetic study.
P a g e | 157
CHAPTER 5 EXPERIMENTAL
• The rats were supplied with 5% glucose water and ad libitum basal diet during the
next 24 hours to avoid sudden hypoglycemia post-injection. On day 2, water was
replaced with drinking water. Fasting blood glucose levels were determined by
glucose oxidase method. Rats with fasting blood glucose levels above 200 mg/dL
were considered diabetic.
b) Intervention study
• A rat model of type 2 diabetes mellitus (non-insulin dependent diabetes mellitus,
NIDDM) was induced in overnight-fasted rats by a single injection of
streptozotocin (60 mg/kg i.p) 15 min after the administration of nicotinamide (100
mg/kg i.p).
• The rats were supplied with 5% glucose water and ad libitum basal diet during the
next 24 hours to avoid sudden hypoglycemia post-injection. On day 2, water was
replaced with drinking water.
• Blood samples were obtained from the retroorbital plexus in both streptozotocin-
injected and control animals at 72 hours and on day 7 after an overnight fast. Rats
with stable elevated fasting blood glucose levels on day 7 and above 200 mg/dL
were considered diabetic and chosen for the interventional study. Fasting blood
glucose levels were determined by glucose oxidase method.
• The animals were grouped randomly based on their blood glucose levels, each
having six animals. The control group received 0.05 % suspension of CMC and in
the treatment group the drug/extracts were suspended in 0.05% CMC
administered orally for 15 days.
• At the end of the experimental period, the rats were fasted overnight and blood
samples were withdrawn from the retro orbital plexus. Serum samples were used
for the various biochemical estimations.
c) Statistical analysis
All statistical analyses were made using the software InStat for windows. All
results were expressed as mean ± SEM. Post hoc Dunnett’s test was used to
determine statistical significance. The values were considered statistically
significant when p<0.05.
P a g e | 158
CHAPTER 5 EXPERIMENTAL
5.9.3 Evaluation of the effect of cashew leaves and testa extracts in neonatal
streptozotocin induced (n- STZ) rat model of Type 2 Diabetes Mellitus
A. Introduction
In this model STZ is used within 5 days from birth in rats in dose ranging from
80-100 mg/kg to develop symptoms similar to type II diabetes, known as (n0-n5
model). Most of the beta cells are destroyed by STZ in neonates, but they
gradually regenerate to half the original mass. The animals exhibiting blood
glucose level above 100 mg/dL are considered to be diabetic. By varying the
administration time of STZ one can obtain hyperglycemia of differing severity
depending upon the extent of beta cell damage and regeneration. Susceptibility of
rats to STZ varies with species, strain, sex, age and nutritional state of the animals,
and all the STZ treated animals do not develop hyperglycemia. By 6 weeks of age
neonates showed basal hyperglycemia and abnormal glucose tolerance. Variations
in blood glucose levels, high mortality (30-50%) due to STZ toxicity and lack of
response to oral hypoglycemic drugs are the drawbacks of n0-n5. A study
showed that a spilt dose regimen of STZ injected over two consecutive days (day
0 and 1) after birth induces hyperglycemia and decreases pancreatic insulin stores
by day 5 as compared to a single dose (Portha, 2003; and Portha, 2007 b).
NIDDM or type II diabetes is the most common form of the disease which is
caused by impaired insulin secretion paralleled by a progressive decline in β-cell
function and chronic insulin resistance. Insulin resistance is a main reason in
pathogenesis of type II diabetes and occurs when the cellular mechanisms fail to
respond to insulin effects. The neonatal rats treated with streptozotocin (STZ) on
the first day of birth showed hyperglycemia and reduction in pancreatic insulin
amount during neonatal period and which could be maintained up to adulthood.
This diabetic rat’s model resembles the human NIDDM. This model is the result
of the spontaneous evolution of the administration of streptozotocin to 2-day-old
neonates. Adult diabetic rats are mildly hyperglycemic, mildly hypoinsulinemic
and strongly intolerant to glucose. Neonatal streptozotocin administration has
been used widely to mimic the physiopathology of the gestational diabetic state.
P a g e | 159
CHAPTER 5 EXPERIMENTAL
a) The β-cell function in n-STZ models
• Quantitative and qualitative defects in insulin secretion in Type 2 diabetes
mellitus:
Type 2 diabetic subjects display more subtle changes in the dynamics of insulin
secretion, such as blunting of the first phase insulin secretion and disruption of the
insulin secretory pulses. The first phase is a very brief surge of insulin that follows
an acute secretagogue challenge such as an intravenous glucose bolus. It peaks
after 2-4 min and dissipates within 6-10 min. If the challenge is sustained, the
prolonged second phase starts; the second phase supervenes and lasts until the
glucose is cleared. The first phase is a more efficient signal than the second, both
in enhancing glucose clearance and priming the liver to shut down glucose
production. Glucose regulates β-cell function in two ways. It produces a direct
release of insulin as a result of enhancement of the concentrations and its pre-
stimulus level modulates the response to the islet secretagogues. It is suggested
that the first phase response to glucose is specifically abolished in Type 2 diabetes
mellitus and the second phase insulin secretion is attenuated. It is not clear which
defect has a greater impact on glycemia. Insulin, like other hormones, is secreted
in pulses and this appears to be a fundamental signal for hormone signaling. In
normal subjects under fasting conditions, insulin release occurs in regular pulses
with a periodicity of about 13 min. But in subjects with Type 2 diabetes mellitus
insulin secretory profiles are more chaotic, and also the regular 13 min pulses are
absent. As indicated in figure 5.15, streptozotocin liberates toxic amounts of nitric
oxide that inhibits aconitase activity and participates in DNA damage. As a result
of the streptozotocin action, β-cells undergo the destruction by necrosis
(Arulmozhi, 2004).
• Defects in exocrine pancreas in n-STZ rats:
The acute STZ administration at birth to neonates affects subsequent exocrine
pancreas development, particularly that of amylase while exogenous insulin
attenuated the effect.
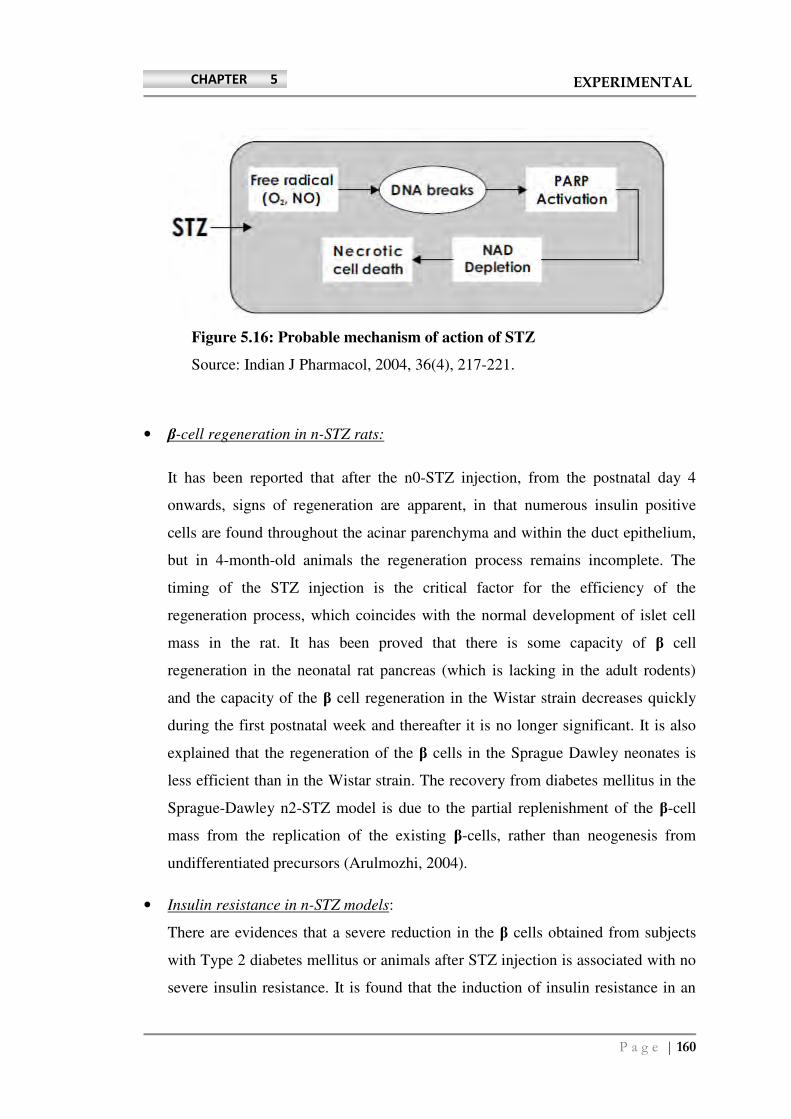
P a g e | 160
CHAPTER 5 EXPERIMENTAL
Figure 5.16: Probable mechanism of action of STZ
Source: Indian J Pharmacol, 2004, 36(4), 217-221.
• β-cell regeneration in n-STZ rats:
It has been reported that after the n0-STZ injection, from the postnatal day 4
onwards, signs of regeneration are apparent, in that numerous insulin positive
cells are found throughout the acinar parenchyma and within the duct epithelium,
but in 4-month-old animals the regeneration process remains incomplete. The
timing of the STZ injection is the critical factor for the efficiency of the
regeneration process, which coincides with the normal development of islet cell
mass in the rat. It has been proved that there is some capacity of β cell
regeneration in the neonatal rat pancreas (which is lacking in the adult rodents)
and the capacity of the β cell regeneration in the Wistar strain decreases quickly
during the first postnatal week and thereafter it is no longer significant. It is also
explained that the regeneration of the β cells in the Sprague Dawley neonates is
less efficient than in the Wistar strain. The recovery from diabetes mellitus in the
Sprague-Dawley n2-STZ model is due to the partial replenishment of the β-cell
mass from the replication of the existing β-cells, rather than neogenesis from
undifferentiated precursors (Arulmozhi, 2004).
• Insulin resistance in n-STZ models:
There are evidences that a severe reduction in the β cells obtained from subjects
with Type 2 diabetes mellitus or animals after STZ injection is associated with no
severe insulin resistance. It is found that the induction of insulin resistance in an
P a g e | 161
CHAPTER 5 EXPERIMENTAL
individual with reasonably normal islet function leads to modest elevation of the
plasma glucose level, whereas in an individual with impaired islet cell functions it
leads to hyperglycemia.
In contrast to the above findings, in 8-week-old n0-STZ female rats, it was shown
that hepatic glucose production measured in the basal state was higher in the
diabetes mellitus models than in the controls, despite similar peripheral insulin
levels in both groups. It is found that in white and brown adipose tissues, an
increased responsiveness to insulin action is detected when comparing diabetic
females to control females and insulin action was found normal in the skeletal
muscles and diaphragm of the same adult females. The observations of the
hormonal insulin action in the liver and white and brown adipose tissues indicated
that glucose is preferentially channeled towards the liver and adipose tissue in
n0-STZ females. The studies in the n5-STZ model showed that the glucose
utilization by the whole body mass induced by hyperinsulinemia was significantly
reduced and the hepatic glucose production rate was less efficiently suppressed by
submaximal or maximal insulin levels, which indicated that the insulin resistance
is present in vivo at the level of the peripheral tissues and the liver. When β-cell
insult is the primary factor responsible for the emergence of moderate to severe
hyperglycemia in rats, insulin resistance can develop secondarily and a certain
degree of insulin deficiency is necessary to induce insulin resistance.
b) Merits of n-STZ rat model of Type 2 diabetes mellitus
By altering the dose and the day of the STZ injection, the n-STZ models exhibit
various stages of Type 2 diabetes mellitus, such as impaired glucose tolerance,
mild, moderate and severe hyperglycemia. The n-STZ rats exhibit slightly lowered
plasma insulin levels, slightly elevated plasma glucose levels and lowered
pancreatic insulin content. As indicated in figure 5.2, the β-cells in the n-STZ rats
bear a resemblance to the insulin secretory characteristics found in Type 2 diabetic
patients. As indicated in table 5.2, the pattern of insulin release found in the n0-
STZ and n2- STZ rats is qualitatively similar to that of the rat, which is a
genetically diabetic non-obese model of human diabetes mellitus.
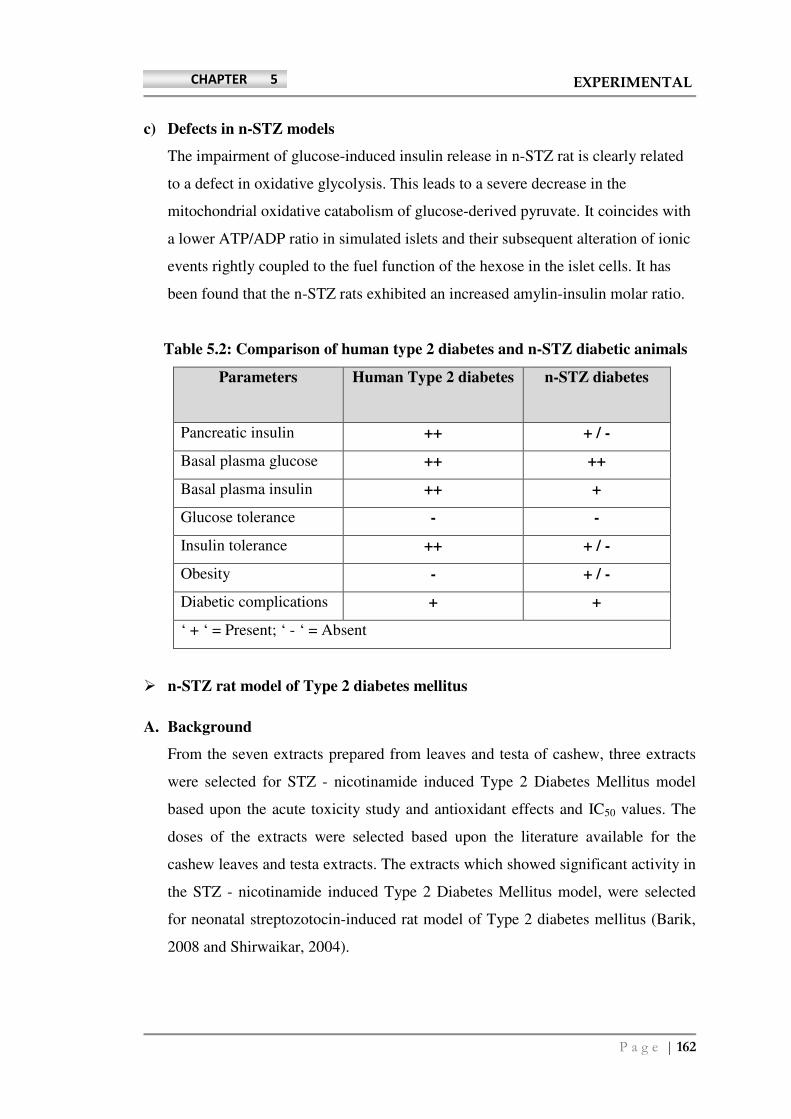
P a g e | 162
CHAPTER 5 EXPERIMENTAL
c) Defects in n-STZ models
The impairment of glucose-induced insulin release in n-STZ rat is clearly related
to a defect in oxidative glycolysis. This leads to a severe decrease in the
mitochondrial oxidative catabolism of glucose-derived pyruvate. It coincides with
a lower ATP/ADP ratio in simulated islets and their subsequent alteration of ionic
events rightly coupled to the fuel function of the hexose in the islet cells. It has
been found that the n-STZ rats exhibited an increased amylin-insulin molar ratio.
Table 5.2: Comparison of human type 2 diabetes and n-STZ diabetic animals
Parameters
Human Type 2 diabetes n-STZ diabetes
Pancreatic insulin ++ + / -
Basal plasma glucose ++ ++
Basal plasma insulin ++ +
Glucose tolerance - -
Insulin tolerance ++ + / -
Obesity - + / -
Diabetic complications + +
‘ + ‘ = Present; ‘ - ‘ = Absent
� n-STZ rat model of Type 2 diabetes mellitus
A. Background
From the seven extracts prepared from leaves and testa of cashew, three extracts
were selected for STZ - nicotinamide induced Type 2 Diabetes Mellitus model
based upon the acute toxicity study and antioxidant effects and IC50 values. The
doses of the extracts were selected based upon the literature available for the
cashew leaves and testa extracts. The extracts which showed significant activity in
the STZ - nicotinamide induced Type 2 Diabetes Mellitus model, were selected
for neonatal streptozotocin-induced rat model of Type 2 diabetes mellitus (Barik,
2008 and Shirwaikar, 2004).
P a g e | 163
CHAPTER 5 EXPERIMENTAL
B. Preparation of reagents
• Preparation of STZ solution
STZ is stable in citrate buffer (pH 4.5). A solution of STZ was prepared by
dissolving accurately weighed amount of STZ in freshly prepared ice cold citrate
buffer (pH 4.5) solution and administered intra peritoneally. The STZ in sodium
citrate buffer was prepared freshly and injected within 5 min so as to avoid
degradation. The buffer was prepared freshly before injection as the drug degrades
after 15-20 minutes in the citrate buffer.
C. Experimental design
• Animal groups
Animals were procured from Haffkine’s Research Institute, Mumbai, and
acclimatized with free access to food and water for at least 1 week. Healthy adult
albino rats aged between 2 and 3 months of age, weighing 250–300g were used
for the pharmacological studies. The animals were housed in polypropylene cages,
maintained under standard conditions (12/12h light and dark) at 25±3◦C and 35–
60% humidity. They were fed with standard rat pellet diet and water ad libitum.
The study protocol was approved by Institutional animal Ethical Committee
(Approval No: CUSCP/IAEC/29&31/09-10).
Three study groups for standardization of STZ dose were as follows:
Group 1: Control: Citrate buffer (i.p) on day 2
Group 2: Streptozotocin: 70 mg/kg (i.p) on day 5 {n5-STZ}
Group 3: Streptozotocin: 90 mg/kg (i.p) on day 2 {n2-STZ}
Group 4: Streptozotocin: 100 mg/kg (i.p) on day 2 {n2-STZ}
• The study groups for interventional study of neonatal streptozotocin-induced
(n-STZ) model containing six animals each were as follows:
Group 1: Normal control [treated with saline]
Group 2: Positive control [treated with standard Pioglitazone 2 mg/kg]
Group 3: Diabetic control [treated with streptozotocin (100 mg/kg i.p)]
Group 4: Treatment group [treated with ethanol extract of cashew testa
175 mg/kg]
P a g e | 164
CHAPTER 5 EXPERIMENTAL
D. Methodology - Induction of experimental diabetes
a) Standardization of streptozotocin dose to induce Type II Diabetes condition in
neonates
• All the animals had free access to water and food. A type 2 diabetes mellitus (non-
insulin dependent diabetes mellitus, NIDDM) was induced in neonates after 2 and
5 days of birth. The neonates were injected by a single intraperitoneal injection of
streptozotocin (100 mg/kg i.p)
• The pups were weaned after 30 days, and the animals were checked for fasting
glucose levels after 3 months of STZ injection.
• When animals were 12 weeks old, an oral glucose tolerance test was performed
(2g glucose/kg b.w was fed). Blood samples were withdrawn at 0,30,60,90 and
120 min. Glucose was administered after 0 min reading. All the animals were
fasted overnight before experiments. Animals which were intolerant to glucose by
OGTT were selected for the experiments.
b) Intervention study
• Two day old neonates were injected with 100 mg/kg of streptozotocin. When
animals were 12 weeks old, an oral glucose tolerance test was performed.
• All the animals were fasted overnight before experiments. Animals which were
intolerant to glucose by OGTT and fasting blood glucose levels >120 mg/dL were
selected for the interventional study with test compounds. Fasting blood glucose
levels were determined by glucose oxidase method.
• The animals were grouped randomly based on their blood glucose levels, each
having six animals. The control group received 0.05 % suspension of CMC. The
treatment group received the drug/extracts suspended in 0.05% CMC. The
administration of the drugs was done orally for 30 days.
• At the end of the experimental period, the rats were fasted overnight and blood
samples were withdrawn from the retro orbital plexus. Serum samples were used
for the various biochemical estimations. The whole blood was collected in EDTA
coated vials and used for the estimation of glycated haemoglobin.
• Serum was stored at –20 0 C for insulin estimation and analyzed by Radio immuno
assay. Histopathology was conducted on selected organs which were preserved in
P a g e | 165
CHAPTER 5 EXPERIMENTAL
10% formalin solution. Tissues were processed, sectioned and stained with
hematoxylin and eosin.
c) Statistical analysis
• All statistical analyses were made using the software InStat for windows. All
results were expressed as mean ± SEM. Post hoc Dunnett’s test was used to
determine statistical significance. The values were considered statistically
significant when p<0.05.
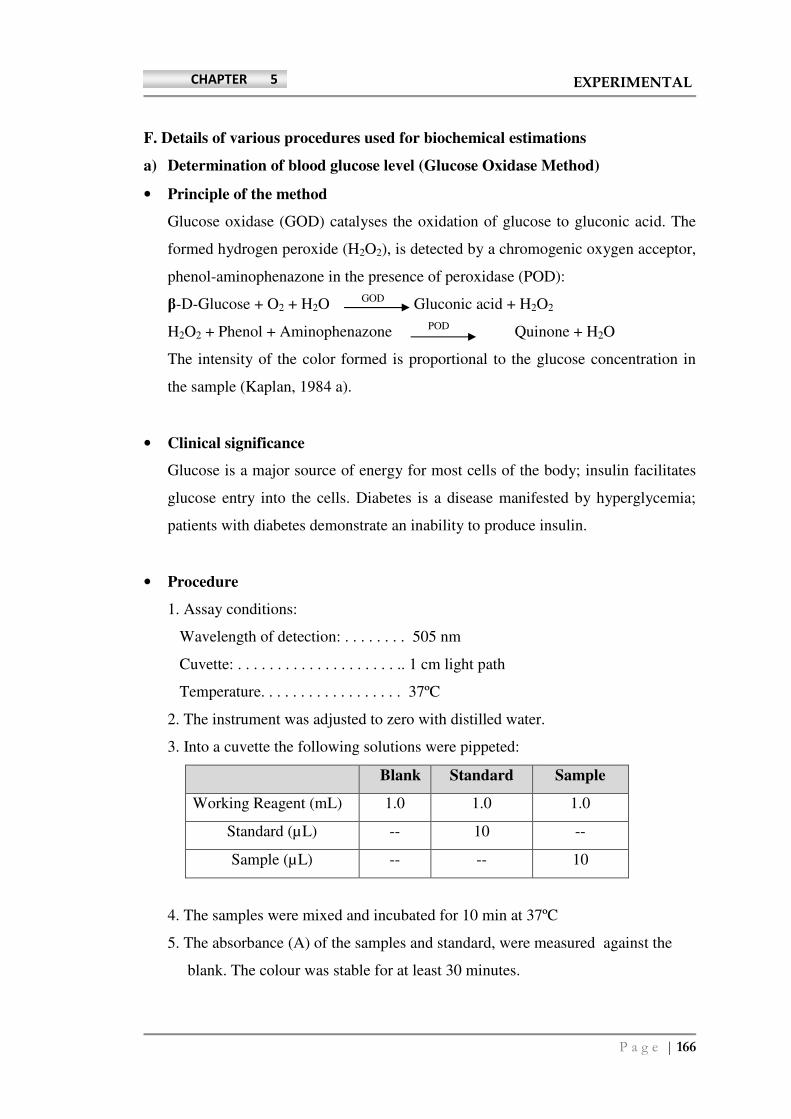
P a g e | 166
CHAPTER 5 EXPERIMENTAL
F. Details of various procedures used for biochemical estimations
a) Determination of blood glucose level (Glucose Oxidase Method)
• Principle of the method
Glucose oxidase (GOD) catalyses the oxidation of glucose to gluconic acid. The
formed hydrogen peroxide (H2O2), is detected by a chromogenic oxygen acceptor,
phenol-aminophenazone in the presence of peroxidase (POD):
β-D-Glucose + O2 + H2O GOD
Gluconic acid + H2O2
H2O2 + Phenol + Aminophenazone POD
Quinone + H2O
The intensity of the color formed is proportional to the glucose concentration in
the sample (Kaplan, 1984 a).
• Clinical significance
Glucose is a major source of energy for most cells of the body; insulin facilitates
glucose entry into the cells. Diabetes is a disease manifested by hyperglycemia;
patients with diabetes demonstrate an inability to produce insulin.
• Procedure
1. Assay conditions:
Wavelength of detection: . . . . . . . . 505 nm
Cuvette: . . . . . . . . . . . . . . . . . . . . .. 1 cm light path
Temperature. . . . . . . . . . . . . . . . . . 37ºC
2. The instrument was adjusted to zero with distilled water.
3. Into a cuvette the following solutions were pippeted:
Blank Standard Sample
Working Reagent (mL) 1.0 1.0 1.0
Standard (µL) -- 10 --
Sample (µL) -- -- 10
4. The samples were mixed and incubated for 10 min at 37ºC
5. The absorbance (A) of the samples and standard, were measured against the
blank. The colour was stable for at least 30 minutes.
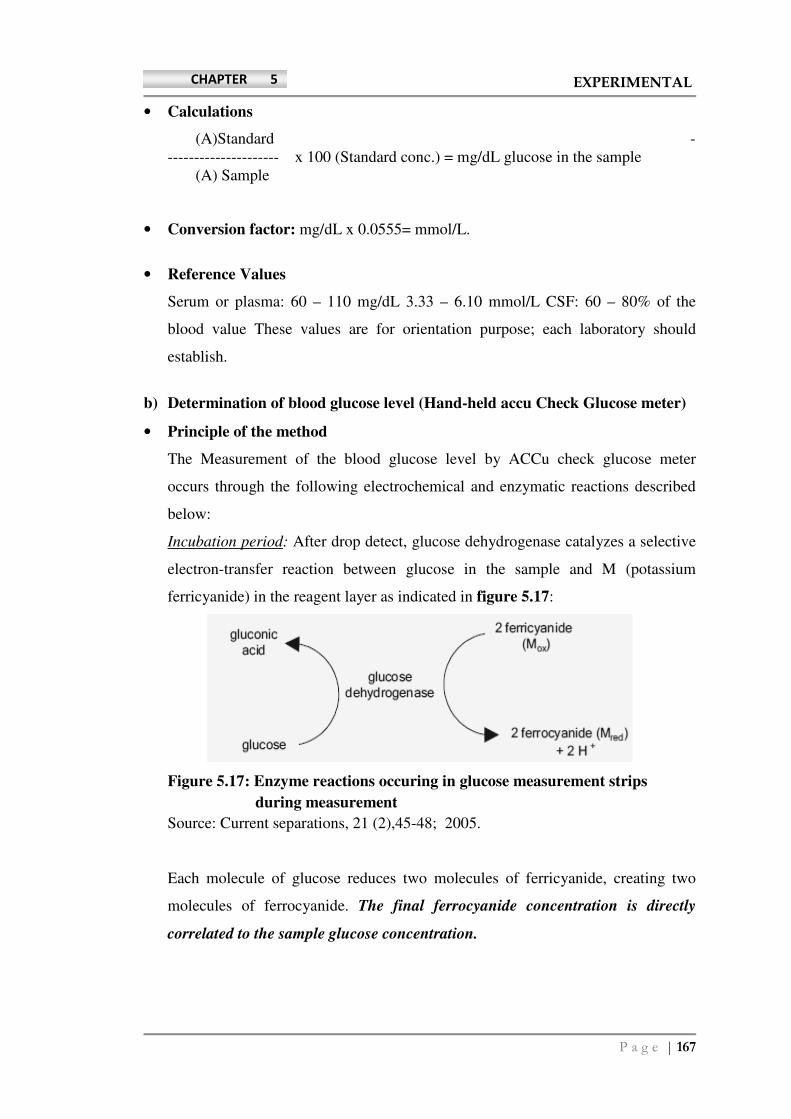
P a g e | 167
CHAPTER 5 EXPERIMENTAL
• Calculations
(A)Standard -
--------------------- x 100 (Standard conc.) = mg/dL glucose in the sample
(A) Sample
• Conversion factor: mg/dL x 0.0555= mmol/L.
• Reference Values
Serum or plasma: 60 – 110 mg/dL 3.33 – 6.10 mmol/L CSF: 60 – 80% of the
blood value These values are for orientation purpose; each laboratory should
establish.
b) Determination of blood glucose level (Hand-held accu Check Glucose meter)
• Principle of the method
The Measurement of the blood glucose level by ACCu check glucose meter
occurs through the following electrochemical and enzymatic reactions described
below:
Incubation period: After drop detect, glucose dehydrogenase catalyzes a selective
electron-transfer reaction between glucose in the sample and M (potassium
ferricyanide) in the reagent layer as indicated in figure 5.17:
Figure 5.17: Enzyme reactions occuring in glucose measurement strips
during measurement
Source: Current separations, 21 (2),45-48; 2005.
Each molecule of glucose reduces two molecules of ferricyanide, creating two
molecules of ferrocyanide. The final ferrocyanide concentration is directly
correlated to the sample glucose concentration.
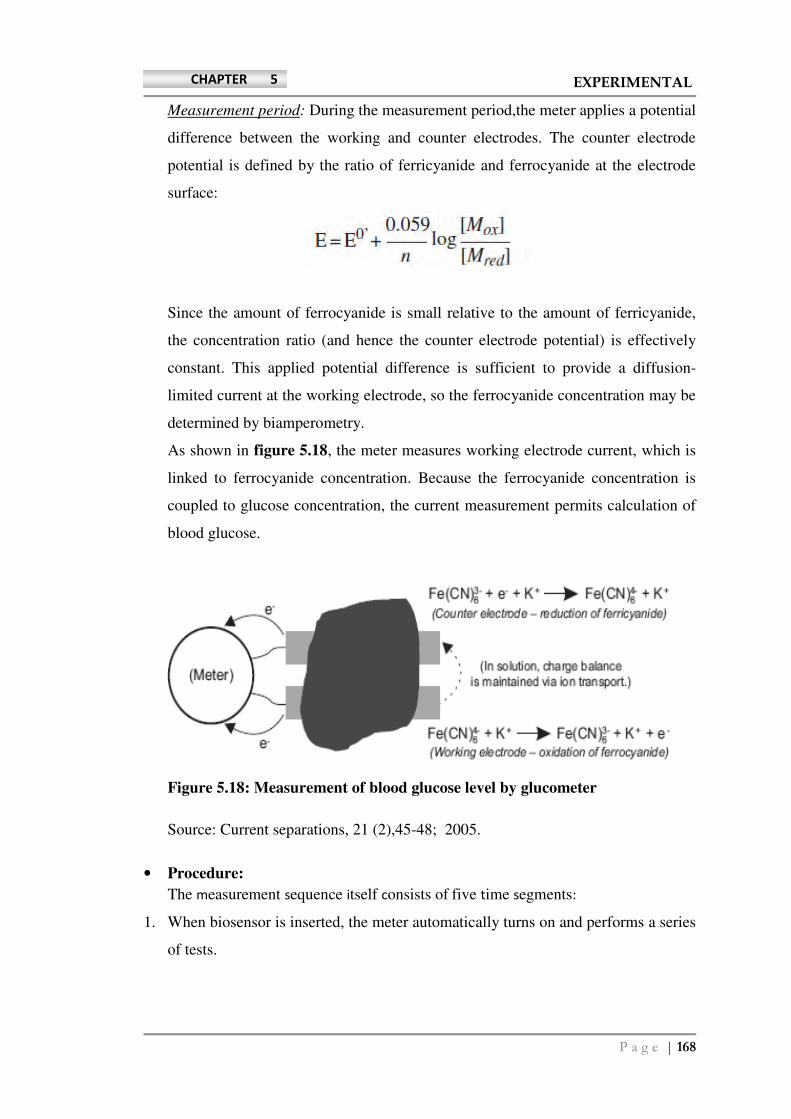
P a g e | 168
CHAPTER 5 EXPERIMENTAL
Measurement period: During the measurement period,the meter applies a potential
difference between the working and counter electrodes. The counter electrode
potential is defined by the ratio of ferricyanide and ferrocyanide at the electrode
surface:
Since the amount of ferrocyanide is small relative to the amount of ferricyanide,
the concentration ratio (and hence the counter electrode potential) is effectively
constant. This applied potential difference is sufficient to provide a diffusion-
limited current at the working electrode, so the ferrocyanide concentration may be
determined by biamperometry.
As shown in figure 5.18, the meter measures working electrode current, which is
linked to ferrocyanide concentration. Because the ferrocyanide concentration is
coupled to glucose concentration, the current measurement permits calculation of
blood glucose.
Figure 5.18: Measurement of blood glucose level by glucometer
Source: Current separations, 21 (2),45-48; 2005.
• Procedure:
The measurement sequence itself consists of five time segments:
1. When biosensor is inserted, the meter automatically turns on and performs a series
of tests.
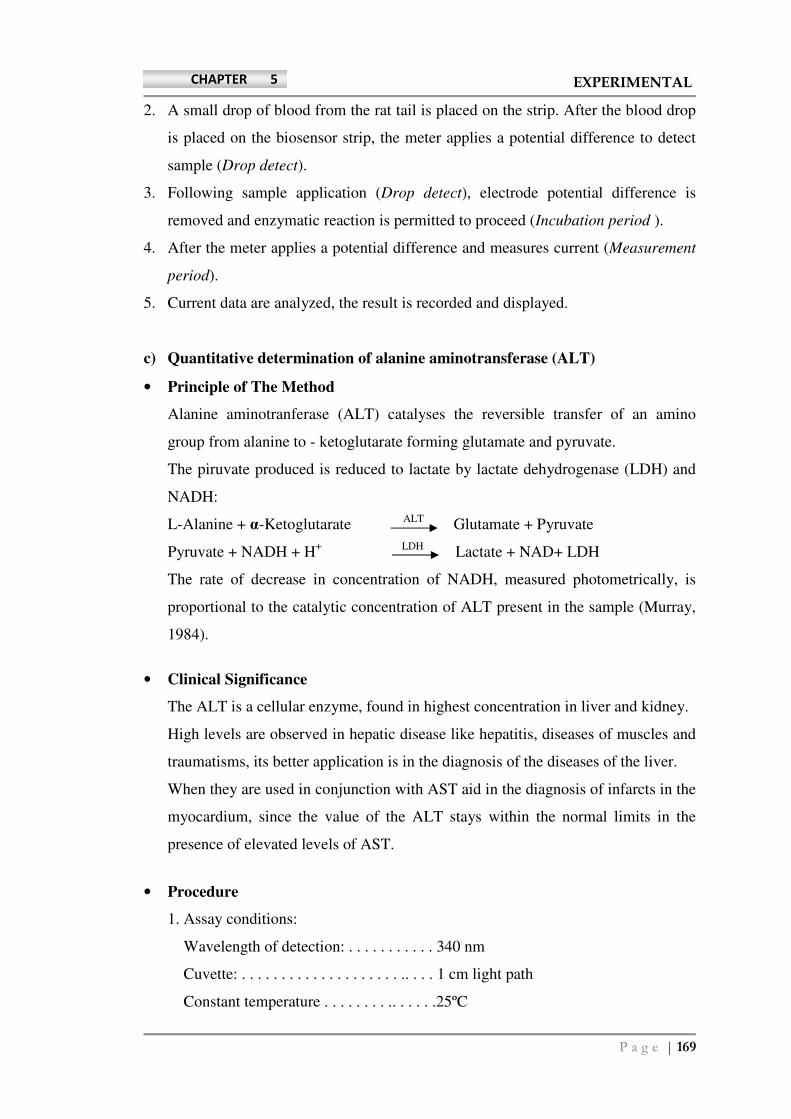
P a g e | 169
CHAPTER 5 EXPERIMENTAL
2. A small drop of blood from the rat tail is placed on the strip. After the blood drop
is placed on the biosensor strip, the meter applies a potential difference to detect
sample (Drop detect).
3. Following sample application (Drop detect), electrode potential difference is
removed and enzymatic reaction is permitted to proceed (Incubation period ).
4. After the meter applies a potential difference and measures current (Measurement
period).
5. Current data are analyzed, the result is recorded and displayed.
c) Quantitative determination of alanine aminotransferase (ALT)
• Principle of The Method
Alanine aminotranferase (ALT) catalyses the reversible transfer of an amino
group from alanine to - ketoglutarate forming glutamate and pyruvate.
The piruvate produced is reduced to lactate by lactate dehydrogenase (LDH) and
NADH:
L-Alanine + α-Ketoglutarate ALT
Glutamate + Pyruvate
Pyruvate + NADH + H+
LDH Lactate + NAD+ LDH
The rate of decrease in concentration of NADH, measured photometrically, is
proportional to the catalytic concentration of ALT present in the sample (Murray,
1984).
• Clinical Significance
The ALT is a cellular enzyme, found in highest concentration in liver and kidney.
High levels are observed in hepatic disease like hepatitis, diseases of muscles and
traumatisms, its better application is in the diagnosis of the diseases of the liver.
When they are used in conjunction with AST aid in the diagnosis of infarcts in the
myocardium, since the value of the ALT stays within the normal limits in the
presence of elevated levels of AST.
• Procedure
1. Assay conditions:
Wavelength of detection: . . . . . . . . . . . 340 nm
Cuvette: . . . . . . . . . . . . . . . . . . . . .. . . . 1 cm light path
Constant temperature . . . . . . . . .. . . . . .25ºC

P a g e | 170
CHAPTER 5 EXPERIMENTAL
2. The instrument was adjusted to zero with distilled water.
3. The solutions were pipetted into a cuvette as mentioned below:
Working Reagent (mL) 1.0
Sample (µL) 100
4. The solutions were mixed, and incubated for 1 minute. The initial absorbance
(A) of the sample, was measured at 1 minute intervals thereafter for 3 minutes.
6. The difference between absorbances and the average absorbance differences per
minute ( A/min) were calculated as follows:
∆ A/min x 1750 = U/L of ALT
A: Absorbance
U/L: Units/ Litre
• Reference values
25ºC 30ºC 37ºC
Men up to 22 U/L 29 U/L 40 U/L
Women up to 18 U/L 22 U/L 32 U/L
Normal newborns have been reported to show a reference range of up to double
the adult, attributed to the neonate’s hepatocytes. These values decline to adult
levels by approximately 3 months of age.
d) Quantitative determination of aspartate aminotransferase (AST)
• Principle of the method
Aspartate aminotransferase (AST) formerly called glutamate oxaloacetate (GOT)
catalyses the reversible transfer of an amino group from aspartate to ketoglutarate
forming glutamate and oxalacetate (Murray, 1984). The oxalacetate produced is
reduced to malate by malate dehydrogenase (MDH) and NADH:
L-Aspartate + α -Ketoglutarate AST
Glutamate + Oxaloacetate
Oxaloacetate + NADH + H+
MDH Malate + NAD
+
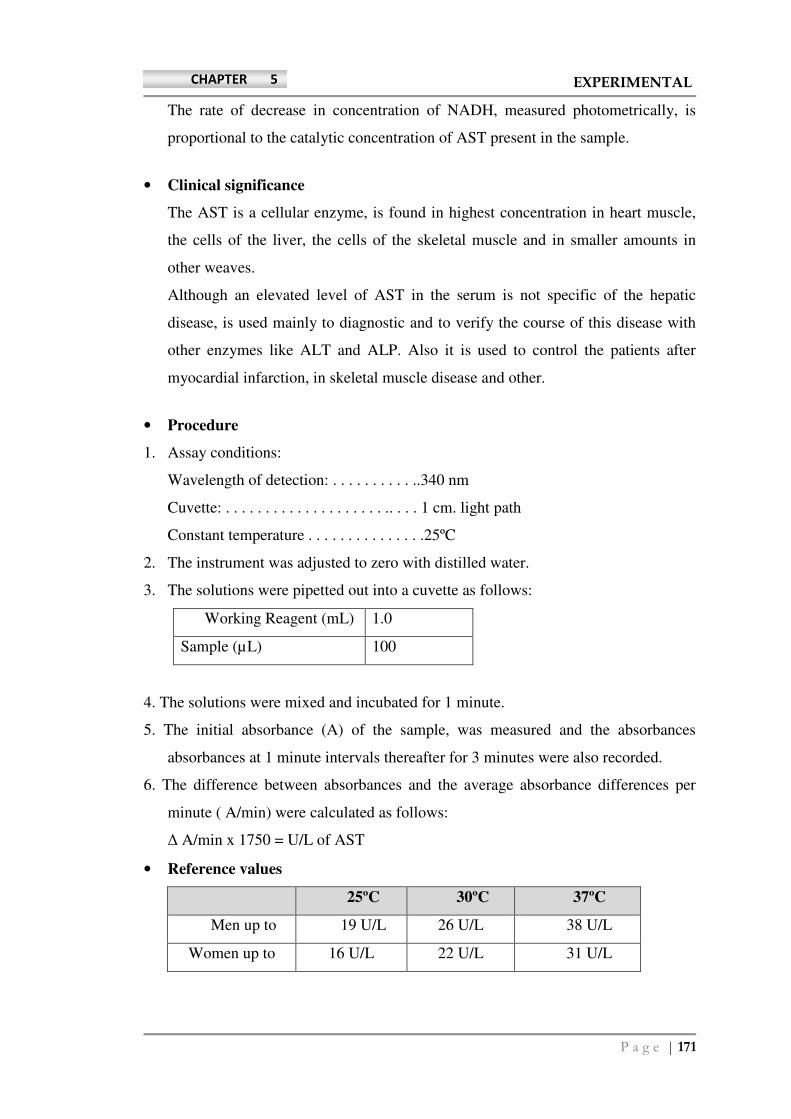
P a g e | 171
CHAPTER 5 EXPERIMENTAL
The rate of decrease in concentration of NADH, measured photometrically, is
proportional to the catalytic concentration of AST present in the sample.
• Clinical significance
The AST is a cellular enzyme, is found in highest concentration in heart muscle,
the cells of the liver, the cells of the skeletal muscle and in smaller amounts in
other weaves.
Although an elevated level of AST in the serum is not specific of the hepatic
disease, is used mainly to diagnostic and to verify the course of this disease with
other enzymes like ALT and ALP. Also it is used to control the patients after
myocardial infarction, in skeletal muscle disease and other.
• Procedure
1. Assay conditions:
Wavelength of detection: . . . . . . . . . . ..340 nm
Cuvette: . . . . . . . . . . . . . . . . . . . . .. . . . 1 cm. light path
Constant temperature . . . . . . . . . . . . . . .25ºC
2. The instrument was adjusted to zero with distilled water.
3. The solutions were pipetted out into a cuvette as follows:
Working Reagent (mL) 1.0
Sample (µL) 100
4. The solutions were mixed and incubated for 1 minute.
5. The initial absorbance (A) of the sample, was measured and the absorbances
absorbances at 1 minute intervals thereafter for 3 minutes were also recorded.
6. The difference between absorbances and the average absorbance differences per
minute ( A/min) were calculated as follows:
∆ A/min x 1750 = U/L of AST
• Reference values
25ºC 30ºC 37ºC
Men up to 19 U/L 26 U/L 38 U/L
Women up to 16 U/L 22 U/L 31 U/L
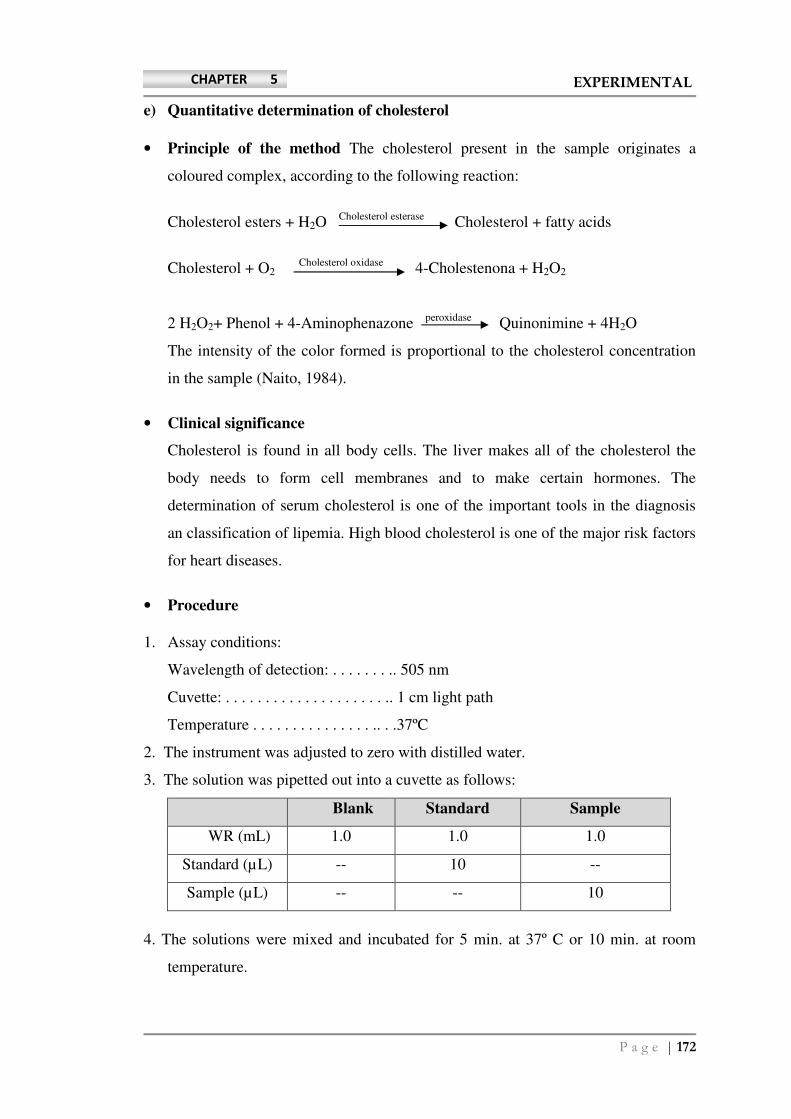
P a g e | 172
CHAPTER 5 EXPERIMENTAL
e) Quantitative determination of cholesterol
• Principle of the method The cholesterol present in the sample originates a
coloured complex, according to the following reaction:
Cholesterol esters + H2O Cholesterol esterase
Cholesterol + fatty acids
Cholesterol + O2 Cholesterol oxidase
4-Cholestenona + H2O2
2 H2O2+ Phenol + 4-Aminophenazone peroxidase
Quinonimine + 4H2O
The intensity of the color formed is proportional to the cholesterol concentration
in the sample (Naito, 1984).
• Clinical significance
Cholesterol is found in all body cells. The liver makes all of the cholesterol the
body needs to form cell membranes and to make certain hormones. The
determination of serum cholesterol is one of the important tools in the diagnosis
an classification of lipemia. High blood cholesterol is one of the major risk factors
for heart diseases.
• Procedure
1. Assay conditions:
Wavelength of detection: . . . . . . . .. 505 nm
Cuvette: . . . . . . . . . . . . . . . . . . . . .. 1 cm light path
Temperature . . . . . . . . . . . . . . . .. . .37ºC
2. The instrument was adjusted to zero with distilled water.
3. The solution was pipetted out into a cuvette as follows:
Blank Standard Sample
WR (mL) 1.0 1.0 1.0
Standard (µL) -- 10 --
Sample (µL) -- -- 10
4. The solutions were mixed and incubated for 5 min. at 37º C or 10 min. at room
temperature.

P a g e | 173
CHAPTER 5 EXPERIMENTAL
5. The absorbance (A) of the samples and Standard, were measured against the blank.
The colour is stable for at least 60 minutes.
• Calculations
(A) Sample -
-------------------- x 200 (Standard conc.) = mg/dL Cholesterol in the sample
(A) Standard
• Conversion factor: mg/dL x 0.0258= mmol/L.
• Reference values
Risk evaluation is done based on the following values:
Less than 200 mg/dL Normal
200-239 mg/dL Borderline
240 mg/dL and above High
f) Determination of HDL cholesterol (HDL-C)
• Principle of the method
The very low density (VLDL) and low density (LDL) lipoproteins from serum or
plasma are precipitated by phosphotungstate in the presence of magnesium ions.
After removed by centrifugation the clear supernatant containing high density
lipoproteins (HDL) is used for the determination of HDL cholesterol (Naito,1984).
• Clinical significance
HDL particles carry cholesterol from the cells back to the liver. HDL is known as
“good cholesterol” because high levels are thought to lower the risk of heart
disease. A low HDL cholesterol levels, is considered a greater risk for heart
disease.
• Procedure
Precipitation process:
1. The solutions were pipetted into a centrifuge tube as mentioned below:
Working reagent (µL) 100
Sample (mL) 1.0
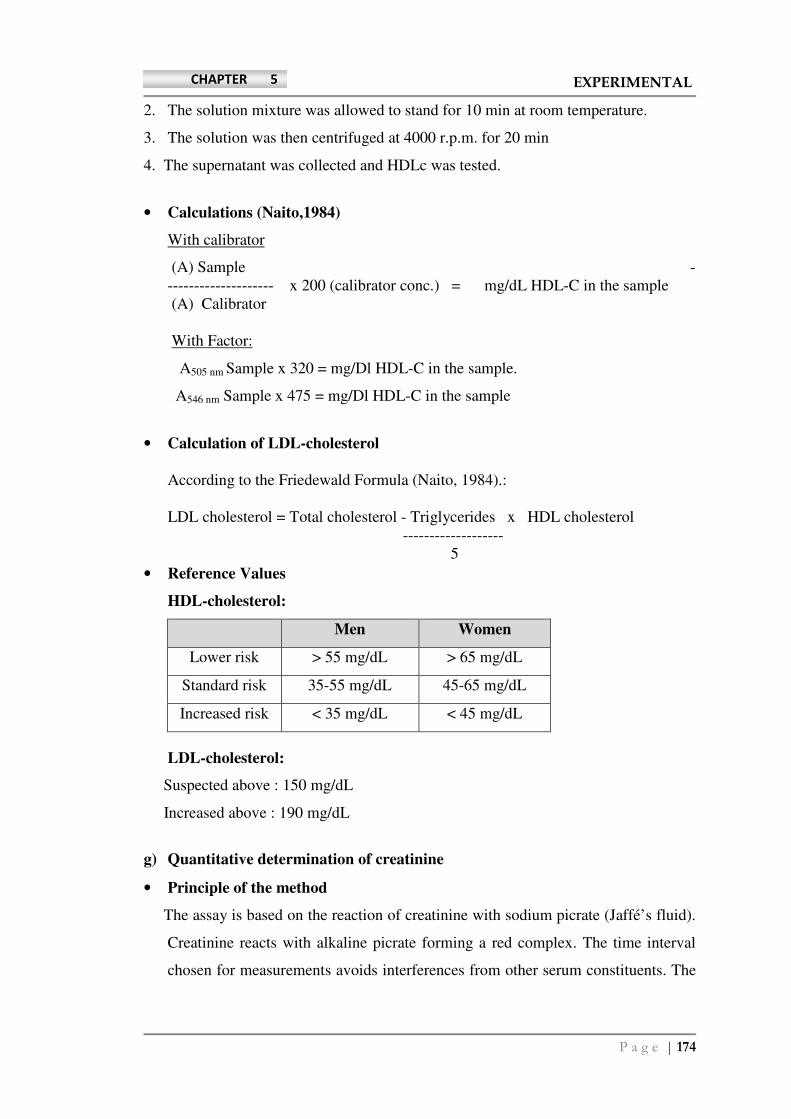
P a g e | 174
CHAPTER 5 EXPERIMENTAL
2. The solution mixture was allowed to stand for 10 min at room temperature.
3. The solution was then centrifuged at 4000 r.p.m. for 20 min
4. The supernatant was collected and HDLc was tested.
• Calculations (Naito,1984)
With calibrator
(A) Sample -
-------------------- x 200 (calibrator conc.) = mg/dL HDL-C in the sample
(A) Calibrator
With Factor:
A505 nm Sample x 320 = mg/Dl HDL-C in the sample.
A546 nm Sample x 475 = mg/Dl HDL-C in the sample
• Calculation of LDL-cholesterol
According to the Friedewald Formula (Naito, 1984).:
LDL cholesterol = Total cholesterol - Triglycerides x HDL cholesterol
-------------------
5
• Reference Values
HDL-cholesterol:
Men Women
Lower risk > 55 mg/dL > 65 mg/dL
Standard risk 35-55 mg/dL 45-65 mg/dL
Increased risk < 35 mg/dL < 45 mg/dL
LDL-cholesterol:
Suspected above : 150 mg/dL
Increased above : 190 mg/dL
g) Quantitative determination of creatinine
• Principle of the method
The assay is based on the reaction of creatinine with sodium picrate (Jaffé’s fluid).
Creatinine reacts with alkaline picrate forming a red complex. The time interval
chosen for measurements avoids interferences from other serum constituents. The
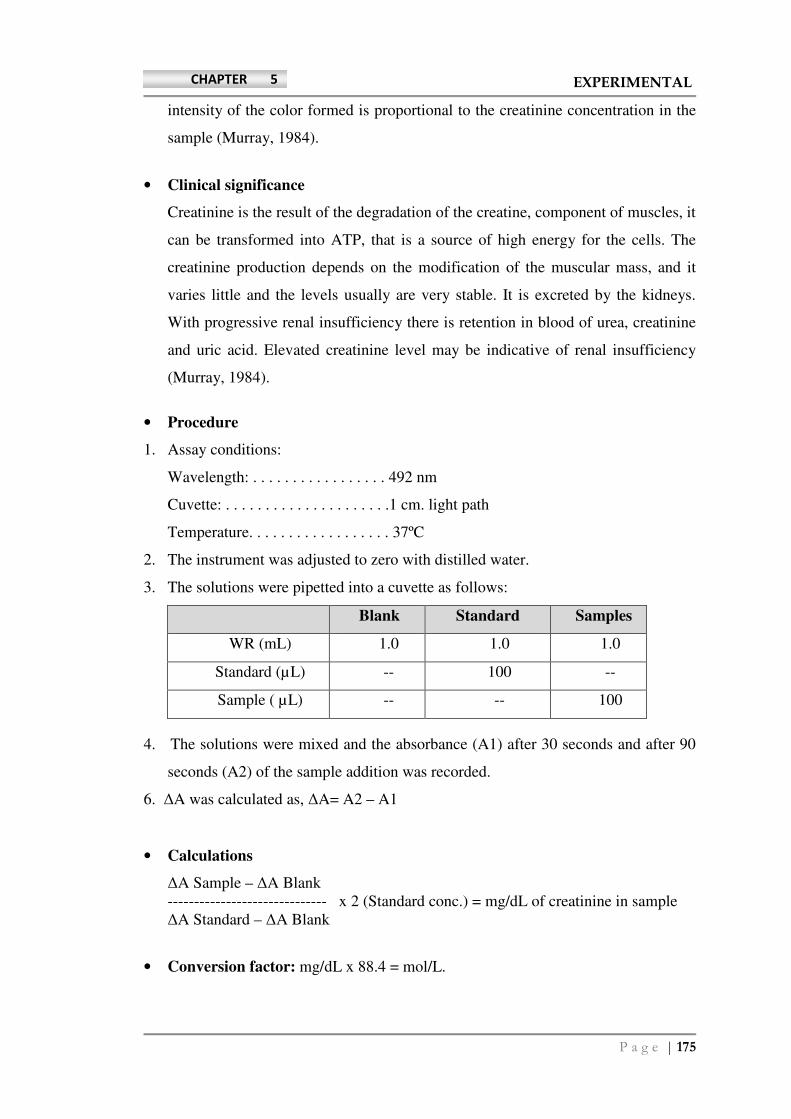
P a g e | 175
CHAPTER 5 EXPERIMENTAL
intensity of the color formed is proportional to the creatinine concentration in the
sample (Murray, 1984).
• Clinical significance
Creatinine is the result of the degradation of the creatine, component of muscles, it
can be transformed into ATP, that is a source of high energy for the cells. The
creatinine production depends on the modification of the muscular mass, and it
varies little and the levels usually are very stable. It is excreted by the kidneys.
With progressive renal insufficiency there is retention in blood of urea, creatinine
and uric acid. Elevated creatinine level may be indicative of renal insufficiency
(Murray, 1984).
• Procedure
1. Assay conditions:
Wavelength: . . . . . . . . . . . . . . . . . 492 nm
Cuvette: . . . . . . . . . . . . . . . . . . . . .1 cm. light path
Temperature. . . . . . . . . . . . . . . . . . 37ºC
2. The instrument was adjusted to zero with distilled water.
3. The solutions were pipetted into a cuvette as follows:
Blank Standard Samples
WR (mL) 1.0 1.0 1.0
Standard (µL) -- 100 --
Sample ( µL) -- -- 100
4. The solutions were mixed and the absorbance (A1) after 30 seconds and after 90
seconds (A2) of the sample addition was recorded.
6. ∆A was calculated as, ∆A= A2 – A1
• Calculations
∆A Sample – ∆A Blank
------------------------------ x 2 (Standard conc.) = mg/dL of creatinine in sample
∆A Standard – ∆A Blank
• Conversion factor: mg/dL x 88.4 = mol/L.
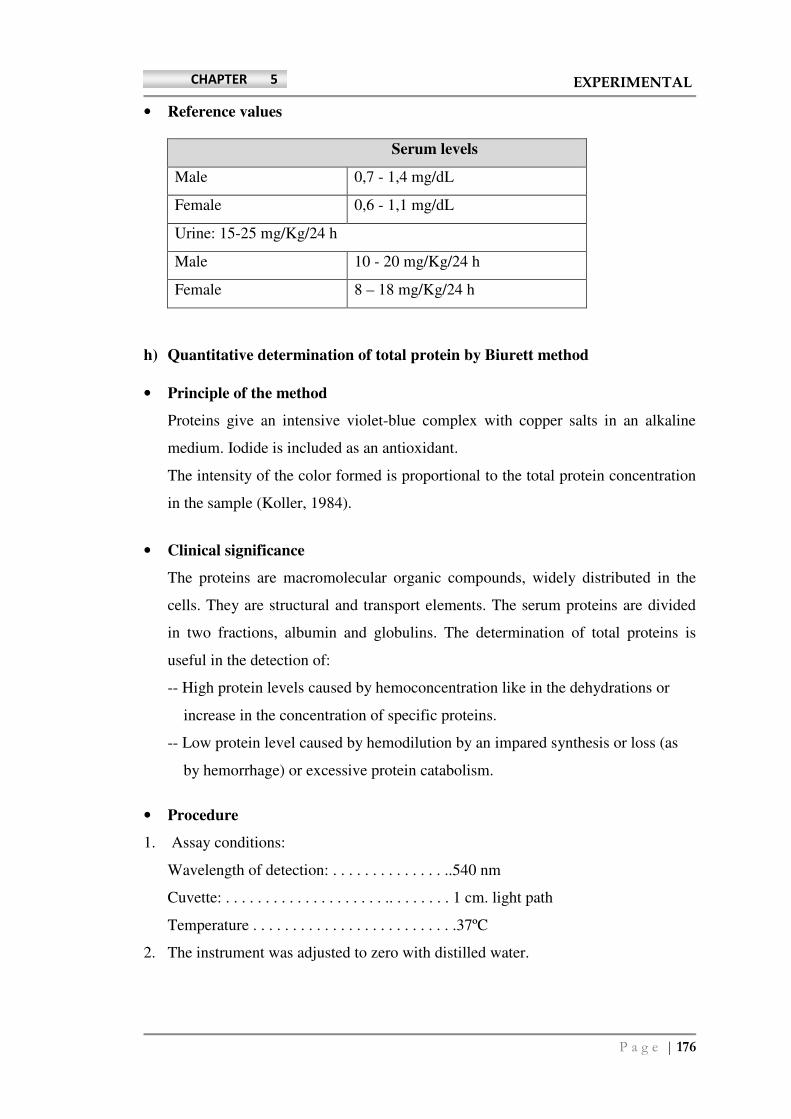
P a g e | 176
CHAPTER 5 EXPERIMENTAL
• Reference values
Serum levels
Male 0,7 - 1,4 mg/dL
Female 0,6 - 1,1 mg/dL
Urine: 15-25 mg/Kg/24 h
Male 10 - 20 mg/Kg/24 h
Female 8 – 18 mg/Kg/24 h
h) Quantitative determination of total protein by Biurett method
• Principle of the method
Proteins give an intensive violet-blue complex with copper salts in an alkaline
medium. Iodide is included as an antioxidant.
The intensity of the color formed is proportional to the total protein concentration
in the sample (Koller, 1984).
• Clinical significance
The proteins are macromolecular organic compounds, widely distributed in the
cells. They are structural and transport elements. The serum proteins are divided
in two fractions, albumin and globulins. The determination of total proteins is
useful in the detection of:
-- High protein levels caused by hemoconcentration like in the dehydrations or
increase in the concentration of specific proteins.
-- Low protein level caused by hemodilution by an impared synthesis or loss (as
by hemorrhage) or excessive protein catabolism.
• Procedure
1. Assay conditions:
Wavelength of detection: . . . . . . . . . . . . . . ..540 nm
Cuvette: . . . . . . . . . . . . . . . . . . . . .. . . . . . . . 1 cm. light path
Temperature . . . . . . . . . . . . . . . . . . . . . . . . . .37ºC
2. The instrument was adjusted to zero with distilled water.
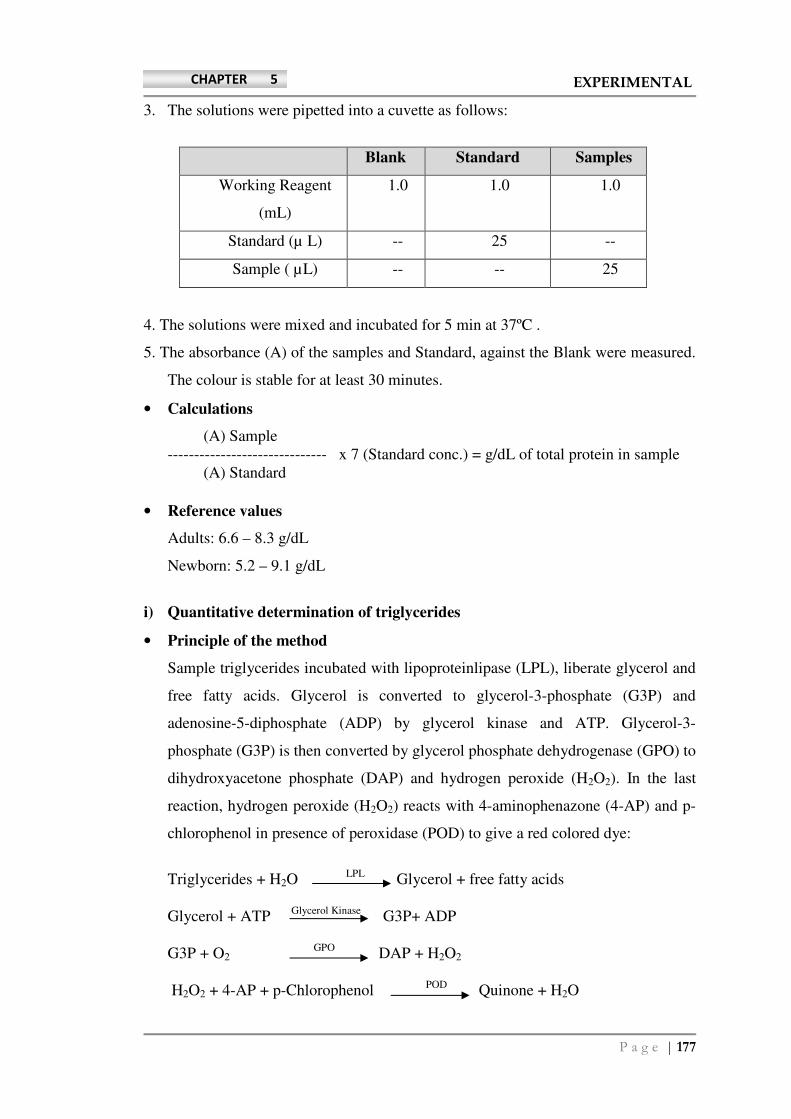
P a g e | 177
CHAPTER 5 EXPERIMENTAL
3. The solutions were pipetted into a cuvette as follows:
Blank Standard Samples
Working Reagent
(mL)
1.0 1.0 1.0
Standard (µ L) -- 25 --
Sample ( µL) -- -- 25
4. The solutions were mixed and incubated for 5 min at 37ºC .
5. The absorbance (A) of the samples and Standard, against the Blank were measured.
The colour is stable for at least 30 minutes.
• Calculations
(A) Sample
------------------------------ x 7 (Standard conc.) = g/dL of total protein in sample
(A) Standard
• Reference values
Adults: 6.6 – 8.3 g/dL
Newborn: 5.2 – 9.1 g/dL
i) Quantitative determination of triglycerides
• Principle of the method
Sample triglycerides incubated with lipoproteinlipase (LPL), liberate glycerol and
free fatty acids. Glycerol is converted to glycerol-3-phosphate (G3P) and
adenosine-5-diphosphate (ADP) by glycerol kinase and ATP. Glycerol-3-
phosphate (G3P) is then converted by glycerol phosphate dehydrogenase (GPO) to
dihydroxyacetone phosphate (DAP) and hydrogen peroxide (H2O2). In the last
reaction, hydrogen peroxide (H2O2) reacts with 4-aminophenazone (4-AP) and p-
chlorophenol in presence of peroxidase (POD) to give a red colored dye:
Triglycerides + H2O LPL
Glycerol + free fatty acids
Glycerol + ATP Glycerol Kinase
G3P+ ADP
G3P + O2 GPO
DAP + H2O2
H2O2 + 4-AP + p-Chlorophenol POD
Quinone + H2O
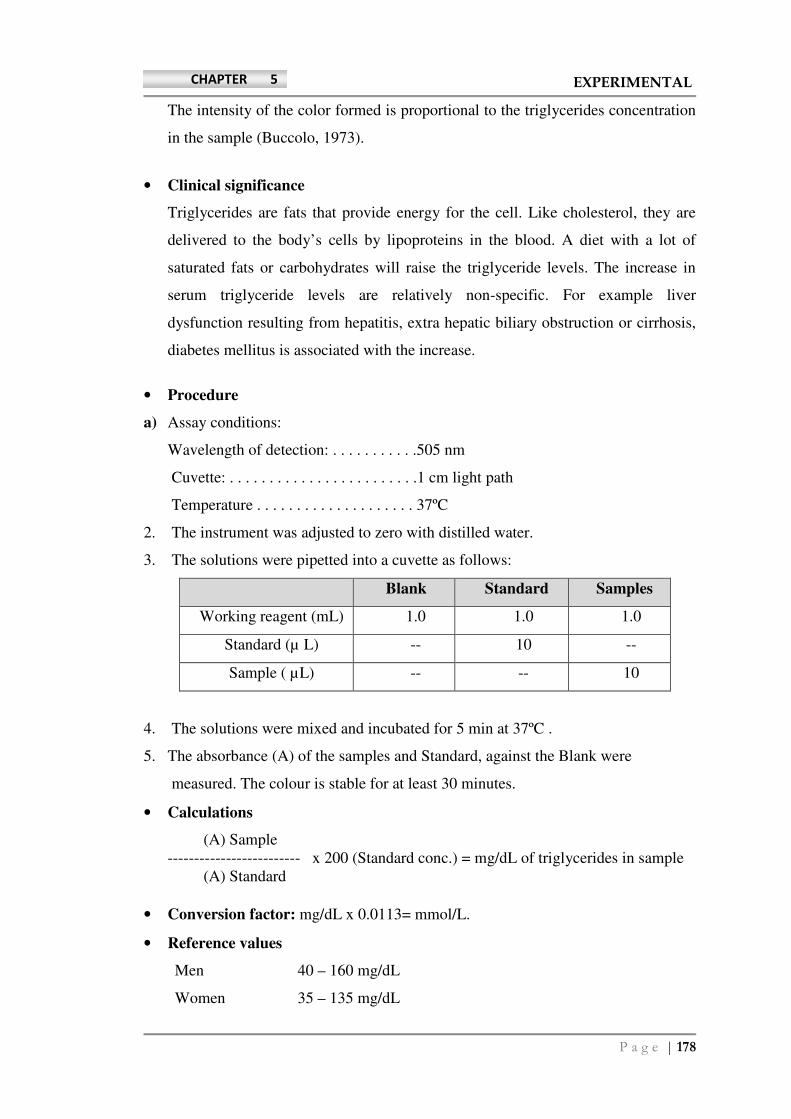
P a g e | 178
CHAPTER 5 EXPERIMENTAL
The intensity of the color formed is proportional to the triglycerides concentration
in the sample (Buccolo, 1973).
• Clinical significance
Triglycerides are fats that provide energy for the cell. Like cholesterol, they are
delivered to the body’s cells by lipoproteins in the blood. A diet with a lot of
saturated fats or carbohydrates will raise the triglyceride levels. The increase in
serum triglyceride levels are relatively non-specific. For example liver
dysfunction resulting from hepatitis, extra hepatic biliary obstruction or cirrhosis,
diabetes mellitus is associated with the increase.
• Procedure
a) Assay conditions:
Wavelength of detection: . . . . . . . . . . .505 nm
Cuvette: . . . . . . . . . . . . . . . . . . . . . . . .1 cm light path
Temperature . . . . . . . . . . . . . . . . . . . . 37ºC
2. The instrument was adjusted to zero with distilled water.
3. The solutions were pipetted into a cuvette as follows:
Blank Standard Samples
Working reagent (mL) 1.0 1.0 1.0
Standard (µ L) -- 10 --
Sample ( µL) -- -- 10
4. The solutions were mixed and incubated for 5 min at 37ºC .
5. The absorbance (A) of the samples and Standard, against the Blank were
measured. The colour is stable for at least 30 minutes.
• Calculations
(A) Sample
------------------------- x 200 (Standard conc.) = mg/dL of triglycerides in sample
(A) Standard
• Conversion factor: mg/dL x 0.0113= mmol/L.
• Reference values
Men 40 – 160 mg/dL
Women 35 – 135 mg/dL
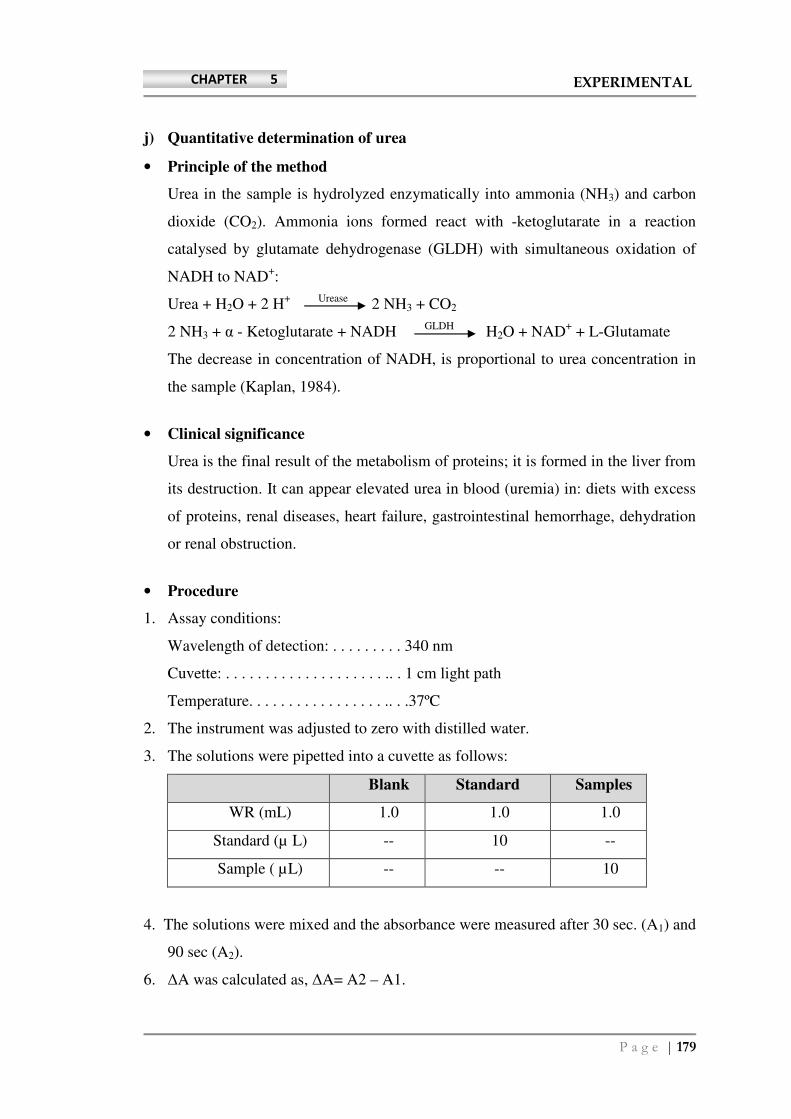
P a g e | 179
CHAPTER 5 EXPERIMENTAL
j) Quantitative determination of urea
• Principle of the method
Urea in the sample is hydrolyzed enzymatically into ammonia (NH3) and carbon
dioxide (CO2). Ammonia ions formed react with -ketoglutarate in a reaction
catalysed by glutamate dehydrogenase (GLDH) with simultaneous oxidation of
NADH to NAD+:
Urea + H2O + 2 H+
Urease 2 NH3 + CO2
2 NH3 + α - Ketoglutarate + NADH GLDH
H2O + NAD+ + L-Glutamate
The decrease in concentration of NADH, is proportional to urea concentration in
the sample (Kaplan, 1984).
• Clinical significance
Urea is the final result of the metabolism of proteins; it is formed in the liver from
its destruction. It can appear elevated urea in blood (uremia) in: diets with excess
of proteins, renal diseases, heart failure, gastrointestinal hemorrhage, dehydration
or renal obstruction.
• Procedure
1. Assay conditions:
Wavelength of detection: . . . . . . . . . 340 nm
Cuvette: . . . . . . . . . . . . . . . . . . . . .. . 1 cm light path
Temperature. . . . . . . . . . . . . . . . . .. . .37ºC
2. The instrument was adjusted to zero with distilled water.
3. The solutions were pipetted into a cuvette as follows:
Blank Standard Samples
WR (mL) 1.0 1.0 1.0
Standard (µ L) -- 10 --
Sample ( µL) -- -- 10
4. The solutions were mixed and the absorbance were measured after 30 sec. (A1) and
90 sec (A2).
6. ∆A was calculated as, ∆A= A2 – A1.
P a g e | 180
CHAPTER 5 EXPERIMENTAL
• Calculations
∆A Sample
------------------------------ x 50 (Standard conc.) = mg/dL of urea in sample
∆A Standard
10 mg/L urea blood urea nitrogen (BUN) divided by 0.466 = 21 mg/L urea = 0.36
mmol/L urea1.
• Conversion factor: mg/dL x 0.1665 = mmol/L.
• Reference values Serum : 15- 45 mg/dL (2.49-7.49 mmol/L)
Urine : 20 - 35 gr/24 h.
k) Quantitative determination of glycohemoglobin In Blood
• Principle
Glycosylated hemoglobin (GHb) has been defined operationally as the fast
fraction hemoglobins HbA1 (Hb A1a, A1b,A1c ) which elute first during column
chromatography. The non - glycosylated hemoglobin, which consists of the bulk
of hemoglobin, has been designated HbAo. A hemolysed preparation of whole
blood is mixed continuously for 5 minutes with a weakly binding cation-exchange
resin. The labile fraction is eliminated during the hemolysate preparation and
during the binding. During this mixing, HbAo binds to the ion exchange resin
leaving GHb free in the supernatant. After the mixing period, a filter separator is
used to remove the resin from the supernatant. The percent glycosylated
hemoglobin is determined by measuring absorbances of the ratio of the
absorbances of the glycosylated hemoglobin (GHb) and the total hemoglobin
fraction of the control and the test is used to calculate the % GHb of the sample
(Trivelli, 1971).
• Normal Reference Values
Normal : < 8.0 %
Good control : 8.0 - 9.0 %
Fair control : 9.0 - 10.0 %
Poor control : > 10.0 %
P a g e | 181
CHAPTER 5 EXPERIMENTAL
• Procedure
Wavelength of detection : 415 nm
Temperature : R.T.
Light path : 1 cm
• Hemolysate Preparation
1. About 0.5 ml of Lysing Reagent was added into tubes labeled as Control (C) and
Test (T).
2. About 0.1ml of the reconstituted control was added and mixed well with blood
sample into the appropriately labeled tubes until complete lysis was evident. The
mixture was allowed to stand for 5 minutes.
• Glycosylated hemoglobin (GHb) Separation
1. The Ion-Exchange Resin tubes were labelled as Control and Test.
2. About 0.1 ml of the hemolysate from Step A was added into the appropriately
labeled Ion Exchange Resin tubes.
3. A resin Separator was inserted into each tube, approximately 1 cm above the liquid
level of the resin suspension.
4. The tubes were mixed on a vortex mixer continuously for 5 minutes.
5. The resin was allowed to settle, and the resin separator was pushed into the tubes
until the resin was firmly packed.
6. Each supernatant was aspirated directly into a cuvette and absorbance of each was
measured against distilled water.
• Total Hemoglobin (THb) fraction
1. About 5.0 ml of distilled water was dispensed into tubes labeled as Control and
Test. To the above mentioned tubes 0.02 ml of hemolysate from Step A was added
into the appropriately labeled tube and mixed.
3. Each absorbance was measured against distilled water.
• Calculations
Ratio of Control (RC) = Abs. Control GHb / Abs. Control THb
Ratio of Test (RT) = Abs. Test GHb / Abs. Test THb
% GHb = [Ratio of Test (RT) / Ratio of Control (RC ) ] x 10 (Value of Control)
P a g e | 182
CHAPTER 5 EXPERIMENTAL
l) Radio immuno assay of Insulin using rat serum samples
• Principle
Human insulin is a polypeptide hormone that originates in the ß-cells of the
pancreas and serves as a principal regulator for the storage and production of
carbohydrates. Its secretion is normally stimulated by increases in the amount of
glucose in the circulation.
Insulin radioimmunoassay (RIA) is a double-antibody batch method. Insulin in the
specimen competes with a fixed amount of 125
I-labelled insulin for the binding
sites of the specific insulin antibodies. Bound and free insulin are separated by
adding a second antibody, centrifuging, and decanting. The radioactivity in the
pellet is then measured. The radioactivity is inversely proportional to the quantity
of insulin in the specimen.
This test is used to measure insulin levels in the bloodstream and is also useful in
determining pancreatic ß-cell activity. Conditions such as obesity, a high-
carbohydrate diet, and inactivity tend to increase expected normal values. Values
are found to be elevated shortly after food intake and in cases of acromegaly,
Cushing's syndrome, and thyrotoxicosis.
• Procedure
There is an antigen - antibody reaction between the antigen (Hormone) of interest
and its specific antibodies raised from laboratory animals. The quantum of
antigen-antibody binding is monitored using a radiolabelled antigen or antibody.
The RIA kit contains test tubes which have been coated with the antibody. To
these tubes, standards and samples were added along with the tracer. The contents
were incubated for 2 hours and the contents of the tubes were decanted. The tubes
were washed with the wash solution provided in the kit and the counting was
carried out in a gamma counter. The counts obtained for known standards used in
the assay were utilised for generating a dose - response curve and the unknown
concentration in serum samples were extrapolated from the data (Hales,
1963). The schematic representation of the RIA assay procedure is given in figure
5.19.

P a g e | 183
CHAPTER 5 EXPERIMENTAL
Figure 5.19: Assay procedure for RIA
• Preparation of synthetic serum:
γ Globulin (2%)+Bovine serum albumin(4%), diluted with double distilled
water. Sufficient volume was prepared based on the assay requirement.
• Preparation of working standard for constructing standard curve:
* Prepared from 200 µU/mL insulin stock
Insulin
Standard
Standard A
(mL)
Assay buffer
(mL)
Insulin concentration
(µIU/mL)
B 1 1 100
C 0.5 1.5 50
D 0.5 3.5 25
E 0.5 7.5 12.5
F 0.3 7.7 7.5
G 0.5 0.5 of F
(7.5 µIU/mL)
3.75
Contents of the tubes were mixed using vortex mixer, covered with aluminium
foil and incubated overnight at 2-4 0 C in refrigerator. After adding tracer, the
samples were incubated for 3 hrs. At the final step after centrifugation,
supernatant was decanted. The radio activity of precipitate antigen antibody
complex was measured using multiwell radio activity counter.

P a g e | 184
CHAPTER 5 EXPERIMENTAL
5.10 DEVELOPMENT OF FORMULATION OF ETHANOL EXTRACT OF
CASHEW TESTA
5.10.1 Introduction
Herbal medicines are widely used in conventional as well as alternative medical
practices in many countries, both developed and developing. Although herbal
medicines have been used by the people for centuries, they have not yet been
developed to a level as to serve as a substitute or complementary to synthetic
drugs.
WHO has issued general guidelines to assist in ensuring the safety and efficacy of
Complementary and Alternative Medicines (CAM) products. These include
suitable plant identification tests (physical and/or chemical) and if possible,
chromatograms of the purported active/s or marker compound/s present in
products should be provided. Alternatively, characteristic fingerprints of the plant
material used in the products are essential to prove botanical authenticity.
The USP (2005) has included some plant products in a section devoted to dietary
supplements. Although a monograph for solid oral dosage forms has not been
included, the USP does specify that some formulated dietary supplements such as
Glucosamine tablets should undergo dissolution and weight variation testing or in
some cases, only weight variation and disintegration testing are required such as
for the specifications for American Ginseng tablets. The general test scheme for
dietary supplements and pharmaceutical medicines is shown in Table 5.3
(Löbenburg, 2005). Hence, whilst several of the tests for the QC of dietary
supplements in the USA have recently been described in the USP as shown in the
table below, mandatory testing for those criteria has not yet been implemented.
This situation is similar in other countries as well making some of those tests
optional rather than mandatory.
P a g e | 185
CHAPTER 5 EXPERIMENTAL
Table 5.3: Pharmaceutical test scheme for pharmaceuticals and dietary
supplements (Löbenburg,2005)
Pharmaceuticals Dietary supplements
<301> Acid-neutralizing capacity <1216> Tablet friability
<701> Disintegration <2040> Disintegration and
dissolution of dietary
supplements
<711> Dissolution <2091> Weight variation
<724> Drug release <2750> Manufacturing practices
of dietary
supplements
<785> Osmolarity <2090> Weight variations of
dietary supplements
<905> Uniformity of dosage forms
----
<1087> Intrinsic dissolution
----
<1088> In vitro and in vivo
dissolution evaluation
of dosage forms
----
<1090> In vivo bioequivalence guide
----
<1216> Tablet friability ----
The numbers in < > refer to the specific sections in the USP 28 (2005)
5.10.2 Classification of herbal preparations
The International Pharmaceutical Federation (FIP) has published guidelines for
the classification of herbal preparations according to the amount of information
available on the efficacy and chemical composition of the product.
As per these guidelines, herbal preparations can be broadly classified into the
following categories:
1. Extracts in which the known/accepted pharmacological activity is assigned
solely to a single or group of constituents. Standardization may be achieved by
adjusting the level of actives by addition of inert excipients or extracts which
have higher or lower levels of the desired active compounds.
2. Extracts where the pharmacological effects are associated with constituents or
groups of constituents which synergistically contribute to the desired effect of

P a g e | 186
CHAPTER 5 EXPERIMENTAL
which the mechanism is largely unknown i.e. active marker/s have been identified.
Standardization can be achieved by blending batches of either raw botanical
materials or herbal preparations of higher and lower quality but the addition of
inert excipients is not permitted.
3. Extracts where there is no documented evidence of an identified active constituent
which is responsible for the therapeutic effect. Chemical compounds which may
not contribute to any pharmacological activity are then selected as markers for
GMP purposes (Westerhoff, 2002; Lang, 2001).
According to the European Agency for the Evaluation of Medicinal products
(EMEA), preparations which fall under categories 2 and 3 as well as immediate-
release formulations are exonerated from dissolution testing. In addition, in
preparations where the active constituent is highly soluble in aqueous media
which have pH values consistent with that of the GIT, disintegration testing is
then a sufficient indicator of GMP.
5.10.3 Background for the development of immediate release Tablet
Ethanol extract of cashew testa exhibited significant antioxidant and antidiabetic
activity in various in vivo and in vitro models including the studies performed on
cell lines in the research work reported in the present compilation in section 5.8-
5.93 and 6.8-6.93. Thus, an attempt was made to design and develop an economic,
effective formulation from the bioactive extract.
Moreover, tablets are the most common solid oral dosage forms for many reasons
including ease of manufacturing, convenience for the patient, accurate dose
administration, and better stability than liquids and parenteral dosage forms.
Direct compression is the simplest and most economical method for the
manufacturing of tablets because it requires less processing steps than other
techniques such as wet granulation and roller compaction.
5.10.4 Methodology
• Equipments used
UV- Visible spectrophotometer, Jasco V-530; Roche tablet friabilator, Dissolution
P a g e | 187
CHAPTER 5 EXPERIMENTAL
tester USP (XXIII) - Electrolab TDT-06T, Monsanto tablet Hardness tester -
Campbell electronics, Mumbai. Vernier Caliper-Mitutoyo, Japan.
• Preparation of the dry powder extract (DPE) for tablet formulation
Dry plant extracts usually lack good flow properties to be processed by direct
compression. In addition, because the active components of the extracts are
diluted by coextracted substances, high dosages are required. This is in conflict
with the limited proportion in which the extracts can be incorporated into the final
mixture for tablet compression (Vennat, 1993). Numerous reports have addressed
techniques used to solve these problems, such as wet granulation with non-
aqueous solvents (Diaz, 1996), direct compression of spray-dried extracts
(Plazier-Vercamen, 1986) and selection of suitable excipients for the formulation
of dry plant extracts in direct compression tablets (Renoux, 1996).
The crude ethanol extract of testa of cashew was defatted three times with n-
hexane. The extract was then dried. The dried ethanol extract was mixed with
various excipients to obtain a non-adherent and free-flowing dry extract powder.
The amount of dibasic calcium phosphate (DCP) was optimized to 10%, to obtain
a free flowing powder blend based upon the water sorption properties of 6, 8, 10,
12 and 14 % w/w of DCP.
A. Pre-compression Parameters (Micrometric evaluation) (Renoux, 1996)
1. Determination of Water uptake characteristics (moisture sorption study in
desiccators)
Many drug substances, particularly plant extracts, have a tendency to adsorb
moisture. The adsorption and equilibrium moisture content can depend upon
different factors such as the atmospheric humidity, temperature, surface area,
exposure time and the mechanism for moisture uptake. With most hygroscopic
materials, changes in moisture level can greatly influence many important
parameters, including chemical stability, flow properties and compatibility. The
effects of moisture on various physical properties such as angle of repose, bulk
and true densities, porosity and compression properties of various plant extracts
have been reported with different authors (Mishra, 1996).
P a g e | 188
CHAPTER 5 EXPERIMENTAL
The addition of DCP to the crude extract decreases the hygroscopicity. Powder
beds of 1.0 g of the dry extract preparations containing 2, 4, 6, 8, and 10 % w/w of
DCP were prepared in petri dishes and stored at 25° C in desiccators. The
moisture content of the various extract preparations was measured at 24 hrs
intervals for 15 days.
Based on the results of the moisture content studies, the dry extract preparation
containing 10% DCP was selected for tablet formulation. Hence, density, flow
property and compressibility of this dry extract blend were further investigated.
2. Density
• Bulk (poured) density
Bulk density was measured according to the European Pharmacopoeia (European
Pharmacopoeia, 2005). 150 g of dry powder blend was filled without compacting
into a 250 mL graduated cylinder using a powder funnel and was weighed to ± 0.1
g (m). The unsettled volume (V0) was read to ± 1 mL and the bulk density was
calculated as the quotient m/V0. Measurements were performed in triplicate and
the mean value was calculated
• Tapped density
A settling apparatus (model STAV 2003, J. Engelsmann AG) was used to measure
the tapped density. The settled volume was read after 500 (V500) and 1250 taps
(V1250). Another 1250 taps were carried out when the difference between V500
and V1250 was greater than 2 mL. The tapped density (g/mL) was expressed as
the quotient of m/V1250 or m/V2500. Measurements were performed in triplicate
and the mean value was calculated (Rai, 1995).
Carr compressibility index, CC % = [(tapped density – bulk density)/bulk
density]*100
and Hausner ratio, HR = [tapped density/bulk density] were calculated from the
bulk and tapped density results.
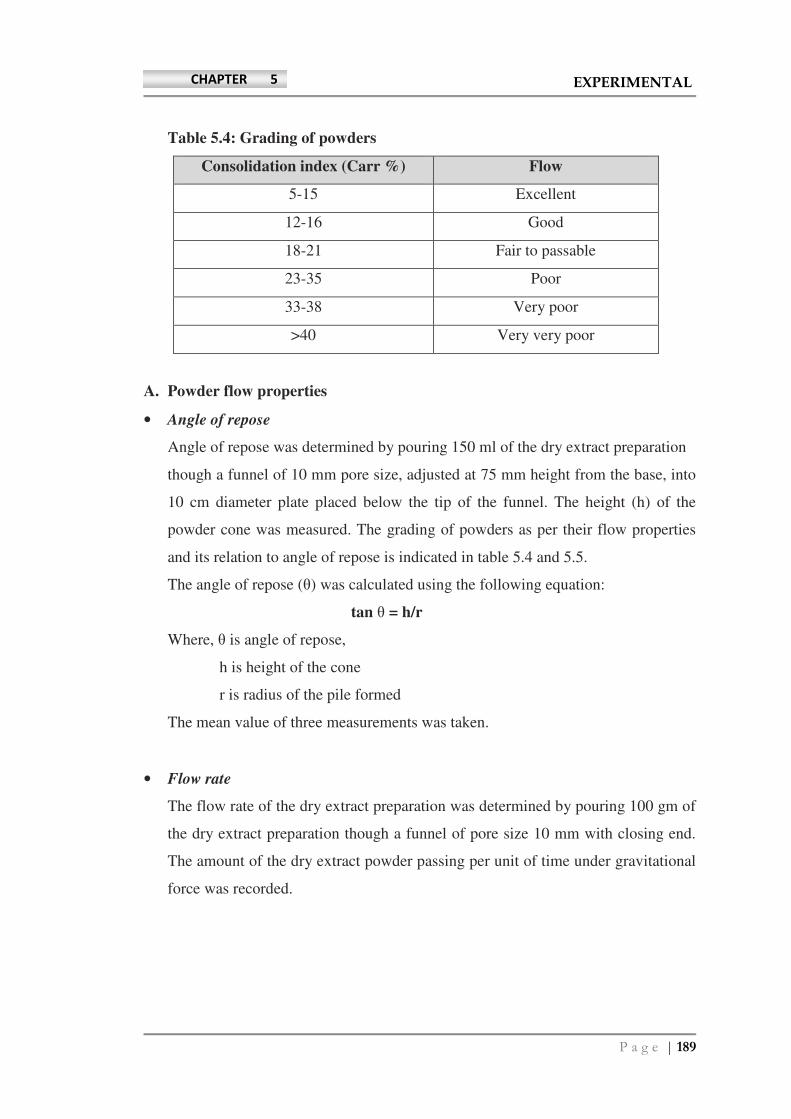
P a g e | 189
CHAPTER 5 EXPERIMENTAL
Table 5.4: Grading of powders
Consolidation index (Carr %) Flow
5-15 Excellent
12-16 Good
18-21 Fair to passable
23-35 Poor
33-38 Very poor
>40 Very very poor
A. Powder flow properties
• Angle of repose
Angle of repose was determined by pouring 150 ml of the dry extract preparation
though a funnel of 10 mm pore size, adjusted at 75 mm height from the base, into
10 cm diameter plate placed below the tip of the funnel. The height (h) of the
powder cone was measured. The grading of powders as per their flow properties
and its relation to angle of repose is indicated in table 5.4 and 5.5.
The angle of repose (θ) was calculated using the following equation:
tan θ = h/r
Where, θ is angle of repose,
h is height of the cone
r is radius of the pile formed
The mean value of three measurements was taken.
• Flow rate
The flow rate of the dry extract preparation was determined by pouring 100 gm of
the dry extract preparation though a funnel of pore size 10 mm with closing end.
The amount of the dry extract powder passing per unit of time under gravitational
force was recorded.

P a g e | 190
CHAPTER 5 EXPERIMENTAL
Table 5.5: Relationship between angle of repose and flow properties
Angle of repose (θ) In degrees Flow
<25 Excellent
25-30 Good
30-40 Passable
>40 Very poor
B. Determination of the dose for the formulation
Based upon the effective dose reported for the extract and the results of
antidiabetic activity in rats, the dose of the extract in formulation was extrapolated
to 350 mg twice a day. In each tablet the amount of extract incorporated was 187
mg.
C. Formulation of Tablet
Various ingredients were added to the dry extract powder prepared previously and
proportions of various excipients added were optimized. All ingredients were
passed through mesh 60 # before use. Before the compression process the
hardness was adjusted by altering the pressure applied for compression. The dry
powder blend equivalent to 187 mg of extract (i.e 50mg of blend) was used for
compression in single punch direct compression machine with 10.5 mm punch.
As indicated in Table 5.6, the codes F1- F6 represent the formulations prepared
for optimization of various ingredients in the tablet.
D. Post Compression parameters (Vennat, 1993; European Pharmacopoeia 2005)
• Shape and color of tablets
Tablets were observed for color and shape under a lens by placing the tablets in
light.
• Uniformity of thickness
Three tablets were selected randomly from each batch of formulation and
thickness was measured individually with dial caliper (Mitutoyo, Japan). The
thickness was measured in mm and standard deviation was also calculated.
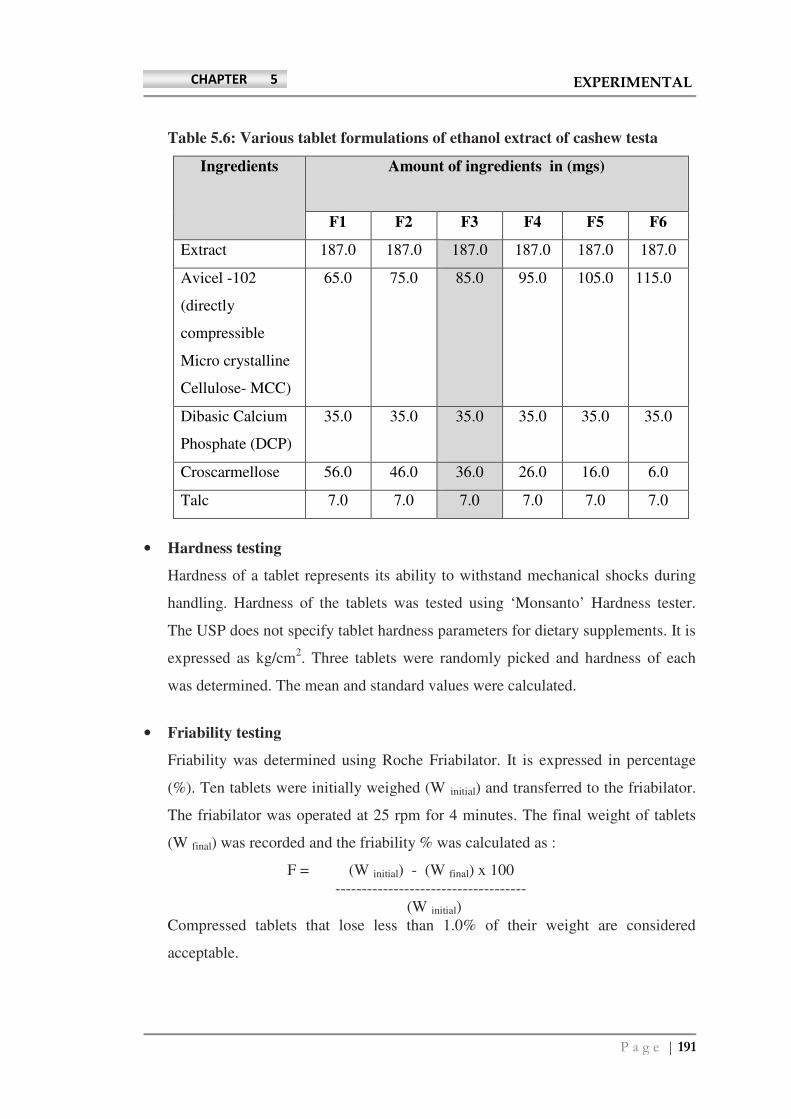
P a g e | 191
CHAPTER 5 EXPERIMENTAL
Table 5.6: Various tablet formulations of ethanol extract of cashew testa
Ingredients Amount of ingredients in (mgs)
F1 F2 F3 F4 F5 F6
Extract 187.0 187.0 187.0 187.0 187.0 187.0
Avicel -102
(directly
compressible
Micro crystalline
Cellulose- MCC)
65.0 75.0 85.0 95.0 105.0 115.0
Dibasic Calcium
Phosphate (DCP)
35.0 35.0 35.0 35.0 35.0 35.0
Croscarmellose 56.0 46.0 36.0 26.0 16.0 6.0
Talc 7.0 7.0 7.0 7.0 7.0 7.0
• Hardness testing
Hardness of a tablet represents its ability to withstand mechanical shocks during
handling. Hardness of the tablets was tested using ‘Monsanto’ Hardness tester.
The USP does not specify tablet hardness parameters for dietary supplements. It is
expressed as kg/cm2. Three tablets were randomly picked and hardness of each
was determined. The mean and standard values were calculated.
• Friability testing
Friability was determined using Roche Friabilator. It is expressed in percentage
(%). Ten tablets were initially weighed (W initial) and transferred to the friabilator.
The friabilator was operated at 25 rpm for 4 minutes. The final weight of tablets
(W final) was recorded and the friability % was calculated as :
F = (W initial) - (W final) x 100
------------------------------------
(W initial)
Compressed tablets that lose less than 1.0% of their weight are considered
acceptable.

P a g e | 192
CHAPTER 5 EXPERIMENTAL
• Weight Variation
The weight variation tolerance for uncoated and film-coated botanical dosage
forms as specified in the USP 28 (<2091>) [240] was used to compare various
batches of tablets used in the validation of previously described methods.
According to the USP, 20 tablets of each dosage form must be weighed
individually and not more than 2 of the tablets are permitted to deviate from the
mean by more than 7.5% (United States Pharmacopeia, 2005).
• Content uniformity testing
Two tablets were weighed, powdered and powder equivalent to 187 mg of extract
was transferred to 100.0 ml volumetric flask. To it, 0.1M HCl (pH 1.2) was added
upto the mark. The flask was kept in a sonicator for 10 min to facilitate effective
extraction of drug. The solution was then filtered and 10.0 ml of the filtrate was
taken and diluted with 0.1M HCl to prepare appropriate working solutions. The
absorbance of the solution was determined spectrophotometrically at 273 nm
(United States Pharmacopeia, 2005).
• Disintegration Test
Tablet disintegration was determined according the specifications for uncoated
and film-coated tablets in the USP 28 (<2040>) [240], using Apparatus A.
Distilled water, maintained at 37 ± 0.5°C was used as the immersion fluid. One
tablet was placed in each of the six baskets and then raised and lowered vertically
at a constant frequency within the disintegration medium for the allocated time
period. According to the USP, 6 tablets should disintegrate completely within 20
minutes. If 1 or 2 of these tablets fail to disintegrate, the same test should be
repeated on an additional 12 tablets. Of the 18 tablets tested, 16 must disintegrate
completely within 20 minutes in order to meet the requirements. The time in
seconds taken for complete disintegration of the tablet with no palpable mass
remaining in the apparatus was measured and recorded (United States
Pharmacopeia, 2005).
• Dissolution conditions
Dissolution tests were performed using the Type 2 (Paddle) apparatus of the USP
28 (<711>). Each of the 8 vessels contained 900 ml of the appropriate dissolution
P a g e | 193
CHAPTER 5 EXPERIMENTAL
media and the temperature of the vessel contents was maintained at 37 ± 0.5°C.
The rotation speed of the paddles was 100 rpm. Volume adjustments of the media
were made by replacement of the withdrawn sample volume with fresh buffer at
the same pH.
A 0.1 M HCl solution was used for the dissolution medium at pH 1.2. The
reference standard, catechin representing typical amounts the tablets were added
to investigate the solubility of these components under the conditions of the
dissolution tests. The conditions of Dissolution were as follows:
Dissolution medium: 0.1 N HCl
Temperature: 370
C ± 10C
RPM: 100
Volume withdrawn for every time point: 10 ml
λmax : 273 nm
• Stability testing
The stability of a formulation is defined as its ability to remain within its physical,
chemical, therapeutic and toxicological specifications within a particular
container.
The purpose of stability determination is to provide evidence on how the equality
of a drug substance or a drug product varies with time under the influence of a
variety of environmental conditions such as humidity, temperature, and light and
enables recommended storage conditions, re-test periods and shelf lives to be
established.
ICH guidelines mention the length of study and storage condition:
Long term testing 25 ± 20 C / 60
0 % ± 5% RH for 12 months
Accelerated testing 40 ± 20 C / 75
0 % ± 5% RH for 6 months
In the present study, stability studies were carried out at 25 ± 20 C / 60
0 % ± 5%
RH and 40 ± 20 C / 75
0 % ± 5% RH for a period of 3 months.