Solvency II for Pensions - J.P. Morgan Asset … · Solvency II for pensions | 3 Quantitative...
18
UK | January 2012 Solvency II for Pensions FOR INSTITUTIONAL INVESTOR USE ONLY – NOT FOR RETAIL USE OR DISTRIBUTION The recently published – and cryptically titled – “Call for Advice on the review of Directive 2003/41/EC: second consultation” has served to heat up the debate over the future for European prudential regulatory reform. In particular, this 517-page document raises the possibility of the inclusion of Solvency II-style rules in the supervision of pension schemes. In this paper we provide a brief summary of the Solvency II framework and look at the way in which EIOPA (European Insurance and Occupational Pensions Authority) proposes that this framework be adapted for European pension schemes. Further, we consider the impact that these changes may have on the UK pensions landscape. As the title of the call for advice suggests, the result of this consultation is intended to replace an existing directive which was ratified in 2003. The 2003 directive was implemented through legislation in individual European countries, and the same would be true for any new directive. The revised directive covers Institutions for Occupational Retirement Provision (“IORPs”), defined broadly as all funded defined benefit and defined contribution pension schemes. Proposed changes to the scope of the directive should not materially impact UK pension schemes – essentially, the definition has been widened to cover schemes which are not currently subject to regulation within the EU. In work referenced by the call for advice, no UK pension schemes were identified as not currently falling under the scope of some form of EU prudential regulation, whether through this or other directives. As the underlying directive is still early in its development, much of the analysis below will be subject to revision and clarification in the coming years. However, it is still important to understand the proposed changes and their implications, in order to help EIOPA develop requirements that are appropriate for the UK pensions industry. As such, we hope that the following paper will put its readers in a position whereby they can understand proposed changes. Owing to the great complexity inherent in defined benefit (“DB”) schemes and the directive’s approach to DB, our focus is primarily on the effects on these schemes and their sponsors. It is worth noting, though, that defined contribution (“DC”) schemes remain in scope for the directive and as such would have to comply with the regulations, as appropriate, including holding additional capital over scheme assets to mitigate the effects of operational risk.
Transcript of Solvency II for Pensions - J.P. Morgan Asset … · Solvency II for pensions | 3 Quantitative...

Insight + Process = Results
UK | January 2012
Solvency II for Pensions
For InstItutIonal Investor use only – not For retaIl use or DIstrIbutIon
The recently published – and cryptically titled – “Call for Advice on the review of Directive 2003/41/EC: second consultation” has served to heat up the debate over the future for European prudential regulatory reform. In particular, this 517-page document raises the possibility of the inclusion of Solvency II-style rules in the supervision of pension schemes. In this paper we provide a brief summary of the Solvency II framework and look at the way in which EIOPA (European Insurance and Occupational Pensions Authority) proposes that this framework be adapted for European pension schemes. Further, we consider the impact that these changes may have on the UK pensions landscape.
As the title of the call for advice suggests, the result of this consultation is intended to replace an existing directive which was ratified in 2003. The 2003 directive was implemented through legislation in individual European countries, and the same would be true for any new directive.
The revised directive covers Institutions for Occupational Retirement Provision (“IORPs”), defined broadly as all funded defined benefit and defined contribution pension schemes. Proposed changes to the scope of the directive should not materially impact UK pension schemes – essentially, the
definition has been widened to cover schemes which are not currently subject to regulation within the EU. In work referenced by the call for advice, no UK pension schemes were identified as not currently falling under the scope of some form of EU prudential regulation, whether through this or other directives.
As the underlying directive is still early in its development, much of the analysis below will be subject to revision and clarification in the coming years. However, it is still important to understand the proposed changes and their implications, in order to help EIOPA develop requirements that are appropriate for the UK pensions industry. As such, we hope that the following paper will put its readers in a position whereby they can understand proposed changes.
Owing to the great complexity inherent in defined benefit (“DB”) schemes and the directive’s approach to DB, our focus is primarily on the effects on these schemes and their sponsors. It is worth noting, though, that defined contribution (“DC”) schemes remain in scope for the directive and as such would have to comply with the regulations, as appropriate, including holding additional capital over scheme assets to mitigate the effects of operational risk.

Solvency II: an overview
Solvency II is intended to provide a wide-ranging view of the overall financial position of an insurer in the EU. This is an advance from the initial assessment of regulatory capital, introduced in the 1970s and subsequently revised in 2002, that is now referred to as Solvency I.
The Solvency II framework divides the supervisory process into three “pillars”, as summarised below:
Pillar I: Dealing with the quantitative requirements, this focuses on valuation and the calculation of minimum capital requirements.
Pillar II: With a more qualitative focus, this provides guidance and rules on the design of internal control structures and aids supervisors in understanding the risk posed by the operation of the firm.
Pillar III: Providing guidance around the design of public disclosures, these requirements strive to enforce appropriate levels of transparency in engagement with various interested parties, including regulators and shareholders.
This three-pillar approach is analogous to that used in Basel II and Basel III, the existing and proposed regulatory frameworks for banks.
Solvency II (like Basel II and III) can be regarded as consisting of “sticks” and “carrots”. The sticks - which are requirements that must be fulfilled - are contained in Pillars I and II. However, Pillar III can be thought of as a carrot. The information disclosed by an insurer will affect the cost of capital charged by the market. This gives an incentive for financial firms to manage risk better for the market to see, thus reducing the cost of capital.
The rationale for extending Pillars I and II of Solvency II to pensions is clear. However, the characterisation of additional pension disclosures as a third pillar seems somewhat contrived.
The timeline for implementation of the Solvency II directive proves instructive in emphasising the complexity and political sensitivity of agreeing a harmonised directive throughout the EU. Consultation on the framework started in 2004, but the final details are not expected to be agreed until September 2012, with implementation being phased in from 2013 to 2014.
While the strides that have been made in the agreement of the Solvency II directive should increase the speed with which agreement could be reached on a Solvency II-style pensions directive, the proposals are at a very early stage. The expectation should therefore be for continued consultation on any changes to the pensions directive, with further revision and clarification, and the production of comprehensive quantitative impact analysis.
Solvency II and the IORP proposalsThe call for advice does not at present represent a holistic proposal but instead considers the question of how the Solvency II framework – in whole or in part – can be applied to pension schemes. The reason for this is a stated view of the European Commission that EIOPA’s advice should give a consistent framework for solvency across financial sectors. Rather than repeating the options presented by EIOPA, we instead summarise the key elements of the proposals, focussing on those with the greatest potential impact. Due to the complexities and interdependencies in the design of the Solvency II framework, it is likely that any implementation for application to pension schemes would require extensive reproduction. As such, in building our quantitative analysis of the impact of the proposed changes we have relied heavily on the current structure of the Solvency II directive.
2 | Solvency II for pensions
Solvency II for pensions

Solvency II for pensions | 3
Quantitative requirements: Applying Pillar I to pension schemes
The following section considers three key concepts in the call for advice:
n Holistic balance sheet (“HBS”)n Valuation of assets and liabilitiesn Calculation of Solvency Capital Requirement (“SCR”) and Minimum Capital Requirement (“MCR”)
Holistic Balance SheetThe HBS is a key feature of the proposals. It represents a generalised concept for comparing pension assets and liabilities. However, the important departure from current approaches is the inclusion of items outside pension schemes in the determination of their solvency. The various components of the HBS are summarised in Exhibit 1, with the component number referred to at the bottom right corner of the box. The call for advice does not commit to the final shape of holistic balance sheet and we have presented it in its most comprehensive form, which we believe would be largely necessary to fully implement the options of the directive discussed.
Exhibit 1 : The Holistic Balance Sheet
The call for advice suggests there would be “tiering” of assets, whereby assets of a given liquidity/purpose would be matched against appropriate liabilities. As such it would be expected that component 1 (best estimate of liabilities) would be met by component 5 (financial assets), but that the risk-sensitive liabilities, components 2 and 3 (the risk margin and capital requirements), may be met by a combination of all assets.
However, it could be argued that other assets - in particular the presence of a pension protection scheme (“PPS”) as highlighted in component 7 - should rank on a par with the financial assets in component 5.
2004
2005
2006
2007
2008
2009
2011
2012
2013
July Call for Advice (first wave) December Call for Advice (second wave)
April Call for Advice (third wave)
March Quantitative Impact Study (QIS) 1 report published May Final answers to the Calls for advice December QIS 2 published
March First set of consultation papers on Level 2 implementation September Second set of consultation papers on Level 2 implementation November Third set of consultation papers on level 2 implementation
May EIOPA launches public consultation on draft proposals for Standards and GuidelinesSeptember EIOPA submits final proposals for Standards to the European Commission and finalises guidelines
July EU commission adopts Solvency II Proposal November QIS 3 published
February EU commission adopts Amended Solvency II Proposal November QIS 4 published
March QIS 5 Published
2010 March First Level 3 guidance produced
2014
Phasing - in Solvency II
Solvency II comes into force 5
6
7
1
2
3
4
Assets Liabilities
Sponsor covenant and PPS
Financial contingent assets
Financial assets Best estimate of liabilities
Risk Margin
Capital requirements (SCR and MCR)
Excess of assets over liabilities
Universal component
Scheme-specific component
Best Estimate (Realistic
Assumptions)
Liability Estimate (Prudent
Assumptions)
Risk Margin SCR
Non-Life Underwriting Risk: • Non-life premium and reserve
risk • Non-life catastrophe risk
Life Underwriting Risk: • Mortality risk • Longevity risk • Disability-morbidity risk • Life-expense risk • Revision risk • Lapse risk • Life -catastrophe risk
Health Underwriting Risk: • Expense risk • Health premium and reserve
risk • Health- catastrophe risk
Market Risk: • Interest rate risk • Equity risk • Property risk • Spread risk • Currency risk • Market risk concentrations
Counterparty Default Risk Operational Risk

4 | Solvency II for pensions
Solvency II for pensions
LiabilitiesThe liability side of the holistic balance sheet reflects two broad quantities. The first is the expected value of outgoings from the scheme, whilst the second is the amount of additional capital required to cover unexpected changes in these outgoings.
Best Estimate of Liabilities
The best estimate of liabilities relates mainly to the benefits due from a scheme, but also includes any related expenses. In terms of the benefits, the call for advice differentiates between three tiers:
Unconditional benefits: those which are in principle guaranteed under all circumstances.
Conditional benefits: those for which there is some objective criteria that must be met.
Discretionary benefits: those granted on the basis of a subjective decision making process.
EIOPA considers whether discretionary benefits should be included in the calculation of liabilities. It expresses a preference that any inclusion should be limited to expected payments and as such excludes the automatic distribution of surplus assets; however, the exact nature of the inclusion of these promises in the liabilities would be addressed as level 2 guidance. As such, we ignore discretionary benefits in our calculations and consider only unconditional and conditional benefits; this includes an allowance for future increases in salary as, while the call for advice approaches this as an open question, this is in line with current UK practice.
Risk margin
Under Solvency II, the full value of the technical provision – essentially, the value of liabilities – is calculated as the amount that would be required to transfer the liabilities to another provider. The difference between this and the best estimate of the liabilities – calculated using market data and realistic actuarial assumptions – is the risk margin. Whilst EIOPA considers this transfer value approach, it instead proposes that liabilities be valued using prudent assumptions. The end result is the same: an additional reserve above the best estimate of liabilities, and this is the risk margin.
Prudent actuarial assumptions are distinct from realistic assumptions in that they allow for the degree of potential volatility in the assumptions during normal market conditions, for example by indicating a lower discount rate than realistic actuarial assumptions. Prudent actuarial assumptions lead to a higher estimation of the present value of liabilities than realistic assumptions, which is why the risk margin is positive.
Exhibit 2: EIOPA interpretation of “Risk Margin”
2004
2005
2006
2007
2008
2009
2011
2012
2013
July Call for Advice (first wave) December Call for Advice (second wave)
April Call for Advice (third wave)
March Quantitative Impact Study (QIS) 1 report published May Final answers to the Calls for advice December QIS 2 published
March First set of consultation papers on Level 2 implementation September Second set of consultation papers on Level 2 implementation November Third set of consultation papers on level 2 implementation
May EIOPA launches public consultation on draft proposals for Standards and GuidelinesSeptember EIOPA submits final proposals for Standards to the European Commission and finalises guidelines
July EU commission adopts Solvency II Proposal November QIS 3 published
February EU commission adopts Amended Solvency II Proposal November QIS 4 published
March QIS 5 Published
2010 March First Level 3 guidance produced
2014
Phasing - in Solvency II
Solvency II comes into force 5
6
7
1
2
3
4
Assets Liabilities
Sponsor covenant and PPS
Financial contingent assets
Financial assets Best estimate of liabilities
Risk Margin
Capital requirements (SCR and MCR)
Excess of assets over liabilities
Universal component
Scheme-specific component
Best Estimate (Realistic
Assumptions)
Liability Estimate (Prudent
Assumptions)
Risk Margin SCR
Non-Life Underwriting Risk: • Non-life premium and reserve
risk • Non-life catastrophe risk
Life Underwriting Risk: • Mortality risk • Longevity risk • Disability-morbidity risk • Life-expense risk • Revision risk • Lapse risk • Life -catastrophe risk
Health Underwriting Risk: • Expense risk • Health premium and reserve
risk • Health- catastrophe risk
Market Risk: • Interest rate risk • Equity risk • Property risk • Spread risk • Currency risk • Market risk concentrations
Counterparty Default Risk Operational Risk
Solvency II for pensions | 5
The EIOPA interpretation of the risk margin is interesting for a number of reasons. First, transfers of pension scheme assets and liabilities do take place, though usually to insurance companies (as“buyout”) rather than other schemes. The transfer approach could therefore be used as the basis for a pension scheme risk margin calculation were it not for the fact that an agreed basis would be hard to determine - pricing bases are closely guarded by insurers, and it is only once a buyout quote has been obtained that the cost of buyout is known.
A second point of interest is that the EIOPA interpretation allows for “double-counting” of the risk to scheme solvency, both through the loosely-defined “prudence” of the risk margin calculation and the further calculation of the SCR and MCR. We will further discuss this issue below after fully introducing the concepts of the SCR and MCR.
EIOPA does consider omitting the Risk Margin from the holistic balance sheet. Given our concerns over the potential for double counting, and the ability for other parts of the holistic balance sheet to provide a measure of risk, we believe this omission would be sensible, should the holistic balance sheet approach be used. As such, we have not considered it explicitly in our quantitative analysis later in the paper.
Calculating the best estimate and risk margin
The principal question in the valuation of liabilities – leaving aside the generalised advice on the use of prudent or realistic actuarial assumptions – is the appropriate interest rate. EIOPA envisages the use of a two-level interest rate approach:
Level “A” rates would be mandated at a Europe-wide level, allowing international comparison of the liabilities of firms.
Level “B” rates would use an asset-based return measure, either on a scheme-wide basis or by reference to a specific fixed, but not risk-free, yield curve with guidance provided on which rates represent the expected return on which assets.
Using the two-level approach allows for the creation of two funded ratios: Level “A” which could be met by all assets (that is, components 5, 6 and 7) and Level “B” which would have to be met by financial assets alone (component 5). Additionally, the potential for Member State influence over the setting of the Level B rates would allow for calibration of rates to be more appropriate to individual markets.
If the Level “A” rates were the same as proposed for insurers under Solvency II, then a rate of swaps less 10 basic points (0.1%) would be used. However, given that pension schemes are always uniquely positioned to benefit from the mis-pricing of illiquid assets, there is an argument for introducing some illiquidity premium to this rate. This concept has been mooted in relation to insurers for Solvency II, most recently in the form of a matching premium when corporate bonds are held. This would push discount rate towards corporate bond rates to the extent that there was investment in these asset classes. It could be argued, though, that credit should also be given for investment in other illiquid assets
There is also merit in considering another Solvency II concept: a counter-cyclicality adjustment. This prevents pro-cyclical selling of risky assets when these asset prices are depressed. Given the systemic financial importance of pension schemes, such an addition would seem sensible.
Calculating the best estimate and risk margin
Capital requirements under the Solvency II framework come in two forms: Solvency Capital Requirement (SCR) and Minimum Capital Requirement (MCR). Each of these will be explored, but first it is necessary to identify the metric against which these requirements are measured.
Capital requirements in Solvency II are made by reference to the concept of “basic own funds.” Basic own funds are the excess of assets over liabilities, less any holdings in the shares of the insurance or reinsurance undertaking. The call for advice suggests that the same concept should replicated for pensions arrangements and as such we view basic own funds as the excess of assets of liabilities, less any holdings of the sponsor’s shares (or sponsors, for multiple employer schemes).

6 | Solvency II for pensions
Solvency II for pensions
Solvency Capital Requirement
The Solvency II SCR represents additional capital that must be held to protect against uncertainty. It is calculated using a Value at Risk (VaR) methodology. In essence, it requires that sufficient capital be held such that the probability of insolvency in 12 months is less than 0.5%. In other words solvency over the next year is guaranteed with a confidence level of 99.5%. This is also equivalent to saying that an insurer should hold enough capital for insolvency to be regarded as a 1-in-200 year event.
The SCR proposed by EIOPA for pension schemes is calculated through a number of risk modules, covering Non-Life Underwriting risk, Life Underwriting Risk, Health Underwriting Risk, Health Risk, Market Risk and Counterparty Default risk. These are detailed further in Exhibit 3. We note that many, or indeed most, of these variables would not be applicable to the majority of UK pensions schemes and are in effect a direct copy from the Solvency II directive; as such it would appear their broad definition is to allow for a flexible implementation and the possibility for the creation of a single market for pension provision throughout the EU.
Exhibit 3: The risk modules used to calculate the Solvency II SCR
In the call for advice, the Solvency II SCR calculation is regarded as broadly applicable to pension schemes, subject to unspecified minor amendments. This means that the value of assets must exceed the value of the liabilities with a particular level of confidence over a particular time horizon. Key to the implementation is the discussion of the variables which affect the value of the SCR: time horizon, confidence level and frequency of calculation.
The time horizon under Solvency II is one year. The call for advice does not suggest a move away from this position for pension schemes.
The confidence level under Solvency II is 99.5%. The call for advice discusses the implications of various confidence levels, including the ability to granularly differentiate “1 in 200” (99.5%) year events from “1 in 40” (97.5%). The key question within the call for advice is whether the confidence level for pension schemes should be harmonized across the EU or set at the discretion of local authorities. For our analysis, we have made use of the Solvency II 99.5% level.
The frequency of calculation under Solvency II is annual. The call for advice notes that given the deterministic nature of pension scheme liabilities that a three-yearly assessment would not be unreasonable for pension schemes, but that the time horizon for assessing solvency would still be one year. Estimates could be produced for supervisory purposes in the intervening years
.
2004
2005
2006
2007
2008
2009
2011
2012
2013
July Call for Advice (first wave) December Call for Advice (second wave)
April Call for Advice (third wave)
March Quantitative Impact Study (QIS) 1 report published May Final answers to the Calls for advice December QIS 2 published
March First set of consultation papers on Level 2 implementation September Second set of consultation papers on Level 2 implementation November Third set of consultation papers on level 2 implementation
May EIOPA launches public consultation on draft proposals for Standards and GuidelinesSeptember EIOPA submits final proposals for Standards to the European Commission and finalises guidelines
July EU commission adopts Solvency II Proposal November QIS 3 published
February EU commission adopts Amended Solvency II Proposal November QIS 4 published
March QIS 5 Published
2010 March First Level 3 guidance produced
2014
Phasing - in Solvency II
Solvency II comes into force 5
6
7
1
2
3
4
Assets Liabilities
Sponsor covenant and PPS
Financial contingent assets
Financial assets Best estimate of liabilities
Risk Margin
Capital requirements (SCR and MCR)
Excess of assets over liabilities
Universal component
Scheme-specific component
Best Estimate (Realistic
Assumptions)
Liability Estimate (Prudent
Assumptions)
Risk Margin SCR
Non-Life Underwriting Risk: • Non-life premium and reserve
risk • Non-life catastrophe risk
Life Underwriting Risk: • Mortality risk • Longevity risk • Disability-morbidity risk • Life-expense risk • Revision risk • Lapse risk • Life -catastrophe risk
Health Underwriting Risk: • Expense risk • Health premium and reserve
risk • Health- catastrophe risk
Market Risk: • Interest rate risk • Equity risk • Property risk • Spread risk • Currency risk • Market risk concentrations
Counterparty Default Risk Operational Risk
Solvency II for pensions | 7
Calculation of the SCR would either be by a standard formula, as yet unspecified, or by an internal model validated by the pension scheme’s regulator. The standard model could be in line with the Solvency II framework. Given the relative size and complexity of pension schemes and insurance undertakings, it is unlikely that the majority of pensions schemes would have the capacity to build their own internal models.
Minimum Capital Requirement
Under the Solvency II framework, the MCR provides a second (lower) capital requirement level for triggering supervisory action. This level is calculated separately to the SCR, based on linear function of a number of readily observable variables. In this sense, the calculation is designed to be simple and auditable.
The call for advice suggests that the MCR function be a linear combination of the follow variables: technical provisions, capital-at-risk, written premiums, deferred tax and administrative expense. Technical provisions and written premiums would be net of any re-insurance protection and sponsor covenant. As with the sub-modules of the SCR, we note that these variables do not appear applicable to the majority of UK pensions schemes.
Despite being calculated separately, the MCR is subject to a floor and cap relative to the SCR. If this were to follow the example of Solvency II, the MCR would have a minimum value of 25% of the SCR and a maximum value of 45%. However, this is determined on the basis of the MCR being approximately equivalent to the SCR calculated at an 85% confidence level, and so these maximum and minimum values would be subject to change based upon the choice of confidence level for the SCR. It is worth nothing that under Solvency II, the MCR must be met by basic own funds alone. For pension schemes, this translates as the excess of proposed assets over liabilities.
The call for advice notes that the level of basic own funds falling below the MCR may not have the same implications for pension schemes as for insurers, where regulators are be able to take action to restrict the operation of an entity. This is because most pension schemes have a sponsor that can make up any deficit, whilst an insurer's access to additional funding is more limited. Instead, the MCR may be used as a further signal to increase the level of regulatory scrutiny.
Capital requirements and the Risk Margin
The calculation of the capital requirements is therefore distinct from the risk margin in that the capital requirements provide a minimum level with reference to basic own funds (assets over liabilities) whereas the risk margin is calculated with reference to the liabilities alone.
We question the additional insight provided by the risk margin measure – it is unclear how “prudent” assumptions would be defined, other than being stricter than “realistic”. Further the risk margin is not sensitive to risk mitigating measures introduced by pensions arrangements. As such, in our analysis below we have only calculated the best estimate of liabilities and the SCR.
AssetsUnder the EIOPA proposals, the definition of assets extends beyond just investments, but investments – or financial assets as they are described here – give a good starting point.
Financial Assets
Financial assets are predominantly physical assets held by the scheme; there is little discussion of the valuation of these assets. As such, and in line with Solvency II, we believe that they are likely to be marked to market.
Financial Contingent Assets
Financial contingent assets, component 6, represent those which can be called upon by the scheme in the case of the conditions of a pre-defined situation being met. This could be, for example, property, a designated corporate income stream or assets held in escrow, any of which could be pledged in the instance of an underfunding situation.
Sponsor covenant and PPS
The final component of the asset-side of the HBS, component 7, is a valuation of all contingent assets that do not fall under the definition of financial contingent assets. These are expected to principally include valuations for the strength of sponsor covenant and pension protection schemes, such as the Pension Protection Fund. The valuation of each of these commitments is subject to lengthy debate within the call for advice and no strong preference is highlighted.
Key to the debate over the valuation of sponsor covenant is whether it should constitute a separate component of the asset-side of the HBS, a reduction in the risk-sensitive liabilities (for example, the capital requirements) or a combination of both. EIOPA express a preference for “both” and as such this is the focus of our discussion below and further analysis.
Where viewed as an asset, EIOPA believes that this should be valued on a market consistent basis. In order to be in-line with Solvency II, sponsor covenant would value the potential future cash flows of the sponsor, probability weighted to reflect the likelihood of the expected flow under normal (average) circumstances. It follows from this that recovery plans, more specifically those that identify a stream of sponsor contributions, are valued as part of the sponsor covenant.
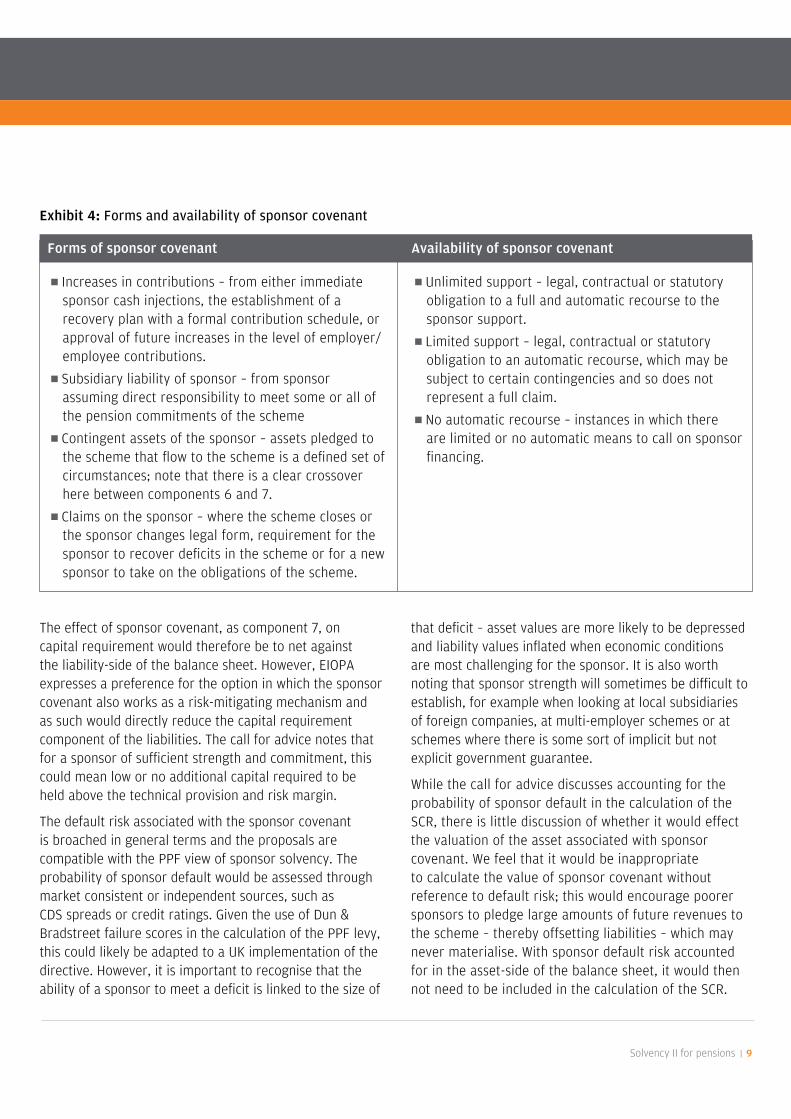
The call for advice highlights that the exact nature of the sponsor’s commitment would influence the value of the asset. Distinction is made between the nature of the claim and its availability; these distinctions are highlighted in Exhibit 4. There is a clear crossover between financial contingent assets and the pledge of contingent assets through the sponsor covenant.
8 | Solvency II for pensions
Solvency II for pensions
Solvency II for pensions | 9
The effect of sponsor covenant, as component 7, on capital requirement would therefore be to net against the liability-side of the balance sheet. However, EIOPA expresses a preference for the option in which the sponsor covenant also works as a risk-mitigating mechanism and as such would directly reduce the capital requirement component of the liabilities. The call for advice notes that for a sponsor of sufficient strength and commitment, this could mean low or no additional capital required to be held above the technical provision and risk margin.
The default risk associated with the sponsor covenant is broached in general terms and the proposals are compatible with the PPF view of sponsor solvency. The probability of sponsor default would be assessed through market consistent or independent sources, such as CDS spreads or credit ratings. Given the use of Dun & Bradstreet failure scores in the calculation of the PPF levy, this could likely be adapted to a UK implementation of the directive. However, it is important to recognise that the ability of a sponsor to meet a deficit is linked to the size of
that deficit – asset values are more likely to be depressed and liability values inflated when economic conditions are most challenging for the sponsor. It is also worth noting that sponsor strength will sometimes be difficult to establish, for example when looking at local subsidiaries of foreign companies, at multi-employer schemes or at schemes where there is some sort of implicit but not explicit government guarantee.
While the call for advice discusses accounting for the probability of sponsor default in the calculation of the SCR, there is little discussion of whether it would effect the valuation of the asset associated with sponsor covenant. We feel that it would be inappropriate to calculate the value of sponsor covenant without reference to default risk; this would encourage poorer sponsors to pledge large amounts of future revenues to the scheme – thereby offsetting liabilities – which may never materialise. With sponsor default risk accounted for in the asset-side of the balance sheet, it would then not need to be included in the calculation of the SCR.
Exhibit 4: Forms and availability of sponsor covenant
Forms of sponsor covenant
Increases in contributions – from either immediate sponsor cash injections, the establishment of a recovery plan with a formal contribution schedule, or approval of future increases in the level of employer/employee contributions.
Subsidiary liability of sponsor – from sponsor assuming direct responsibility to meet some or all of the pension commitments of the scheme
Contingent assets of the sponsor – assets pledged to the scheme that flow to the scheme is a defined set of circumstances; note that there is a clear crossover here between components 6 and 7.
Claims on the sponsor – where the scheme closes or the sponsor changes legal form, requirement for the sponsor to recover deficits in the scheme or for a new sponsor to take on the obligations of the scheme.
Availability of sponsor covenant
Unlimited support – legal, contractual or statutory obligation to a full and automatic recourse to the sponsor support.
Limited support – legal, contractual or statutory obligation to an automatic recourse, which may be subject to certain contingencies and so does not represent a full claim.
No automatic recourse – instances in which there are limited or no automatic means to call on sponsor financing.
Pension Protection Schemes (PPSs)
Valuation of a PPS is considered as part of the ‘security mechanism’ provided by the structure of the pension scheme. However, a link is made between the consideration of a PPS and the approach detailed for sponsor covenant. Under EIOPA’s preferred option, the contribution of the PPS would treated as described for sponsor covenant, as both an asset on the balance sheet and a risk-mitigating measure reducing the capital requirements.
Potential quantitative impact of the directive on an example UK pension schemeIn looking at how a UK pension scheme might be affected by the propose directive we consider two items: first, we look at how large pension scheme liabilities would be using the required discount rate; then, we consider the funded status and SCR calculation for a sample pension fund.
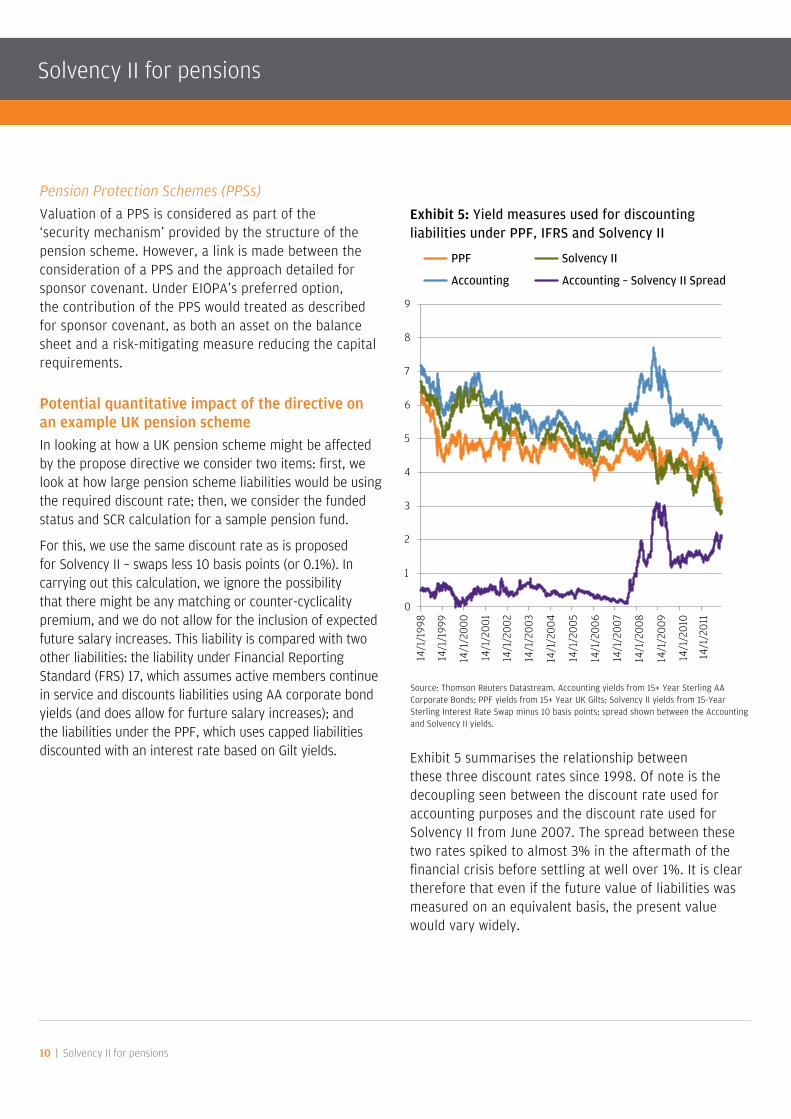
For this, we use the same discount rate as is proposed for Solvency II – swaps less 10 basis points (or 0.1%). In carrying out this calculation, we ignore the possibility that there might be any matching or counter-cyclicality premium, and we do not allow for the inclusion of expected future salary increases. This liability is compared with two other liabilities: the liability under Financial Reporting Standard (FRS) 17, which assumes active members continue in service and discounts liabilities using AA corporate bond yields (and does allow for furture salary increases); and the liabilities under the PPF, which uses capped liabilities discounted with an interest rate based on Gilt yields.
Exhibit 5: Yield measures used for discounting liabilities under PPF, IFRS and Solvency II
Exhibit 5 summarises the relationship between these three discount rates since 1998. Of note is the decoupling seen between the discount rate used for accounting purposes and the discount rate used for Solvency II from June 2007. The spread between these two rates spiked to almost 3% in the aftermath of the financial crisis before settling at well over 1%. It is clear therefore that even if the future value of liabilities was measured on an equivalent basis, the present value would vary widely.
10 | Solvency II for pensions
Solvency II for pensions
Source: Thomson Reuters Datastream. Accounting yields from 15+ Year Sterling AA Corporate Bonds; PPF yields from 15+ Year UK Gilts; Solvency II yields from 15-Year Sterling Interest Rate Swap minus 10 basis points; spread shown between the Accounting and Solvency II yields.
0
1
2
3
4
5
6
7
8
9
14/1
/199
8
14/1
/199
9
14/1
/200
0
14/1
/200
1
14/1
/200
2
14/1
/200
3
14/1
/200
4
14/1
/200
5
14/1
/200
6
14/1
/200
7
14/1
/200
8
14/1
/200
9
14/1
/201
0
14/1
/201
1
Accounting
PPF Solvency II
Accounting – Solvency II Spread
60%
65%
70%
75%
80%
85%
90%
95%
100%
Aug
Sep
Oct
Nov
Fund
ing
Leve
l
2011
PPF Accounting Solvency II
16
25
1 2
-6
38
0
5
10
15
20
25
30
35
40
45
Interest Rate Risk
Equity Risk Property Risk Spread Risk Diversification Final SCR
%
Best Estimate of Liabilities
£160m
Financial Assets £100m
0
20
40
60
80
100
120
140
160
180
200
Assets Liabilities
SCR : £61m
220
240
Solvency II for pensions | 11
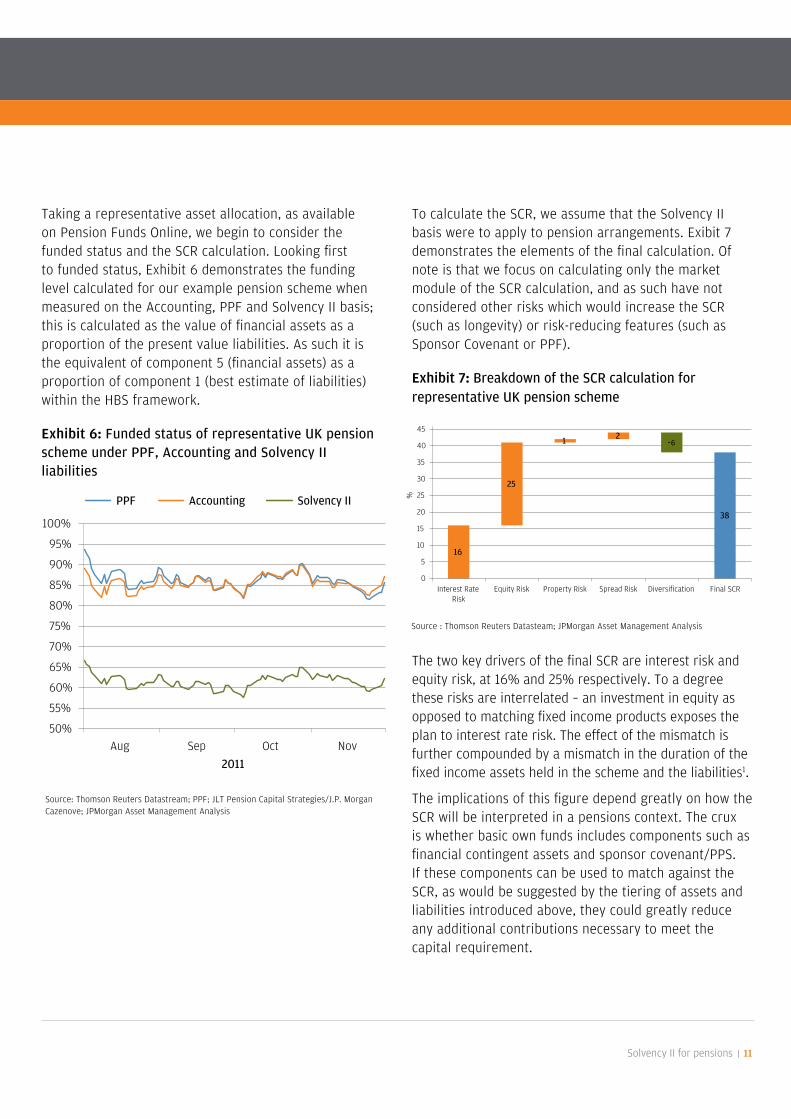
Taking a representative asset allocation, as available on Pension Funds Online, we begin to consider the funded status and the SCR calculation. Looking first to funded status, Exhibit 6 demonstrates the funding level calculated for our example pension scheme when measured on the Accounting, PPF and Solvency II basis; this is calculated as the value of financial assets as a proportion of the present value liabilities. As such it is the equivalent of component 5 (financial assets) as a proportion of component 1 (best estimate of liabilities) within the HBS framework.
Exhibit 6: Funded status of representative UK pension scheme under PPF, Accounting and Solvency II liabilities
To calculate the SCR, we assume that the Solvency II basis were to apply to pension arrangements. Exibit 7 demonstrates the elements of the final calculation. Of note is that we focus on calculating only the market module of the SCR calculation, and as such have not considered other risks which would increase the SCR (such as longevity) or risk-reducing features (such as Sponsor Covenant or PPF).
Exhibit 7: Breakdown of the SCR calculation for representative UK pension scheme
The two key drivers of the final SCR are interest risk and equity risk, at 16% and 25% respectively. To a degree these risks are interrelated – an investment in equity as opposed to matching fixed income products exposes the plan to interest rate risk. The effect of the mismatch is further compounded by a mismatch in the duration of the fixed income assets held in the scheme and the liabilities1.
The implications of this figure depend greatly on how the SCR will be interpreted in a pensions context. The crux is whether basic own funds includes components such as financial contingent assets and sponsor covenant/PPS. If these components can be used to match against the SCR, as would be suggested by the tiering of assets and liabilities introduced above, they could greatly reduce any additional contributions necessary to meet the capital requirement.
Source: Thomson Reuters Datastream; PPF; JLT Pension Capital Strategies/J.P. Morgan Cazenove; JPMorgan Asset Management Analysis
Source : Thomson Reuters Datasteam; JPMorgan Asset Management Analysis
50%
55%
60%
65%
70%
75%
80%
85%
90%
95%
100%
August September October November
PPF Accounting Solvency II
2011
50%
55%
60%
65%
70%
75%
80%
85%
90%
95%
100%
Aug Sep Oct Nov
2011
0
1
2
3
4
5
6
7
8
9
14/1
/199
8
14/1
/199
9
14/1
/200
0
14/1
/200
1
14/1
/200
2
14/1
/200
3
14/1
/200
4
14/1
/200
5
14/1
/200
6
14/1
/200
7
14/1
/200
8
14/1
/200
9
14/1
/201
0
14/1
/201
1
Accounting
PPF Solvency II
Accounting – Solvency II Spread
60%
65%
70%
75%
80%
85%
90%
95%
100%
Aug
Sep
Oct
Nov
Fund
ing
Leve
l
2011
PPF Accounting Solvency II
16
25
1 2
-6
38
0
5
10
15
20
25
30
35
40
45
Interest Rate Risk
Equity Risk Property Risk Spread Risk Diversification Final SCR
%
Best Estimate of Liabilities
£160m
Financial Assets £100m
0
20
40
60
80
100
120
140
160
180
200
Assets Liabilities
SCR : £61m
220
240
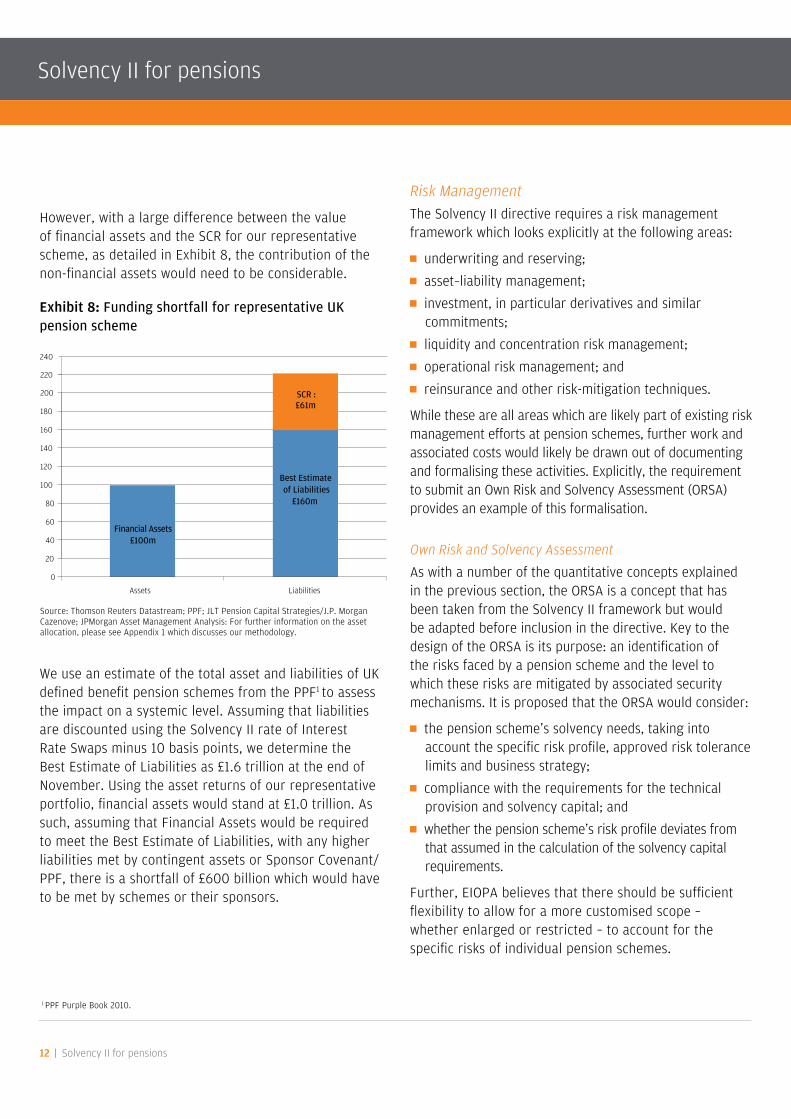
However, with a large difference between the value of financial assets and the SCR for our representative scheme, as detailed in Exhibit 8, the contribution of the non-financial assets would need to be considerable.
Exhibit 8: Funding shortfall for representative UK pension scheme
We use an estimate of the total asset and liabilities of UK defined benefit pension schemes from the PPF1 to assess the impact on a systemic level. Assuming that liabilities are discounted using the Solvency II rate of Interest Rate Swaps minus 10 basis points, we determine the Best Estimate of Liabilities as £1.6 trillion at the end of November. Using the asset returns of our representative portfolio, financial assets would stand at £1.0 trillion. As such, assuming that Financial Assets would be required to meet the Best Estimate of Liabilities, with any higher liabilities met by contingent assets or Sponsor Covenant/PPF, there is a shortfall of £600 billion which would have to be met by schemes or their sponsors.
Risk Management
The Solvency II directive requires a risk management framework which looks explicitly at the following areas:
underwriting and reserving; asset–liability management; investment, in particular derivatives and similar
commitments; liquidity and concentration risk management; operational risk management; and reinsurance and other risk-mitigation techniques.
While these are all areas which are likely part of existing risk management efforts at pension schemes, further work and associated costs would likely be drawn out of documenting and formalising these activities. Explicitly, the requirement to submit an Own Risk and Solvency Assessment (ORSA) provides an example of this formalisation.
Own Risk and Solvency Assessment
As with a number of the quantitative concepts explained in the previous section, the ORSA is a concept that has been taken from the Solvency II framework but would be adapted before inclusion in the directive. Key to the design of the ORSA is its purpose: an identification of the risks faced by a pension scheme and the level to which these risks are mitigated by associated security mechanisms. It is proposed that the ORSA would consider:
the pension scheme’s solvency needs, taking into account the specific risk profile, approved risk tolerance limits and business strategy;
compliance with the requirements for the technical provision and solvency capital; and
whether the pension scheme’s risk profile deviates from that assumed in the calculation of the solvency capital requirements.
Further, EIOPA believes that there should be sufficient flexibility to allow for a more customised scope – whether enlarged or restricted – to account for the specific risks of individual pension schemes.
12 | Solvency II for pensions
Solvency II for pensions
1 PPF Purple Book 2010.
Source: Thomson Reuters Datastream; PPF; JLT Pension Capital Strategies/J.P. Morgan Cazenove; JPMorgan Asset Management Analysis: For further information on the asset allocation, please see Appendix 1 which discusses our methodology.
0
1
2
3
4
5
6
7
8
9
14/1
/199
8
14/1
/199
9
14/1
/200
0
14/1
/200
1
14/1
/200
2
14/1
/200
3
14/1
/200
4
14/1
/200
5
14/1
/200
6
14/1
/200
7
14/1
/200
8
14/1
/200
9
14/1
/201
0
14/1
/201
1
Accounting
PPF Solvency II
Accounting – Solvency II Spread
60%
65%
70%
75%
80%
85%
90%
95%
100%
Aug
Sep
Oct
Nov
Fund
ing
Leve
l
2011
PPF Accounting Solvency II
16
25
1 2
-6
38
0
5
10
15
20
25
30
35
40
45
Interest Rate Risk
Equity Risk Property Risk Spread Risk Diversification Final SCR
%
Best Estimate of Liabilities
£160m
Financial Assets £100m
0
20
40
60
80
100
120
140
160
180
200
Assets Liabilities
SCR : £61m
220
240

Solvency II for pensions | 13
Compliance and internal audit functions
Compliance and internal audit functions would be expected to be integrated into the overall internal control system. This would aid the pension scheme in assessing the impact of changes in the legal environment and the identification and assessment of risk.
However, given the wide range in scope and complexity of pension schemes, the size of these functions would be proportionate to the size of the scheme. As such, rather than reading “function” as meaning a group of individuals within the scheme, responsibilities could be held by a single individual. Indeed, EIOPA envisages that these functions could be conducted by third-party firms.
There is a clear cost impact to formalising compliance and internal audit functions within pension schemes, although this impact may be mitigated by exercising proportionality.
Outsourcing
A key principle of the regulatory framework is that outsourcing a function does not outsource your regulatory responsibility. This requires strong governance arrangements to ensure that any outsourced operations are being conducted in line with the IORP’s regulatory responsibility. While this is not an extreme move from current expectations or good practice, it may require formalisation of the oversight of outsourced relationships.
Enhanced supervisory powersIn order to allow supervisors to exercise the appropriate level of oversight to ensure implementation of the requirements within the directive, a proposal is put forth to enhance (or at least, make explicit) the powers of the supervisor. Of potential greatest impact are stress testing and capital add-ons.
Stress testing
As part of the Solvency II framework there is an expectation that the supervisory authority will develop a stress-testing regime in order to assess the potential systemic impact of adverse events on the insurance industry; further EIOPA has conducted stress-tests at the EU level, albeit of a limited scope.
While stress tests can be conducted in isolation by the supervisory authority or EIOPA, the results are more instructive if undertaken at scheme-level. As such there should be an expectation of a requirement for pension schemes to assist in stress testing through the provision of information or, especially for larger institutions, performing stress testing on the supervisor’s behalf.
Capital add-ons
Should a supervisor deem that the risk profile or investment policy of a pension scheme is not consistent with the assumptions associated with the SCR, they would have the power to increase the level of the SCR. The calculation of the SCR should therefore not be seen as static. This is consistent with the firm-specific adjustments to the levy which the pension protection fund board are able to impose.
Requirements on the information provided to membersThe call for advice debates the introduction of a Key Information Document in line with the provisions of the UCITS Directive, but with amendments to both exclude UCITS-specific information and include pension-specific features. These features would be left to the regulator within the relevant member state to define.
The cost in the production and administration of this information should broadly be one-time in nature and would not be expected to be markedly greater than that involved in currently producing information for the benefit of members. However, it is an additional cost.
Nature of changesThe changes are intended broadly to formalise the structures that already exist in the majority of pension schemes. However in doing so a great deal of work is proposed.
The application of proportionality to the a number of the measures which derive, in full or in part, from the Solvency II directive brings about the question of the efficiency of its wholesale adoption.
Conclusion
The quantitative requirements that result from applying a Solvency II framework to pension schemes lead to a demonstrably worse solvency measure than is found under the PPF or accounting-based valuations. Further, and depending on the ability for non-financial assets to meet the requirements, large contributions on behalf of sponsors would be necessary to bring UK pension schemes in line with the requirements.
Governance and disclosure requirements would entail additional work, and associated expense, for both supervisors and schemes.
We question therefore whether a prudential framework that is designed for application to large-scale and active insurers (the proverbial sledgehammer) is appropriate for consistent application to pension schemes (the nut). With many of the more burdensome measures within the framework either reduced in application, or for small schemes likely not applied at all, is the political and regulatory effort required to support such a framework appropriate?
There is also the fundamental question of whether this style of framework is appropriate for pension schemes. In particular, the applicability of disclosure in the context of a three-pillar frame work is clear for banks and insurers, but not for pension schemes.
There are several ways in which the adverse effect of the proposals on schemes - and thus on industry - could be mitigated. The first would be to mandate the use of a liability discount rate that allowed for liquidity premia. This would reduce the size of any regulatory hole. In fact, each 100 basis point (1%) increase in the discount rate would lower the aggregate deficit by around £200bn.
Some sort of counter-cyclicality adjustment would also be helpful. This would avoid a large-scale exodus from equities into bonds.
Finally, a more subtle alteration would be to increase the coverage of the PPF in the UK and the priority of a PPS in the valuation of assets. At its most extreme, complete coverage of liabilities by the PPF could negate the need to hold an SCR, since the extent of the coverage would equal the difference between the financial assets and the liabilities.
Whatever happens, the full impact of any changes must be carefully considered before any new regulations are set in stone.
14 | Solvency II for pensions
Solvency II for pensions
1 For further information on the asset allocation, please see Appendix 1 which discusses our methodology.
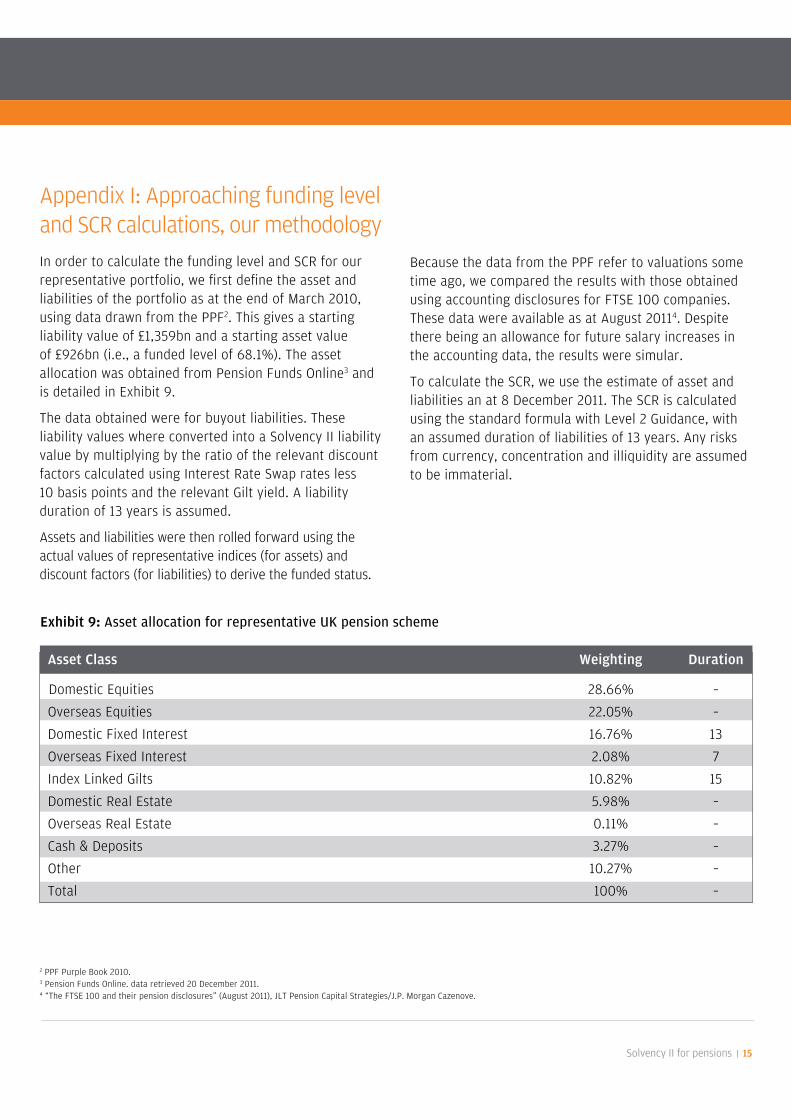
Appendix I: Approaching funding level and SCR calculations, our methodology
In order to calculate the funding level and SCR for our representative portfolio, we first define the asset and liabilities of the portfolio as at the end of March 2010, using data drawn from the PPF2. This gives a starting liability value of £1,359bn and a starting asset value of £926bn (i.e., a funded level of 68.1%). The asset allocation was obtained from Pension Funds Online3 and is detailed in Exhibit 9.
The data obtained were for buyout liabilities. These liability values where converted into a Solvency II liability value by multiplying by the ratio of the relevant discount factors calculated using Interest Rate Swap rates less 10 basis points and the relevant Gilt yield. A liability duration of 13 years is assumed.
Assets and liabilities were then rolled forward using the actual values of representative indices (for assets) and discount factors (for liabilities) to derive the funded status.
Because the data from the PPF refer to valuations some time ago, we compared the results with those obtained using accounting disclosures for FTSE 100 companies. These data were available as at August 20114. Despite there being an allowance for future salary increases in the accounting data, the results were simular.
To calculate the SCR, we use the estimate of asset and liabilities an at 8 December 2011. The SCR is calculated using the standard formula with Level 2 Guidance, with an assumed duration of liabilities of 13 years. Any risks from currency, concentration and illiquidity are assumed to be immaterial.
Solvency II for pensions | 15
Asset Class Weighting Duration
Domestic Equities 28.66% –
Overseas Equities 22.05% –
Domestic Fixed Interest 16.76% 13
Overseas Fixed Interest 2.08% 7
Index Linked Gilts 10.82% 15
Domestic Real Estate 5.98% –
Overseas Real Estate 0.11% –
Cash & Deposits 3.27% –
Other 10.27% –
Total 100% –
2 PPF Purple Book 2010.3 Pension Funds Online. data retrieved 20 December 2011.4 “The FTSE 100 and their pension disclosures” (August 2011), JLT Pension Capital Strategies/J.P. Morgan Cazenove.
Exhibit 9: Asset allocation for representative UK pension scheme

16 | Solvency II for pensions
Solvency II for pensions
Appendix II: Estimating the systemic impact of Solvency II for Pensions
In order to estimate the systemic impact of Solvency II for Pensions, we require a figure for the total level of defined benefit Assets and Liabilities in the UK market. For this we use the Full Buy Out figures stated in the PPF Purple Book 2010.
The Full Buy Out liabilities are converted to Solvency II liabilities using the method described in Appendix I and an asset allocation is formed based on the average reported in the Purple Book. These assets and liabilities are rolled forward using the method described in Appendix I to give a measure of the assets and liabilities at the relevant date.
Using these assets and liabilities, we estimate the additional asset that would be required to meet liabilities.

Paul sweeting, European Head, Strategy Group
Contributors
alex Christie, Strategist
edward Gladwyn, Strategist
Solvency II for pensions | 17

Insight + Process = Results
For Institutional Investor Use Only - Not for Retail Use or Distribution
Please be aware that this material is produced for educational purposes only and should not be taken as or construed as legal or regulatory advice. The opinions and views expressed here are those held by J.P. Morgan Asset Management (JPMAM) as at December 2011, which are subject to change without notice. Any research in this document has been obtained and may have been acted upon by JPMAM for its own purpose. The results of such research are being made available as additional information only and do not constitute investment advice. They do not reflect the views of JPMorgan Chase Group. JPMorgan Asset Management Marketing Limited accepts no legal responsibility or liability for any matter or opinion expressed in this material and makes no representation or warranty regarding the accuracy or completeness of the information herein.
The recipient must make an independent assessment of any legal, credit, tax, regulatory and accounting issues and determine with its own professional advisors its suitability or appropriateness. This material is specific to the recipient and must not be distributed to any other person or replicated in any form without the prior written consent of JPMAM.
The value of investments and the income from them can fall as well as rise and investors may not get back the full amount invested. Issued by JPMorgan Asset Management Marketing Limited which is authorised and regulated in the UK by the Financial Services Authority. Registered in England No: 288553. Registered Office: 125 London Wall, London EC2Y 5AJ.
LV–JPM4779 12/11