Solvency Assessment and Management: Steering Committee Position Paper … Papers/Position Paper...
42
1 Solvency Assessment and Management: Steering Committee Position Paper 6 1 (v 1) Interim Measures relating to Technical Provisions and Capital Requirements for Short-term Insurers 1 Discussion Document 6 was adopted by the SAM Steering Committee on 26 November 2010.
-
Upload
nguyendiep -
Category
Documents
-
view
221 -
download
0
Transcript of Solvency Assessment and Management: Steering Committee Position Paper … Papers/Position Paper...

1
Solvency Assessment and Management:
Steering Committee
Position Paper 61 (v 1)
Interim Measures relating to Technical Provisions and Capital Requirements for Short-term Insurers
1 Discussion Document 6 was adopted by the SAM Steering Committee on 26 November 2010.
2
POSITION PAPER 6: Interim Measures relating to Technical Provisions and Capital Requirements for Short-term Insurers Contents 1. Introduction .................................................................................................................................... 3
2. Purpose ......................................................................................................................................... 4
3. Description of current regulatory requirements ............................................................................. 4
4. Description of methodology followed ............................................................................................ 5
4.1 Current regulatory requirements ...................................................................................... 6
4.2 Short-term insurance Quantitative Impact Study (QIS) ................................................... 6
4.3 Bootstraps on industry data based on statutory returns from 2009 ................................ 8
5. Results and comparisons: Technical Provisions ........................................................................... 9
5.1 Short-term Insurance QIS ................................................................................................ 9
5.2 Bootstraps on industry data based on statutory returns from 2009 .............................. 13
5.3 Recommendations: Technical Provisions...................................................................... 14
5.4 Impact of proposals for technical provisions ................................................................. 15
6. Results and comparisons: Capital Requirements ....................................................................... 16
6.1 Short-term insurance QIS .............................................................................................. 16
6.2 Bootstraps on industry data based on statutory returns from 2009 .............................. 20
6.3 Pragmatic approach for insurance risk capital charge .................................................. 21
6.4 Operational Risk ............................................................................................................ 24
6.5 Recommendations: Capital Requirement ...................................................................... 25
6.6 Impact of recommendations for capital requirements ................................................... 27
6.7 Sensitivity analysis regarding the impact of base assumptions on the capital requirements ............................................................................................................................. 30
7. Lloyd’s ......................................................................................................................................... 31
8. Differences between proposal and Solvency II (i.e. envisaged SAM) ........................................ 31
8.1 Technical provisions: ..................................................................................................... 31
8.2 Capital Requirements: ................................................................................................... 32
9. Differences between proposal and current requirements ........................................................... 33
10. Transitional arrangements ........................................................................................................... 33
11. Next steps.................................................................................................................................... 34
Appendix 1: Liabilities per insurer as per the QIS results, as percentage of current values ................. 35
Appendix 2: Summary of Bootstrapping methods ................................................................................. 36
Appendix 3: FCR proposal for the Asset Risk Capital Charge .............................................................. 37
Appendix 4: FCR proposal for the Credit Risk Capital Charge ............................................................. 39
Appendix 5: Summary of proposal for capital requirements per insurer ............................................... 42

3
1. Introduction
The basis of the SAM regime will be the principles of the Solvency II Directive, as adopted by the European Parliament, but adapted to South African specific circumstances where necessary. As an overarching principle, the recommendations arising from the SAM project should meet the requirements of a third country equivalence assessment under Solvency II. Following consultation with industry representatives and other stakeholders, the implementation date for the standardised approach under the SAM regime for short-term insurers was changed from the initial proposal of 1 January 2012 to 1 January 2014. This means that both the standardised and internal model approach under the SAM regime, for both the long-term and short-term insurance industries, will be implemented simultaneously in January 2014. However, it was decided that certain interim requirements will be introduced by 2012. Part of these interim measures relate to quantitative requirements for short-term insurers. Aspects of both technical provisioning as well as capital requirements in the short-term insurance sector are currently not risk-sensitive. It was decided that interim measures should revise the current approach used in calculating technical provisions and capital requirements, by utilising the analysis undertaken as part of the Financial Condition Reporting (“FCR”) exercise. The following objectives should be achieved in implementing revised technical provisions and capital requirements for short-term insurers:
the proposed methodology should be more risk-based than the current prescribed method;
it should be easy to calculate; and
it should provide a stepping stone to the implementation of SAM in 2014. This document assumes that the reader has a certain level of background and knowledge relating to short-term insurance, statutory requirements around the calculation of reserves and capital adequacy requirement and reserving methods used in the short-term insurance industry and the previous FCR calibrations. For further information on the FCR calibrations the reader can refer to the following documents which are available on the FSB website (www.fsb.co.za):
Deloitte 2005 FCR Calibration report;
FSB FCR Issues Paper (December 2006); and
Deloitte 2009 FCR Calibration report.

4
2. Purpose
The purpose of this discussion document is to provide initial proposals for revised technical provisions and capital requirements for short-term insurers, to be effective as interim measures during 2012 and 2013.
3. Description of current regulatory requirements
The calculation for the Technical Provisions and Capital Requirements are currently specified in Board Notice 27 of 2010 issued under the Short-term Insurance Act, 1998 (Act No. 53 of 1998) (“STIA”). An abridged summary of these requirements are as follows2: Technical Provisions: Unearned Premium Provision (UPP)
365th method based on net (of approved reinsurance and commission) premium. The Board Notice includes a prescribed allowance for the calculation of the provision relating to “cash-back” benefits on a retrospective approach.
Outstanding Claims Reserve (OCR)
Case estimates provided by the insurer.
Incurred But Not Reported reserve (IBNR)
7% (or such other percentage or method as the Registrar may approve) of the total net (of approved reinsurance) written premium in the year immediately preceding the calculation.
Contingency Reserve 10% of the total net (of approved reinsurance) written premium in the year immediately preceding the calculation.
Unexpired Risk Provision (URP)
If the insurer incurs an underwriting loss and the insurer, in consultation with its auditor (and actuary, where applicable) considers it necessary to defray the possible cost of claims together with the costs to carry on the business.
2 The reader should refer to the Board Notice for full details.

5
Capital Requirements: Minimum capital requirement
R5m or such smaller amount as the Registrar, in a particular case and for a determined period, may approve.
Capital Adequacy Requirement (CAR)
15% of the greater of the net (of all reinsurance) premium income (a) during the last 12 months or (b) during the year before that.
Although the contingency reserve and the CAR may not be based on exactly the same premiums or period, they are commonly added together and expressed as a “capital requirement” of 25% of net written premium (NWP). Since the FCR reports recommended that the contingency reserve should be removed, the contingency reserve and capital requirement (as stated in the statutory returns) were added together as the “total current capital requirement” for the purpose of this analysis and comparison. Similarly, the contingency reserve was excluded from other technical provisions when making comparisons.
4. Description of methodology followed This report summarises results from three main sources of information (as described in more detail in the sections that follow):
information on the current regulatory requirements for both technical provisions and capital, based on the submitted statutory returns for 2009;
results from the short-term insurance quantitative impact study (based on the last Financial Condition Reporting (FCR) calibration); and
results from bootstraps3 on industry data based on the submitted statutory returns for 2009.
3 Bootstrapping is a stochastic technique for estimating uncertainty or variability in reserve estimates. A
particular strength of the methodology is that it produces an estimate of the full distribution of claim outcomes. The bootstraps were performed by using ResQ software.

6
4.1 Current regulatory requirements
The tables below give a summary of the current requirements, in R’000, split by type of insurer4. The information was taken from available statutory returns for 2009 and exclude insurers in run-off.
Table 1: Summary of current NWP, assets and technical provisions (excluding companies in run-off)
Table 2: Summary of current capital requirements (excluding companies in run-off)
4.2 Short-term insurance Quantitative Impact Study (QIS)
A QIS was sent to short-term insurers (excluding those in run-off) on 6 August 2010 with a submission date of 6 September 2010. Results received up to 13 September were included in the analysis. The QIS was based on information as at the insurers’ 2009 year-ends. The table below gives a summary of the number of insurers that submitted results that could be used in the analysis.
Type of Insurer ST QIS sent ST QIS submitted
Typical 25 16
Niche 35 20
Reinsurer 8 6
Cell 10 5
Cell captive 10 4
TOTAL 88 51
Table 3: Summary of insurers that submitted a QIS
4 A summary split by class of business could not be provided as this was not readily available.
Type of insurer Number Total NWP
Total Assets
(Statutory
basis)
UPP OCR IBNR URP Total Technical
Provisions
Typical 25 38 888 153 40 128 386 5 724 241 7 480 405 2 682 207 59 148 15 946 001
Niche 35 6 005 429 18 277 274 2 207 473 2 061 458 1 214 281 168 290 5 651 503
Reinsurer 8 2 327 152 8 562 954 568 043 1 659 110 839 110 - 3 066 262
Cell 10 5 292 416 11 287 031 3 741 748 1 896 192 533 968 - 6 171 908
Cell Captives 10 298 616 1 581 971 35 800 575 956 25 874 - 637 630
TOTAL 88 52 811 765 79 837 616 12 277 305 13 673 121 5 295 439 227 438 31 473 304
Type of insurer Contingency
reserve
Capital
Requirement
(15% of NWP)
"Total" capital
requirement
Typical 3 966 545 5 962 199 9 928 745
Niche 634 131 932 343 1 566 474
Reinsurer 234 260 389 287 623 547
Cell 573 890 810 713 1 384 603
Cell Captives 46 188 56 730 102 917
TOTAL 5 455 014 8 151 272 13 606 287

7
In total 58% of insurers and 79% of industry assets (based on 88 active insurers) are represented in the analysis. The tables below contain the same information as shown in Table 1 above under section 4.1, but only aggregated for those insurers for which a completed QIS was received.
Table 4: Summary of current NWP, assets and technical provisions for insurers that submitted a QIS
Table 5: Summary of current capital requirements for insurers that submitted a QIS
Some common completion errors in the submitted results included the following:
fixed interest assets not split by duration; and
credit risk on assets was not based on assets backing liabilities only. Where these errors occurred, manual corrections were made. Apart from checking that the figures correspond to information previously submitted, no other data checks were performed. It is important to note that the second FCR calibration was based on data from “Typical” and “Niche” insurers only. However, the results from the calibration were applied to all types of insurers in the QIS.
Type of insurer Number Total NWP
Total Assets
(Statutory
basis)
UPP OCR IBNR URP Total Technical
Provisions
Typical 16 30 780 214 30 841 338 3 794 502 6 172 236 2 060 783 - 12 027 521
Niche 20 3 731 409 15 047 693 1 636 856 1 561 429 958 332 168 290 4 324 907
Reinsurer 6 2 035 995 6 781 228 422 316 1 260 637 660 654 - 2 343 606
Cell 5 4 592 787 9 809 367 3 550 197 1 704 613 484 033 - 5 738 842
Cell Captives 4 195 533 871 247 6 342 491 865 13 753 - 511 960
TOTAL 51 41 335 937 63 350 873 9 410 213 11 190 780 4 177 554 168 290 24 946 837
Type of insurer Contingency
reserve
Capital
Requirement
(15% of NWP)
"Total" capital
requirement
Typical 3 135 512 4 742 855 7 878 367
Niche 394 373 580 217 974 590
Reinsurer 205 144 314 944 520 088
Cell 502 774 702 768 1 205 543
Cell Captives 19 569 33 368 52 937
TOTAL 4 257 372 6 374 153 10 631 525

8
4.3 Bootstraps on industry data based on statutory returns from 2009
4.3.1 Data The main source of information used for this exercise was the 2009 statutory returns of all companies in the short-term insurance industry (excluding those in run-off). The first phase of this project involved extracting the appropriate data from the statutory returns and importing this data into a ResQ database. The following incremental data for each insurer and each of the business classes was extracted from Statement D in the statutory return:
Section1 – Payment development (net of all reinsurance) i.e. “paid claims” triangle
Section2 – Claims development (net of all reinsurance) i.e. “incurred claims” triangle
The following data checks were done:
Spot checks were done to ensure the accuracy of this process.
Statement D1 in the statutory returns (containing triangles for total paid and incurred claims) was checked against the “Total” triangles (per insurer) which were automatically generated by ResQ, to ensure that the transfer of the data was done correctly.
Paid and Incurred claims in Statement D1 were reconciled with the data in statement B5 (Net Underwriting Results).
The data had some limitations, including the following
Prior to 2005, claims data per business class was not captured accurately by insurers.
Some insurers still do not complete the triangles on a quarterly basis – their information therefore cause “spikes” at each first quarter (if annual figures are completed) or if it is split equally between quarters it may not be a true reflection of the underlying pattern.
No attempt was made to “clean” the data, to check for errors in the returns or to exclude possible “outliers”.
Data prior to the information contained in the triangles (i.e. more than six years into the past) was not combined. In other words, the triangles as presented in the 2009 statutory returns were used “as is” where the Deloitte calibration contained combined data from 1990 up to 2007.
The ResQ software shows when the exclusion of a specific data point changes the result significantly. The sensitivities for the paid claims data for all the classes of business (except Guarantee and Liability) were less than 10% compared to sensitivities of more than 10% for all classes of

9
business based on the incurred claims triangles. This shows that there is more variability in the incurred claims triangles in the data used.
The bootstrap method itself has some limitations and certain assumptions need to be valid before the method is credible. 4.3.2 Bootstrap methodology A DFM (Development Factor Model, in particular the Basic Chain Ladder) and a Bootstrap were run on each insurer’s total paid claims triangle and total incurred claims triangle. These two methods were then also run on the total paid triangle and total incurred triangle of each business class. The following methods were followed (in consultation with ResQ specialists) for the different triangles5: Paid Claims Triangle6:
Method: Over-dispersed Poisson model
Number of simulations: 10 000
Resampled (i.e. points from the distribution can be used more than once).
Gamma distribution (positively skewed distribution, allowing for positive reserves only).
Incurred Claims Triangle7:
Method: Mack (This is a better method to use if negative development patterns are present. Incurred triangles often have negative entries due to salvages, recoveries and initial over-estimating of case estimates.)
Number of simulations: 10 000
Resampled (i.e. points from the distribution can be used more than once).
Normal distribution (This allows for negative reserves.)
5. Results and comparisons: Technical Provisions
5.1 Short-term Insurance QIS The short-term insurance QIS was based on the second FCR calibration. The features of that calibration include the following:
It recommended that OCR should be calculated as best estimate case estimates. Depending on whether an insurer is currently calculating its
5 Refer to Appendix 2 for a short summary of the bootstrap methods used.
6 Using the development of the paid claims triangle result in a projected provision for OCR and IBNR
combined. 7 Using the development of the incurred claims triangle results in a projected IBNR provision.

10
OCR on a best estimate or more conservative method, the OCR should stay fairly similar. For the purpose of the QIS the OCR was the same as submitted in the statutory return. (Although some insurers submitted numbers in the QIS that differed from the statutory return for the same period.)
For the FCR exercise UPP was assumed to be at a 75% level of sufficiency. For the purpose of the QIS the UPP was the same as submitted in the statutory return. (Although some insurers submitted numbers in the QIS that differed from the statutory return for the same period.)
Prescribed margins were calculated on the combined best estimate OCR and IBNR to determine reserves as a 75% level of sufficiency.
A new method for determining IBNR was proposed. The proposal resulted in different percentages of earned premium per business class and developing period. The resulting factors to calculate an undiscounted net IBNR are given in the table below.
Table 6: FCR proposal for IBNR – taken from the 2009 Deloitte FCR calibration report, page 12
The graph below shows the difference in technical provisions between the first and second FCR calibration. Although there are differences in the direction of the change between the components, the second calibration resulted in a lower overall technical provision value than the first calibration.

11
Graph 1: Change in technical provisions from first to second FCR calibration – taken from the 2009 Deloitte FCR calibration report, page 47
The table below gives a summary of the technical provisions (in R’000) submitted in the QIS, split by business class.
Table 7: Summary of technical provisions from QIS, split per business class
Business Class OCR IBNR
(undiscounted)
IBNR
(discounted)
Prescribed
Margin on
Claims
Reserves (PM)
75%
Sufficiency
Claims
Reserves
UPP URP
Total reserves
at 75%
sufficiency
Accident 369 312 169 618 159 049 93 157 632 088 380 728 - 1 012 815
Engineering 396 857 189 991 175 115 122 713 709 560 1 390 887 - 2 100 447
Guarantee 454 000 233 542 208 778 131 440 818 983 1 136 439 7 000 1 962 421
Liability 2 821 419 391 110 352 317 600 260 3 812 789 1 401 058 161 290 5 375 137
Miscellaneous 159 121 111 264 102 341 78 135 348 520 1 094 481 - 1 443 001
Motor 2 841 256 704 375 658 574 465 990 4 011 622 2 145 717 - 6 157 339
Property 3 730 771 874 658 806 009 826 466 5 431 894 2 174 854 - 7 606 748
Transport 405 655 92 043 84 880 68 419 566 117 140 055 - 706 172
TOTAL 11 178 391 2 766 600 2 547 065 2 386 581 16 331 572 9 864 219 168 290 26 364 081

12
The next table summarises the same information, split by type of insurer.
Table 8: Summary of technical provisions from QIS, split per type of insurer Notes: - 75% sufficiency claims reserve is the sum of the OCR, undiscounted IBNR and the prescribed
margin on claims reserves. - Total reserves at 75% sufficiency is the sum of the 75% sufficiency claims reserves plus the UPP
and URP.
From this information the following can be noted:
The OCR and UPP reserves’ totals differ from that given in section 4.2 due to some insurers who submitted different numbers in the QIS compared to the originally submitted 2009 statutory return.
The undiscounted IBNR is less than is currently held, mostly because the largest business classes’ factors (in the QIS) are smaller than the current 7% requirement.
The total provisions (including margins) at a 75% level of sufficiency are a little higher than the current provisions (excluding the contingency reserve) held by the industry. The total provisions excluding the margins were 96% of the current provisions (excluding the contingency reserve).
Type of insurer OCR IBNR
(undiscounted)
IBNR
(discounted)
Prescribed
Margin on
Claims
Reserves (PM)
75%
Sufficiency
Claims
Reserves
UPP URP
Total reserves
at 75%
sufficiency
Typical 6 172 439 1 870 802 1 727 818 1 212 420 9 255 661 4 087 219 - 13 342 880
Niche 1 556 124 419 952 381 561 390 474 2 366 550 1 798 146 168 290 4 332 986
Reinsurer 1 260 637 148 971 136 858 283 390 1 692 998 422 316 - 2 115 314
Cell 1 697 326 300 499 276 948 391 919 2 389 745 3 550 197 - 5 939 941
Cell Captives 491 865 26 376 23 880 108 377 626 619 6 342 - 632 961
TOTAL 11 178 391 2 766 600 2 547 065 2 386 581 16 331 572 9 864 219 168 290 26 364 081
Total as a % of
the current
requirement 99.9% 66.2% 106.3% 104.8% 100.0% 105.7%

13
The table below contains the undiscounted IBNR (R’000) from the QIS expressed as a percentage of NWP to enable a comparison with the current IBNR requirement of 7% of NWP.
Table 9: QIS undiscounted IBNR as a percentage of NWP per business class This shows that although the FCR calibration is based on net earned premium, the result (in total) is similar to the current requirement. Splitting the requirement into business classes will make the method more risk-based as certain classes have much higher requirements (due to the underlying riskiness of the business) than others. Even though the results in the table above are based on net written premium they are close to the factors in the FCR recalibration proposal (refer to table 6).
5.2 Bootstraps on industry data based on statutory returns from 2009 The 50th and 75th percentiles of the resulting distributions were used as a comparison with the level of technical provisions suggested by the QIS. The results from the bootstraps were unusual and included very large and even negative values for some business classes. It was only for the largest class of business (motor) where sensible results were obtained8. The results for motor (the class with the most data) were similar to that from the QIS results. Possible reasons for the anomalies in the results for certain classes include the following:
8 The 50% percentile for Motor resulted in a 3% IBNR (of NWP) and the 75% resulted in an IBNR of 4% of
NWP.
Business class Net Written
Premium
Undiscounted
IBNR
Undiscounted
IBNR as a % of
NWP
Accident 2 409 968 169 618 7%
Engineering 2 109 486 189 991 9%
Guarantee 839 426 233 542 28%
Liability 2 255 053 391 110 17%
Miscellaneous 1 892 769 111 264 6%
Motor 18 196 854 704 375 4%
Property 12 620 661 874 658 7%
Transport 1 011 721 92 043 9%
TOTAL 41 335 937 2 766 600 7%

14
Large variability in underlying data possibly caused by the inclusion of reinsurers, captive and cell captive insurers.
Potential errors in the data i.e. incorrect completion by insurers.
The assumptions underlying the methodology were violated.
The number of simulations should have been increased to obtain a more stable result.
The results of the bootstraps were therefore not considered in making the recommendations.
5.3 Recommendations: Technical Provisions The following recommendations regarding interim technical provisions for short-term insurers are made: Unearned Premium Provision (UPP)
- Remain as in the current legislation, including the provision for reserves for “cash-back” benefits.
Outstanding Claims Reserve (OCR)
- Remain as in the current legislation.
Incurred But Not Reported reserve (IBNR)
- Implement as proposed in the FCR 2009 calibration report, using the undiscounted table (page 12 of the report) and no explicit allowance for prescribed margins.
Contingency Reserve - Remove.
Unexpired Risk Provision (URP) - Remain as in the current legislation.
It is therefore recommended that
no discounting of technical provisions take place (as is currently the case);
no explicit margins are added; and
if an insurer wants to apply for a different method during the interim period, the working group recommends that the technical provisions should be calculated using a method that would be consistent with Solvency II.

15
The rationale for the recommendations includes the following:
The FCR recalibration only allowed for discounting of the IBNR. To discount OCR and UPP a discounted cash flow approach is needed which will probably only be applicable in 2014. It is inconsistent to only discount one of the reserves.
The largest business classes (motor and property) generally have short tails and discounting would not make a material difference.
The FCR recalibration calculated an explicit claims margin (i.e. on the total of the IBNR and OCR). To add the proposed margin would mean that the insurer’s estimation of OCR must change to be at a best estimate only. For the sake of simplicity it was decided to include margins only from 2014 so that insurers can focus on the necessary changes and/or developments relating to the larger SAM project.
5.4 Impact of proposals for technical provisions
The impact on individual insurers will depend on the business mix. A detailed comparison between the resulting values from the QIS and the current values (per insurer) is given in Appendix 1. The graph below9 gives a scatter plot of the sum of all the liabilities based on the QIS as a percentage of the current liabilities (excluding the contingency reserve).
Graph 2: Technical provisions from QIS compared to statutory technical provisions held in 2009, per insurer
To make the left-hand side of the graph clearer, some of the larger insurers’ information was removed in the graph below:
9 One outlier has been removed in this graph.
0%
20%
40%
60%
80%
100%
120%
- 2 000 000 4 000 000 6 000 000 8 000 000 10 000 000 12 000 000 14 000 000
Tota
l QIS
liab
iliti
es
as p
erc
en
tage
of
20
09
liab
iliti
es
Gross Written Premium in 2009
Cell Cell Captive Niche Reinsurer Typical

16
Graph 3: Technical provisions from QIS compared to statutory technical provisions held in 2009, per insurer (excluding large insurers)
With a few exceptions, the QIS results are between 70% and 120% of the current liabilities. All reinsurers’ liabilities have decreased, which might require further attention. This was discussed at a meeting with representatives from reinsurers. It was suggested that additional information should be required, requiring reinsurers to submit information splitting premiums and reserves between proportional and non-proportional business and to possibly treat proportional business the same as for direct insurers and to investigate alternative factors for non-proportional business. This was discussed at the Steering Committee meeting held on 26 November 2010 and agreed that no further investigations are necessary for the interim period.
6. Results and comparisons: Capital Requirements
6.1 Short-term insurance QIS
The FCR calibration proposes a Total Capital Requirement (TCR) (which includes prescribed margins) as follows:
√(
)
(
)
Where
√
0%
20%
40%
60%
80%
100%
120%
- 200 000 400 000 600 000 800 000 1 000 000 1 200 000 1 400 000 1 600 000 1 800 000 2 000 000
Tota
l QIS
liab
iliti
es
as p
erc
en
tage
of
20
09
liab
iliti
es
Gross Written Premium in 2009
Cell Cell Captive Niche Reinsurer Typical

17
ACC* = Asset Capital Charge (before allowing for credit risk) ACRC = Asset Credit Risk Charge g1= Grossing-up factor on asset charge
√ ICC* = Insurance Capital Charge (before allowing for MER and credit risk)
√∑
NSCi = Net Stand-alone Capital for business class i MER = Maximum Event Retention RCRC = Reinsurance Credit Risk Charge g2= Grossing-up factor on insurance charge OR= Operational Risk (although no proposal was made in the calibration proposal) The Solvency Capital Requirement (SCR) is then calculated as
where PM is the total prescribed margins. The table below gives a summary of the results from the QIS submissions in R’000. The column for insurance risk excluding MER was calculated manually by excluding the MER from the ICC formula i.e. as
√ to determine the effect of the inclusion of the MER into the formula.

18
Table 10: QIS results for capital values Notes: - Total credit risk charge equals the ACRC plus RCRC - QIS Total Capital (SCR) is calculated using the ICC including the MER
It is clear that the total proposed capital requirement is much higher than what is currently being held by the industry. The table below expresses the figures in the table above as percentages of NWP during 2009.
Table 11: QIS results for capital values expressed as percentages of 2009’s NWP Note that the QIS total capital already includes the following minimum value tests:
13 weeks’ operating expenses; and
R10m
Insurance
Capital Charge
(ICC)
ICC excluding
MER
Typical 9 898 478 9 879 773 510 708 1 045 660 205 370 114 293 319 663 9 567 827 7 878 367
Niche 51 045 324 4 236 231 48 232 279 463 828 167 511 24 253 191 764 61 532 630 974 590
Reinsurer 1 136 318 1 057 946 290 707 224 687 55 921 26 942 82 863 973 058 520 088
Cell 4 047 902 3 948 570 576 322 542 263 80 568 18 342 98 910 3 732 162 1 205 543
Cell captive 488 705 464 673 117 555 11 744 7 321 3 503 10 824 405 037 52 937
TOTAL 66 616 726 19 587 192 49 727 570 2 288 183 516 691 187 334 704 025 76 210 716 10 631 525
Total Credit
Risk Charge
QIS Total
Capital (SCR)
Current 25%
Capital
Requirement
Insurance Risk
Type of insurer MERAsset Capital
Charge (ACC)
Asset Credit
Risk Charge
(ACRC)
Reinsurance
Credit Risk
Charge (RCRC)
Insurance
Capital Charge
(ICC)
ICC excluding
MER
Typical 32% 32% 2% 3% 1% 0% 1% 31%
Niche 1368% 114% 1293% 12% 4% 1% 5% 1649%
Reinsurer 56% 52% 14% 11% 3% 1% 4% 48%
Cell 88% 86% 13% 12% 2% 0% 2% 81%
Cell captive 250% 238% 60% 6% 4% 2% 6% 207%
TOTAL 161% 47% 120% 6% 1% 0% 2% 184%
QIS Total
Capital (SCR)
Type of insurer
Expressed as a percentage of NWP
Insurance Risk
MERAsset Capital
Charge (ACC)
Asset Credit
Risk Charge
(ACRC)
Reinsurance
Credit Risk
Charge (RCRC)
Total Credit
Risk Charge

19
The following table expresses the insurance risk component, as well as the total capital requirement as a percentage of the current capital requirement.
Table 12: Insurance risk component and SCR as percentages of current capital requirement The graph below shows the QIS insurance capital charge as a percentage of the current capital requirement per insurer for all insurers.
Graph 4: QIS insurance capital charge expressed as a percentage of the current capital requirement, per insurer
To make the left-hand corner of the graph clearer, some of the large insurers as well as insurers where the QIS capital charge is greater than 1000% of the current requirement, are excluded in the graph below.
Insurance
Capital Charge
(ICC)
ICC excluding
MER
Typical 126% 125% 121%
Niche 5238% 435% 6314%
Reinsurer 218% 203% 187%
Cell 336% 328% 310%
Cell captive 923% 878% 765%
TOTAL 627% 184% 717%
Insurance RiskType of insurer
Expressed as a percentage of the current capital
requirement
QIS Total
Capital (SCR)
0%
500%
1000%
1500%
2000%
2500%
3000%
- 2 000.00 4 000.00 6 000.00 8 000.00 10 000.00 12 000.00 14 000.00 QIS
insu
ran
ce c
apit
al c
har
ge a
s %
of
curr
en
t ca
pit
al
Gross Written Premium (R'm)
Cell Cell Captive Niche Reinsurers Typical

20
Graph 5: QIS insurance capital charge expressed as a percentage of the current capital requirement, per insurer (excluding some large insurers and insurers with percentages greater than 1000%)
6.2 Bootstraps on industry data based on statutory returns from 2009
The difference between the 99.5th and 50th percentiles of the distributions resulting from the bootstrap exercise was used as a crude proxy for capital requirements, to be used as an initial starting point for discussions. The table below shows the 99.5th less 50th percentile (based on the paid claims triangle) divided by net written premium for that business class, split per type of insurer. The last column (“QIS”) represents the net stand alone insurance capital charge (proposed in the FCR recalibration) divided by net written premium.
Table 13: Bootstrap proxy capital requirement as percentage of NWP split per business class and type of insurer From the table it is clear that the net stand alone insurance capital factors from the QIS appear very high for all business classes. Although the results from the bootstraps appear reasonable in total, the results for certain types of
0%
200%
400%
600%
800%
1000%
1200%
- 200 400 600 800 1 000 1 200 1 400 1 600 1 800 2 000
QIS
insu
ran
ce c
apit
al c
har
ge a
s %
of
curr
en
t ca
pit
al
Gross Written Premium (R'm)
Cell Cell Captive Niche Reinsurers Typical
Business class Typical Niche Reinsurer Captive Cell captive Total QIS
Property 15% 9% 6518% 223% 468% 17% 68%
Transport 39% 26% 548% 19% 161% 28% 121%
Motor 11% 61% 174% 59% 70% 11% 46%
Accident 11% 664% 400% 46% 46% 40% 122%
Guarantee 28% 344% 42460% 252025% -1% 32% 268%
Liability 45% 22% 29279% 356% 5689% 31% 175%
Engineering 13% 97% 23297% 0% 181% 25% 89%
Miscellaneous 9% 12% 14392% 54% 4412% 27% 271%
Total 14% 208% 7936% 164% 2715% 18% 83%

21
insurer do not look reasonable. The working group suggested that since the results of the bootstraps at the 50th percentile were unreliable, the difference between the 99.5th and 50th percentiles would also not be suitable for a basis for capital requirements. The working group suggested that a pragmatic approach (to determine the insurance risk capital charge) should rather be considered. This is explained in the next section.
6.3 Pragmatic approach for insurance risk capital charge
The pragmatic approach starts with an overall assumption of what the total insurance capital factor “should be”, expressed as a percentage of net written premium (to be comparable and consistent with the current requirements). The factors for the different business classes are then determined with reference to this total requirement. To determine what the relevant percentages per business class should be, the information from Solvency II’s QIS 5 was used to calculate differentials between business classes. In QIS 5 there are standard deviations per business class for both premium and reserve risk10. The current South African business classes were mapped to roughly correspond to the classes used by QIS 5. The table below illustrates the mapping as well as the standard deviations from QIS 5.
Table 14: Mapping of business classes and QIS 5 relativities Using relativities based on either premium or reserve risk did not change the results significantly. Sensitivities of the results depending on what relativities are used are shown later in this report in section 6.7. For the purposes of the analysis that follows the average of the two sets of sensitivities were used. A total insurance capital requirement of 25% of NWP was assumed because:
this equals the current total capital requirement (if the contingency reserve is seen as part of capital) and should therefore not increase the capital requirement of the industry significantly (in total – if an insurer only writes a business class with a higher capital factor the increase for that insurer will be higher than the average increase); and
10
Refer to paragraphs SCR.9.25 and SCR.9.29 of the QIS5 Technical Specifications
QIS 5 Business Class
Standard deviation for
premium risk (QIS5)
Standard deviation for
reserve risk (QIS5)
Motor vehicle liability 10% 9.5%
Other Motor 7% 10.0%
Marine, Aviation, Transport 17% 14.0%
Fire 10% 11.0%
3rd party liability 15% 11.0%
Credit 21.50% 19.0%
Legal expenses 6.50% 9.0%
Assistance 5% 11.0%
Miscellaneous 13% 15.0%
Mapping of SA business classes
Miscellaneous, Accident & Health
Motor
Transport
Property, Engineering
Liability
Guarantee

22
adding market, credit and operational risk to this level of insurance risk will increase the capital requirement. The expectation is that SAM will ultimately result in higher capital requirements compared to the current level.
The resulting capital factors per business class, using this pragmatic approach is given in the table below.
Table 15: Relativities used and resulting capital factors per business class Notes: - The industry NWP include the NWP of insurers in run-off (some premiums of run-off insurers were
negative).
- Under SAM, policies currently included in the Accident & Health class may be valued in the same way as life products.
The next graph indicates the relative size of the relative “riskiness” of the business classes (where Motor was set as the benchmark). According to the relativities used, Guarantee is the “riskiest” class, followed by Transport and then Liability, Miscellaneous and Accident & Health at basically the same level of riskiness.
Graph 6: Relative riskiness of business classes
The insurance risk capital charge (per insurer) was then calculated as the sum of the products of each business class’ NWP with the capital factors in
South African Business Class2009 Industry NWP
(R'000)Relativity used
Resulting capital
factors per class of
business
Resulting capital
amount per class
Motor 23 072 680 1.00 20% 4 600 401
Transport 1 541 043 1.91 38% 588 192
Property 16 623 120 1.26 25% 4 190 399
Engineering 2 277 769 1.26 25% 574 186
Liability 2 394 544 1.62 32% 774 138
Guarantee 1 028 468 2.49 50% 509 729
Accident & Health 3 105 250 1.68 33% 1 039 283
Miscellaneous 2 767 767 1.68 33% 926 332
Total 52 810 642 25% 13 202 660
0%
5%
10%
15%
20%
25%

23
the table above. The results are given in the table below – as expected, the total insurance capital requirement was 25% of NWP. As a test, to allow for diversification between business classes, a total capital requirement using the square root of the sum of the squares (of each product) was calculated which resulted in a lower total insurance capital requirement of 16%. (Using the heuristic formula of the square root of sum of squares assumes that all business classes are independent from each other.) The working group is comfortable to recommend insurance capital charges that do not allow for diversification between business classes.
Table 16: Results for Insurance Capital Charge using a pragmatic approach
The graph below shows the insurance capital charge (excluding diversification between business classes) as a percentage of NWP per insurer.
Graph 6: Pragmatic approach insurance capital charge (excluding diversification) expressed as a percentage of the net written premium, per insurer
Total (Sum)
Total (square
root of sum of
squares)
Total (Sum)
Total (square
root of sum of
squares)
Typical 7 357 847 4 483 581 24% 15%
Niche 1 237 217 1 095 437 33% 29%
Reinsurer 518 759 272 606 25% 13%
Cell 1 251 635 620 764 27% 14%
Cell captive 57 367 47 924 29% 25%
TOTAL 10 422 824 6 520 313 25% 16%
Insurance Capital Charge (R'000)Insurance Capital Charge as % of
NWP
Type of insurer
20%
25%
30%
35%
40%
45%
50%
55%
60%
- 2 000 4 000 6 000 8 000 10 000 12 000 14 000
Cell Cell Captives Niche Reinsurers Typical

24
The next graph shows the relative size of the results (in Rand) of the components (i.e. business classes) of the pragmatic approach’s insurance capital charge. In other words, 35% of the total Rand amount insurance capital charge relates to the Motor business class.
Graph 7: Relative size of the components of the insurance capital charge
6.4 Operational Risk
Operational risk is defined as “the risk of loss resulting from inadequate or failed internal processes, people and systems, or from external events”. The FCR Recalibration did not include a proposal for the calculation of Operational Risk. A possible solution for including Operational Risk in the capital requirements is to use the latest approach included in Solvency II’s QIS 5. The formula in QIS 5 is as follows11 (allowing for non-life business only): Operational risk capital requirement = MIN (0.3*Basic SCR, OP) Where:
Basic SCR = Solvency Capital Requirement before adjustments
OP = MAX (OPpremium, OPprovisions)
OPpremium = 0.03*(Gross earned premium) + max(0; 0.03 * (Gross earned premium – 1.1 * Gross earned premium in the previous year))
11
Refer to section SCR.3 in the QIS 5 Technical Specification, as well as sections SCR.3.3 and SCR.3.6 in the document “Errata to the QIS5 Technical Specifications Version of 10 August 2010”
8%
5%
4%
7%
6%
35%
31%
4%
Accident & Health
Engineering
Guarantee
Liability
Miscellaneous
Motor
Property
Transport

25
OPprovisions = 0.03 * max (0, Gross technical provisions (excluding margins))
In order to do a basic calculation to determine the impact of such a formula an assumption was made that the gross earned premium in the previous year was 10% less than the current gross earned premium (as the previous year’s premiums were not easily available). The formula then reduces to the following:
Basic SCR = Total Capital Requirement (using insurance risk as proposed by the pragmatic approach described in section 6.3 above and the proposal for calculating the basic SCR which is detailed in section 6.5 below)
OP = MAX (OPpremium, OPprovisions)
OPpremium = 0.03*(Gross earned premium)
OPprovisions = 0.03 * max (0, Gross technical provisions (excluding margins))
Gross technical provisions= OCR+IBNR(undiscounted)+UPR as per the QIS results based on the FCR calibration
Table 17: Estimation of operational risk capital requirement
6.5 Recommendations: Capital Requirement
The following recommendations are made for interim measures regarding short-term insurers’ capital requirements: 6.5.1 Minimum Capital Requirement (MCR):
The MCR will be the maximum of the following:
Type of insurer OP
30% of SCR
(Total capital
before
adjustments)
Operational
Risk Capital
Requirement
Operational
risk as % of
NWP
Typical 1 185 558 2 254 816 1 122 649 4%
Niche 231 045 432 705 195 639 5%
Reinsurer 171 677 178 397 151 920 7%
Cell 221 392 444 232 221 392 5%
Cell Captives 18 664 18 130 16 990 9%
TOTAL 1 828 335 3 328 279 1 708 588 4%

26
15% of net (of all reinsurance) written premium, where the net written premium is the higher of the immediate past 12 months, or the net written premium of the 12 months preceding the immediate past 12 months;
13 weeks’ operating expenses; and
R10 million The reasoning for the proposal includes the following:
The first requirement of 15% of net (of all reinsurance) written premium, is the same as the current capital requirement. Using this as a minimum effectively prevents a release of capital, should an insurer have a lower capital requirement under the proposed interim measures. This is desirable as the expectation is that the final capital requirements under SAM will probably be higher than the current requirements. On the other hand, it will also prevent insurers from being insolvent under the interim measures, as the regulator only applies its highest level of powers when the MCR is breached. If the SCR is breached some level of intervention will take place but the insurer will not be forced to close to new business and/or be placed under curatorship.
The requirement relating to 13 weeks’ operating expenses was introduced as the explicit expense allowance (in FCR) was removed in the last calibration. It is also consistent with the current minimum capital requirement for life insurers.
A monetary minimum of R10m is consistent with the current minimum capital requirement for life insurers.
6.5.2 Solvency Capital Requirement (SCR):
The SCR will be the maximum of
the MCR; and
the SCR as given in the formula below:
Where BSCR = Basic Solvency Capital Requirement
√( ) IC = Insurance Risk Capital Charge, based on the following table of factors of NWP, per business class12
12
Based on the pragmatic approach described in section 6.3
27
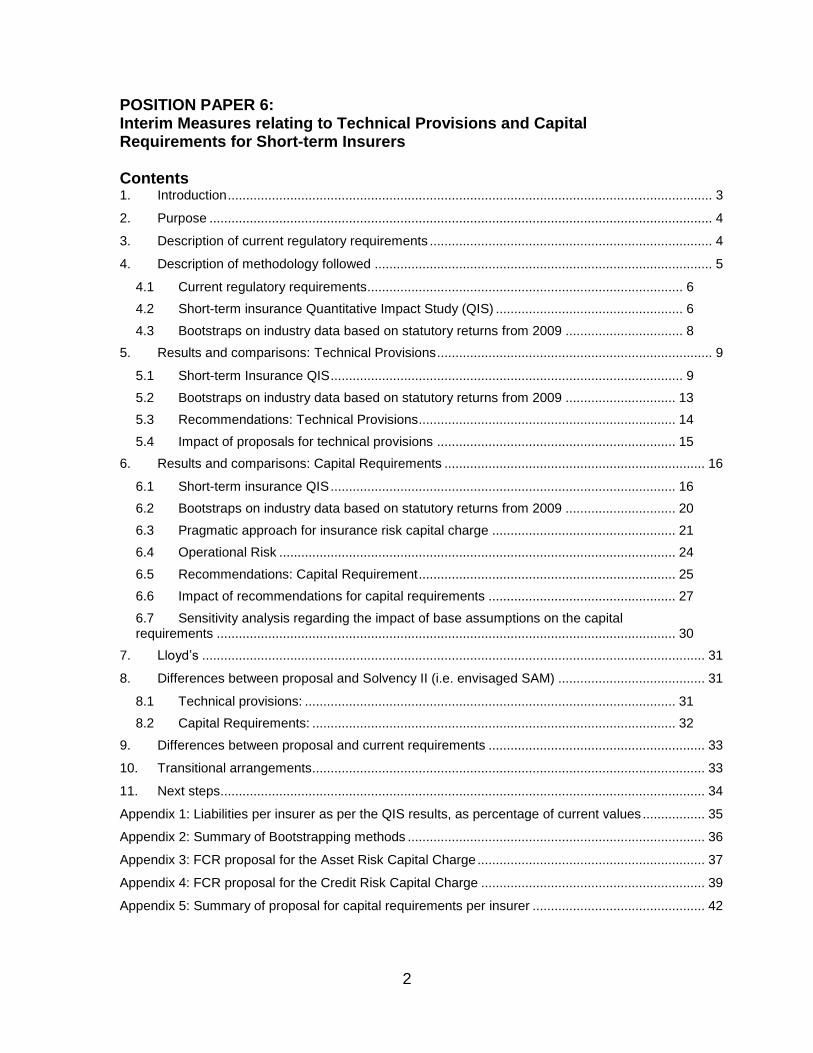
Table 18: Proposed factors for insurance risk capital charge
MC = Market risk Capital (i.e. ACC* as in the FCR calibration and calculated similarly – refer to Appendix 3 for more detail regarding its calculation) CC = Credit risk capital (use the sum of ACRC and RCRC calculated similarly as in the FCR calibration – refer to Appendix 4 for more detail regarding its calculation) OP = Operational risk Capital (using the current Solvency II QIS 5 formula)
The reasoning for the proposal includes the following:
The objective was to have a simple calculation so that insurers can concentrate on developments necessary for the larger SAM project and not to place undue strain on resources during the interim period.
Although a simple form, the insurance risk capital charge is more risk-based than the current flat percentage of 15% of NWP.
Market, credit and operational risk factors are added explicitly which brings the capital requirement in line with international practice.
No explicit allowance is made for catastrophe risk and the full impact of non-proportional insurance at this stage (as is currently the case). These issues will be addressed in the final requirements planned for 2014.
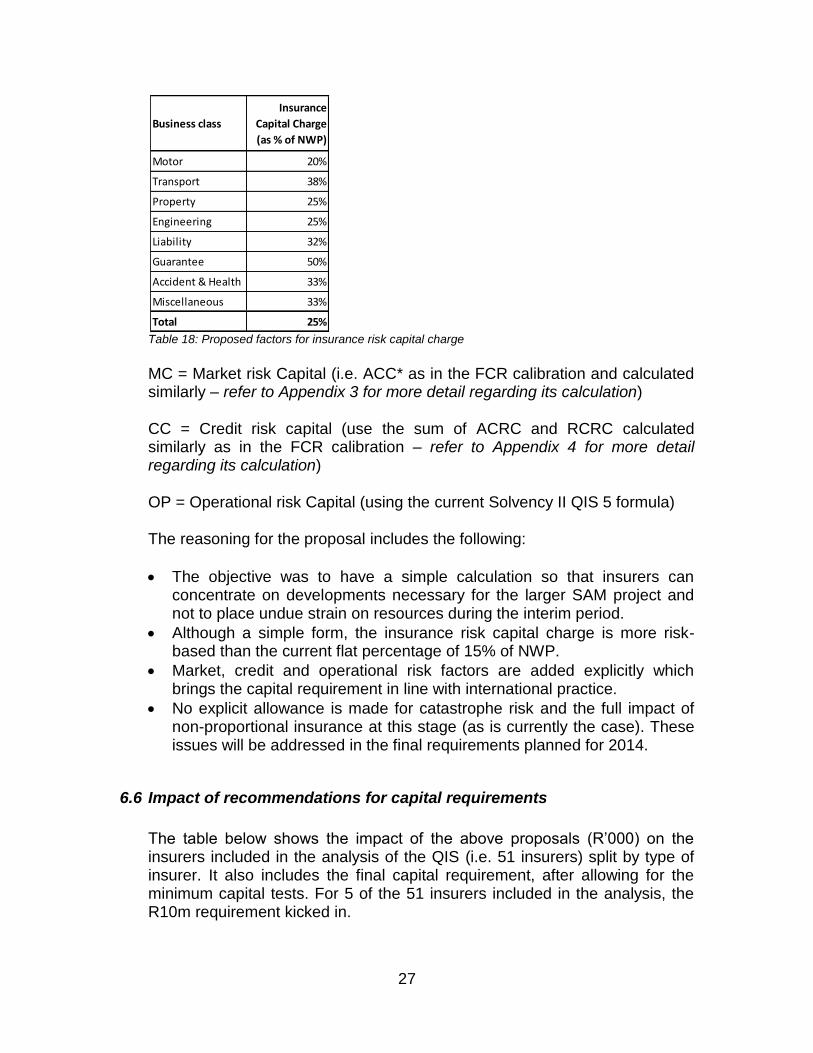
6.6 Impact of recommendations for capital requirements
The table below shows the impact of the above proposals (R’000) on the insurers included in the analysis of the QIS (i.e. 51 insurers) split by type of insurer. It also includes the final capital requirement, after allowing for the minimum capital tests. For 5 of the 51 insurers included in the analysis, the R10m requirement kicked in.
Business class
Insurance
Capital Charge
(as % of NWP)
Motor 20%
Transport 38%
Property 25%
Engineering 25%
Liability 32%
Guarantee 50%
Accident & Health 33%
Miscellaneous 33%
Total 25%
28
Table 19: Impact of proposed capital requirements
The graph below illustrates the SCR (before adjustments for minimum tests) as a percentage of net written premium, per insurer. This shows that there are significant increases for certain insurers writing riskier business classes.
Graph 8: SCR expressed as a percentage of net written premium, per insurer
The next graph shows the relative size of the components of the BSCR (i.e. before adding on Operational Risk) as well as the size of the diversification effect by using the heuristic aggregation formula for the BSCR.
Graph 9: Relative size of the components of the BSCR as well as the effect of allowing for diversification between the risks
Reinsurance Assets
Typical 7 357 847 1 045 660 114 293 205 370 7 516 053 1 122 649 8 638 702 8 638 702
Niche 1 237 217 463 828 24 253 167 511 1 442 349 195 639 1 637 988 1 662 913
Reinsurer 518 759 224 687 26 942 55 921 594 656 151 920 746 575 754 363
Cell 1 251 635 542 263 18 342 80 568 1 480 773 221 392 1 702 164 1 702 164
Cell captive 57 367 11 744 3 503 7 321 60 433 16 990 77 423 85 389
TOTAL 10 422 824 2 288 183 187 334 516 691 11 094 264 1 708 588 12 802 852 12 843 532
BSCR
Estimation of
Operational
risk (OP)
Total Capital
Requirement
(SCR)
Insurance risk
(IC)
Total Capital
Requirement
after MCR tests
Type of insurerCredit Risk (CC)
Market risk
(MC)
0%
20%
40%
60%
80%
100%
120%
140%
- 2 000 4 000 6 000 8 000 10 000 12 000 14 000
SCR
(B
efo
re a
dju
stm
en
t fo
r m
inim
um
cap
ital
) e
xpre
sse
d a
s a
% o
f N
et
Wri
tte
n P
rem
ium
Gross Written Premium (Rm)
Cell Cell Captive Niche Reinsurer Typical
-40%
-20%
0%
20%
40%
60%
80%
100%
Insurance risk Market risk Credit risk Diversification effect

29
The next table shows the impact of the components of the proposed capital requirements expressed as a percentage of net written premium. The factors calculated for insurance, market and credit risks are before allowing for diversification in the aggregation method to determine the BSCR.
Table 20: Impact of proposed capital requirements expressed as a percentage of NWP
The next graph shows the relative size of the components of the SCR as well as the (reduced) size of the diversification effect by using the heuristic aggregation formula for the BSCR.
Graph 10: Relative size of the components of the SCR as well as the effect of allowing for diversification between the risks
The table below shows the combined impact (R’000) of the proposals for technical provisions and capital requirements on the insurers’ solvency position. (This is again based only on the 51 insurers included in this analysis.) In aggregate the short-term insurance industry has the necessary capital available to fund the proposed interim requirements.
Typical 24% 3% 1% 4% 28% 28%
Niche 33% 12% 5% 5% 44% 45%
Reinsurer 25% 11% 4% 7% 37% 37%
Cell 27% 12% 2% 5% 37% 37%
Cell captive 29% 6% 6% 9% 40% 44%
TOTAL 25% 6% 2% 4% 31% 31%
Total Capital
Requirement
(SCR)
Total Capital
Requirement
after MCR tests
Type of insurerInsurance risk
(IC)
Market risk
(MC)Credit risk (CC)
Estimation of
Operational
risk (OP)
-40%
-20%
0%
20%
40%
60%
80%
100%
Insurance Market Credit Operational Diversification

30
Table 21: Impact of proposed technical provisions and capital requirements on the insurers’ solvency position
The following graph represents a break-down of the information in the table above, showing the SCR cover per insurer. No insurer included in the analysis had an SCR cover of less than 1. More detail regarding the different components of the SCR and the impact on solvency per insurer, is given in Appendix 5.
Graph 11: SCR cover per insurer
6.7 Sensitivity analysis regarding the impact of base assumptions on the capital requirements
The table below shows the sensitivity of results based on the use of different relativities (i.e. either premium, reserve or the average of the two from QIS 5) and base insurance risk capital factor. In the table the scenario used for the preparation of this report (i.e. the average of premium and reserve relativities and an insurance risk factor of 25% in total) was used as the base scenario.
Typical 30 841 338 12 130 459 18 710 878 8 638 702 10 072 176 2.17
Niche 15 047 693 3 942 512 11 105 181 1 662 913 9 442 268 6.68
Reinsurer 6 781 228 1 831 924 4 949 304 754 363 4 194 940 6.56
Cell 9 809 367 5 548 022 4 261 345 1 702 164 2 559 181 2.50
Cell captive 871 247 524 583 346 664 85 389 261 275 4.06
TOTAL 63 350 873 23 977 501 39 373 372 12 843 532 26 529 840 3.07
SCR Free Assets SCR CoverType of insurerStatutory
Assets
Total Technical
ProvisionsExcess Assets
-
5
10
15
20
25
30
- 2 000 4 000 6 000 8 000 10 000 12 000 14 000
SCR
Co
ver
(allo
win
g fo
r m
inim
um
val
ue
s)
Gross written premium (R'm)
Cell Cell Captive Niche Reinsurer Typical

31
Table 22: Sensitivity analysis regarding the impact of base assumptions on the capital requirements
As expected, using a 25% insurance risk capital factor result in higher values than 20% or 15%. However, regardless of the insurance risk capital factor chosen, the relativities used did not make a significant difference to the results.
7. Lloyd’s
It is proposed that the value of the minimum amount of the security to be provided by or on behalf of a Lloyd’s underwriter stays unaltered during the interim measures period.
8. Differences between proposal and Solvency II (i.e. envisaged SAM)
8.1 Technical provisions:
Interim measures proposal
Solvency II
Technical provisions mainly based on current methodology.
Technical provisions based on discounted cash flow.
No discounting of technical provisions.
Technical provisions are discounted.
No explicit allowance for margins.
Margins are calculated on the cost of capital method.
Using the current business classes as in the Act
Classes of business differ from what we currently use in South Africa
Base insurance
risk capital
charge
assumed
Insurance Risk
(IC)BSCR
Operational
Risk (OP)SCR
SCR after
minimum testsFree assets SCR Cover
25% 100.16% 100.03% 100.22% 100.06% 100.06% 99.97% 99.94%
25% 99.80% 100.00% 99.58% 99.95% 99.95% 100.03% 100.05%
25% 100.00% 100.00% 100.00% 100.00% 100.00% 100.00% 100.00%
20% 80.13% 82.19% 97.80% 84.27% 84.35% 107.58% 118.55%
20% 79.84% 82.20% 97.22% 84.21% 84.29% 107.60% 118.63%
20% 80.00% 82.18% 97.54% 84.23% 84.31% 107.59% 118.61%
15% 60.10% 64.75% 94.31% 68.69% 68.92% 115.05% 145.11%
15% 59.88% 64.78% 93.98% 68.68% 68.91% 115.05% 145.12%
15% 60.00% 64.75% 94.16% 68.68% 68.90% 115.06% 145.15%
Premium
Reserve
Premium & Reserve (50:50)
Premium
Reserve
Premium & Reserve (50:50)
Premium
Reserve
Premium & Reserve (50:50) (Base
scenario)
Relativity used

32
8.2 Capital Requirements:
Interim measures proposal
Solvency II
Factors/methods to allow for insurance risk, market risk and credit risk differ from that of Solvency II
Allowance for lapse risk (in QIS 5) which was not considered for interim measures.
No allowance for catastrophe risk
Allowance for catastrophe risk based on European-specific calibrated events.
Allowance for operational risk the same as in Solvency II (QIS 5)
Allow for both an MCR and SCR as in Solvency II (although the formulae differ)
No allowance for intangibles and other adjustments as in Solvency II
Aggregation of risk (referring to insurance, market and credit risks) is done via a heuristic formula (assuming independence of risks)
Aggregation of risk is done by using correlation matrices
Accident and health business treated similarly to other short-term insurers.
In Solvency II, technical provisions for Accident and Health business will need to be determined similarly to that of life business, if the nature of the product is similar to life. The same applies to the capital requirements.
33
9. Differences between proposal and current requirements
Technical Provisions
Differences
Unearned Premium Provision (UPP)
No difference
Outstanding Claims Reserve (OCR)
No difference
Incurred But Not Reported reserve (IBNR)
Instead of one percentage, the applicable percentage is
different depending on the business class;
depends on a 6-year development pattern
applied to net earned premium (relating to the relevant development period) instead of net written premium
Contingency Reserve Removed
Unexpired Risk Provision (URP) No difference
Capital Requirements
Differences
Explicit allowance for insurance, market, credit and operational risk
Allowance for all risks was made in one single factor
Two capital levels are introduced – an MCR and SCR
Only one capital level existed
Monetary minimum level of capital of R10m
Monetary minimum level of capital of R5m
10. Transitional arrangements
No phase-in period is envisaged for the interim measures. However, should an insurer have particular difficulty in meeting the new requirements, the existing avenues can be used to apply for a different method of calculating of technical provisions and/or a relaxation in the MCR or SCR. Please note that relaxation of capital requirements will only be considered if an insurer is

34
financially unsound or insolvent, and not to only improve the insurer’s solvency position.
11. Next steps
A new draft Board Notice will be drafted (based on these proposals) for industry comment during 2011.

35
Appendix 1: Liabilities per insurer as per the QIS results, as percentage of current values
Notes: - In the last column the total QIS liabilities (excluding margins) are compared with the current technical liabilities
excluding the contingency reserve. - Size indicator: Big – GWP in 2009 greater than R1bn; Medium – GWP in 2009 greater then R500m (but smaller than
R1bn); Small – GWP in 2009 smaller than R500m
UPP and URP OCR IBNR
Total claims
reserve
(excluding
margins)
Total claims
reserve (including
margins)
Total Liabilities
(Excluding
margins)
1 C Big 100% 99% 65% 91% 108% 96%
2 C Big 100% 100% 49% 95% 113% 98%
3 C Small 100% 100% 39% 57% 70% 84%
4 C Big 100% 100% 75% 91% 109% 98%
5 C Small 100% 100% 101% 101% 129% 100%
6 CAP Small 100% 100% 102% 100% 122% 100%
7 CAP Small 100% 100% 126% 101% 121% 101%
8 CAP Small 100% 100% 94% 100% 135% 100%
9 CAP Small 100% 100% 249% 103% 123% 103%
10 N Medium 100% 100% 56% 81% 95% 82%
11 N Small 100% 99% 223% 104% 122% 104%
12 N Small 100% 100% 80% 93% 126% 97%
13 N Medium 100% 100% 18% 43% 50% 43%
14 N Small 100% 100% 11% 58% 72% 89%
15 N Medium 100% 100% 128% 105% 133% 102%
16 N Medium 100% 100% 139% 110% 132% 107%
17 N Medium 100% 100% 96% 99% 125% 99%
18 N Small 100% 100% 61% 97% 118% 98%
19 N Medium 100% 100% 69% 71% 94% 98%
20 N Medium 100% 100% 97% 97% 130% 99%
21 N Small 100% 100% 30% 68% 93% 91%
22 N Small 117% 100% 17% 30% 36% 91%
23 N Small 100% 100% 4682% 4682% 5963% 4682%
24 N Small 100% 100% 79% 89% 123% 90%
25 N Small 100% 100% 98% 100% 132% 100%
26 N Small 100% 100% 78% 90% 126% 95%
27 N Small 100% 100% 118% 118% 148% 103%
28 N Small 100% 100% 104% 104% 156% 104%
29 N Small 100% 100% 113% 113% 171% 105%
30 R Big 100% 100% 18% 69% 83% 74%
31 R Small 100% 100% 2% 75% 94% 75%
32 R Big 100% 100% 31% 78% 92% 83%
33 R Big 100% 100% 56% 90% 108% 92%
34 R Small 100% 100% 6% 57% 74% 70%
35 R Small 100% 100% 55% 55% 97% 91%
36 T Big 100% 100% 79% 93% 112% 96%
37 T Medium 100% 100% 91% 98% 118% 98%
38 T Big 100% 100% 105% 101% 116% 101%
39 T Medium 100% 100% 72% 95% 113% 96%
40 T Big 116% 100% 93% 98% 111% 103%
41 T Big 118% 100% 79% 94% 109% 101%
42 T Big 100% 100% 69% 92% 107% 97%
43 T Big 100% 100% 94% 97% 123% 98%
44 T Big 100% 100% 106% 103% 128% 101%
45 T Big 100% 100% 97% 99% 117% 99%
46 T Small 143% 100% 46% 87% 108% 107%
47 T Medium 100% 100% 220% 114% 140% 111%
48 T Medium 100% 100% 123% 109% 135% 104%
49 T Medium 100% 100% 48% 82% 98% 91%
50 T Small 100% 101% 66% 85% 109% 87%
51 T Medium 100% 100% 80% 95% 119% 97%
TOTAL 105% 100% 66% 91% 106% 96%
Liabilities: QIS Results as a % of ST2009 values
Insurer
number Type Size indicator

36
Appendix 2: Summary of Bootstrapping methods Over-dispersed Poisson Bootstrapping Method 1. Fit a development factor/chain ladder model. 2. Calculate differences between the actual data and the expected data
according to the model for each cell in the development triangle. These differences are called "Residuals".
3. Adjust the Residuals using the variance model/assumptions to make all the residuals appear as though they come from the same distribution.
4. Generate a new data triangle. This is done for each cell of the triangle by taking the fitted value from the initial model, selecting a residual at random and deriving a new data point. This is known as "pseudo data".
5. Refit the original model to the pseudo data and estimate future incremental development.
6. For each projected future development point, add further variation to represent the process variance. One way of doing this is to select a residual at random and derive a new projected data point (based on the pseudo data model projected future development)
7. Sum the projected future data to derive reserve estimates. 8. Repeat steps 4 to 7 for the required number of simulations, saving the
reserve estimates from each simulation. 9. Use the saved reserves from step 8 to produce a probability distribution. Summary of the Mack Bootstrapping Method This is identical to the Over-dispersed Poisson model except steps 2, 4, and 5 are replaced by the following: 2. Residuals are calculated based on actual and modelled development factors. 4. Generate a new triangle of pseudo development factors (instead of pseudo
data). 5. The re-fitted model is based on the development factors, but the original date
is used for the weights in calculating selected averages.

37
Appendix 3: FCR proposal for the Asset Risk Capital Charge13 Investment risk is confined to the market risk aspect, i.e. the risk that market movements cause a loss in value of the assets held to back liabilities and solvency capital requirements to such an extent that solvency is threatened.
Figure 1: Overview of model - Asset Charge
The calibrated capital adjustment factors for each asset class should provide protection up to a specified level of confidence but not necessarily against all possible eventualities. The capital adjustment factor is applied to the value of the assets held in that class to arrive at an amount of capital to be held as a charge for investment risk. The aim of the capital adjustment factor is to provide the specified level of protection against loss in market value on only the assets backing the liabilities and other capital elements. The intention is not to protect the free assets that do not cover capital requirements. Therefore the capital adjustment factor only needs to be applied in relation to the assets backing the liabilities and regulatory capital elements. This implies that the assets would have to be allocated to the liabilities and capital elements to decide what assets the capital adjustment factors needs to be applied to. To minimise capital requirements, it is likely that the approach would
13
Copied from the 2009 FCR recalibration report, section 9
Solvency
Capital
Required

38
be to first allocate the asset classes with the lowest capital adjustment factor. A more desirable approach would be to first allocate the assets that match the liabilities by nature, term and currency, but this is likely to produce much the same result given the types of business generally considered here. The capital adjustment factors were not recalibrated. The factors calibrated using The Smith model during the initial calibration are shown below. In our report on the initial calibration, in Appendix G, we include a more detailed description of The Smith Model, and Appendix H shows the allocation of the FSB’s asset categories to the modelled asset categories.
The calculation of the capital charge on investments is a multi-step process:
1. First, assets have to be matched or allocated to liabilities, starting with current and other liabilities and ending in the assets remaining being allocated to insurance liabilities (claims and premium reserves).
2. Thereafter, the relevant asset charges (as discussed in this section) are applied to the split of assets backing the insurance liabilities.
3. Finally, this asset capital charge is combined with the insurance capital charge of the previous section to allow for covariance effects. This is explained in the following section and involves another set of asset allocations – in this instance to match the asset capital charge and insurance capital charge with appropriate assets.
As discussed, in order to calculate the investment risk capital charge, assets have to be allocated to back the liabilities. The assets allocated should be the actual assets held by the company and not notional assets as per an investment mandate or other method. When sufficient assets have been allocated to back the full amount of the liabilities, the investment capital charge for each asset class and currency can be calculated by applying the capital factor to the amount of assets. The capital charges for each class of assets are as follows:

39
Appendix 4: FCR proposal for the Credit Risk Capital Charge14 In this section we set out the way in which credit risk is allowed for. The credit risk component takes into account the credit risk (the inability or unwillingness of a counterparty to fully meet its own contractual financial obligations) inherent in various assets held by the insurer. This includes both investment assets and reinsurer assets. Institutions/instruments obtain credit ratings from various professional credit rating agencies. The various agencies do not always use consistent rating categories and the default probability for an international rating is not the same as for a national rating. The table below gives the credit ratings based on the Standard and Poor’s equivilent National rating to the Standard and Poor’s International, local currency rating.
To accommodate different rating categories the categories of three agencies were mapped to ensure they relate to the same level of default risk and hence capital charge. The mapping of the rating agencies are shown below:
These credit risk charges are broadly consistent with the charges in the Actuarial Society of South Africa’s Professional Guidance Notes 104 (PGN104) for long-term insurers.
14
Copied from the 2009 FCR recalibration report, section 10

40
Where other rating agencies have been used (i.e. not listed above), a factor should be used which corresponds to those listed above. Where there is no rating for an instrument, or the credit counterparty has not been rated, the minimum factor that can be used for unrated exposures is that as for a BB rated instrument (13.6%). This is a minimum, and the credit quality of the counterparty should be considered before applying this minimum. For government debt and debt instruments carrying an explicit South African government guarantee and issued in South African Rand, a charge of 0% is used. For assets with a duration of shorter than 1 year, the charge used is 25% of the charge in the table. This method is consistent with PGN104. The credit risk component is calculated for assets backing technical reserves. The reduction in the reserves due to approved reinsurance must be included as a notional asset in the calculation. The assets to be included are assets held where credit risk is assumed and include, but are not limited to:
Bonds and short-term deposits (promissory notes, letters of credit, convertibles, etc)
OTC derivative positions (looking at the counterparty of the derivative and the market value of the derivative). This will include swaps, options, forwards, etc.
Preference shares (if not allowed for as an equity investment in determining investment capital charge)
Policies of insurance and reinsurance
Debtors
Intermediary balances
Credit derivatives
Collective investment schemes should be considered on a “look through” basis to take into account the underlying holdings of each collective investment scheme in which they have invested in order to calculate the credit risk on the underlying instruments. Approximate methods that give reasonable answers may be used where the calculations are too complex. For each credit rating category an associated Probability of Default (PD) is available. If the credit risk factors are to be based only on the PD, this may fail to take into account security measures (i.e. collateral) underlying the assets or potential salvages or recoveries in the event of default. This may be achieved by the application of a Loss Given Default (LGD) factor. However, the LGD will be unique to each insurer’s asset portfolio and is virtually impossible to determine accurately at an industry level. The importance or otherwise of the LGD may well depend on the typical nature of assets for Short Term insurers. By ignoring the LGD, one is effectively setting LGD = 100%, thus obtaining a more prudent

41
result. PGN104 does allow the insurer to take credit for collateral that has been posted. Currently the FCR prescribed model does not make allowance for this. Interim measures proposal: In the FCR proposal the credit risk charge component relating to assets backing technical liabilities is combined with the Asset Capital Charge using the heuristic rule of summing the squares of the two capital charges and taking the square root. Similarly, the credit risk component relating to the reinsurance assets is combined with the Net Stand-alone Capital, for each class of business, and the MER using the heuristic rule of summing the squares of the two capital charges and taking the square root. For the interim measures it is proposed that the credit risk charges relating to assets and reinsurance assets are simply added together.

42
Appendix 5: Summary of proposal for capital requirements per insurer
Insurance risk Market risk Credit risk Operational
risk SCR cover
1 C Big 34% SCR 34% 29% 5% 2% 4% 2.28
2 C Big 54% SCR 54% 26% 41% 3% 6% 2.45
3 C Small 32% SCR 32% 29% 0% 2% 3% 3.84
4 C Big 32% SCR 32% 26% 4% 1% 6% 2.79
5 C Small 25% SCR 25% 22% 0% 2% 2% 1.58
6 CAP Small 33% SCR 33% 27% 0% 0% 7% 8.71
7 CAP Small 41% R10m 200% 31% 0% 10% 8% 7.38
8 CAP Small 33% SCR 33% 25% 0% 2% 8% 5.38
9 CAP Small 43% SCR 43% 31% 10% 8% 10% 2.08
10 N Medium 55% SCR 55% 50% 7% 4% 5% 2.58
11 N Small 64% SCR 64% 32% 48% 3% 6% 4.55
12 N Small 33% SCR 33% 25% 1% 4% 7% 2.82
13 N Medium 40% SCR 40% 33% 3% 15% 3% 8.83
14 N Small 3342% SCR 3342% 40% 2241% 1259% 771% 12.09
15 N Medium 31% SCR 31% 26% 0% 2% 5% 23.45
16 N Medium 46% SCR 46% 35% 21% 1% 5% 2.12
17 N Medium 33% SCR 33% 26% 11% 0% 5% 2.11
18 N Small 67% SCR 67% 32% 42% 10% 14% 7.16
19 N Medium 38% SCR 38% 31% 14% 1% 4% 1.73
20 N Medium 45% SCR 45% 28% 5% 20% 10% 25.27
21 N Small 126% R10m 1531% 28% 0% 93% 29% 5.49
22 N Small 65% SCR 65% 50% 0% 7% 15% 16.58
23 N Small 75% R10m 27778% 50% 0% 29% 17% 2.58
24 N Small 34% SCR 34% 26% 0% 4% 8% 1.17
25 N Small 33% SCR 33% 25% 4% 1% 8% 3.28
26 N Small 29% SCR 29% 26% 0% 0% 3% 1.60
27 N Small 52% SCR 52% 50% 0% 0% 2% 1.89
28 N Small 36% R10m 86% 33% 0% 1% 3% 1.48
29 N Small 28% SCR 28% 25% 0% 0% 3% 1.93
30 R Big 33% SCR 33% 25% 11% 3% 6% 5.28
31 R Small -12899% SCR -12899% -44% -6921% -8518% -1923% 17.14
32 R Big 37% SCR 37% 28% 4% 1% 8% 5.57
33 R Big 40% SCR 40% 24% 17% 8% 9% 7.53
34 R Small 43% SCR 43% 25% 22% 2% 10% 12.66
35 R Small 29% R10m 131% 25% 0% 1% 4% 13.60
36 T Big 70% SCR 70% 58% 0% 9% 12% 1.48
37 T Medium 32% SCR 32% 24% 0% 6% 7% 3.80
38 T Big 26% SCR 26% 23% 1% 0% 3% 2.46
39 T Medium 29% SCR 29% 22% 0% 3% 7% 3.04
40 T Big 27% SCR 27% 24% 2% 0% 3% 2.10
41 T Big 27% SCR 27% 23% 6% 1% 4% 1.72
42 T Big 29% SCR 29% 23% 9% 4% 4% 2.56
43 T Big 30% SCR 30% 26% 0% 0% 3% 2.53
44 T Big 32% SCR 32% 25% 1% 1% 7% 1.71
45 T Big 27% SCR 27% 22% 9% 1% 3% 1.93
46 T Small 23% SCR 23% 20% 0% 1% 3% 2.85
47 T Medium 33% SCR 33% 25% 0% 4% 8% 3.03
48 T Medium 34% SCR 34% 28% 8% 5% 5% 2.08
49 T Medium 27% SCR 27% 21% 0% 0% 6% 2.90
50 T Small 25% SCR 25% 22% 0% 0% 3% 1.91
51 T Medium 36% SCR 36% 27% 0% 4% 8% 4.10
Total 31.0% 31.1% 25% 6% 2% 4% 3.07
Insurer number Insurer
type
Size
indicator
SCR
expressed as a
% of NWP
Individual components(before aggregation) of the capital
requirement expressed as % of NWP Final Capital
Adequacy
Requirement
as a % of NWP
"Type" of
capital
requirement