Solutions for Combating Marine Oil Spills · Linus Malmquist, UCPH Thorvaldsensvej 40, 1871 Frb C...
26
This project is supported by the European Union under the Food, Agriculture and Fisheries and Biotechnology theme of the 7 th Framework Programme for Research and Technological Development under GA no. 312139 Kill•Spill Integrated Biotechnological Solutions for Combating Marine Oil Spills Deliverable D2.6 New isomer-based methods for monitoring of bioremediation
Transcript of Solutions for Combating Marine Oil Spills · Linus Malmquist, UCPH Thorvaldsensvej 40, 1871 Frb C...
This project is supported by the European Union under the Food, Agriculture and Fisheries and Biotechnology theme of the 7th Framework Programme for Research and Technological Development under GA no. 312139
Kill•Spill
Integrated Biotechnological Solutions for Combating Marine Oil Spills
Deliverable D2.6
New isomer-based methods for monitoring of bioremediation

Work package WP2 Research and technological development
Deliverable no. D2.6
Deliverable title New isomer-based methods for monitoring of bioremediation
Due date: 2016-01-31 (Month 36)
Actual submission date: 2016-04-22 (Month 40)
Start date of project: 2013-01-01
Deliverable Lead Beneficiary (Organisation name)
UCPH
Participant(s) (Partner short names) UCPH1, GEUS2.
Author(s) in alphabetic order: J. Aamand2, J. Christensen1, A. Johnsen2, L. Malmquist1
Contact for queries: Linus Malmquist, UCPH Thorvaldsensvej 40, 1871 Frb C (Denmark) T: +45 35320486 E: [email protected]
Dissemination Level: (PUblic, Restricted to other Programmes Participants, REstricted to a group specified by the consortium, COnfidential only for members of the consortium)
PU
Deliverable Status: final
Grant Agreement no. 312939 Deliverable D2.6 New isomer-based methods for monitoring of bioremediation
ii
Table of Contents
1 About this deliverable ..................................................................................................................... 1
2 Introduction ..................................................................................................................................... 2
2.1 Internal Standards used in sample preparation ...................................................................... 2
2.1.1 Internal standards for biomarker quantification (GC-MS) .............................................. 2
2.1.2 Internal standards for semi-quantitative diagnostic isomer ratio calculations .............. 2
2.1.3 Internal standards for GC-MS analysis for PAC quantification ........................................ 2
2.2 Extraction from sediment ........................................................................................................ 3
2.2.1 Sampling .......................................................................................................................... 3
2.2.2 Extraction model 1: Stepwise ultrasonication extraction and silica gel cleanup ............ 4
2.2.3 Extraction model 2: Simultaneous extraction and cleanup using pressurized liquid extraction (PLE) ............................................................................................................... 5
2.2.4 Extraction and cleanup of oil from water and oil/water emulsions ............................... 7
3 GC-MS method for PAC and biomarker analysis ............................................................................. 9
3.1 Introduction ............................................................................................................................. 9
3.2 Sample preparation ................................................................................................................. 9
3.3 Standards ................................................................................................................................. 9
3.3.1 GC-MS analysis for PAC quantification and diagnostic ratio calculations ....................... 9
3.3.2 Biomarker quantification (GC-MS) ................................................................................ 10
3.4 Instrument settings and equipment ...................................................................................... 10
3.5 GC-MS data analysis .............................................................................................................. 15
3.5.1 Peak area quantification................................................................................................ 15
4 References ..................................................................................................................................... 21

Grant Agreement no. 312939 Deliverable D2.6 New isomer-based methods for monitoring of bioremediation
iii
List of Figures
Figure 1. Diagram showing the content of this protocol, covering sample preparation, chemical analysis and data treatment. Extraction and cleanup of petroleum hydrocarbons for GC analysis .......................................................................................................................... 1
Figure 2. Illustration of the preparation of a small chromatographic column, packed from its base with a glass filter, activated silica and anhydrous sodium sulfate. Also a brief description of the sample cleanup procedure is shown. .................................................... 5
Figure 3. PLE extraction cell components. ......................................................................................... 5
Figure 4. Scheme of the PLE extraction cell packing and extraction parameters. ............................ 7
Figure 5. Chromatograms of injections of a mix of DFTPP, Pentaclorophenol, Benzidine and DDT from a GC-MS operating in ideal conditions (a) and a GC-MS in bad conditions (b). ..................................................................................................................................... 11
Figure 6. PW-plot. Example of relative changes in composition of n-alkanes in soil extracts compared to original oil after 1 year of weathering. ....................................................... 16
Figure 7. Example of relative changes in composition of mono-, di- and tri cyclic aromatic compounds in soil extracts compared to original oil after 1 year of weathering. ........... 17
Figure 8. Example of relative changes in composition of sulfur containing di- and tricyclic aromatics in soil extracts compared to original oil after 1 year of weathering. .............. 18
Figure 9. Employment of diagnostic ratios to show the degree of weathering of an oil after one year. .................................................................................................................................. 19
List of Tables
Table 1. List of the most appropriate internal and recovery standards for the quantification of 19 selected PAHs................................................................................................................. 3
Table 2. List of the most appropriate internal and recovery standards for the 19 PAHs............... 10
Table 3. DFTPP key ions and ion abundance criteria. (USEPA 1998) See USEPA method 8270D, t3 for DFTPP acceptance criteria. ..................................................................................... 10
Table 4. Ions of the key compounds responsible for the control of chromatographic conditions. ........................................................................................................................ 11
Table 5. List of compounds, SICs and corresponding groups of GC-MS/SIM as described by (Gallotta and Christensen 2012) ....................................................................................... 13
Table 6. Biodegradation diagnostic ratios (DRs) of selected petroleum hydrocarbons................. 20

Grant Agreement no. 312939 Deliverable D2.6 New isomer-based methods for monitoring of bioremediation
1
1 About this deliverable
This protocol standardizes the extraction, sample preparation and analysis of Total Petroleum Hydrocarbons (TPH), Polycyclic Aromatic Compounds (PACs) and biomarkers from sediment and soil samples. With this protocol, samples evaluating remediation technologies of oil spills are standardized, allowing comparisons and summation across different remediation approaches. The protocol is based on current governmental standard methods (USEPA, NIST, CEN Bonn-OSInet, etc.) and published scientific data analysis approaches developed to take full advantage of state-of-the-art instrumentations for detailed analysis of the progress and extent of employed remediation technologies.
The protocol first describes two methods for extraction and cleanup of petroleum hydrocarbons from sediment and one for extraction of petroleum hydrocarbons from water. Furthermore, the protocol includes an analytical approach, GC-MS, and three data analysis approaches to reach to the assessment of the efficiency of the applied cleanup and remediation technologies. These are:
I. Calculation of the total weathering degree. Data are obtained from quantifications of C30-α,β-hopane in the oil.
II. Chemical fingerprints of C0-C4 alkyl-substituted polycyclic aromatic compounds (PACs).
III. Calculation of process-specific diagnostic ratios to assess the contribution of different weathering and degradation processes to the total removal.
The protocol lists quantification standards, certified reference materials and quality control procedures that would be beneficial to employ in standard analyses, when assessing cleanup and remediation technologies applied to oil spills. See Figure 1 for an overview of the deliverable.
Environmental Sampling
Step-wise sonication and clean up
Simultaneous extraction and cleanup
with PLELiquid/liquid
GC-MS
Total weathering degree Chemical fingerprints Diagnostic ratios
Figure 1. Diagram showing the content of this protocol, covering sample preparation, chemical analysis and data treatment. Extraction and cleanup of petroleum hydrocarbons for GC analysis

Grant Agreement no. 312939 Deliverable D2.6 New isomer-based methods for monitoring of bioremediation
2
2 Introduction
This deliverable standardizes the extraction of petroleum hydrocarbons from sediment and water samples to be used for the assessment of applied remediation technologies.
Efficient extraction, preconcentration and cleanup are indispensable prior to the determination of PAHs in water, soil and sediments. There exists a wide variety of solvent extraction techniques commonly used for extracting hydrocarbons from soil and sediments. Soxhlet extraction, which has high extraction efficiency, has been the standard method for preparing a solvent extract of solid matrices containing PAHs. Other traditional extraction procedures include ultrasonication (Luque-Garcia and de Castro, 2003; Banjoo and Nelson, 2005), mechanical shaking (Berset et al., 1999), reflux with methanolic KOH and steam distillation. Modern instrumental techniques include supercritical fluid extraction (SFE) (Barnabas et al., 1995; Benner, 1998), pressurized liquid extraction (PLE; Dionex trade name ASE for accelerated solvent extraction) (Sporring and Bjorklund, 2004; Sporring et al., 2005) and microwave assisted extraction (MAE) (Ericsson and Colmsjo, 2000). Each technique has its own merits and the choice of extraction depends on several factors including capital cost, operating cost, simplicity of operation, amount of organic solvent required, sample throughput and availability of appropriate equipment and a standardized method. For soil and sediment extraction, we display a simple technique with stepwise extraction and cleanup viz. ultrasonication, and a more sophisticated approach with simultaneous extraction and cleanup using pressurized liquid extraction (PLE). For oil in water, we describe the simple liquid/liquid extraction.
2.1 Internal Standards used in sample preparation
The employed analytical platform and the purpose of the analysis defines the type of standard (internal and external) that should be used. This protocol distinguishes between GC-FID analysis for TPH quantification, GC-MS analysis for PAC and biomarker quantification and GC-MS analysis for weathering specific semi-quantitative diagnostic ratio calculations.
2.1.1 Internal standards for biomarker quantification (GC-MS)
Since weathering of oil only rarely affect the content of C30-α,β-hopane, this compound is often used as an internal preserved reference compound for the assessment of specific oil compound removal within the oil. If exact quantifications of C30-α,β-hopane and other biomarkers is needed (ex. for total weathering degree calculation), we suggest to use the thermally unstable (and therefore rarely seen in oil) isomer C30-α,α-hopane as an internal standard, referring to the suggestion given by Nytoft and Bojesen-Koefoed (2001).
2.1.2 Internal standards for semi-quantitative diagnostic isomer ratio calculations
Since this method is based on changes in selected C0-C4-alkylated PACs relative to internal preserved reference compounds (such as C30-α,β-hopane or highly alkylated PACs) and the original undegraded oil, internal standards as such are not needed in the sample preparation. However, if a need for quantification of PACs exists, we provide a list of recommended standards and concentrations below. It is recommended to always use internal and recovery standards, if a need for quantification should arise, or if a need for evaluation of extraction efficiency, evaporative losses during sample prep or discrimination within the analytical instrument.
2.1.3 Internal standards for GC-MS analysis for PAC quantification
Internal standards: Naphthalene-d8, acenaphthene-d10, fluorene-d10, dibenzothiophene-d8, phenanthrene-d10, pyrene-d10, chrysene-d12, benzo(k)fluoranthene-d12 and benzo(g,h,i)perylene-

Grant Agreement no. 312939 Deliverable D2.6 New isomer-based methods for monitoring of bioremediation
3
d12 (8µg/mL in isooctane giving 0.32µg/mL in final sample). Label the solution (RED 3). See Table 1 for an overview of all standards.
Recovery standards: acenaphthylene-d8, anthracene-d10, fluoranthene-d10, benz(a)anthracene-d12, benzo(a)pyrene-d12 and indeno(1,2,3-c,d)pyrene-d12 (8µg/mL in isooctane giving 0.32µg/mL in final sample). Label the solution (RED 4). See Table 1 for an overview of all standards.
The solutions are prepared in pre-cleaned 5 mL volumetric flasks, transferred to 8 mL amber glass vials, and stored in the freezer at -20 °C until use.
Table 1. List of the most appropriate internal and recovery standards for the quantification of 19 selected PAHs.
Internal standard PAHs Recovery standard Naphthalene-d8 Naphthalene, Acenaphthylene Acenaphthylene-d8 Acenaphthene-d10 Acenaphthene Anthracene-d10 Fluorene-d10 Fluorene Anthracene-d10 Dibenzothiophene-d8 Dibenzothiophene Anthracene-d10 Phenanthrene-d10 Anthracene, phenanthrene Anthracene-d10 Pyrene-d10 Pyrene, fluoranthene Fluoranthene-d10 Chrysene-d12 Chrysene, benzo(a)anthracene Benzo(a)anthracene-d12 Benzo(k)fluoranthene-d12
Benzo(b)fluoranthene, benzo(k)fluoranthene, benzo(e)pyrene, benzo(a)pyrene, perylene
Benzo(a)pyrene-d12
Benzo(g,h,i)perylene-d12 Dibenzo(a,h)anthracene, Benzo(g,h,i)perylene, indeno(1,2,3-c,d)pyrene
Indeno(1,2,3-c,d)pyrene-d12
2.2 Extraction from sediment
2.2.1 Sampling
The importance of obtaining a representative sample for analysis cannot be overemphasized. Without it, results may be meaningless or even grossly misleading. Sampling is particular crucial where a heterogeneous material is to be analyzed. It is vital that the aims of the analysis are understood and an appropriate sampling procedure adopted. In some situations, a sampling plan or strategy may need to be devised to optimize the value of the analytical samples such as sediment samples. It is strongly recommended to examine relevant literature for standardized protocols for the specific compartment and analytes. For shipment of samples, at least three times the amount needed for an analysis should be sampled, i.e. dry weight and PAC extraction= 3x(3x5 g+5 g)=60 g.
2.2.1.1 Determination of dry weight and organic matter content:
1. Representative sampled sediment samples are homogenized thoroughly and large fragments are removed.
2. 3 × 5 gram of material is weighed into ceramic crucibles (the exact weight is noted) and placed in an oven at 105 °C overnight. The cooled samples are weighed and the exact weight noted.

Grant Agreement no. 312939 Deliverable D2.6 New isomer-based methods for monitoring of bioremediation
4
3. Samples are put in muffle oven at 550 °C for at least 6 hours, and the cooled samples are weighed.
2.2.2 Extraction model 1: Stepwise ultrasonication extraction and silica gel cleanup
Ultrasonication procedures have been compared with the Soxhlet method for extraction of PACs in samples, with short time ultrasonic extractions producing equivalent or better recoveries than 6-8 hours of Soxhlet extraction (Lundstedt et al., 2000). Since the equipment for ultrasonication is simple, easy to operate and relatively fast, ultrasonication is often a preferred extraction method. To separate the analytes from the sample matrix that could interfere with the analysis, a column cleanup procedure (with silica and sodium sulfate) is applied.
2.2.2.1 Sample extraction and cleanup
Extractions are performed with 2 blank extractions (procedure blanks), 1 extraction of an appropriate reference sample (e.g. NIST SRM 1941b - Organics in sediment) used for proficiency testing and sample extractions where 1 of these are extracted in duplicate.
1. Accurately weighed known amounts (≈5 gram to reach a final concentration of about 2000 µg oil/mL solvent) of wet sediment/soil is ground thoroughly with 5 gram of hydromatrix.
2. Each sample is subsequently transferred quantitatively to a 100 mL Erlenmeyer flask and internal standard solution is added on to the top of the sample. The sample is left to stand for sorption of the added standards, capped for at least 20 min.
3. 30 mL solvent (n-hexane and acetone, 1:1, v/v) is added to the Erlenmeyer flask and the suspension is ultrasonicated at room temperature for 10 min, after which the solution from the settled mixture is decanted. The remaining suspension is washed with approximately 2 mL solvent and withdrawn using a Pasteur pipette.
4. The extraction process is subsequently repeated twice (a total of three extractions per sample) and the extracts obtained from the ultrasonication are filtered (in-between each extraction) to remove sediment particles by use of a glass funnel with filter paper directly into a 250 mL round bottom flasks.
5. 1 mL of isooctane is added to the combined extract as keeper and the combined extracts are evaporated slowly (maximum 5 mL/min) to approximately 1 mL on a rotary evaporator
2.2.2.2 Chromatographic column cleanup of extracts for GC analysis
1. A small glass column (1.4 id × 7 cm) is prepared per extract (Figure 2). Each column is dry packed from its base with a glass filter, 1 gram of activated silica (180°C for 20 hours) and 0.2 cm of anhydrous sodium sulfate. The column is covered with alumina foil until use.
2. The column is conditioned with 5 mL of n-hexane. 3. Before the column runs dry, the extract is transferred quantitatively to the top of the column
using a Pasteur pipette. Then ½ mL of n-hexane is transferred to the Erlenmeyer flask using a clean pipette and the first pipette is used to wash the flask and transfer the wash to the top of the column. The wash procedure is repeated three times to obtain a quantitative transfer of the extract.
4. The column is washed with 4 mL of n-hexane, which is discarded. 5. The column is subsequently eluted with 4 mL of a 1:1 mixture of n-hexane:dichloromethane
into a 5 mL volumetric flask. 6. If needed, recovery standard solution is added. 7. The volume of the flask is adjusted to 5 mL with n-hexane:dichloromethane (1:1), and stored
in amber glass vials at -20 °C until analysis.

Grant Agreement no. 312939 Deliverable D2.6 New isomer-based methods for monitoring of bioremediation
5
Figure 2. Illustration of the preparation of a small chromatographic column, packed from its base with a glass filter, activated silica and anhydrous sodium sulfate. Also a brief description of the sample cleanup procedure is shown.
2.2.3 Extraction model 2: Simultaneous extraction and cleanup using pressurized liquid extraction (PLE)
Pressurized liquid extraction (PLE) is a fast and efficient alternative to traditional extraction methods for many types of contaminants. The technique, which is based on extraction at elevated pressure and temperature, can be used with the same solvents as those used for Soxhlet extraction. The method used in this protocol is based on the development by Lundstedt, Haglund et al. (2006), and Boll, Christensen et al. (2008).
2.2.3.1 Preparations of extraction components
1) PLE extraction cells (Figure 3)
Figure 3. PLE extraction cell components.
a) Separate the extraction cell completely and remove old sample material form the cylinder (A)
Silica
Condition with 5 mL n-hexane
Transfer the extract quantitatively
Elute with 4 mL n-hexane (discard)
Elute with 4 mL 1:1 n-hexane : dichloromethane to 5 mL volumetric flask
Sodium sulfate
Glass filter
A
B C D E

Grant Agreement no. 312939 Deliverable D2.6 New isomer-based methods for monitoring of bioremediation
6
b) Clean the cylinder inside with a tissue c) Wash all parts (A, B, C, D and E) in detergent d) Rinse all parts (A, B, C, D and E) in tap water e) Rinse all parts (A, B, C, D and E) in deionized water f) Sonicate small parts (D and E) for 5 minutes in methanol, the larger parts (A, B and C) are
rinsed with methanol g) Sonicate small parts (D and E) for 5 minutes in pentane:acetone (1:1), the larger parts (A, B
and C) are rinsed with pentane:acetone (1:1) h) Let all parts dry on alumina foil
2) Cellulose filters a) Sonicate cellulose filters two times 5 minutes with dichloromethane, and leave to dry on
alumina foil 3) Hydromatrix:
a) Hydromatrix (e.g. Agilent Technologies) is placed in a thin layer (max 1 cm) on alumina foil and burned in a muffle oven at 400°C overnight. Cooled hydromatrix is stored in red cap bottles in a dry environment (e.g. desiccator).
b) Sodium sulfate (pro analysis, Merck) is dried in an oven at 85°C overnight. Dry sodium sulfate is stored in red cap bottles in a dry environment (e.g. desiccator).
4) Silica gel: a) Silica gel 60 (0.063-0.200 mm, Merck) is activated at 180°C overnight. Activated silica gel is
stored in red cap bottles in a dry environment (e.g. desiccator). 5) Copper powder (used for removal of elemental sulfur in sediments)
a) Fine copper powder (Fluka, 99% pro analysis) is activated with concentrated hydrochloric acid immediately before use and rinsed with milliQ water followed by acetone and pentane to remove the hydrochloric acid. Residual hydrochloric acid will lead to degradation of PAHs.
6) Ottawa sand: a) Ottawa sand is placed on alumina foil, and burned in a muffle oven at 550°C overnight. The
layer of Ottawa sand on alumina foil should be no more than 2 cm in thickness. The Ottawa sand is cooled with alumina cover and when cold, stored in red cap bottles in a dry environment (e.g. desiccator).
2.2.3.2 Sediment and soil extraction procedures with PLE
Extractions are performed batch-wise: A batch of samples consists of 15 extractions: 2 blank extractions (procedure blanks), 1 extraction of an appropriate reference sample (e.g. NIST SRM 1941b - Organics in sediment) used for proficiency testing, 11 sample extractions where 1 of these are extracted in duplicate.
1) Integrated extraction and cleanup is performed by pressurized liquid extraction (PLE) in this case with a Dionex ASE 200 accelerated solvent extractor. a) Packing of PLE cells (see Figure 4)
i) A 33 mL stainless steel extraction cell is packed from the bottom with two cellulose filters, 4 gram of activated silica gel and 4 gram of wet activated (acid treated) copper (Note: activated copper is added in order to remove elemental sulfur – and is only necessary for anoxic sediment samples. Thus, activated copper is not added in the analysis of soil samples).
ii) Accurately weighed known amounts (≈5 gram) of wet sediment/soil is ground thoroughly with 5 gram of hydromatrix. The homogenized and dried sample is transferred quantitatively to the extraction cell.
iii) Internal standard is added directly on top of the sample.

Grant Agreement no. 312939 Deliverable D2.6 New isomer-based methods for monitoring of bioremediation
7
iv) The remaining cell volume is filled with an inert matrix (burned Ottawa sand) and the extraction cells are closed and inserted in the PLE-autosampler.
v) The PLE-program elaborated in Figure 4 is used for the extractions. vi) Each PLE cell is extracted two times (into two separate glass vials) vii) The two extracts for each sample are concentrated to 15 mL under a gentle stream of
nitrogen and heat (40°C) and the second extract is transferred quantitatively to the first extract. This extract (added 2 mL isooctane as keeper) is then concentrated to 2 mL under a gentle stream of nitrogen and transferred quantitatively to a 5 mL volumetric flask.
viii) QS with n-pentane:dichloromethane (90:10, v/v) and store in amber glass vials at -20°C until analysis.
Figure 4. Scheme of the PLE extraction cell packing and extraction parameters.
2.2.4 Extraction and cleanup of oil from water and oil/water emulsions
2.2.4.1 USEPA method 3510C/8270D
Referring to USEPA method 3510C/8270D, organic compounds can be extracted in a simple manner by three successive liquid/liquid extractions in dichloromethane. For TPH analysis measures should be taken to reach oil concentrations of 2-2000 mg/L in the final dichloromethane extract. Adding 10 mL dichloromethane to 1 liter of water is appropriate. Internal standard is added to the water, before adding dichloromethane.
The extracts obtained from the liquid/liquid extraction are filtered to remove particles by use of a glass funnel with filter paper directly into a 250 mL round bottom flasks. 1 mL of isooctane is added to the combined extract as keeper and the combined extracts are evaporated slowly (maximum 5 mL/min) to approximately 1 mL on a rotary evaporator.
Pressure 1500 psi. Preheat time 2 min Static time 5 min Flush volume 70% Purge time 60 sec
-1-
4g activated Silica and if needed 4g wet acidic Cu
-2-
5g sediment or soil 5g hydromatrix Ground and mixed
-3-
Internal standard is added on top of sample
-4-
Cell volume filled with inert matrix (Ottawa sand)
Analysis
From PLE after 2 full extractions 2×40 mL evaporated to <2mL Transfer to 5 mL volumetric flask Add recovery standard, QS with solvent
Grant Agreement no. 312939 Deliverable D2.6 New isomer-based methods for monitoring of bioremediation
8
Chromatographic column cleanup of water extracts for GC analysis
1. A small glass column (1.4 id × 7 cm) is prepared per extract (Figure 2). Each column is dry packed from its base with a glass filter, 1 gram of activated silica (180°C for 20 hours) and 0.2 cm of anhydrous sodium sulfate. The column is covered with alumina foil until use.
2. The column is conditioned with 5 mL of n-hexane. 3. Before the column runs dry, the extract is transferred quantitatively to the top of the column
using a Pasteur pipette. Then ½ mL of n-hexane is transferred to the flask using a clean pipette and the first pipette is used to wash the flask and transfer the wash to the top of the column. The wash procedure is repeated three times to obtain a quantitative transfer of the extract.
4. The column is washed with 4 mL of n-hexane, which is discarded. 5. The column is subsequently eluted with 4 mL of a 1:1 mixture of n-hexane:dichloromethane
into a 5 mL volumetric flask. 6. Recovery standard is added. 7. The volume of the flask is adjusted to 5 mL with n-hexane:dichloromethane (1:1), and stored
in amber glass vials at -20 °C until analysis.
2.2.4.2 Alternative water extractions
Pentane as organic phase and increasing ionic strength of water-phase
Oil in water is extracted as per the USEPA method 3510C/8270D, however, salt is added to the water. This increases the ionic strength of the water and thereby more strongly force analytes into the organic phase. Adding pentane instead of dichloromethane gives an organic phase in the top instead of in the bottom of the two-layer system. The procedure is otherwise the same as the above described.
Extraction with solid phase extraction
Oil in water can be extracted using solid phase extraction. We have successfully used Waters HLB columns 6cc, 500 mg sorbent for extracting PAHs from samples up to 500 mL. The SPE cartridges are preconditioned by washing 3 times with 3 mL methanol and flushing 3 times with 5mL deionized water. Water (added internal standard in methanol) is extracted with a flow of approximately 10 mL per minute. After extraction, PAHs are eluted 3 times with 3mL of methanol. The combined eluate is then concentrated to < 5 mL under a gentle stream of nitrogen. The extract is added recovery standard (in methanol) and adjusted to 5 mL.
Grant Agreement no. 312939 Deliverable D2.6 New isomer-based methods for monitoring of bioremediation
9
3 GC-MS method for PAC and biomarker analysis
3.1 Introduction
GC-MS analysis is performed to assess the relative quantity of PACs and biomarkers in oil, water and sediment samples. The method is sensitive and can be used for full quantification of single PACs in the concentration range from 2-2,500 µg/kg (by addition of appropriate internal and recovery standards, see 0) as well as for diagnostic purposes using semi-quantitative approaches.
3.2 Sample preparation
Samples should be prepared according to sample preparation protocol, and preferably be in n-pentane:dichloromethane (90:10, v/v), alternatively in another water-free low boiling point solvent (e.g dichloromethane, pentane or hexane).
3.3 Standards
3.3.1 GC-MS analysis for PAC quantification and diagnostic ratio calculations
1) Quantification of 19 parent PAHs including the 16 US-EPA PAHs a) Exhaustive list of PAHs with authentic standards: Naphthalene, acenaphthene,
acenaphthylene, dibenzothiophene, anthracene, phenanthrene, fluorene, fluoranthene, pyrene, chrysene, benzo(a)anthracene, benzo(a)pyrene, perylene, benzo(g,h,i)perylene, benzo(k)fluoranthene, dibenzo(a,h)anthracene, benzo(e)pyrene, benzo(b)fluoranthene and indeno(1,2,3-c,d)pyrene.
b) Single PAH concentration range: 2.5 – 2000 µg/kg sample 2) 11 point standard curves are made (see excel sheet): 3-6-12-25-50-100-300-500-1000-1500-2000
ng/mL; Internal standards (5 – 200 ng/mL); and Recovery standards (150 ng/mL). Naphthalene-d8, acenaphthene-d10, fluorene-d10, dibenzothiophene-d8, phenanthrene-d10, pyrene-d10, chrysene-d12, benzo(k)fluoranthene-d12 and benzo(g,h,i)perylene-d12 are used as internal standards, while acenaphthylene-d8, anthracene-d10, fluoranthene-d10, benz(a)anthracene-d12, benzo(a)pyrene-d12 and indeno(1,2,3-c,d)pyrene-d12 are used as recovery standards.
3.3.1.1 Preparation of standards
1) Prepare Quantification stock solution (here labelled RED1): consisting of 19 PAHs. The stock solution contain approximately 4 µg/mL of each individual PAH (see excel preparation sheet)
2) Prepare a 10 time dilution of the Quantification stock solution - Label RED2: The solution contain approximately 0.4 µg/mL of each individual PAH (see excel preparation sheet)
3) Prepare internal stock solution: Naphthalene-d8, acenaphthene-d10, fluorene-d10, dibenzothiophene-d8, phenanthrene-d10, pyrene-d10, chrysene-d12, benzo(k)fluoranthene-d12 and benzo(g,h,i)perylene-d12: Label RED3: 8 µg/mL (see excel preparation sheet)
4) Prepare recovery stock solution: acenaphthylene-d8, anthracene-d10, fluoranthene-d10, benz(a)anthracene-d12, benzo(a)pyrene-d12 and indeno(1,2,3-c,d)pyrene-d12: Label RED4: Approx. 8 µg/mL (see excel preparation sheet)
5) Prepare the 11 standard solutions from the four Red solutions: RED1, RED2, RED3 and RED4 using the “Preparation of Quant std” excel sheet (see excel preparation sheet). The solutions are prepared in pre-cleaned 5 mL volumetric flasks, transferred to 8 mL amber glass vials, and stored in the freezer at -20 °C until use. See Table 2 for an overview of all standards.

Grant Agreement no. 312939 Deliverable D2.6 New isomer-based methods for monitoring of bioremediation
10
Table 2. List of the most appropriate internal and recovery standards for the 19 PAHs
Internal standard PAHs Recovery standard Naphthalene-d8 Naphthalene, Acenaphthylene Acenaphthylene-d8 Acenaphthene-d10 Acenaphthene Anthracene-d10 Fluorene-d10 Fluorene Anthracene-d10 Dibenzothiophene-d8 Dibenzothiophene Anthracene-d10 Phenanthrene-d10 Anthracene, phenanthrene Anthracene-d10 Pyrene-d10 Pyrene, fluoranthene Fluoranthene-d10 Chrysene-d12 Chrysene, benzo(a)anthracene Benzo(a)anthracene-d12 Benzo(k)fluoranthene-d12
Benzo(b)fluoranthene, benzo(k)fluoranthene, benzo(e)pyrene, benzo(a)pyrene, perylene
Benzo(a)pyrene-d12
Benzo(g,h,i)perylene-d12 Dibenzo(a,h)anthracene, Benzo(g,h,i)perylene, indeno(1,2,3-c,d)pyrene
Indeno(1,2,3-c,d)pyrene-d12
3.3.2 Biomarker quantification (GC-MS)
C30-α,β-hopane is quantified in oil samples where C30-α,α-hopane is used as an internal standard.
3.3.2.1 Preparation of standards
Five-point calibration curve in desired concentration levels is constructed with varying concentrations of C30-α,β-hopane and constant concentrations of the internal standard C30-α,α-hopane.
3.4 Instrument settings and equipment
Tuning and performance of the GC-MS system is monitored through daily analyses of a standard tuning sample (following instructions in EPA method 8270D). The tuning sample comprise 50 ng of each of DFTPP, DDT, benzidine and pentachlorophenol in DCM. Tuning and performance samples can be purchased at e.g. http://www.accustandard.com (M-TS-625 or M-TS-625-20X).
3.4.1.1 Tuning
The mass spectrometer should be able to produce the mass spectrum for the compound DFTPP that meets the criteria of Table 3 where 1 µl of the standard GC-MS tuning sample is injected.
Table 3. DFTPP key ions and ion abundance criteria. (USEPA 1998) See USEPA method 8270D, t3 for DFTPP acceptance criteria.
Mass Ion abundance criteria 51 10-80% of base peak 68 <2% of mass 69 70 <2% of mass 69 127 10-80% of base peak 197 <1% of mass 198 198 base peak, or >50% of mass 442 199 5-9% of mass 198

Grant Agreement no. 312939 Deliverable D2.6 New isomer-based methods for monitoring of bioremediation
11
Mass Ion abundance criteria 275 10-60% of base peak 365 >1% of mass 198 441 Present but <24% of mass 443 442 base peak, or >50% of mass 198 443 15-24% of mass 442
3.4.1.2 Performance
Inlet liner and column performance is monitored with DDT, benzidine and pentachlorophenol. Benzidine and pentachlorophenol should be present at their normal responses (based on the experience of the laboratory) and should not show peak tailing (peak deterioration will reveal the presence of active sites in the liner). The degradation of DDT to DDE and DDD should not be greater than 20%. Figure 5 illustrates a chromatogram injected to a GC-MS operating in ideal conditions (a) and a chromatogram of a sample run with GC-MS in bad conditions (b). Table 4 shows the key ions of compounds that are used for monitoring the chromatographic conditions.
a) b)
Figure 5. Chromatograms of injections of a mix of DFTPP, Pentaclorophenol, Benzidine and DDT from a
GC-MS operating in ideal conditions (a) and a GC-MS in bad conditions (b).
Table 4. Ions of the key compounds responsible for the control of chromatographic conditions.
Compounds Primary ion Secondary ions
Benzidine 184 92, 185 Pentaclorophenol 266 264, 268 4,4’-DDT 235 237, 165 4,4’-DDE 246 148, 176 4,4’-DDD 235 237, 165
10.00 15.00 20.00 25.00 30.00 35.00 40.00
500000
1000000
1500000
2000000
2500000
3000000
3500000
4000000
4500000
5000000
5500000
6000000
6500000
7000000
7500000
Time-->
Abundance
TIC: DFTPPStand.D\data.ms
10.00 15.00 20.00 25.00 30.00 35.00 40.00
500000
1000000
1500000
2000000
2500000
3000000
3500000
4000000
4500000
5000000
5500000
6000000
6500000
7000000
7500000
8000000
8500000
9000000
9500000
1e+07
1.05e+07
1.1e+07
1.15e+07
1.2e+07
Time-->
Abundance
TIC: DFTPPBad.D\data.ms
Pent
achl
orop
heno
l DF
TPP
Benz
idin
e
DDT
DDT
DFTP
P
Benz
idin
e

Grant Agreement no. 312939 Deliverable D2.6 New isomer-based methods for monitoring of bioremediation
12
After injection of many samples, the peaks of Benzidine and Pentachlorophenol may show tailing or disappear completely. The Benzidine is a reactive compound and its peak will tail if the liner is not inert. The DTT will decompose in the injector, if this contains any reactive sites (e.g. silanol interactions).
If these symptoms occur, replace the injector liner and cut about 15-30 cm of the start of the column. At the same time, the injector septum can be changed. While the injector is reheated to the original temperature, set the temperature to 10°C below maximum temperature of the column and hold it for 5 minutes in order to remove residual contaminants.
3.4.1.3 Reference materials and standards
Quantification of analytes should meet recommendations associated with standard reference materials such as NIST SRM 1582 (Crude oil) and NIST SRM 1941 (Organics in sediment).
3.4.1.4 Inlet
1µL injected in pulsed splitless mode, injector temperature: 315°C
3.4.1.5 Column
60 m ZB-5 (0.25 mm ID, 0.25 µm film thickness) capillary column. Helium should be used as carrier gas at 1.1 mL/s. Initial temperature: 40°C hold for 2 min, 25°C/min to 100°C, and 5°C/min to 315 (hold for 13.4 min), total analysis time 60.8 min. Transfer line should be 315°C.
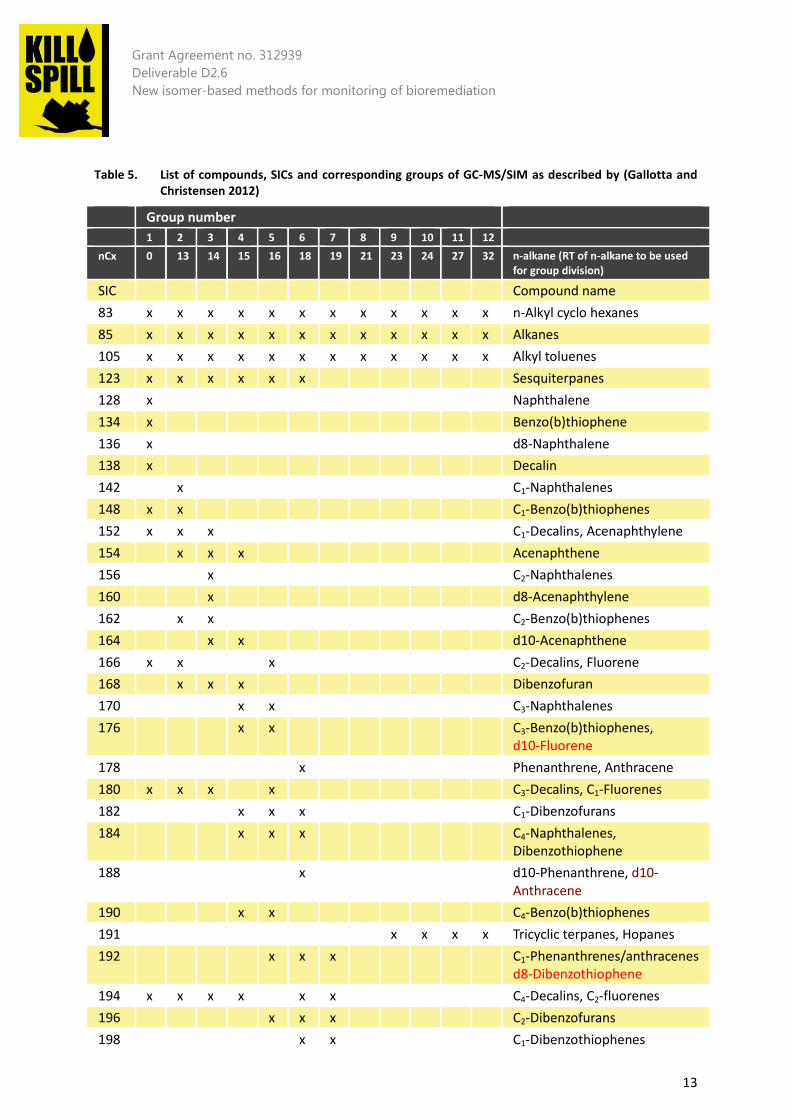
3.4.1.6 MS
Ion source and quadropole temperatures should be 230°C and 150°C respectively. The ion source should be operating in electron ionization mode. For PAC and diagnostic ratio analysis, twelve groups of ions with 13 ions in each should be monitored in SIM mode, with a dwell time of 25 ms, giving 2.81 scans/s. Number of ions should be consistent between groups, to avoid differences in scanning frequency, see Table 5 for ion and group details.
Grant Agreement no. 312939 Deliverable D2.6 New isomer-based methods for monitoring of bioremediation
13
Table 5. List of compounds, SICs and corresponding groups of GC-MS/SIM as described by (Gallotta and Christensen 2012)
Group number 1 2 3 4 5 6 7 8 9 10 11 12 nCx 0 13 14 15 16 18 19 21 23 24 27 32 n-alkane (RT of n-alkane to be used
for group division)
SIC Compound name 83 x x x x x x x x x x x x n-Alkyl cyclo hexanes 85 x x x x x x x x x x x x Alkanes 105 x x x x x x x x x x x x Alkyl toluenes 123 x x x x x x Sesquiterpanes 128 x Naphthalene 134 x Benzo(b)thiophene 136 x d8-Naphthalene 138 x Decalin 142 x C1-Naphthalenes 148 x x C1-Benzo(b)thiophenes 152 x x x C1-Decalins, Acenaphthylene 154 x x x Acenaphthene 156 x C2-Naphthalenes 160 x d8-Acenaphthylene 162 x x C2-Benzo(b)thiophenes 164 x x d10-Acenaphthene 166 x x x C2-Decalins, Fluorene 168 x x x Dibenzofuran 170 x x C3-Naphthalenes 176 x x C3-Benzo(b)thiophenes,
d10-Fluorene 178 x Phenanthrene, Anthracene 180 x x x x C3-Decalins, C1-Fluorenes 182 x x x C1-Dibenzofurans 184 x x x C4-Naphthalenes,
Dibenzothiophene 188 x d10-Phenanthrene, d10-
Anthracene 190 x x C4-Benzo(b)thiophenes 191 x x x x Tricyclic terpanes, Hopanes 192 x x x C1-Phenanthrenes/anthracenes
d8-Dibenzothiophene 194 x x x x x x C4-Decalins, C2-fluorenes 196 x x x C2-Dibenzofurans 198 x x C1-Dibenzothiophenes

Grant Agreement no. 312939 Deliverable D2.6 New isomer-based methods for monitoring of bioremediation
14
Group number 1 2 3 4 5 6 7 8 9 10 11 12 nCx 0 13 14 15 16 18 19 21 23 24 27 32 n-alkane (RT of n-alkane to be used
for group division)
202 x x x Fluoranthene, Pyrene 206 x x x C2-Phenanthrenes/anthracenes 208 x x C3-Fluorenes 212 x x C2-Dibenzothiophenes,
d10-Fluoranthene, d10-Pyrene 216 x x C1-Fluoranthenes/pyrenes 217 x x x x x Steranes 218 x x x Steranes 220 x x x C3-Phenanthrenes/anthracenes 226 x x x C3-Dibenzothiophenes 228 x Benzo(a)anthracene, Chrysene 230 x x C2-Fluoranthenes/pyrenes 231 x x x Triaromatic steranes
234 x x x C4-Phenanthrenes/anthracenes Retene, Benzonaphtothiophene
240 x x x C4-Dibenzothiophenes, d12-Benzo(a)anthracene, d12-Chrysene
242 x x C1-Chrysenes
244 x d14-p-Terphenyl
248 x x C1-Benzonaphtothiophenes 252 x x 5 Rings PAHs 256 x C2-Chrysenes 264 x x d12-Benzo(k)fluoranthene,
d12-Benzo(a)pyrene, d12-Perylene
270 x x C3-Chrysenes 276 x 6 Rings PAHs 278 x 6 Rings PAHs 288 x d12-Indeno(1,2,3-cd)pyrene,
d12-Benzo(g,h,i)perylene Total 13 13 13 13 13 13 13 13 13 13 13 13

Grant Agreement no. 312939 Deliverable D2.6 New isomer-based methods for monitoring of bioremediation
15
3.4.1.7
3.4.1.8 GC-MS sequence
This section describes the samples that are included in the GC-MS analysis of one extraction batch. The samples include those from the PLE extraction as well as quantification standards and quality control samples to control instrumental, procedural and other variations.
2) The sequence for analysis of each extraction batch (See extraction protocol) can include a) Instrument quality control sample (DFTPP mix). Analyzed as first and last sample in the
sequence. b) Two procedure blank samples (Quality control, limit of detection (LOD) and limit of
quantification (LOQ)) c) Reference samples d) Sample extracts e) Duplicate of one of the sample extracts f) Quantification standards (1-11). Standard6 (0.1 µg/mL) is analyzed in-between every five
extracts from the sample extraction batch g) Total petroleum hydrocarbon mixture (TPH) (500 ng/mL for each individual compound) is
analyzed in-between every five extracts from the sample extraction batch. The mixture is used for quality control during the analysis in order to detect discrimination in the inlet liner (the relative ratios between alkanes should remain constant in the RT window relevant for the analytes of interest)
h) Solvents. These samples are analyzed in-between every five extracts from the sample extraction batch and used for quality control (system contamination)
i) An example of a sequence: 1: DFTPP, 2: DCM, 3: Standard6, 4: TPH, 5: Extract2, 6:Blank1, 7: Extract8, 8:Extract3, 9: Standard1, 10: DCM, 11: Standard6, 12: TPH, 13: Standard6, 14: ReferenceMaterial, 15: Extract2, 16: Standard8, 17: Standard11, 18: DCM, 19: Standard6, 20: TPH, etc., etc., etc., final: DFTPP.
3.5 GC-MS data analysis
3.5.1 Peak area quantification
1. The relevant peaks are integrated in ChemStation, standard curves and quantifications are made in Microsoft Excel, see Excel-Template.
2. The concentrations of PAHs in extracts are calculated batch-wise (one batch at a time) using the internal standard approach and the replicate analysis of one specific standard solution (standard6)
3. The internal standard method is used and the deuterated PAHs added directly to the sample are used as internal standards. A list of the most appropriate internal standards for quantification of the 19 PAHs are listed in table 1.
3.5.1.1 Total weathering degree data analysis
The total weathering degree is calculated as the ratio of biomarker concentration in the source oil relative to that of the weathered oil.
Equation 1. 𝑃𝑃(%) = �1 −𝐶𝐶𝐻𝐻𝐻𝐻𝐻𝐻𝐻𝐻𝐻𝐻𝐻𝐻 𝑖𝑖𝐻𝐻 𝑠𝑠𝐻𝐻𝑠𝑠𝑠𝑠𝑠𝑠𝐻𝐻 𝐻𝐻𝑖𝑖𝑜𝑜
𝐶𝐶𝐻𝐻𝐻𝐻𝐻𝐻𝐻𝐻𝐻𝐻𝐻𝐻 𝑖𝑖𝐻𝐻 𝑤𝑤𝐻𝐻𝐻𝐻𝑤𝑤ℎ𝐻𝐻𝑠𝑠𝐻𝐻𝑒𝑒 𝐻𝐻𝑖𝑖𝑜𝑜� ∙ 100%
Grant Agreement no. 312939 Deliverable D2.6 New isomer-based methods for monitoring of bioremediation
16
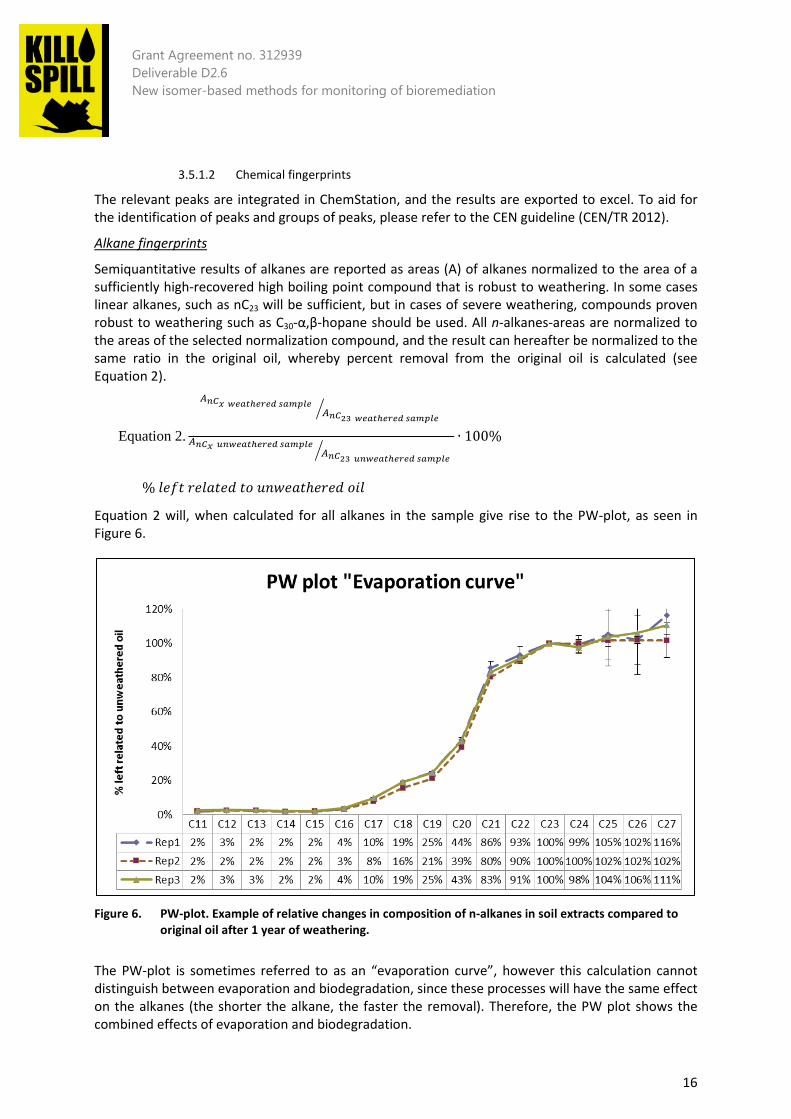
3.5.1.2 Chemical fingerprints
The relevant peaks are integrated in ChemStation, and the results are exported to excel. To aid for the identification of peaks and groups of peaks, please refer to the CEN guideline (CEN/TR 2012).
Alkane fingerprints
Semiquantitative results of alkanes are reported as areas (A) of alkanes normalized to the area of a sufficiently high-recovered high boiling point compound that is robust to weathering. In some cases linear alkanes, such as nC23 will be sufficient, but in cases of severe weathering, compounds proven robust to weathering such as C30-α,β-hopane should be used. All n-alkanes-areas are normalized to the areas of the selected normalization compound, and the result can hereafter be normalized to the same ratio in the original oil, whereby percent removal from the original oil is calculated (see Equation 2).
Equation 2.
𝐴𝐴𝐻𝐻𝑛𝑛𝑥𝑥(𝑤𝑤𝐻𝐻𝐻𝐻𝑤𝑤ℎ𝐻𝐻𝑠𝑠𝐻𝐻𝑒𝑒 𝑠𝑠𝐻𝐻𝑠𝑠𝐻𝐻𝑜𝑜𝐻𝐻) 𝐴𝐴𝐻𝐻𝑛𝑛23(𝑤𝑤𝐻𝐻𝐻𝐻𝑤𝑤ℎ𝐻𝐻𝑠𝑠𝐻𝐻𝑒𝑒 𝑠𝑠𝐻𝐻𝑠𝑠𝐻𝐻𝑜𝑜𝐻𝐻)�
𝐴𝐴𝐻𝐻𝑛𝑛𝑥𝑥(𝑠𝑠𝐻𝐻𝑤𝑤𝐻𝐻𝐻𝐻𝑤𝑤ℎ𝐻𝐻𝑠𝑠𝐻𝐻𝑒𝑒 𝑠𝑠𝐻𝐻𝑠𝑠𝐻𝐻𝑜𝑜𝐻𝐻)𝐴𝐴𝐻𝐻𝑛𝑛23(𝑠𝑠𝐻𝐻𝑤𝑤𝐻𝐻𝐻𝐻𝑤𝑤ℎ𝐻𝐻𝑠𝑠𝐻𝐻𝑒𝑒 𝑠𝑠𝐻𝐻𝑠𝑠𝐻𝐻𝑜𝑜𝐻𝐻)�
∙ 100% =
% 𝑙𝑙𝑙𝑙𝑙𝑙𝑙𝑙 𝑟𝑟𝑙𝑙𝑙𝑙𝑟𝑟𝑙𝑙𝑙𝑙𝑟𝑟 𝑙𝑙𝑡𝑡 𝑢𝑢𝑢𝑢𝑢𝑢𝑙𝑙𝑟𝑟𝑙𝑙ℎ𝑙𝑙𝑟𝑟𝑙𝑙𝑟𝑟 𝑡𝑡𝑜𝑜𝑙𝑙
Equation 2 will, when calculated for all alkanes in the sample give rise to the PW-plot, as seen in Figure 6.
Figure 6. PW-plot. Example of relative changes in composition of n-alkanes in soil extracts compared to
original oil after 1 year of weathering.
The PW-plot is sometimes referred to as an “evaporation curve”, however this calculation cannot distinguish between evaporation and biodegradation, since these processes will have the same effect on the alkanes (the shorter the alkane, the faster the removal). Therefore, the PW plot shows the combined effects of evaporation and biodegradation.

Grant Agreement no. 312939 Deliverable D2.6 New isomer-based methods for monitoring of bioremediation
17
PAC fingerprints
Corresponding to the PW-plot, PAC removal can be assessed by choosing appropriate normalization compounds. As an example, biodegradation efficiency of a crude oil can be assessed by normalizing content of individual PACs to the sum of C3- and C4-dibenzothiophenes (DBT, m/z 226 and 240). Due to the high molecular weight and high complexity of C3- and C4-DBTs have high boiling point and are relatively recalcitrant to biodegradation. They can therefore serve as internal markers for PAC removal as a combined function of biodegradation and short-term physical processes, such evaporation and dissolution. Likewise, other HMW PACs, such as C3- and C4-chrysenes can be used as internal standards. Example plots of PAC fingerprinting ratios are seen in Figure 7 (mono- di and tri-aromatic PAHs) and Figure 8 (di- and tricyclic sulfur containing PACs).
Equation 3.
𝐴𝐴𝑃𝑃𝑃𝑃𝑛𝑛(𝑤𝑤𝐻𝐻𝐻𝐻𝑤𝑤ℎ𝐻𝐻𝑠𝑠𝐻𝐻𝑒𝑒 𝑠𝑠𝐻𝐻𝑠𝑠𝐻𝐻𝑜𝑜𝐻𝐻)Σ(𝐴𝐴𝑛𝑛3𝐷𝐷𝐷𝐷𝐷𝐷+𝐴𝐴𝑛𝑛4𝐷𝐷𝐷𝐷𝐷𝐷)𝑤𝑤𝐻𝐻𝐻𝐻𝑤𝑤ℎ𝐻𝐻𝑠𝑠𝐻𝐻𝑒𝑒 𝑠𝑠𝐻𝐻𝑠𝑠𝐻𝐻𝑜𝑜𝐻𝐻�
𝐴𝐴𝑃𝑃𝑃𝑃𝑛𝑛(𝑠𝑠𝐻𝐻𝑤𝑤𝐻𝐻𝐻𝐻𝑤𝑤ℎ𝐻𝐻𝑠𝑠𝐻𝐻𝑒𝑒 𝑠𝑠𝐻𝐻𝑠𝑠𝐻𝐻𝑜𝑜𝐻𝐻)Σ(𝐴𝐴𝑛𝑛3𝐷𝐷𝐷𝐷𝐷𝐷+𝐴𝐴𝑛𝑛4𝐷𝐷𝐷𝐷𝐷𝐷)𝑠𝑠𝐻𝐻𝑤𝑤𝐻𝐻𝐻𝐻𝑤𝑤ℎ𝐻𝐻𝑠𝑠𝐻𝐻𝑒𝑒 𝑠𝑠𝐻𝐻𝑠𝑠𝐻𝐻𝑜𝑜𝐻𝐻�
∙ 100% =
% 𝑙𝑙𝑙𝑙𝑙𝑙𝑙𝑙 𝑟𝑟𝑙𝑙𝑙𝑙𝑟𝑟𝑙𝑙𝑙𝑙𝑟𝑟 𝑙𝑙𝑡𝑡 𝑢𝑢𝑢𝑢𝑢𝑢𝑙𝑙𝑟𝑟𝑙𝑙ℎ𝑙𝑙𝑟𝑟𝑙𝑙𝑟𝑟 𝑡𝑡𝑜𝑜𝑙𝑙
Figure 7. Example of relative changes in composition of mono-, di- and tri cyclic aromatic compounds in
soil extracts compared to original oil after 1 year of weathering.

Grant Agreement no. 312939 Deliverable D2.6 New isomer-based methods for monitoring of bioremediation
18
Figure 8. Example of relative changes in composition of sulfur containing di- and tricyclic aromatics in soil
extracts compared to original oil after 1 year of weathering.
Diagnostic ratios
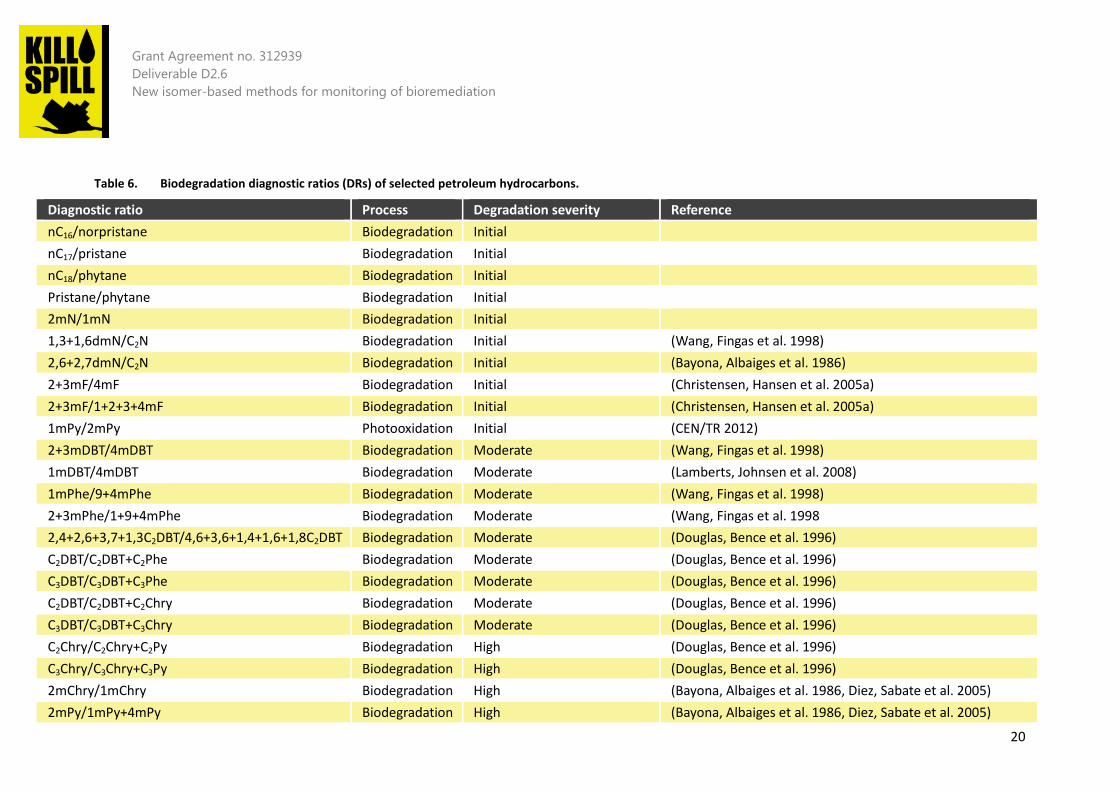
Certain weathering processes involve highly selective chemical reactions, and therefore large differences in degradation of closely related compounds can appear. This is apparent for photo oxidation and bacterial degradation of certain alkylated PAHs. Based on empirical evaluations and understanding of the reactions, several relationships have been constructed to distinguish between short-term physical weathering processes (evaporation and dissolution), photo oxidation and bacterial degradation. The relationships result in semiquantitative diagnostic ratios (DRs) that can indicate the progress of the individual weathering processes. Table 6 lists DRs for different processes, again with references to the CEN guideline for identification help (CEN/TR 2012), and Figure 9 shows a plot of selected DRs for the description of weathering of oil in a contaminated soil.

Grant Agreement no. 312939 Deliverable D2.6 New isomer-based methods for monitoring of bioremediation
19
Figure 9. Employment of diagnostic ratios to show the degree of weathering of an oil after one year.
Grant Agreement no. 312939 Deliverable D2.6 New isomer-based methods for monitoring of bioremediation
20
Table 6. Biodegradation diagnostic ratios (DRs) of selected petroleum hydrocarbons.
Diagnostic ratio Process Degradation severity Reference nC16/norpristane Biodegradation Initial nC17/pristane Biodegradation Initial nC18/phytane Biodegradation Initial Pristane/phytane Biodegradation Initial 2mN/1mN Biodegradation Initial 1,3+1,6dmN/C2N Biodegradation Initial (Wang, Fingas et al. 1998) 2,6+2,7dmN/C2N Biodegradation Initial (Bayona, Albaiges et al. 1986) 2+3mF/4mF Biodegradation Initial (Christensen, Hansen et al. 2005a) 2+3mF/1+2+3+4mF Biodegradation Initial (Christensen, Hansen et al. 2005a) 1mPy/2mPy Photooxidation Initial (CEN/TR 2012) 2+3mDBT/4mDBT Biodegradation Moderate (Wang, Fingas et al. 1998) 1mDBT/4mDBT Biodegradation Moderate (Lamberts, Johnsen et al. 2008) 1mPhe/9+4mPhe Biodegradation Moderate (Wang, Fingas et al. 1998) 2+3mPhe/1+9+4mPhe Biodegradation Moderate (Wang, Fingas et al. 1998 2,4+2,6+3,7+1,3C2DBT/4,6+3,6+1,4+1,6+1,8C2DBT Biodegradation Moderate (Douglas, Bence et al. 1996) C2DBT/C2DBT+C2Phe Biodegradation Moderate (Douglas, Bence et al. 1996) C3DBT/C3DBT+C3Phe Biodegradation Moderate (Douglas, Bence et al. 1996) C2DBT/C2DBT+C2Chry Biodegradation Moderate (Douglas, Bence et al. 1996) C3DBT/C3DBT+C3Chry Biodegradation Moderate (Douglas, Bence et al. 1996) C2Chry/C2Chry+C2Py Biodegradation High (Douglas, Bence et al. 1996) C3Chry/C3Chry+C3Py Biodegradation High (Douglas, Bence et al. 1996) 2mChry/1mChry Biodegradation High (Bayona, Albaiges et al. 1986, Diez, Sabate et al. 2005) 2mPy/1mPy+4mPy Biodegradation High (Bayona, Albaiges et al. 1986, Diez, Sabate et al. 2005)

Grant Agreement no. 312939 Deliverable D2.6 New isomer-based methods for monitoring of bioremediation
21
4 References
Bayona, J. M., J. Albaiges, A. M. Solanas, R. Pares, P. Garrigues and M. Ewald (1986). "Selective Aerobic Degradation of Methyl-Substituted Polycyclic Aromatic-Hydrocarbons in Petroleum by Pure Microbial Cultures." International Journal of Environmental Analytical Chemistry 23(4): 289-303.
Boll, E. S., J. H. Christensen and P. E. Holm (2008). "Quantification and source identification of polycyclic aromatic hydrocarbons in sediment, soil, and water spinach from Hanoi, Vietnam." Journal of Environmental Monitoring 10(2): 261-269.
CEN/TR (2012). CEN/TR 15522-2:2012 Oil spill identification - Waterborne petroleum and petroleum products - Part 2: Analytical methodology and interpretation of results based on GC-FID and GC-MS low resolution analyses, European Committee for Standardization.
Christensen, J. H., A. B. Hansen, U. Karlson, J. Mortensen and O. Andersen (2005a). "Multivariate statistical methods for evaluating biodegradation of mineral oil." Journal of Chromatography A 1090(1-2): 133-145.
Christensen, J. H., A. B. Hansen, J. Mortensen and O. Andersen (2005b). "Characterization and matching of oil samples using fluorescence spectroscopy and parallel factor analysis." Analytical Chemistry 77(7): 2210-2217.
Christensen, J. H., G. Tomasi, A. D. Scofield and M. D. G. Meniconi (2010). "A novel approach for characterization of polycyclic aromatic hydrocarbon (PAH) pollution patterns in sediments from Guanabara Bay, Rio de Janeiro, Brazil." Environmental Pollution 158(10): 3290-3297.
Diez, S., J. Sabate, M. Vinas, J. M. Bayona, A. M. Solanas and J. Albaiges (2005). "The Prestige oil spill. I. Biodegradation of a heavy fuel oil under simulated conditions." Environmental Toxicology and Chemistry 24(9): 2203-2217.
Douglas, G. S., A. E. Bence, R. C. Prince, S. J. McMillen and E. L. Butler (1996). "Environmental Stability of Selected Petroleum Hydrocarbon Source and Weathering Ratios." Environmental Science & Technology 30(7): 2332-2339.
Gallotta, F. D. and J. H. Christensen (2012). "Source identification of petroleum hydrocarbons in soil and sediments from Iguaçu River Watershed, Paraná, Brazil using the CHEMSIC method (CHEMometric analysis of Selected Ion Chromatograms)." Journal of Chromatography A 1235: 149-158.
Lamberts, R. F., A. R. Johnsen, O. Andersen and J. H. Christensen (2008). "Univariate and multivariate characterization of heavy fuel oil weathering and biodegradation in soil." Environmental Pollution 156(2): 297-305.
Lundstedt, S., P. Haglund and L. Oberg (2006). "Simultaneous extraction and fractionation of polycyclic aromatic hydrocarbons and their oxygenated derivatives in soil using selective pressurized liquid extraction." Analytical Chemistry 78(9): 2993-3000.
Malmquist, L. M. V., R. R. Olsen, A. B. Hansen, O. Andersen and J. H. Christensen (2007). "Assessment of oil weathering by as chromatography-mass spectrometry, time warping and principal component analysis." Journal of Chromatography A 1164(1-2): 262-270.
Nielsen, N.-P. V., J. M. Carstensen and J. Smedsgaard (1998). "Aligning of single and multiple wavelength chromatographic profiles for chemometric data analysis using correlation optimised warping." Journal of Chromatography A 805(1–2): 17-35.
Nytoft, H. P. and J. A. Bojesen-Koefoed (2001). "17α,21α(H)-hopanes: natural and synthetic." Organic Geochemistry 32(6): 841-856.
Soleimani, M., M. Farhoudi and J. H. Christensen (2013). "Chemometric assessment of enhanced bioremediation of oil contaminated soils." Journal of Hazardous Materials 254: 372-381.

Grant Agreement no. 312939 Deliverable D2.6 New isomer-based methods for monitoring of bioremediation
22
Tomasi, G., F. van den Berg and C. Andersson (2004). "Correlation optimized warping and dynamic time warping as preprocessing methods for chromatographic data." Journal of Chemometrics 18(5): 231-241.
USEPA (1998). METHOD 8270D: SEMIVOLATILE ORGANIC COMPOUNDS BY GAS CHROMATOGRAPHY/MASS SPECTROMETRY (GC/MS) SW-846 Ch 4.3.2 Update IVA, United States Environmental Protection Agency.
Wang, Z. D., M. Fingas, S. Blenkinsopp, G. Sergy, M. Landriault, L. Sigouin, J. Foght, K. Semple and D. W. S. Westlake (1998). "Comparison of oil composition changes due to biodegradation and physical weathering in different oils." Journal of Chromatography A 809(1-2): 89-107.