SOLIMAR ENERGY LIMITED MANAGEMENT DISCUSSION & …
23
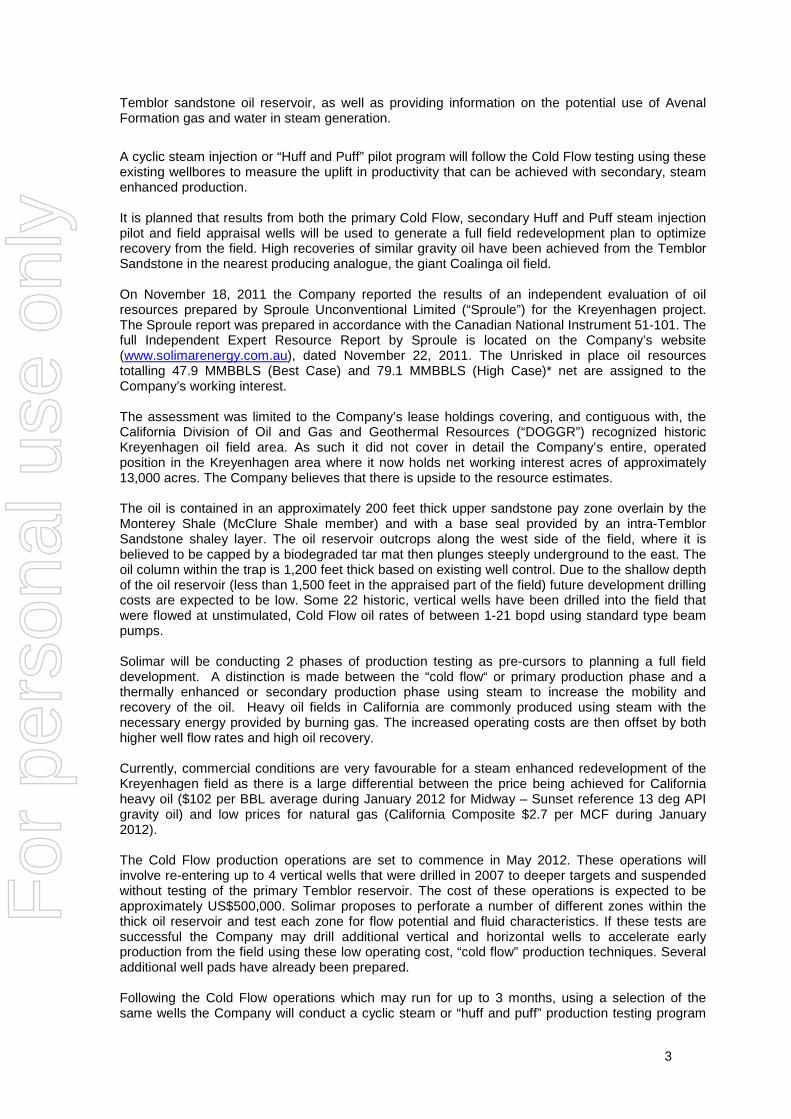
1 SOLIMAR ENERGY LIMITED MANAGEMENT DISCUSSION & ANALYSIS for the Three and Nine Months Ended March 31, 2012 INTRODUCTION This report is Management’s Discussion and Analysis (“MD&A”) of the operational and financial performance, and the future prospects of Solimar Energy Limited (ASX Code: SGY; and TSXV Code: SXS) (“Solimar” or the “Company”). The MD&A, which has been prepared as of March 31, 2012, should be read in conjunction with the Company’s unaudited consolidated financial statements as at and for the three months ended March 31, 2012 and for the nine months ended March 31, 2012, including notes to these statements. The unaudited consolidated financial statements have been prepared in accordance with Australian Accounting Standards and International Financial Reporting Standards (“IFRS”). All financial amounts are in Australian dollars ($A), unless otherwise stated. FORWARD-LOOKING STATEMENTS This MD&A contains forward-looking statements that involve known and unknown risks, uncertainties and assumptions. The forward-looking statements are not historical facts, but rather are based on the current plans, objectives, goals, strategies, estimates, assumptions and projections about the Company’s industry, business and future financial results. Actual results could differ materially from the results contemplated by these forward-looking statements due to a number of factors, including those discussed in the risk section of the MD&A. Certain statements contained in this MD&A constitute forward-looking statements. These statements relate to future events or Solimar’s future plans or performance. All statements other than statements of historical fact may be forward-looking statements. Forward-looking statements are often, but not always, identified by the use of words such as “seek”, “anticipate”, “plan”, “continue”, “estimate”, “expect”, “may”, “will”, “project”, “predict”, “potential”, “targeting”, “intend”, “could”, “might”, “should”, “believe” and similar expressions. These statements involve known and unknown risks, uncertainties and other factors that may cause actual results or events to differ materially from those anticipated in such forward-looking statements. The Company believes that the expectations reflected in those forward-looking statements are reasonable but no assurance can be given that these expectations will prove to be correct and such forward-looking statements included in, or incorporated by reference into, this MD&A should not be unduly relied upon by investors. These statements speak only as the date of this date of this MD&A. The forward-looking statements included in this MD&A and in certain documents referenced herein are expressly qualified by the cautionary statement. Solimar undertakes no obligation to publicly update or revise any forward-looking statements except as expressly required by applicable securities laws. HIGHLIGHTS (FOR THE THREE MONTHS ENDED MARCH 31, 2012) • Raised C$2.8m in February 2012 through the issue of a convertible debenture to sophisticated investors. A further C$1.1m was raised in April 2012 through the issue of shares and warrants to investors in North America. • Testing operations continued at Paloma focusing on the Antelope Shale zone with estimates of some 366 feet of gross pay. • Planning well underway at the Kreyenhagen Project to implement a multi-stage program of production testing, cyclic steam pilot and drilling of appraisal wells during the remainder of 2012. For personal use only
Transcript of SOLIMAR ENERGY LIMITED MANAGEMENT DISCUSSION & …
1
SOLIMAR ENERGY LIMITED
MANAGEMENT DISCUSSION & ANALYSIS
for the Three and Nine Months Ended March 31, 2012
INTRODUCTION This report is Management’s Discussion and Analysis (“MD&A”) of the operational and financial performance, and the future prospects of Solimar Energy Limited (ASX Code: SGY; and TSXV Code: SXS) (“Solimar” or the “Company”). The MD&A, which has been prepared as of March 31, 2012, should be read in conjunction with the Company’s unaudited consolidated financial statements as at and for the three months ended March 31, 2012 and for the nine months ended March 31, 2012, including notes to these statements. The unaudited consolidated financial statements have been prepared in accordance with Australian Accounting Standards and International Financial Reporting Standards (“IFRS”). All financial amounts are in Australian dollars ($A), unless otherwise stated. FORWARD-LOOKING STATEMENTS This MD&A contains forward-looking statements that involve known and unknown risks, uncertainties and assumptions. The forward-looking statements are not historical facts, but rather are based on the current plans, objectives, goals, strategies, estimates, assumptions and projections about the Company’s industry, business and future financial results. Actual results could differ materially from the results contemplated by these forward-looking statements due to a number of factors, including those discussed in the risk section of the MD&A. Certain statements contained in this MD&A constitute forward-looking statements. These statements relate to future events or Solimar’s future plans or performance. All statements other than statements of historical fact may be forward-looking statements. Forward-looking statements are often, but not always, identified by the use of words such as “seek”, “anticipate”, “plan”, “continue”, “estimate”, “expect”, “may”, “will”, “project”, “predict”, “potential”, “targeting”, “intend”, “could”, “might”, “should”, “believe” and similar expressions. These statements involve known and unknown risks, uncertainties and other factors that may cause actual results or events to differ materially from those anticipated in such forward-looking statements. The Company believes that the expectations reflected in those forward-looking statements are reasonable but no assurance can be given that these expectations will prove to be correct and such forward-looking statements included in, or incorporated by reference into, this MD&A should not be unduly relied upon by investors. These statements speak only as the date of this date of this MD&A. The forward-looking statements included in this MD&A and in certain documents referenced herein are expressly qualified by the cautionary statement. Solimar undertakes no obligation to publicly update or revise any forward-looking statements except as expressly required by applicable securities laws. HIGHLIGHTS (FOR THE THREE MONTHS ENDED MARCH 31, 2012) • Raised C$2.8m in February 2012 through the issue of a convertible debenture to sophisticated
investors. A further C$1.1m was raised in April 2012 through the issue of shares and warrants to investors in North America.
• Testing operations continued at Paloma focusing on the Antelope Shale zone with estimates of
some 366 feet of gross pay. • Planning well underway at the Kreyenhagen Project to implement a multi-stage program of
production testing, cyclic steam pilot and drilling of appraisal wells during the remainder of 2012.
For
per
sona
l use
onl
y

2
• During the March 2012 Quarter, a total of 1,652 barrels of oil were sold from the Maricopa
Project. Solimar’s share of oil revenue received in the March quarter (before royalties) was approximately A$96,000.
COMPANY PROFILE Solimar is headquartered in Melbourne, Victoria, Australia and has an operational office in Ventura, California, USA. Following the acquisition of Solimar Energy Pty Ltd by Livingstone Petroleum Ltd and its subsequent change of name to Solimar, the Company’s Ordinary Shares commenced trading on the Australian Securities Exchange (“ASX”), under the code “SGY”, on September 28, 2007. Solimar also commenced trading on the TSXV, under the code “SXS”, on November 14, 2011. COMPANY STRATEGY Solimar’s strategy is to focus on oil and gas exploration, commercial development and production in the onshore hydrocarbon regions of California with a growing focus on the San Joaquin Basin. Solimar currently holds approximately 23,000 net (working interest) acres in the San Joaquin Basin. The Company’s portfolio of assets includes nine (9) different projects, five of which Solimar currently operates and is the sole or main interest holder. Further information about Solimar is located on the Company’s website, www.solimarenergy.com.au, which also has a copy of the prospectus (dated November 15, 2011) for the TSXV Listing. OVERALL PERFORMANCE This section provides an overview of Solimar’s performance for the nine (9) months ended March 31, 2012. The section is comprised of Operational Activities by each project and Corporate Activities, which includes financing. Operational Activities (by Project) Kreyenhagen Project: 84% -100% Working Interest and Operator (San Joaquin Basin) Solimar continued preparations for a well re-entry and oil production testing program for the already discovered Temblor oil reservoir which has been intersected by numerous old wells in the Company’s leasehold area. This program is to be broken into three phases, a baseline primary production testing program to be followed by steam enhanced production trials and the drilling of appraisal wells. During the March quarter the Company was able to increase its position in leases outside the 10,000 acre primary lease (owned 100%) from 33.33% to 84%. The significance of this acquisition will be described in more detail closer to the time that related work programs (appraisal and exploration drilling) are due to be underway. The high interests that Solimar has progressively attained at Kreyenhagen provide the Company with the flexibility in the future to partially sell down or farmout to a suitably qualified partner while still retaining a majority interest in this large project that contains multiple oil target zones. The Company would expect to receive a premium on its investment to that point.
Preparations advanced for a primary “Cold Flow” production testing program using up to 4 existing wells is due to commence in May, 2012 within the existing Kreyenhagen field area in which Solimar has 100% WI. The production tests will sample crude for fluid characteristics and flow rates in the
For
per
sona
l use
onl
y
3
Temblor sandstone oil reservoir, as well as providing information on the potential use of Avenal Formation gas and water in steam generation.
A cyclic steam injection or “Huff and Puff” pilot program will follow the Cold Flow testing using these existing wellbores to measure the uplift in productivity that can be achieved with secondary, steam enhanced production. It is planned that results from both the primary Cold Flow, secondary Huff and Puff steam injection pilot and field appraisal wells will be used to generate a full field redevelopment plan to optimize recovery from the field. High recoveries of similar gravity oil have been achieved from the Temblor Sandstone in the nearest producing analogue, the giant Coalinga oil field. On November 18, 2011 the Company reported the results of an independent evaluation of oil resources prepared by Sproule Unconventional Limited (“Sproule”) for the Kreyenhagen project. The Sproule report was prepared in accordance with the Canadian National Instrument 51-101. The full Independent Expert Resource Report by Sproule is located on the Company’s website (www.solimarenergy.com.au), dated November 22, 2011. The Unrisked in place oil resources totalling 47.9 MMBBLS (Best Case) and 79.1 MMBBLS (High Case)* net are assigned to the Company’s working interest. The assessment was limited to the Company’s lease holdings covering, and contiguous with, the California Division of Oil and Gas and Geothermal Resources (“DOGGR”) recognized historic Kreyenhagen oil field area. As such it did not cover in detail the Company’s entire, operated position in the Kreyenhagen area where it now holds net working interest acres of approximately 13,000 acres. The Company believes that there is upside to the resource estimates. The oil is contained in an approximately 200 feet thick upper sandstone pay zone overlain by the Monterey Shale (McClure Shale member) and with a base seal provided by an intra-Temblor Sandstone shaley layer. The oil reservoir outcrops along the west side of the field, where it is believed to be capped by a biodegraded tar mat then plunges steeply underground to the east. The oil column within the trap is 1,200 feet thick based on existing well control. Due to the shallow depth of the oil reservoir (less than 1,500 feet in the appraised part of the field) future development drilling costs are expected to be low. Some 22 historic, vertical wells have been drilled into the field that were flowed at unstimulated, Cold Flow oil rates of between 1-21 bopd using standard type beam pumps. Solimar will be conducting 2 phases of production testing as pre-cursors to planning a full field development. A distinction is made between the “cold flow“ or primary production phase and a thermally enhanced or secondary production phase using steam to increase the mobility and recovery of the oil. Heavy oil fields in California are commonly produced using steam with the necessary energy provided by burning gas. The increased operating costs are then offset by both higher well flow rates and high oil recovery. Currently, commercial conditions are very favourable for a steam enhanced redevelopment of the Kreyenhagen field as there is a large differential between the price being achieved for California heavy oil ($102 per BBL average during January 2012 for Midway – Sunset reference 13 deg API gravity oil) and low prices for natural gas (California Composite $2.7 per MCF during January 2012). The Cold Flow production operations are set to commence in May 2012. These operations will involve re-entering up to 4 vertical wells that were drilled in 2007 to deeper targets and suspended without testing of the primary Temblor reservoir. The cost of these operations is expected to be approximately US$500,000. Solimar proposes to perforate a number of different zones within the thick oil reservoir and test each zone for flow potential and fluid characteristics. If these tests are successful the Company may drill additional vertical and horizontal wells to accelerate early production from the field using these low operating cost, “cold flow” production techniques. Several additional well pads have already been prepared. Following the Cold Flow operations which may run for up to 3 months, using a selection of the same wells the Company will conduct a cyclic steam or “huff and puff” production testing program
For
per
sona
l use
onl
y

4
to measure the response of the Temblor oil reservoir to steam. The steam will be provided by a portable steam generation unit (that has been ordered by Solimar) fuelled by propane that will also be trucked to site. Huff and puff operations involve the injection of a quantity of steam into the reservoir, shutting in the well for a period allowing the steam to take effect, then producing back up the same well bore. These operations can then be repeated with the duration of the individual cycles determined by the productive performance. Ultimately, Solimar expects a full field development to require a more comprehensive steam flood operation such as that being very successfully applied to the nearby Coalinga field that has produced over 900 MMBBLs of similar gravity heavy crude from shallow depths (as little as 300 feet from surface) in the Temblor Sandstone. Steam assisted oil recoveries at Coalinga are reported to have passed 40%. Potential steam enhanced oil recoveries at Kreyenhagen, after comparison with Coalinga data, have been independently estimated by Sproule at 35% (Best Case) and 60% (High Case)*.
Horizontal drilling, also yet to be applied at Kreyenhagen may have a further beneficial effect on both cold and steam enhanced production rates and the recovery of oil per well. In conjunction with the primary and thermal pilot testing programs, Solimar will be initiating a 4 well appraisal well program in the field area in the second half of 2012 to further extend the known limits of the field and to obtain core based reservoir engineering and geologic data to assist in the field redevelopment.
Other oil reservoirs and upside In addition to the Temblor there are three other oil reservoirs in the project acreage that collectively offer large upside. These also outcrop in the western part of the project area and are in descending order the Monterey Shale (McClure Shale Member), The Kreyenhagen Shale and the Avenal Sandstone. The Monterey Shale directly overlies the Temblor and is the main, highly prolific unconventional oil reservoir in the south of the basin. As part of field development planning a recent internal review of historic well data shows that a number of wells achieved primary production from a zone near the base of the shale. It is not yet clear whether the productive interval was a sandy unit within the shale or whether the flows were achieved from fracturing in the shale. The volumetric implications of this information have yet to be assessed by the Company. Underlying the Temblor is the Kreyenhagen Shale which is the principal source rock for the approximately 3 Billion BOE of oil and gas in surrounding fields recorded by the California Division of Oil, Gas and Geothermal resources (DOGGR) and for the oil in the Temblor at Kreyenhagen. The shales are very thick (over 1,000 feet in the east of the acreage) and data published by the United States Geological Survey (USGS) combined with geochemical data from the 2007 wells shows that the project area lies within a rich part of the Kreyenhagen Shale fairway. Unrisked oil in place potential of 35.9 MMBBLs (Best Case) and 59.4 MMBBLS (High Case)* have been independently estimated for a nominal 640 acre area (or 1 square mile land section) near to well control in the project area. This indicates unrisked potential for 100’s of MMBBLs of in place oil resources in the project which will be the subject of a future, separate evaluation program to investigate whether the oil can be commercially extracted. A core hole program is planned as the first step in evaluating the oil shale potential prior to the drilling of dedicated test wells. The lowest reservoir in the sequence is the Avenal Sandstone from which light oil and gas has been tested from a number of wells in the project. The Company plans to re test the Avenal as part of the cold flow production testing program. Unrisked oin in place potential of 3.7 MMbbls (Best Case) and 13.5 MMBBLS (High Case) have been independently assessed by Sproule for the Avenal. Importantly also, gas flows of up to 200,000 SCF/D have been recorded from the 2007 wells. The test program is being designed to assess whether this reservoir could be a cheap, in situ source of gas with further economic benefit for the anticipated steam enhanced development of the Temblor oil accumulation.
*Reference: Resource Assessment of Certain P&NG Holdings in the Kreyenhagen Area for Solimar Energy Limited (as of 31 October, 2011) - By Sproule Unconventional Limited. This report was
For
per
sona
l use
onl
y
5
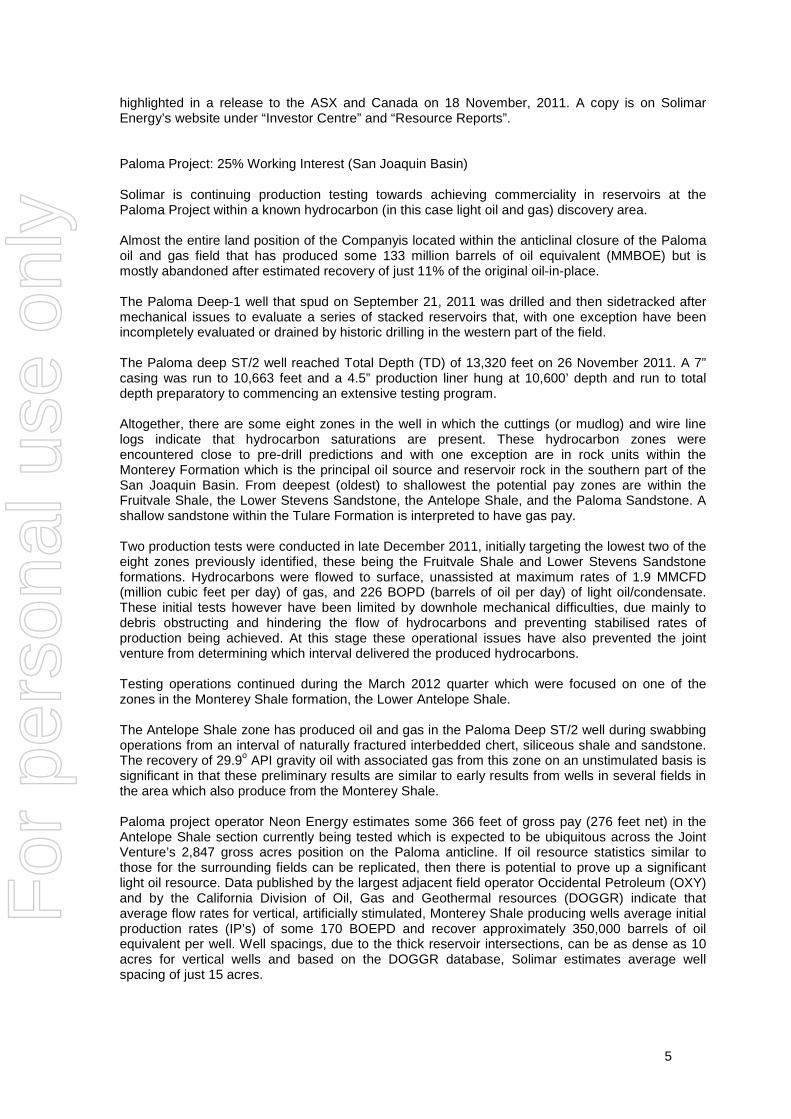
highlighted in a release to the ASX and Canada on 18 November, 2011. A copy is on Solimar Energy’s website under “Investor Centre” and “Resource Reports”. Paloma Project: 25% Working Interest (San Joaquin Basin) Solimar is continuing production testing towards achieving commerciality in reservoirs at the Paloma Project within a known hydrocarbon (in this case light oil and gas) discovery area. Almost the entire land position of the Companyis located within the anticlinal closure of the Paloma oil and gas field that has produced some 133 million barrels of oil equivalent (MMBOE) but is mostly abandoned after estimated recovery of just 11% of the original oil-in-place. The Paloma Deep-1 well that spud on September 21, 2011 was drilled and then sidetracked after mechanical issues to evaluate a series of stacked reservoirs that, with one exception have been incompletely evaluated or drained by historic drilling in the western part of the field. The Paloma deep ST/2 well reached Total Depth (TD) of 13,320 feet on 26 November 2011. A 7” casing was run to 10,663 feet and a 4.5” production liner hung at 10,600’ depth and run to total depth preparatory to commencing an extensive testing program. Altogether, there are some eight zones in the well in which the cuttings (or mudlog) and wire line logs indicate that hydrocarbon saturations are present. These hydrocarbon zones were encountered close to pre-drill predictions and with one exception are in rock units within the Monterey Formation which is the principal oil source and reservoir rock in the southern part of the San Joaquin Basin. From deepest (oldest) to shallowest the potential pay zones are within the Fruitvale Shale, the Lower Stevens Sandstone, the Antelope Shale, and the Paloma Sandstone. A shallow sandstone within the Tulare Formation is interpreted to have gas pay. Two production tests were conducted in late December 2011, initially targeting the lowest two of the eight zones previously identified, these being the Fruitvale Shale and Lower Stevens Sandstone formations. Hydrocarbons were flowed to surface, unassisted at maximum rates of 1.9 MMCFD (million cubic feet per day) of gas, and 226 BOPD (barrels of oil per day) of light oil/condensate. These initial tests however have been limited by downhole mechanical difficulties, due mainly to debris obstructing and hindering the flow of hydrocarbons and preventing stabilised rates of production being achieved. At this stage these operational issues have also prevented the joint venture from determining which interval delivered the produced hydrocarbons. Testing operations continued during the March 2012 quarter which were focused on one of the zones in the Monterey Shale formation, the Lower Antelope Shale. The Antelope Shale zone has produced oil and gas in the Paloma Deep ST/2 well during swabbing operations from an interval of naturally fractured interbedded chert, siliceous shale and sandstone. The recovery of 29.9o API gravity oil with associated gas from this zone on an unstimulated basis is significant in that these preliminary results are similar to early results from wells in several fields in the area which also produce from the Monterey Shale. Paloma project operator Neon Energy estimates some 366 feet of gross pay (276 feet net) in the Antelope Shale section currently being tested which is expected to be ubiquitous across the Joint Venture’s 2,847 gross acres position on the Paloma anticline. If oil resource statistics similar to those for the surrounding fields can be replicated, then there is potential to prove up a significant light oil resource. Data published by the largest adjacent field operator Occidental Petroleum (OXY) and by the California Division of Oil, Gas and Geothermal resources (DOGGR) indicate that average flow rates for vertical, artificially stimulated, Monterey Shale producing wells average initial production rates (IP’s) of some 170 BOEPD and recover approximately 350,000 barrels of oil equivalent per well. Well spacings, due to the thick reservoir intersections, can be as dense as 10 acres for vertical wells and based on the DOGGR database, Solimar estimates average well spacing of just 15 acres.
For
per
sona
l use
onl
y
6
Further drilling and production testing will be required to determine if the regional estimates are applicable to the Paloma project. The joint venture also proposes to investigate whether modern stimulation techniques coupled with horizontal development drilling could potentially accelerate the ultimate recovery of oil from this zone. The Joint Venture plans to pump test the lower Antelope Shale oil zone in the current well in order to further assess its economic viability. Based on the encouraging results to date plans are also advanced for follow-up drilling with well sites already permitted and a rig secured which has resulted in the early May spud of an appraisal well. Southeast Lost Hills (SELH) Project: 100% Working Interest and Operator (San Joaquin Basin) In the June 2011 Quarter permitting was commenced for several potential drilling locations selected after the geoscientific and engineering work was largely completed. The Company is processing permits which will enable it to drill up to four appraisal wells. Drilling activity has been deferred in the meantime while awaiting the permit approvals as well as allowing the Company’s resources to be directed to the programs at Paloma and Kreyenhagen. The Company is considering a farm down from its 100% interest in SELH in order to fund the future drilling. Tejon Footwall: 75% Working Interest (San Joaquin Basin) During the December 2011 Quarter, Solimar exercised its option to increase its ownership of this project to 75% which includes the right to operate. In addition, the Company has participated in a land acquisition program on a 50:50 basis which has added contiguous acreage to the project area, including another prospect. Solimar continues a subsurface geotechnical evaluation of the increased acreage position and anticipates the identification of additional prospectivity. An independent assessment of the area prospectivity was initiated during the quarter to further aid in de risking the 3D seismic defined leads and prospects in the acreage. Bayswater (Zodiac) Project: 1.13% Working Interest (San Joaquin Basin) Although the Company holds a small working interest in this project operated by TSX listed Zodiac Exploration Inc. (TSXV: ZEX) the resource potential reported by that company for this very large project means that success in the drill program could be material to Solimar. A horizontal well, the Zodiac 1-10 was drilled into the Kreyenhagen Shale to follow-up the earlier test of medium gravity crude from that formation in the Zodiac 4-9 vertical discovery well drilled earlier in the year. Solimar was carried through the first well but has participated at cost in the horizontal well. At the Company’s small equity position the cost exposure is modest. On September 14, 2011, Zodiac announced that the Zodiac 1-10 well had reached a total depth of 16,950 feet on August 28, 2011, after intersecting sandstone, siltstone, and shale sections below the Kreyenhagen with high background gas readings and associated increases in C1-C5 on mud logs, and oil shows. With formation pressures estimated in excess of 14,000 psi and significant mud log hydrocarbon response in the lower 250 feet of the wellbore, the mud weight was increased to 16.4 pounds per gallon prior to stopping drilling. As a result of deepening the well, Zodiac identified several deeper potential targets. On October 11, 2011 Zodiac announced that it had set a liner in the build section of the Zodiac 1-10 well and it was going to drill the horizontal section in the upper Kreyenhagen Formation at approximately 14,440 feet vertical depth. The drilling was expected to take up to three (3) weeks.
For
per
sona
l use
onl
y
7
The main activity at this project has been preparation for and then commencement in December 2011 of testing the Zodiac 1-10 well. The test is a multi-stage fracc stimulated production test of the horizontal section drilled into the Kreyenhagen Shale. During the March 2012 quarter the operator Zodiac Exploration Inc (“Zodiac”) (TSXV: ZEX) completed a 10 stage horizontal stimulation in the upper Kreyenhagen Formation in its 1-10 well. Despite surface and down hole equipment limitations during the stimulation and testing phases, the well flowed at a total fluid rate of 1,780 barrels per day to 260 barrels per day from January 7th to January 24th, 2012. These rates included 126 barrels per day to 60 barrels per day of 29o degree API oil, respectively. The preliminary analysis of the flowing pressures and data from a brief shut in period indicated possible damage to the hydraulic fractures and reservoir. The damage could have resulted from the completion fluid (gel filter cake) or downhole obstruction generated by the inability to restrict the flow rate during the initial cleanup phase. Although completion effectiveness and flow test results are less than anticipated, the recovery of oil from the Kreyenhagen Shale in a non-structural position is significant for the regional implications for expanding the play beyond well-defined structural closures. Guijarral Hills Project: 50%* Working Interest and Operator Solimar is conducting subsurface geotechnical studies to determine the technical and economic viability of further testing in the suspended 76-33 well bore. * Solimar will initially retain a 60% interest but partner Blast Energy Services has a short term option to acquire 10%. Jacalitos Project: 75% Working Interest and Operator (San Joaquin Basin) While no activity occurred on this project in the September 2011 Quarter, this project is contiguous with the Company’s greater Kreyenhagen project and work commenced in the December 2011 Quarter to reassess the basis of the extension of the play types identified in that acreage. Kettleman Middle Dome (KMD) Project: Back in right to 10% Working Interest (San Joaquin Basin) An additional well was drilled in this acreage during the March 2012 quarter by a private, USA based company, New Gulf Resources. The acreage contains a mapped extension of the Kettleman Middle Dome oil and gas field and is particularly prospective for fractured shale reservoirs in both the Monterey formation and Kreyenhagen Shale. Solimar is reviewing the initial well results to determine whether to exercise its back in right which would be at ground floor cost (that is by paying 10% to own a 10% interest). Production Maricopa Project: 50% Working Interest and Operator (San Joaquin Basin) During the nine months to 31 March 2012, a total of 5,607 barrels of oil were sold from the Maricopa Project. The average price of oil received from Kern Oil Refinery in the quarter was about US$109/bbl. Solimar Energy’s share of revenue received in the nine months to 31 March 2012 (before royalties) was approximately A$309,000. The Company continued during the quarter a process to sell this well performed, yet small asset.
For
per
sona
l use
onl
y
8
Corporate Activities Financing On August 25, 2011, Solimar announced that it had entered into a series of financing arrangements, which involved both an Underwritten Financing and an unsecured Loan Facility, whereby the Company would receive aggregate minimum gross proceeds of approximately C$5,500,000 and up to maximum gross proceeds of approximately C$8,500,000. A prior A$7 million placement approved by shareholders at a General Meeting on July 29, 2011 was found to have structural deficiencies due to unanticipated increased levels of Canadian share ownership that would prevent tradability of stock for Canadian investors (potentially for an indefinite period). This was terminated on delivery of C$3.5 million in funds advanced under the Loan Facility and entering into the Bought Deal or Underwritten Financing Agreement with Canaccord Genuity Corp (“Canaccord Genuity”). The Loan Facility was an unsecured loan facility of C$3,500,000 arranged at arm’s length with strategic investors. The loan could be converted, at the Company’s election, into Special Warrants that are then convertible to Ordinary Shares and Warrants on the same terms as the Underwritten Financing. Alternatively the Company could pay out the loan in cash within 12 months. On November 15, 2011, Solimar announced that it had received C$2,307,344 (net of costs) from an Underwritten (Bought Deal) Private Placement. The financing was by way of a private placement of 34,054,638 Subscription Receipts (including 6,276,638 Subscription Receipts pursuant to a portion of the over-allotment option) underwritten by Canaccord Genuity according to customary underwriting terms and conditions. Investors paid C$0.072 per Subscription Receipt and the proceeds of the Subscription Receipts were deposited into escrow on the closing date. Refer to the ASX Releases on August 25, 2011 and October 5, 2011 for more details on the Underwritten Financing and Loan Facility. On December 13, 2011, Solimar announced that it had engaged a syndicate of agents led by Canaccord Genuity Corp, and including Fraser Mackenzie Limited (the “Agents”) to raise on a best efforts basis up to C$3,000,000 in additional financing through the issuance of convertible debentures (the “Offering”) which will be used to fund the extended flow testing program planned for the Paloma Deep ST/2 discovery and a further expansion of its asset base in the San Joaquin Basin California. On February 13, 2012, Solimar announced that the Offering had closed with Gross Proceeds of C$2,800,000 from the issue of 56, $50,000 par value convertible unsecured senior debentures (the “Debentures”) subject to a coupon interest rate of 10% per annum, payable quarterly in arrears, at the election of Solimar, in cash or through the issuance of common shares of the Company (“Common Share”) at a price equal to a 10% discount to the volume weighted average trading price of the Common Shares on the TSXV for the 10 trading days immediately preceding the applicable quarterly interest payment date. The Debentures will have a term of 24 months and will be convertible into Common Shares at the holder's option at a conversion price equal to $0.10 per Common Share. Solimar has the right to accelerate the maturity date of the Debentures to 30 days from the date of notice once the share price of Solimar’s common shares is equal to, or greater than, $0.20 per share on the TSXV or the ASX for 21 consecutive trading days. Each holder of a Debenture shall receive 250,000 share purchase warrants (the “Warrants”) per Debenture. Each Warrant will entitle the holder to acquire one Common Share at a price of $0.15 for a period of 24 months after the closing date. Solimar will have the right to accelerate the expiry date of the Warrants to 30 days from the date of notice once the share price of Solimar’s common shares is equal to, or greater than, $0.25 per share on the TSXV or the ASX for 21 consecutive trading days. The Offering was managed by a syndicate of agents led by Canaccord Genuity Corp. and included Fraser Mackenzie Limited (the “Agents”).
For
per
sona
l use
onl
y
9
On 5 April 2012 Solimar announced that it had completed a C$1.1 million Private Placement (the "Placement"). These funds were to be used to assist with funding the testing program at the Kreyenhagen Project. Solimar raised the C$1.1 million (before costs) in funds through the issue of 12,222,222 Units at a price of C$0.09 (9 Canadian cents) per Unit to two (2) sophisticated investors based in Canada and Switzerland. Each Unit consists of one (1) ordinary share in Solimar ("Share") and one-half (1/2) of one share purchase warrant ("Warrant"). Each whole Warrant entitles the holder to acquire one (1) Share for an exercise price of C$0.15 (15 Canadian cents) until 5.00pm (Calgary time) on the date that is three (3) years from the date the Warrants are issued. The Company is continuing with negotiations for the sale of non core assets for a cash consideration and expects to conclude these arrangements in the near future. In addition the Company’s high ownership levels in its projects allows for further partial asset sales or farmouts for carry through work programs, reducing reliance on equity capital sources. Canadian Stock Exchange Listing During the September 2011 quarter, the Solimar Board progressed its investigation into a potential listing in Canada on either the Toronto Stock Exchange (TSX) or the TSXV. The investigation considered such factors as: the costs of listing and annual listing fees; whether to maintain a dual ASX and TSX/TSXV listing; strengthening the board and management team; and the implications for Australian shareholders in Solimar. The Board was assisted by Canaccord Genuity, the global capital markets division of Canaccord Financial Inc. (CF: TSX; CF: AIM), Davis LLP legal advisers from Calgary and Allens Arthur Robinson in Melbourne. Following the investigation, a decision was made to dual-list Solimar on the TSXV. On November 14, 2011, Solimar announced that it had listed on the TSXV. The Company’s shares trade under the code “SXS” on the TSXV. Solimar is dual listed and continues to trade on the ASX under the code “SGY”. Appointment of New Non-Executive Directors On September 12, 2011, Solimar announced the appointment of Dr Charle Gamba as an independent non-executive Director to the Board of Company. Dr Gamba (who is a resident in the United States) is a senior executive with almost 20 years working experience in the USA and international upstream oil and gas industry. He has expert knowledge of the California producing basins and a proven record of discovery and commercial development of both light and heavy oils and in business development. Dr Gamba has considerable expertise in the establishment and growth of public oil and gas companies listed on Canadian stock exchanges. He is currently the President and CEO of Canacol Energy Ltd (“Canacol”) which is a Canadian-based oil company (TSX: CNE; BVC: CNE.N) focussed on Exploration & Production (“E&P”) activities in Colombia, Guyana and Brazil. Dr Gamba founded Canacol in 2008 taking that Company from an initial capitalisation of C$4 million to its capitalisation of C$460 million (as at 12 September 2011) and operating net daily oil production of approximately 12,000 bopd in Q2 2011. He is also a non executive Director of Gallic Energy Ltd. (TSXV: GLC), Carrao Energy Ltd., and Miramar Hydrocarbons Ltd. Dr Gamba has held a variety of technical and management roles with major and mid-sized international oil companies during his career, most recently with Occidental Petroleum between 2001 and 2008 where he served as Vice President of Exploration for Occidental in Colombia. This followed postings with Occidental in Ecuador, Qatar and in the USA. Dr. Gamba has also worked for Alberta Energy Company in Argentina and Ecuador, and for Canadian Occidental in Indonesia, Australia, and Canada. He started his career as a geologist with Imperial Oil in Calgary, and holds an MSc and PhD in Geology. On October 10, 2011 Solimar announced the appointment of Mr Jason Bednar as an independent non-executive Director to the Board of Solimar Energy, resident in Calgary, Canada.
For
per
sona
l use
onl
y
10
Mr Bednar is a chartered accountant with considerable expertise in the financial and regulatory management of oil and gas companies listed on the TSX, TSXV and American Stock Exchange (AMEX). He has been the founding Chief Financial Officer (CFO) of a number of publically listed companies including Pan Orient Energy Corp. which while growing its operated production via the drill bit to some 14,000 bopd increased its market capitalisation from $C30 million in 2005 to a peak of C$700 million in 2008. Mr Bednar is also a non executive Director of two other public international oil companies, Canacol Energy Inc. for which he is the Chairman of the Audit Committee and he is the non executive Chairman of Gallic Energy Ltd. Additionally Mr Bednar is a Director and the CFO of MENA Hydrocarbons Inc. Mr Bednar began his career in the chartered accountancy firm of Brown Smith Owen in 1993 before moving into Financial Controller roles at oil production companies Canadian 88 Energy Corp. (operator of 20,000 bopd) and Canadian Superior Energy Inc (operator of 3,000 bopd). In 2004 he left Canadian Superior to be the founding CFO at Pan Orient Energy. Appointment of New Chief Operating Officer On November 17, 2011, Solimar announced the appointment of Mr Will Satterfield, effective 1 January 2012, as Chief Operating Officer based in the Company’s operations office at Ventura, California. Mr Satterfield, 49, is a highly experienced petroleum geologist and oil company manager who is an expert on the oil producing conventional and unconventional (oil shale) reservoirs of the San Joaquin Basin. His immediate past job was as Country Manager in India for the London Stock Exchange listed Hardy Oil and Gas Inc., where he was responsible for a business with operated production of 3,500 BOPD and a staff of 35. His role at Hardy also involved corporate disciplines such as regularly assisting the CEO in communicating company results to the Hardy Board and investment community. Previously, Mr Satterfield worked for 21 years with Occidental Petroleum (most recently as Geosciences Manager for Central and Southern California), one of California’s most prominent and expansionist oil companies. Occidental or OXY is the largest petroleum land holder in the San Joaquin Basin and almost without exception is the largest land holder adjacent to or surrounding Solimar’s projects. Annual General Meeting and Option Plan The Company held its Annual General Meeting on November 29, 2011 and all resolutions were approved by shareholders, including approval for the Company’s Option Plan. Details of this plan (and the other resolutions) are contained in the Notice of Annual General Meeting and Explanatory Memorandum, which was released to the ASX on October 28, 2011. Half Year Financial Report On 1 March 2012 the Company released its half year financial report (period to 31 December 2011). The Company also in mid February released its first Management Discussion and Analysis for the December 2011 quarter. General Meeting The Company held a General Meeting on 12 April 2012. There were several resolutions passed including the approval for the issue of shares to directors in lieu of fees and bonuses and ratification of the issue of the convertible unsecured debentures made in February 2012.
For
per
sona
l use
onl
y
11
DISCUSSION OF OPERATIONAL AND FINANCIAL RESULTS
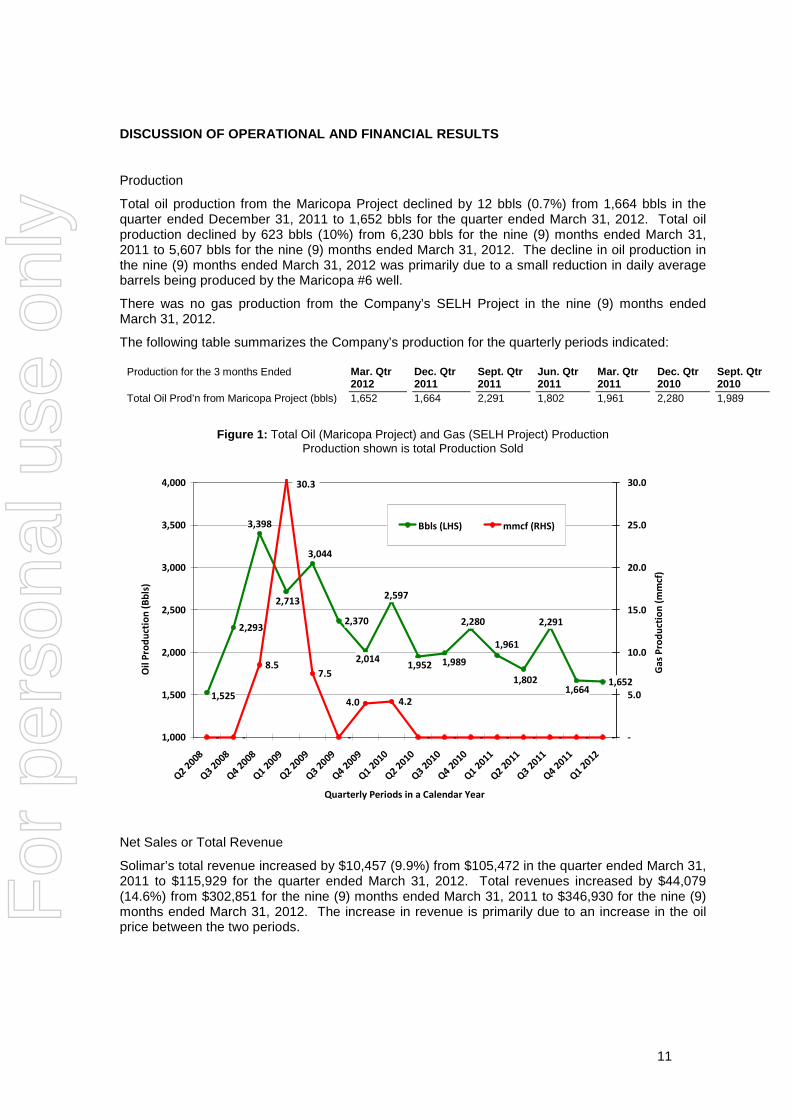
Production
Total oil production from the Maricopa Project declined by 12 bbls (0.7%) from 1,664 bbls in the quarter ended December 31, 2011 to 1,652 bbls for the quarter ended March 31, 2012. Total oil production declined by 623 bbls (10%) from 6,230 bbls for the nine (9) months ended March 31, 2011 to 5,607 bbls for the nine (9) months ended March 31, 2012. The decline in oil production in the nine (9) months ended March 31, 2012 was primarily due to a small reduction in daily average barrels being produced by the Maricopa #6 well.
There was no gas production from the Company’s SELH Project in the nine (9) months ended March 31, 2012.
The following table summarizes the Company’s production for the quarterly periods indicated:
Production for the 3 months Ended Mar. Qtr 2012
Dec. Qtr 2011
Sept. Qtr 2011
Jun. Qtr 2011
Mar. Qtr 2011
Dec. Qtr 2010
Sept. Qtr 2010
Total Oil Prod’n from Maricopa Project (bbls) 1,652 1,664 2,291 1,802 1,961 2,280 1,989
Figure 1: Total Oil (Maricopa Project) and Gas (SELH Project) Production Production shown is total Production Sold
2,2932,370
1,6521,802
1,961
2,280
1,9891,952
3,398
2,713
2,014
3,044
1,5251,664
2,597
2,291
- - - - - - - - - - -
4.24.0
7.58.5
1,000
1,500
2,000
2,500
3,000
3,500
4,000
Q2 2
008
Q3 2
008
Q4 2
008
Q1 2
009
Q2 2
009
Q3 2
009
Q4 2
009
Q1 2
010
Q2 2
010
Q3 2
010
Q4 2
010
Q1 2
011
Q2 2
011
Q3 2
011
Q4 2
011
Q1 2
012
-
5.0
10.0
15.0
20.0
25.0
30.0
Bbls (LHS) mmcf (RHS)
Oil
Pro
du
ctio
n (
Bb
ls)
Ga
s P
rod
uct
ion
(m
mcf
)
30.3
Quarterly Periods in a Calendar Year
Net Sales or Total Revenue
Solimar’s total revenue increased by $10,457 (9.9%) from $105,472 in the quarter ended March 31, 2011 to $115,929 for the quarter ended March 31, 2012. Total revenues increased by $44,079 (14.6%) from $302,851 for the nine (9) months ended March 31, 2011 to $346,930 for the nine (9) months ended March 31, 2012. The increase in revenue is primarily due to an increase in the oil price between the two periods.
For
per
sona
l use
onl
y

12
Period Three Months Ended Nine Months (Interim) Ended Mar. 31, 2012 Mar. 31, 2011 Mar. 31, 2012 Mar. 31, 2011
Sales Revenue 111,333 98,393 319,557 281,600
Interest 4,596 7,079 27,373 21,251
Total Revenue 115,929 105,472 346,930 302,851
Net Income or Loss
Solimar reported a net loss for the nine (9) months ended March 31, 2012 of $8,136,819 or (2.05) cents per share, which was an increase in net losses of $5,850,499 or 255.9% from the net loss for the nine (9) months ended March 31, 2011 of $2,286,320, or (0.83) cents per share. The increase in net losses is mainly attributable to an increase in professional fees, personnel expenses, listing costs and losses on the change in the fair value of derivatives. Most of the increase in these costs are associated with issuing options to directors, consultants and personnel as approved in July 2011 and November 2011, the Company’s listing on the TSXV on November 14, 2011, the various Canadian capital raisings that have been undertaken in the financial year and unrealised losses on the revaluation of the derivatives which the Company recognises in its balance sheet.
Three Months Ended Nine Months (Interim) Ended Mar. 31, 2012 Mar. 31, 2011 Mar. 31, 2012 Mar. 31, 2011
Net Loss (attributable to Equity Holders)(1) (2,554,689) (499,635) (8,136,819) (2,286,320)
Net Loss per Share – Non-Diluted (cents per Share) (0.57) (0.16) (2.05) (0.83)
Net Loss per Share – Diluted(2) (cents per Share) (0.57) (0.16) (2.05) (0.83) Notes: (1) The “Net Loss” figure complies with reporting under the Australian Accounting Standards and the
International Financial Reporting Standards (2) Given that a loss was incurred in the periods disclosed above, any dilution applied to earnings per
share would have an anti-dilutive effect.
Extraction Costs
Solimar’s extraction costs decreased by $4,661 (11.9%) from $39,181 in the quarter ended March 31, 2011 to $34,520 for the quarter ended March 31, 2012. Extraction costs increased by $31,807 (30.4%) from $104,645 for the nine (9) months ended March 31, 2011 to $136,452 for the nine (9) months ended March 31, 2012. This increase was primarily associated with an increase in water carriage costs and maintenance done on the Maricopa #6 well.
Three Months Ended Nine Months (Interim) Ended Mar. 31, 2012 Mar. 31, 2011 Mar. 31, 2012 Mar. 31, 2011
Extraction costs 34,520 39,181 136,452 104,645
General and Administration Costs
General and administrative costs (includes Professional fees, Personnel expenses, Travel expenses, Other expenses and Canadian Listing Costs) increased by $1,333,058 (297.3%) from $448,417 in the quarter ended March 31, 2011 to $1,781,475 for the quarter ended March 31, 2012. General and administrative costs increased by $4,662,326 (306.6%) from $1,520,818 for the nine (9) months ended March 31, 2011 to $6,183,144 for the nine (9) months ended March 31, 2012.
For
per
sona
l use
onl
y

13
The increase in these costs was primarily associated with expensing options issued to directors, consultants and personnel as approved in July 2011 and November 2011, the Company’s listing on the TSXV on November 14, 2011 and the various Canadian capital raisings that have been undertaken in the financial year.
Three Months Ended Nine Months (Interim) Ended Mar. 31, 2012 Mar. 31, 2011 Mar. 31, 2012 Mar. 31, 2011
General and Administration costs 1,781,475 448,417 6,183,144 1,520,818
Loss on change in fair value of derivative
The Company incurred a loss on the change in the fair value of derivatives that have been recognised in the financial statements during the nine (9) months ended March 31, 2012. The loss for the quarter ended March 31, 2012 was $640,160 and for the nine (9) months ended March 31, 2012 the loss was $1,192,360. There was no corresponding amount in the comparative periods. The derivatives recognised in the balance sheet relate to recognition of a derivative component existing in the nature of the financings the Company undertook in the second half of calendar 2011 and February 2012. The derivatives are re-valued at each report date and any gain or loss resulting from the revaluation is recognised in the profit and loss.
Three Months Ended Nine Months (Interim) Ended Mar. 31, 2012 Mar. 31, 2011 Mar. 31, 2012 Mar. 31, 2011
Loss on change in fair value of derivative 640,160 - 1,192,360 -
Research and Exploration Expenditure
Research and exploration expenditure increased by $31,635 (26.9%) from $117,509 in the quarter ended March 31, 2011 to $149,144 for the quarter ended March 31, 2012. Research and exploration expenditure decreased by $185,567 (31.4%) from $591,797 for the nine (9) months ended March 31, 2011 to $406,230 for the nine (9) months ended March 31, 2012. The decline in costs for the nine (9) months ended 31 March 2012 was attributable to a reduction in delay rentals paid between the periods and that the 31 March 2011 period included a one-off charge of $154,580 associated with a rig break fee. The small increase between the March quarters was attributable to an increase in G&G services during the March 2012 quarter as compared to March 2011.
Three Months Ended Nine Months (Interim) Ended Mar. 31, 2012 Mar. 31, 2011 Mar. 31, 2012 Mar. 31, 2011
Research and Exploration expenditure 149,144 117,509 406,230 591,797
For
per
sona
l use
onl
y

14
Total Assets
Solimar’s Total Assets were $9,378,260 as at March 31, 2012 which was an increase of $2,451,141 (or 35.4%) compared to the Company’s Total Assets of $6,927,119 as at June 30, 2011. This increase in total assets was primarily due to an increase in capitalized exploration and evaluation expenditure associated with the drilling of the Paloma Deep ST/2 well and some additional capitalised expenditure associated with the Tejon Footwall and Zodiac projects. Consolidated, as at Mar. 31, 2012 June 30, 2011
Current Assets 754,537 1,736,351
Non-Current Assets 8,623,723 5,190,768
Total Assets 9,378,260 6,927,119
Cash Flows
Solimar reported a decrease in cash and cash equivalents of $561,905 in the quarter ended 31 March 2012 compared with a decrease in cash and cash equivalents for the quarter ended 31 March 2011 of $350,711. Solimar reported a decrease in cash and cash equivalents of $865,541 for the nine (9) months ended March 31, 2012 compared with an increase of $464,379 for the nine (9) months ended March 31, 2011. The declines in these comparisons are primarily related to increases in payments associated with exploration activity along with an increase in expenditures associated with capital raising activities and the TSXV listing.
Three Months Ended Nine Months (Interim) Ended Mar. 31, 2012 Mar. 31, 2011 Mar. 31, 2012 Mar. 31, 2011
Net Cash Flows Used in Operating Activities (1,585,750) (57,016) (4,222,792) (1,272,440)
Net Cash Flows Used in Investing Activities (1,496,846) (417,254) (4,432,712) (1,301,956)
Net Cash Flows Used from Financing Activities 2,520,691 123,559 7,789,963 3,038,775
Net Increase/(Decrease) in Cash and Cash Equivalent s (561,905) (350,711) (865,541) 464,379
Short-Term and Long-Term Financial Liabilities
As at March 31, 2012, Solimar had long term interest bearing debt.
On 13 February, 2012, Solimar announced it has raised C$2.8 million before costs by the issuance of Convertible Unsecured Debentures (the “Debentures”) that are convertible at C$0.10 per Common Share and have a two (2) year term and warrants (the "Warrants") entitling the holder to acquire Common Shares of the Corporation for C$0.15 per Common Share for a two (2) year term (the "Offering"). The Debentures are subject to a coupon interest rate of 10% per annum, payable quarterly in arrears, at the election of Solimar in cash or through the issuance of shares in the Company.
Solimar has recognised derivative liabilities of $2,496,343 at 31 March 2012 which represents the value of the warrants issued in November 2011 and February 2012 along with a derivative value component ascribed to the convertible debentures issued in February 2012. The note can be satisfied through the issue of shares denominated in a foreign currency (CAD) and the warrants attached to the convertible debentures and the previous financings are exercisable in a foreign currency (CAD) and therefore the Company has a foreign exchange risk. For this reason there is recognition of a liability which will also be required to be re-valued at each report date.
For
per
sona
l use
onl
y

15
SUMMARY OF QUARTERLY AND HALF YEAR RESULTS
Prior to the December 2011 quarter Solimar was not obliged to provide quarterly financial reports as the ASX Listing Rules and the Australian Corporations Act do not require quarterly financial reporting. The Company has however been required to provide half year and annual financial results. The table below initiates Solimar’s summary of quarterly comparisons based on the three (3) months ended March 31, 2012 and December 31, 2011.
Three Months Ended
March 31, 2012 (A$)
Three Months Ended December 31,
2011 (A$)
Total Revenue (Oil & Gas) (A$) ............................................... 111,333 100,108 Operating (Extraction) Costs (A$) ............................................ 34,520 44,169
General and Administration Costs (A$) ................................ 1,781,475 2,434,069
Net Loss (attributable to Equity Holders) (A$) ............................. (2,554,689) (3,930,678)
Loss per Share – Non Diluted (cents/share) (A$) .................... (0.57) (0.99)
Loss per Share – Diluted (cents/share) (A$) ........................... (0.57) (0.99)
Closing Cash and Cash Equivalents (A$) ................................ 514,473 1,112,115
Total Assets (A$) ....................................................................... 9,378,260 9,949,449
Total Liabilities (A$)................................................................ 6,992,037 5,060,380
Net Assets (Shareholder Equity) (A$) ................................ 2,386,223 4,889,069
Net Increase/(Decrease) in Cash from Cashflows (A$) ............ (561,905) (41,290)
Oil Production (bbls) ............................................................... 1,652 1,664
Gas Production (mcf) 0 0
The following table sets out the financial results for the Company’s six (6) most recently completed half-year periods. This information is based on Solimar’s audited Financial Accounts for the 12 months ended June 30, 2011, June 30, 2010 and June 30, 2009, and the unaudited Financial Accounts for the six (6) months ended: December 31, 2011; December 31, 2010; and December 31, 2009. These accounts were prepared in accordance with Australian Accounting Standards, which are compliant with International Financial Reporting Standards.
Six Months Ended
December 31 2011 (A$)
June 30 2011 (A$)
December 31 2010 (A$)
June 30 2010 (A$)
December 31 2009 (A$)
June 30 2009 (A$)
Total Revenue (Oil & Gas) (A$)................................................................208,224 324,636 183,207 223,069 198,313 336,067
Operating (Extraction) Costs (A$)................................................................101,932 74,420 65,464 81,913 74,829 157,306
General and Administration Costs (A$)................................ 4,401,669 1,809,873 1,072,401 850,468 702,489 582,588
Net Loss (attributable to Equity Holders)(1) (A$) ................................(5,582,130) (2,960,116) (1,786,685) (3,845,003) (946,789) (1,900,185)
Loss per Share – Non Diluted (cents/share) (A$) ................................(1.50) (0.93) (0.70) (1.76) (0.46) (0.88)
Loss per Share – Diluted(2) (cents/share) (A$) ................................(1.50) (0.93) (0.70) (1.76) (0.46) (0.88)
Closing Cash and Cash Equivalents (A$) ................................ 1,112,115 1,379,743 1,776,607 1,046,989 1,571,578 758,463
Total Assets (A$) ................................................................................................9,949,449 6,927,119 5,868,964 5,185,798 5,302,135 4,562,461
Total Liabilities (A$) ................................................................ 5,060,380 3,113,014 1,088,828 1,080,259 359,255 345,632
Net Assets (Shareholder Equity) (A$) ................................ 4,889,069 3,814,105 4,780,136 4,105,539 4,942,880 4,216,829
Net Increase/(Decrease) in Cash from Cashflows (A$) ................................(303,636) (310,436) 815,090 (527,895) 864,665 (886,675)
Oil Production (bbls) ................................................................ 3,955 3,763 4,269 4,549 4,384 5,757
Gas Production (mcf) 0 0 0 4,202 4,007 37,822
Notes: (1) The “Net Loss” figure complies with reporting under the Australian Accounting Standards and the
International Financial Reporting Standards (2) Given that a loss was incurred in the last six (6) financial half years, any dilution applied to earnings
per share would have an anti-dilutive effect.
For
per
sona
l use
onl
y

16
COMPANY OUTLOOK During the March 2012 quarter of 2012, Solimar has continued to focus on high value, high reward oil prone projects in the San Joaquin Valley operating area.
Solimar has been in advance preparations during the quarter to begin a multi-phased 2012 work program at the 100% owned Kreyenhagen Field area consisting of:
• “Cold Flow” testing of up to four pre-existing well bores
• Cyclic steam “Huff and Puff” pilot
• Drilling of up to four appraisal wells
At Paloma, Solimar is continuing production testing of a zone within the Monterey Shale. At completion of the testing of this zone the Joint venture intends to also test further shallower zones in the well in which there is indicated oil pay.
PROPOSED TRANSACTIONS The Company has initiated a process to sell the well-performed, yet small Maricopa oil production asset and has received cash offers The Company is also preparing for a farmout program that will involve reducing its large interests in selected projects in return for cash and carry through the costs of its expanded asset work programs.
CAPITAL EXPENDITURE
Research and exploration expenditure for the nine (9) months ended March 31, 2012 was $406,230 (2011: $591,797). Capitalized exploration and evaluation expenditure as at March 31, 2012 was $7,346,861 (2011: $3,870,274).
LIQUIDITY AND CAPITAL RESOURCES
As at March 31, 2012 Solimar had $514,473 in cash and cash equivalents which is a decline of $865,270 (62.7%) from the cash and cash equivalents position of $1,379,743 as at June 30, 2011.
Solimar’s estimated consolidated working capital deficiency (current assets less current liabilities) as at March 31, 2012 is $1,170,934. Solimar has received C$1.1 million (before costs) from a private placement announced on April 10, 2012 which will come close to covering the working capital deficiency. In addition to these funds, Solimar expects to be successful in accessing further capital through farmouts and selected asset sales. The latter are likely only to be partial sales or reductions in working interest for key assets or outright sales of non-core assets
Solimar’s cash is held in reputable Banks in Australia (National Australia Bank) and California (Bank of America). The cash balances can be drawn at any time without restrictions.
Solimar defines liquidity risk as the risk that the Company and its subsidiaries will not be able to meet their financial obligations as they fall due. The Company's approach to managing liquidity is to ensure, as far as possible, that it will always have sufficient liquidity to meet its liabilities when due, under both normal and stressed conditions, without incurring unacceptable losses or risking damage to Solimar’s reputation.
For
per
sona
l use
onl
y

17
The following table is a summary of Solimar’s major commitments and contractual obligations.
Payments Due by Period
Contractual Obligations (1)
Total
Less than 1 year
1 - 3 years
4 - 5 years
After 5 years
Debt(2) A$3,207,644 A$240,114 A$2,967,530 - -
Finance Lease Obligations
- - - - -
Operating Leases(3) A$420,496 A$243,747 A$176,749 - -
Purchase Obligations(4) A$58,162 A$58,162 - - -
Other Obligations(5) A$292,981 A$292,981 - - -
Total Contractual Obligations A$3,979,283 A$835,004 A$3,144,279 - -
Notes: (1) The figures disclosed relate to contractual obligations at March 31, 2012 which were not recognised as
liabilities in the financial statements. (2) On February 13, 2012, Solimar announced that it had issued Convertible Unsecured Debentures raising
C$2.8million. The debentures mature in February 2014 and entitle the holder to convert at C$0.10 per share. The debentures pay 10% interest payable quarterly in arrears. The interest payments can be made in cash or shares at the Company’s option. On maturity the debentures can be paid out in shares or cash at the Company’s option.
(3) “Operating Leases” relate to the Company’s office leases in Australia and the United States (Ventura, California) and its project leases. The figures shown reflect the payments due under the various lease agreements.
(4) “Purchase Obligations” relate to costs at Paloma, Maricopa and Zodiac. (5) “Other Obligations” relates to payments that are payable on termination of consultancy agreements.
CONVERTIBLE DEBENTURE
On 13 February, 2012, Solimar announced it has raised C$2.8 million before costs by the issuance of Convertible Unsecured Debentures (the “Debentures”) that are convertible at C$0.10 per Common Share and have a two (2) year term and warrants (the "Warrants") entitling the holder to acquire Common Shares of the Corporation for C$0.15 per Common Share for a two (2) year term (the "Offering"). The Debentures are subject to a coupon interest rate of 10% per annum, payable quarterly in arrears, at the election of Solimar in cash or through the issuance of shares in the Company. The Offering was managed by a syndicate of agents led by Canaccord Genuity Corp. and included Fraser Mackenzie Limited (the “Agents”). On 5 April 2012 Solimar announced that it had completed a C$1.1 million Private Placement (the "Placement"). Solimar raised the C$1.1 million (before costs) in funds through the issue of 12,222,222 Units at a price of C$0.09 (9 Canadian cents) per Unit to two (2) sophisticated investors based in Canada and Switzerland. Each Unit consists of one (1) ordinary share in Solimar ("Share") and one-half (1/2) of one share purchase warrant ("Warrant"). Each whole Warrant entitles the holder to acquire one (1) Share for an exercise price of C$0.15 (15 Canadian cents) until 5.00pm (Calgary time) on the date that is three (3) years from the date the Warrants are issued.
For
per
sona
l use
onl
y
18
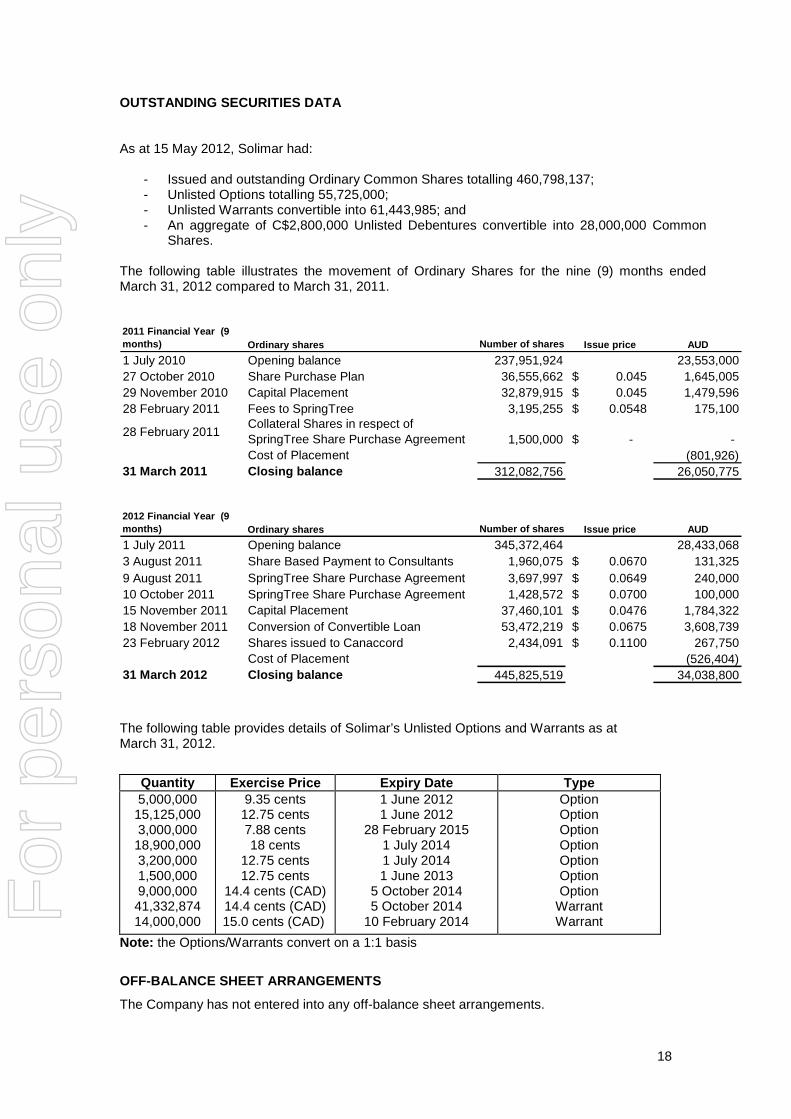
OUTSTANDING SECURITIES DATA As at 15 May 2012, Solimar had:
- Issued and outstanding Ordinary Common Shares totalling 460,798,137; - Unlisted Options totalling 55,725,000; - Unlisted Warrants convertible into 61,443,985; and - An aggregate of C$2,800,000 Unlisted Debentures convertible into 28,000,000 Common
Shares. The following table illustrates the movement of Ordinary Shares for the nine (9) months ended March 31, 2012 compared to March 31, 2011. 2011 Financial Year (9 months) Ordinary shares Number of shares Issue price AUD
1 July 2010 Opening balance 237,951,924 23,553,00027 October 2010 Share Purchase Plan 36,555,662 0.045$ 1,645,00529 November 2010 Capital Placement 32,879,915 0.045$ 1,479,59628 February 2011 Fees to SpringTree 3,195,255 0.0548$ 175,100
28 February 2011Collateral Shares in respect of SpringTree Share Purchase Agreement 1,500,000 -$ - Cost of Placement (801,926)
31 March 2011 Closing balance 312,082,756 26,050,775
2012 Financial Year (9 months) Ordinary shares Number of shares Issue price AUD
1 July 2011 Opening balance 345,372,464 28,433,0683 August 2011 Share Based Payment to Consultants 1,960,075 0.0670$ 131,3259 August 2011
Collateral Shares in respect of SpringTree Share Purchase Agreement 3,697,997 0.0649$ 240,000
10 October 2011 SpringTree Share Purchase Agreement 1,428,572 0.0700$ 100,00015 November 2011 Capital Placement 37,460,101 0.0476$ 1,784,32218 November 2011 Conversion of Convertible Loan 53,472,219 0.0675$ 3,608,73923 February 2012 Shares issued to Canaccord 2,434,091 0.1100$ 267,750
Cost of Placement (526,404)31 March 2012 Closing balance 445,825,519 34,038,800
The following table provides details of Solimar’s Unlisted Options and Warrants as at March 31, 2012.
Quantity Exercise Price Expiry Date Type 5,000,000 15,125,000 3,000,000 18,900,000 3,200,000 1,500,000 9,000,000 41,332,874 14,000,000
9.35 cents 12.75 cents 7.88 cents 18 cents
12.75 cents 12.75 cents
14.4 cents (CAD) 14.4 cents (CAD) 15.0 cents (CAD)
1 June 2012 1 June 2012
28 February 2015 1 July 2014 1 July 2014 1 June 2013
5 October 2014 5 October 2014
10 February 2014
Option Option Option Option Option Option Option
Warrant Warrant
Note: the Options/Warrants convert on a 1:1 basis
OFF-BALANCE SHEET ARRANGEMENTS
The Company has not entered into any off-balance sheet arrangements.
For
per
sona
l use
onl
y

19
TRANSACTIONS BETWEEN RELATED PARTIES
During the nine (9) months ended March 31, 2012, the Company paid accounting, consulting and corporate secretarial services and office costs of A$305,430 (2011: A$162,189) to MDB, an accounting practice in which the Chairman of Solimar, Frank Petruzzelli, is a principal.
Arrangements with related parties remain in place. For details on these arrangements refer to the 30 June 2011 annual financial report.
CRITICAL ACCOUNTING ESTIMATES
Significant accounting judgements
In the process of applying the Company’s accounting policies, management has made the following judgements, apart from those involving estimations, which have the most significant effect on the amounts recognised in the financial statements:
Capitalised exploration and development costs
Exploration costs are only capitalised when it can be demonstrated that the Company has rights to an area of interest and the expenditures are either expected to be recouped with future development of the project or a determination cannot yet be made until further work is undertaken.
Development costs are only capitalised when it can be demonstrated that the technical feasibility of recovering the hydrocarbons is valid and that the asset will be available for use or sale.
As at March 31, 2012, the Company had capitalized exploration, evaluation and development expenditure of A$8,095,753, an increase of A$3,430,118 (73.5%) on the balance sheet at the close of the previous financial year (A$4,665,635). The balance of capitalized exploration and development expenditure represented the fair value of the various projects that Solimar holds an interest in. The increase in the balance was the result of increases in value through capitalized expenditure on the Paloma Deep well, the Tejon Footwall Project and the Zodiac Project.
Impairment of capitalised exploration and development costs
The future recoverability of capitalised exploration and development costs is dependent on a number of factors. These include the likelihood that the Company will pursue exploration at a particular project, the estimated level of resources, future technological changes which could impact on the cost of exploration and development, commodity price changes and legal and environmental changes.
To the extent that capitalised exploration and development costs are determined not to be recoverable in the future, net assets will be reduced in the period in which this determination is made, and written- off to profit or loss.
Exploration and development costs are reviewed for impairment if there is any indication that the carrying amount may not be recoverable. Where a review for impairment is conducted, the recoverable amount is assessed by reference to the higher of ‘value in use’ (being the net present value of expected future cash flows of the relevant cash generating unit) and ‘fair value less costs to sell’.
In determining value in use, future cash flows are based on:
• estimates of the quantities of reserves for which there is a high degree of confidence of economic extraction;
• future production levels; • future commodity prices; and • future costs of production and capital expenditure. The total impairment charge incurred an all capitalized assets for the nine (9) months ended March 31, 2012 was A$365,120 (net of the impairment losses reversed), compared to A$304,029 for the nine (9) months ended March 31, 2011. The majority of the impairment charge related to a write down in the value of the Guijarral Hills Project.
For
per
sona
l use
onl
y
20
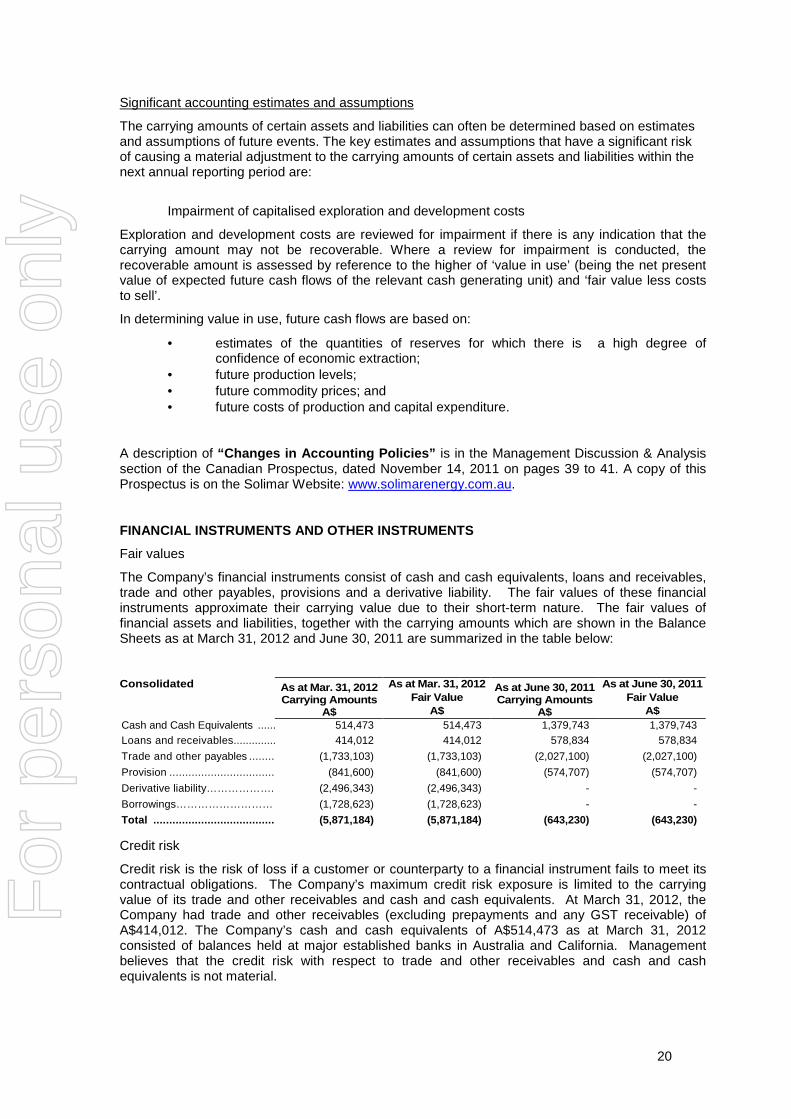
Significant accounting estimates and assumptions
The carrying amounts of certain assets and liabilities can often be determined based on estimates and assumptions of future events. The key estimates and assumptions that have a significant risk of causing a material adjustment to the carrying amounts of certain assets and liabilities within the next annual reporting period are:
Impairment of capitalised exploration and development costs
Exploration and development costs are reviewed for impairment if there is any indication that the carrying amount may not be recoverable. Where a review for impairment is conducted, the recoverable amount is assessed by reference to the higher of ‘value in use’ (being the net present value of expected future cash flows of the relevant cash generating unit) and ‘fair value less costs to sell’.
In determining value in use, future cash flows are based on:
• estimates of the quantities of reserves for which there is a high degree of confidence of economic extraction;
• future production levels; • future commodity prices; and • future costs of production and capital expenditure.
A description of “Changes in Accounting Policies” is in the Management Discussion & Analysis section of the Canadian Prospectus, dated November 14, 2011 on pages 39 to 41. A copy of this Prospectus is on the Solimar Website: www.solimarenergy.com.au.
FINANCIAL INSTRUMENTS AND OTHER INSTRUMENTS
Fair values
The Company’s financial instruments consist of cash and cash equivalents, loans and receivables, trade and other payables, provisions and a derivative liability. The fair values of these financial instruments approximate their carrying value due to their short-term nature. The fair values of financial assets and liabilities, together with the carrying amounts which are shown in the Balance Sheets as at March 31, 2012 and June 30, 2011 are summarized in the table below:
Consolidated As at Mar. 31, 2012 Carrying Amounts
A$
As at Mar. 31, 2012 Fair Value
A$
As at June 30, 2011 Carrying Amounts
A$
As at June 30, 2011 Fair Value
A$ Cash and Cash Equivalents ................................514,473 514,473 1,379,743 1,379,743 Loans and receivables................................ 414,012 414,012 578,834 578,834
Trade and other payables ................................(1,733,103) (1,733,103) (2,027,100) (2,027,100)
Provision ................................................................(841,600) (841,600) (574,707) (574,707)
Derivative liability………………. (2,496,343) (2,496,343) - -
Borrowings……………………… (1,728,623) (1,728,623) - -
Total ................................................................(5,871,184) (5,871,184) (643,230) (643,230)
Credit risk
Credit risk is the risk of loss if a customer or counterparty to a financial instrument fails to meet its contractual obligations. The Company’s maximum credit risk exposure is limited to the carrying value of its trade and other receivables and cash and cash equivalents. At March 31, 2012, the Company had trade and other receivables (excluding prepayments and any GST receivable) of A$414,012. The Company’s cash and cash equivalents of A$514,473 as at March 31, 2012 consisted of balances held at major established banks in Australia and California. Management believes that the credit risk with respect to trade and other receivables and cash and cash equivalents is not material.
For
per
sona
l use
onl
y

21
Commodity price risk
The Company’s operations are expected to eventually result in exposure to fluctuations in prices of commodities including oil, natural gas and natural gas liquids. At this time, the Company does not have any significant production and, therefore, there is no need for the Company to engage in commodity price risk management. However, management continuously monitors commodity prices and will utilize instruments to manage exposure to these risks if and when it deems necessary.
Interest rate risk
The Company is exposed to interest rate risk through the interest it is required to pay quarterly in arrears on its convertible debenture and the interest income it can earn on its surplus cash holdings. The Company manages its exposure to this interest rate risk through having secured a fixed rate of interest on the convertible debenture and the option of making quarterly interest payments either in cash or by issuing shares. The Company also manages surplus funds by maintaining an account within the bank where funds not immediately required can be placed to generate interest and if appropriate place any available funds into longer term deposit accounts to secure higher rates of interest.
Currency risk
The Company is exposed to the financial risk related to the fluctuation of foreign exchange rates. The Company operates in the United States and a growing portion of its expenses is incurred in U.S. dollars. The Company does not hedge its exposure to fluctuations in the exchange rate. Changes in exchange rates could have a material effect on the Company’s business including its intended capital plans, its financial condition and results of operations.
Certain of the Company’s financial instruments are exposed to fluctuations in the U.S. dollar, including cash and cash equivalents, loans and receivables, and trade and other payables. The Company also has an exposure to the Canadian dollar with the derivative liability it has recognised representing its exposure to warrants and the convertible debenture that is denominated in Canadian dollars.
Liquidity risk
The Company has contractual maturities of financial liabilities, including estimated interest payments and it excludes the impact of netting agreements, as summarized in the table below:
Consolidated Carrying Amount
A$
Contractual Cashflows
A$
6 months or less A$
6 months A$
12+ months A$
Non-derivative financial liabilities
Trade and other payables - Mar 31, 2012 1,733,103 1,733,103 1,733,103 - - Borrowings – Mar 31, 2012 1,728,623 3,207,644 172,301 134,333 2,901,010 Trade and other payables - Dec 31, 2011 3,071,792 3,071,792 3,071,792 - - Trade and other payables - June 30, 2011 2,027,100 2,027,100 2,027,100 - - Trade and other payables - June 30, 2010 807,696 807,696 807,696 - - Trade and other payables - June 30, 2009 88,324 88,324 88,324 - -
BUSINESS RISKS AND UNCERTAINTIES
Solimar is exposed to a variety of risks including, but not limited to, operational, financial, competitive, political and environmental risks. As a participant in the oil and natural gas industry, Solimar is exposed to operational risks such as: unsuccessful exploration and exploitation activities; uncertainty of cost estimates, for example in drilling and development activities; the inability to find new reserves that are commercially and economically feasible; uncertainty of cost estimates, for example in drilling and development activities; premature declines of reservoirs; blow-outs and other operating hazards; reliance on operators and drilling contractors; and lack of infrastructure or transportation to access markets and monetize reserves. The Company works to mitigate these risks by employing highly skilled personnel and utilizing available technology. The Company also maintains a corporate insurance program consistent with industry practices to protect against insurable losses.
For
per
sona
l use
onl
y

22
The Company is exposed to normal financial risks inherent in the oil and natural gas industry including: commodity price risk; exchange rate risk; interest rate risk; credit risk; and uncertainty of cost estimates, for example in drilling and development activities. Solimar is also subject to the volatility of Global Financial Markets and the risk adversity of investors, banks and brokers under these conditions. From time to time, the Company may have to raise additional funds to finance business development activities. However, depending on market conditions at the time, there can be no assurance that the Company will be able to arrange debt or equity financing on satisfactory terms. The oil and natural gas industry is intensely competitive, with Solimar competing against companies that may have greater technical and financial resources. There is competition for new exploration and development properties, for drilling and other specialized technical equipment and for experienced key human resources. To the extent possible, Solimar seeks to enter into joint venture arrangements with large and/or experienced industry players in each country to improve its access to resources. The oil and natural gas industry is also subject to extensive and varying environmental regulations imposed by State of California and the US Government. The Company adopts prudent and industry-recommended field operating procedures in all of its operations, as well as maintaining a health, safety and environment program. A more detailed description of “Risk Factors” is in the Canadian Prospectus on pages 69 to 77, a copy of which is on the Solimar Website: www.solimarenergy.com.au.
For
per
sona
l use
onl
y

23
CORPORATE DIRECTORY
Directors Mr Frank Petruzzelli – Chairman Mr John Begg – Chief Executive & Director Mr Mark Elliott – Non Executive Director Dr Charle Gamba – Non Executive Director Mr Jason Bednar – Non Executive Director
Officers and Senior Executives Mr Will Satterfield – Chief Operating Officer Mr Chris Bowyer – Chief Financial Officer and Company Secretary
Registered Address and Business Address Solimar Energy Limited (ABN 42 112 256 649) 566 Elizabeth Street Melbourne, Victoria 3000 AUSTRALIA Phone: (03) 9347 2409 Fax: (03) 9349 1186
Accountants MDB 566 Elizabeth Street Melbourne, Victoria 3000 AUSTRALIA Phone: (03) 9349 1488 Fax: (03) 9349 1186
US Business Address Solimar Energy LLC 121 N. Fir Street; Suite H Ventura, California 93001 USA Phone: +1 (805) 643 4100 Fax: +1 (805) 643 4105 Auditors BDO Audit (NSW-Vic) Pty Ltd 525 Collins Street Melbourne, Victoria 3000 AUSTRALIA Phone: (03) 8320 2222 Fax: (03) 8320 2200
Lawyers Clayton Utz QV1 250 St Georges Terrace Perth, Western Australia 6000 AUSTRALIA Phone: (08) 9426 8000 Fax: (08) 9481 3095 Davis LLP Livingston Place 1000-250 2nd Street SW Calgary, AB, T2P 0C1 CANADA Phone: +1 (403) 296 4470 Fax: +1 (403) 296 4474
Investor Enquiries Phone: (03) 9347 2409 Email: [email protected] Website : www.solimarenergy.com.au
Stock Exchanges (ASX Code: SGY) Australian Securities Exchange Exchange Plaza, 2 The Esplanade Perth, Western Australia 6000 AUSTRALIA (TSXV Code: SXS) Toronto Venture Exchange 300 - 5th Avenue SW 10th Floor Calgary, AB T2P 3C4 CANADA
Lead Share Registry (Australia) Advanced Share Registry Services 150 Stirling Highway Nedlands WA 6009 AUSTRALIA Phone: (08) 9389 8033 Fax: (08) 9389 7871
Share Registry (Canada) Computershare 3rd Floor, 510 Burrard Street Vancouver, B.C. V6C 3B9 CANADA Phone: +1 604 661 9400 Fax: +1 604 661 9549
For
per
sona
l use
onl
y