
Solidification/Stabilization of Soft River Sediments Using ... of Soft River Sediments Using Deep...
44
Solidification/Stabilization of Soft River Sediments Using Deep Soil Mixing FINAL REPORT October 2005 Submitted by NJDOT Research Project Manager Mr. Scott Douglas Dr. Ali Maher Professor and Director In cooperation with State of New Jersey Department of Transportation Office of Maritime Resources And U.S. Department of Transportation Federal Highway Administration Center for Advanced Infrastructure & Transportation (CAIT) Civil & Environmental Engineering Department Rutgers, the State University of New Jersey Piscataway, NJ 08854-8014 FHWA-NJ-2005-028 Dr. Husam Najm Assistant Professor Dr. Maria Boile Assistant Professor
Transcript of Solidification/Stabilization of Soft River Sediments Using ... of Soft River Sediments Using Deep...

Solidification/Stabilization of Soft River Sediments Using Deep Soil Mixing
FINAL REPORT October 2005
Submitted by
NJDOT Research Project Manager Mr. Scott Douglas
Dr. Ali Maher Professor and Director
In cooperation with
State of New Jersey Department of Transportation Office of Maritime Resources
And U.S. Department of Transportation
Federal Highway Administration
Center for Advanced Infrastructure & Transportation (CAIT) Civil & Environmental Engineering Department
Rutgers, the State University of New Jersey Piscataway, NJ 08854-8014
FHWA-NJ-2005-028
Dr. Husam Najm Assistant Professor
Dr. Maria Boile Assistant Professor

Disclaimer Statement
"The contents of this report reflect the views of the author(s) who is (are) responsible for the facts and the accuracy of the data presented herein. The contents do
not necessarily reflect the official views or policies of the New Jersey Department of Transportation or the Federal Highway Administration. This report does not constitute
a standard, specification, or regulation."
The contents of this report reflect the views of the authors, who are responsible for the facts and the accuracy of the
information presented herein. This document is disseminated under the sponsorship of the New Jersey Department of Transportation,
in the interest of information exchange. The U.S. Government assumes no
liability for the contents or use thereof.

1. Report No. 2. Government Accession No.
TECHNICAL REPORT STANDARD TITLE PAGE
3. Rec ip ien t ’s Ca ta log No .
5 . Repor t Date
8. Performing Organization Report No.
6. Performing Organizat ion Code
4 . Ti t le and Subti t le
7 . Author(s)
9. Performing Organization Name and Address 10. Work Unit No.
11. Contract or Grant No.
13. Type of Report and Period Covered
14. Sponsoring Agency Code
12. Sponsoring Agency Name and Address
15. Supplementary Notes
16. Abstract
17. Key Words
19. Security Classif (of this report)
Form DOT F 1700.7 (8-69)
20. Security Classif. (of this page)
18. Distribution Statement
21. No of Pages 22. Price
October 2005
CAIT/Rutgers
Final Report 09/1/2004 - 10/20/2005
FHWA-NJ-2005-028
State of New Jersey Department of Transportation PO Box 607 Trenton, NJ 08625-0607
Federal Highway Administration U.S. Department of Transportation Washington, D.C.
The objective of the demonstration project was to investigate the feasibility of using in-situ solidification/stabilization technology to treat highly contaminated sediments similar to those found in NY/NJ Harbor and surrounding waterbodies. The study evaluated a technique that amends sediment, in situ, with a pozzolanic mixture, such as Portland cement. Mixing of sediments with pozzolanic materials has been used successfully throughout the NY/NJ Harbor to stabilize low-to-moderately-contaminated sediment dredged from navigation channels. Rutgers University was retained by the NJDOT to assess the utility and viability of using Cement Deep Soil Mixing technology (CDSM) for the in-situ solidification/stabilization of contaminated river sediment and toevaluate: 1) the efficacy of the technology to stabilize sediments and associated contaminants; 2) the optimum percentage of pozzolanic additive; 3) the potential for dispersion of sediments during treatment; and 4) the impact that highly organic enrichment might have on the pozzolanic treatment. The pilot study demonstrated that significant improvement in the shear strength of the mixed sediments was measured following stabilization. Also a reduction of 40% in moisture content was measured within the solidified sediments. As a result, the treated sediments could be handled, transported and disposed of in a more environmentally sound manner. This is of great importance for toxic sediments. Turbidity was measured during the mixing operation and was found to be only within 120 feet of the mixing location.
Dredged Sediments, Cement Deep Soil Mixing, Turbidity
Unclassified Unclassified
44
FHWA-NJ-2005-028
Dr. Ali Maher, Dr. Husam Najm, and Dr. Maria Boile
Solidification/Stabilization of Soft River Sediments Using Deep Soil Mixing
1
Executive Summary
The NY/NJ Harbor and many of the surrounding waterways have been highly industrialized and commercialized for decades. As a result, the water quality in the area has long been degraded, the sediments contaminated, and many of the wetland areas have been completely destroyed or significantly reduced. Removal of toxic sediments by dredging is one way to remediate environmentally impacted areas, and has been suggested by some as a potential step toward remediation of the most contaminated parts of the NY/NJ Harbor and surrounding waterways. Dredging could result in restoration of navigational, commercial and recreational uses in impacted and underutilized areas. One difficulty associated with dredging, however, is the potential for dispersion of sediments, and their associated contaminants, into the surrounding media. This is especially true for fine grained sediments, because re-suspension is more likely to occur in fine grained sediments with high liquid contents for any given style of dredging equipment and technique. Unfortunately, fine grained sediments also tend to be those most likely to retain contaminants of concern such as dioxins/furans, PCBs, pesticides, organomercury and other semi-volatile toxins and metals. In fact, the dredging of some navigation channels and berths in hot spots like the lower Passaic River, Gowanus Canal, Newtown Creek and upper Newark Bay has not been performed in decades because of a combination of factors including the high dispersion potential, high levels of contamination and limited disposal/management opportunities.
One means of mitigating the potential for sediment dispersion during dredging and related activities would be to alter the characteristics of the sediment, specifically the high liquid content and the presence of fine-grained matrices. For example, the sediments could be amended with a pozzolanic mixture, such as Portland cement or other additives. Specifically, in-situ solidification/stabilization of contaminated sediments could be achieved using Cement Deep Soil Mixing (CDSM) technology. In deep soil mixing, powerful augers are used to mix slurry of pozzolanic additives into a soil or sediment in-situ, thereby stabilizing it for construction purposes. It is also possible that a similar technique could be used to stabilize contaminated river sediment. If successful, stabilization might have the benefit of reducing dispersion potential, as well as improving the handling characteristics of the sediment for transportation and placement or treatment. Even if the sediments were never removed, the benefit of increased cohesion could reduce the potential for sediment (and associated contaminant) loss during storm events.
The New Jersey Department of Transportation, Office of Maritime Resources (NJDOT/OMR) sponsored a demonstration project to investigate the feasibility of using

2
CDSM in-situ solidification/stabilization technology to treat highly contaminated sediments similar to those found in NY/NJ Harbor and surrounding waterbodies. The Center for Advanced Infrastructure and Transportation at Rutgers University conducted the study in cooperation with Raito Inc., ICON Engineering Inc., and Iowa State University. The study area was located at the Darling International Site waterfront area in Newark Bay, near the mouth of the Passaic River. The study involved preparing sediment mixes with varying percentages of cement, followed by an evaluation of the engineering properties in situ, and the ability to dredge the amended sediments with conventional equipment. Specifically, three cells with approximate dimensions of 18 feet long by 14 feet wide and 10 feet deep were mixed with three different dosages of cement slurry. Subsurface investigations, in-situ testing and laboratory testing were conducted on the cells before and after CDSM to evaluate the changes in the engineering properties of the sediments. In addition, Total Suspended Solids (TSS) were measured prior to, during and after the CDSM was conducted. Upon completion of the study, the solidified sediments were dredged using conventional digging buckets and disposed of at a permitted upland facility. The in-situ strength tests indicated that the shear strength of the cemented sediments significantly increased as a result of CDSM. The watery very soft silt sediments were transformed into cemented soil with the consistency of hard silt/clay. The Standard Penetration Test N-values increased from weight of rod to values in excess of 40. In addition, the moisture content of the sediment was significantly reduced after CDSM treatment, which enhanced the workability of the material. Laboratory shear strength tests indicated that significant strength gain was achieved, indicating an increase in the workability and improvement in handling characteristics. Moreover, the strength gain was seen to stay within a manageable range for a period of six months, an important characteristic because excessive strength gain might complicate removal of the amended sediment. Various studies show that long term strength of cemented soils in average does not exceed 3 times the 28-day strength. Therefore, the long term strength of cemented sediments will remain within manageable ranges allowing dredging with conventional equipment. Cement content of the mix could also be adjusted to control the long term strength gain. The potential for CDSM to impact water quality was evaluated during the pilot test. Total

3
Suspended Solids (TSS) was measured prior to, during and subsequent to the sediment mixing at high and low tides. The results indicate that noticeable increases in TSS (reaching a maximum of 450 ppm) over background in the vicinity of the equipment (in a radius of 75 feet and at a depth of at least 15 feet below the water surface) were detected. However, this phenomenon was highly localized, with increased solids observed only slightly over background at a radius of 75-125 feet and depths greater than 25 feet. Samples taken at 125 feet or more from the equipment were no longer distinguishable from background, irrespective of depth. Chemical analysis of this cone of suspended material was beyond the scope of this study. Also studied were the benefits of cement Stabilization/Solidification in immobilizing organic and inorganic contaminants within the sediment matrix, as well as the potential impact of highly organic matrices on the stabilizing properties of Portland cement. The results of these laboratory studies indicated that cement stabilization/solidification results in the chemical fixation of PCBs, PAHs and Dioxins. The presence of concentrated organic material generally impedes the soil cement reaction by coating the cement particles thereby preventing free combination of soil and cement particles. This phenomenon can be overcome through higher doses of cement. Therefore, prior to the implementation of CDSM, the organic content of the sediments should be quantified, and the cement dosage adjusted accordingly. In summary, the following conclusions can be made from the results of this study:
1. CDSM technology has potential for effectively stabilizing contaminated sediments, resulting in increased workability and improved material handling characteristics.
2. Sediments stabilized by CDSM can remain in place indefinitely without
impeding removal. Since long term strength in average is expected to be three times or less the 28-day strength, cement stabilization would not impede dredging. Stabilized sediments could also be allowed to remain in place and properly capped.
3. CDSM has the ability to immobilize the organic and inorganic
contaminants within the soil matrix, but the stabilization effectiveness is reduced at high organic contents unless cement dosage is increased.

4
Before recommending the CDSM technology for full-scale implementation, several practical issues need to be addressed in a more comprehensive pilot study or phase II study. These are listed in the Conclusions/Recommendations Section of this report.

5
Table of Contents
1.0 PROJECT BACKGROUND.......................................................................................... 7 2.0 CDSM STUDY OBJECTIVE ...................................................................................... 8 3.0 PROJECT TASKS ..................................................................................................... 8
3.1 Site Investigation ................................................................................................ 9 3.2 Bench Scale Laboratory Testing.................................................................... 11 3.3 Field Operations.............................................................................................. 12
3.3.1 Field CDSM Operations ......................................................................... 12 3.4 In-Situ Strength Testing of Solidified Sediments .......................................... 15
4.0 DISCUSSION OF THE RESULTS ............................................................................... 19 4.1 Laboratory Testing .......................................................................................... 19
4.1.1 Moisture Content ..................................................................................... 20 4.1.2 Index Properties ....................................................................................... 20 4.1.3 Shear Strength.......................................................................................... 21
5.0 TOTAL SUSPENDED SOLIDS MONITORING............................................................ 24 5.1 Methodology ..................................................................................................... 25 5.2 Background Sampling ..................................................................................... 25 5.3 Sampling during CDSM Operations .............................................................. 26 5.4 Data Evaluation and Results ........................................................................... 26
5.4.1 TSS & Turbidity Measurements ............................................................ 26 5.4.2 pH Measurements .................................................................................... 27 5.4.3 Parameter Evaluation.............................................................................. 28
5.5 Conclusions ....................................................................................................... 30 6.0 ADDITIONAL STUDIES............................................................................................ 31
6.1 Effect of Organic Content on Soil-Cement Hydration and Strength Gain 31 6.1.1 Unconfined Compressive Strength Results............................................ 32 6.1.2 SEM Image Results ................................................................................. 33 6.1.3 X-Ray Map Results ................................................................................. 33
6.2 Solidification/Stabilization of Contaminated Sediments using Cement...... 33 6.2.1 Chemical Fixation and Solidification ..................................................... 33 6.2.2 PCBs .......................................................................................................... 34 6.2.3 Dioxins....................................................................................................... 35 6.2.4 Polyaromatic Hydrocarbons, PAH......................................................... 36 6.2.5 Summary................................................................................................... 36
7.0 DREDGING/DISPOSAL OF THE SOLIDIFIED SEDIMENTS........................................ 37 8.0 CONCLUSIONS........................................................................................................ 38 9.0 PHASE II STUDY .................................................................................................... 39 REFERENCES...................................................................................................................... 41
6
List of Appendices
Appendix A. Field Testing Results * Appendix B. Laboratory Testing Results * Appendix C. Construction Photos * Appendix D. Effect of Organic Content on Soil-Cement Hydration and Strength * Appendix E. Cone Penetration Test Description * Appendix F. Raito’s CDSM Report * Appendix G. Total Suspended Solids Monitoring Study (by Icon Engineering) * Appendix H. Description of CDSM Technology * *Appendices available in digital format via CD-ROM
List of Figures
Figure 1. CDSM Pilot Study Location Map Figure 2. Unconfined Compressive Strength of Cemented Sediments Figure 3. CDSM Mixing Rig Figure 4. Dimensions of the Mixing Tool Figure 5. Dimensions of the Solidified Cells Figure 6. Strength vs. Different Cement Contents Figure 7. Cement Curing Effects on Strength of Solidified Sediments Figure 8. Influence of Cement Type on Unconfined Compressive Strength Figure 9 Strength Increase with Curing Time Figure 10. Correlation between TSS and Turbidity Figure 11. Turbidity vs. Depth prior to CDSM Operation Figure 12. Turbidity vs. pH during CDSM Operation Figure 13. TSS vs. Depth during CDSM Operations Figure 14. TSS Concentration vs. Distance from CDSM Operation
List of Tables
Table 1. Consistency of Saturated Cohesive Soils Correlations with SPT Table 2. Moisture Content of Raw and Cemented Sediments Table 3. Plasticity Index of Cemented Silt Sediments Table 4. Shear Strength of Cemented Silt Sediments

7
1.0 PROJECT BACKGROUND Recently, much attention has been paid to the quality of sediments in the NY/NJ Harbor and surrounding waterbodies. The NY/NJ Harbor sediments have been shown to be contaminated with a number of contaminants, including dioxin/furans, DDT, PCBs, pesticides, mercury and heavy metals. The contamination is widespread, but is also concentrated in several "hot spots,” that are usually centered near areas of ongoing or historical industrial activity. Because this part of the estuary is highly dynamic, there is some concern regarding the potential release of these contaminated sediments during storm events, or during dredging activities. If the sediments are disturbed during storm events or dredging operations, sediments and sediment-bound contaminants could be dispersed. The potential for sediment release is exacerbated by high liquid content and fine grained matrices. Techniques designed to alter these characteristics could potentially limit contaminant dispersion. This study evaluated a technique that amends sediment, in situ, with a pozzolanic mixture, such as Portland cement, lime-kiln dust or fly ash. This technology has been used successfully throughout the NY/NJ Harbor to stabilize low-to-moderately-contaminated sediment dredged from navigation channels. Once the sediment is amended, it is transported easily and used as fill and capping material (Douglas et al, 2003). Currently, sediments are dredged prior to mixing with the pozzolanic amending agents. This is not a cause for concern in cases where the sediment is minimally contaminated; however, the concern is increased when sediments are highly contaminated. Not only is there a greater concern when dredging highly contaminated sediments, but transportation and handling procedures used during the amending process has been shown to result in a release of volatile and semi-volatile contaminants (Miskewicz, 2005). An alternative to the conventional approach would be to use Cement Deep Soil Mixing (CDSM) technology. In deep soil mixing, augers are used to mix slurry of pozzolanic additives into the sediment thereby stabilizing it in-situ. Once stabilized, the material could then be excavated for further treatment or disposal, or it could be capped and allowed to remain in place. To this end, Rutgers University was retained to assess the utility and viability of using CDSM for the in-situ solidification/stabilization of contaminated river sediment. The objectives of the study were: 1) to determine the efficacy of the technology to stabilize sediments and associated contaminants; 2) to determine the optimum percentage of pozzolanic additive; 3) to determine the potential for dispersion of sediments during

8
treatment; and 4) to determine the impact that highly organic enrichment might have on the pozzolanic treatment. 2.0 CDSM STUDY OBJECTIVE The CDSM study involved the solidification of approximately 300 cubic yards of river sediments at the berthing facility of Darling International, located in Newark Bay, near the mouth of the Passaic River. As stated, the primary objective of the study was to evaluate the utility and viability of using CDSM for the in-situ solidification/stabilization of contaminated river sediments. Specifically, the study focused on determining the following:
1. The most feasible mix of the pozzolanic slurry required to provide rapid stabilization of the sediment matrix while still remaining workable enough to allow for extraction using conventional equipment;
2. The effects of high levels of organic contamination on the stabilization treatment;
3. Specific operational parameters for using CDSM in sediments similar to those found in contaminated sediment hot spots in NY/NJ Harbor;
4. The extent, if any, to which sediments are re-suspended during the application of the stabilization treatment;
5. How CDSM and various slurry mixtures effect the engineering properties of the sediment in situ; and
6. The feasibility of using conventional extraction methods once the sediments have been stabilized and allowed to cure.
3.0 PROJECT TASKS To address these issues, a pilot test using CDSM was conducted on sediments in Newark Bay, adjacent to the waterfront facilities of Darling International in Newark, NJ. In the fall of 2004, three separate rectangular areas were stabilized using CDSM equipment. Three different laboratory-designed mixtures were used, one for each test area. While curing, the amended sediments were tested for strength gain. After testing, the sediments were removed using conventional dredging equipment, and the stabilized sediments were placed at a permitted dredged material management site in north eastern New Jersey. The individual project tasks are discussed more fully in the following sections.

9
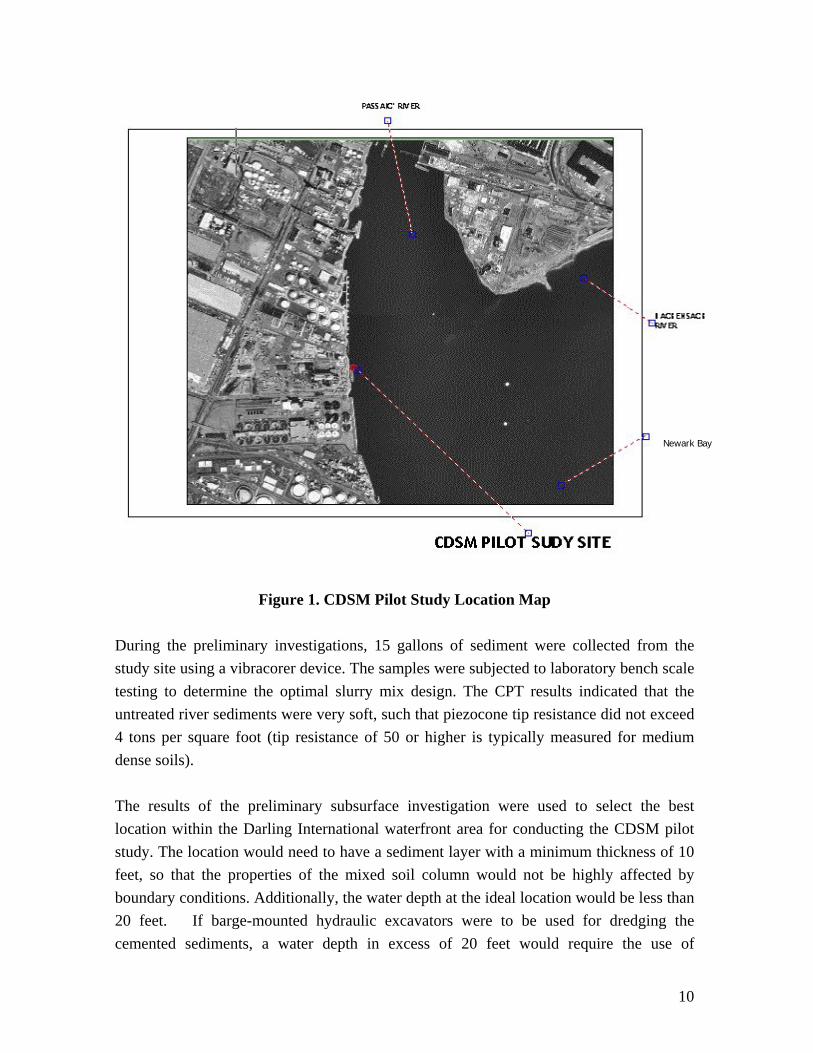
3.1 Site Investigation For the study to be effective, it was necessary to select a test site with sediments physically similar to those found in sites known to be highly contaminated; specifically, sediments composed primarily of silt. It was decided not to use highly contaminated sediments directly due to the experimental nature of the project. As a result, the Darling International facility at the mouth of the Passaic River was selected. This site offered sediments that were physically similar to those found in highly contaminated areas, but with considerably less contamination. This meant that the results of the pilot study would be directly applicable, and that the study could be conducted without the risks associated with treating highly contaminated sediments. The location of the study site is shown in Figure 1. In June of 2004, exploratory soil borings were advanced by others using a barge-mounted drilling rig. The purpose of the borings was to determine the physical and chemical characterization of the sediments at the study site. The testing had been initiated by the site owner in order to identify disposal options for the sediments once dredged. Additional preliminary investigations using a barge-mounted cone penetrometer were conducted on August 31, 2004 to evaluate the pretreatment strength of the sediments. Cone Penetration Testing (CPT) is a process whereby subsurface soil characteristics are determined when a cone penetrometer, attached to a data acquisition system, is advanced into the subsurface using a hydraulic ram. A detailed description of this method is presented in Appendix E.
10
Figure 1. CDSM Pilot Study Location Map
During the preliminary investigations, 15 gallons of sediment were collected from the study site using a vibracorer device. The samples were subjected to laboratory bench scale testing to determine the optimal slurry mix design. The CPT results indicated that the untreated river sediments were very soft, such that piezocone tip resistance did not exceed 4 tons per square foot (tip resistance of 50 or higher is typically measured for medium dense soils). The results of the preliminary subsurface investigation were used to select the best location within the Darling International waterfront area for conducting the CDSM pilot study. The location would need to have a sediment layer with a minimum thickness of 10 feet, so that the properties of the mixed soil column would not be highly affected by boundary conditions. Additionally, the water depth at the ideal location would be less than 20 feet. If barge-mounted hydraulic excavators were to be used for dredging the cemented sediments, a water depth in excess of 20 feet would require the use of
Newark Bay

11
unconventionally large excavators, thereby making the dredging operations very costly. On the basis of these criteria, an area containing approximately 10 feet of soft silt sediments, which was underlain by a dense granular layer with an average depth of 20 feet, was selected for the CDSM pilot study. 3.2 Bench Scale Laboratory Testing As stated previously, 15 sediment samples were collected from the study site and subjected to laboratory bench scale testing to determine the optimal slurry mix for stabilization. Samples were collected on August 31, 2004 by Warren George, Inc., and shipped to American Analytical Laboratories in Farmingdale, New York for analysis. The bench scale tests included the following: (a) moisture content determination (ASTM D2216), (b) unconfined shear strength (ASTM D2216), (c) organic content determination (ASTM D2974) and, (d) pH (SW9045C). During the laboratory analysis, sediment samples were mixed with four different dosages of Portland cement slurry. Portland cement is typically the preferred additive for solidification, since it is consistent in its chemical and physical properties. These mixes were then tested for shear strength at different curing times including seven, 14, and 28 days. Upon completion of the laboratory testing, three dosages of Portland cement slurry were selected for use in the pilot study such that they would (a) provide strength sufficient to minimize the pulverization and dispersion of sediments; and b) ensure that the strength gain would not be excessive, as this would make dredging the solidified sediments impractical. The results of the laboratory test are presented in Appendix B, and are discussed below. The sediment samples were collected from the middle of the silt layer, approximately five to six feet below the dredge line, to better represent average sediment conditions. The typical moisture content for these untreated samples (defined as the ratio of water weight to solid weight) was, on average, 135%. The organic content and pH ranged from 13% to 14% and from 7.0 to 7.05 respectively. Since the pH of the sediment samples was almost 7.0, no potential adverse effects were anticipated for either cement curing or strength gain. Before determining shear strength, the raw sediments were mixed with various percentages of cement slurry prior to testing. The dosages of Portland cement mixed with the raw sediment samples were as follows: (a) 80 kg/m3 (134 lbs/cyd); (b) 150 kg/m3 (252 lbs/cyd); (c) 220 kg/m3 (369 lbs/cyd); and (d) 300 kg/m3 (504 lbs/cyd). The water to cement ratio was 80% for all the mixes, except for 300 kg/m3 dosage which was 70%. This meant that if 150 kg of dry cement were used, 120 kg of water, or 80%*150, was added to form the slurry.

12
Once the raw sediment samples had been mixed with varying doses of Portland cement and allowed to cure, shear strength testing could take place. Test results indicated that the mixed material developed unconfined compressive strength as high as 172 psi (shear strength of 86 psi) once mixed with 482 lbs of cement and cured for 28 days. However, due to concerns regarding the practicality of dredging such high-strength sediments, the amount of Portland cement was limited to 340 lbs/cyd for the full scale in-situ mixing. The solidified sediments were easily removed in April of 2005 using a two-cubic-yard digging bucket. The results of the shear strength analysis are presented in Figure 2. 3.3 Field Operations 3.3.1 Field CDSM Operations
The in-situ mixing of CDSM began on October 6, and was completed on October 8, of 2004. Raito Inc., a Japanese specialty contractor in CDSM technology, was retained by Rutgers University to perform the mixing. The mixing equipment included a barge-mounted crane and triple augur system. CDSM introduces and mixes cementitious materials into the in situ soils by using hollow-stem rotating shafts equipped with a cutting tool at the tip and mixing paddles above the tip. Generally, CDSM is used to produce a soil-cement panel consisting of three overlapping soil-cement columns. The soil-cement panel is then extended to form walls, grids, or blocks for various ground stabilization purposes (refer to Figure 3). In the present study, however, CDSM was evaluated in terms of its ability to stabilize the contaminated sediments such that they could be dredged easily with a minimum of sediment dispersion. Based on the laboratory bench scale test results, three recipes of Portland cement slurry were selected for mixing the river sediments: (a) 100 kg/m3 (168 lbs/cyds); (b) 150 kg/m3 (252 lbs/cyds); and (c) 200 kg/m3 (335 lbs/cyds) Portland cement and soil mix. For all of the mixes, the cement to water ratio was 80%. Therefore, assuming a unit weight of 90 pounds per cubic foot for the silt sediments, those weights would be equivalent to 7%, 10.5% and 14% cement added to the sediments on a wet-weight basis.

13
Figure 2. Unconfined Compressive Strength of Cemented Sediments at Different
Curing Times Three cells with dimensions of 18.5 feet long, 14 feet wide and 10 feet deep were mixed with cement slurry. The mixing augurs penetrated 10 feet into the silt sediments before they were extracted (Figure 3). Cement slurry was mixed with the sediments during the upward and the downward movement of the augurs. The configuration of each element and the dimensions of the mixing tool are shown in Figure 4.

14
Figure 3. CDSM Augurs
Figure 4. Dimensions of the Mixing Tool
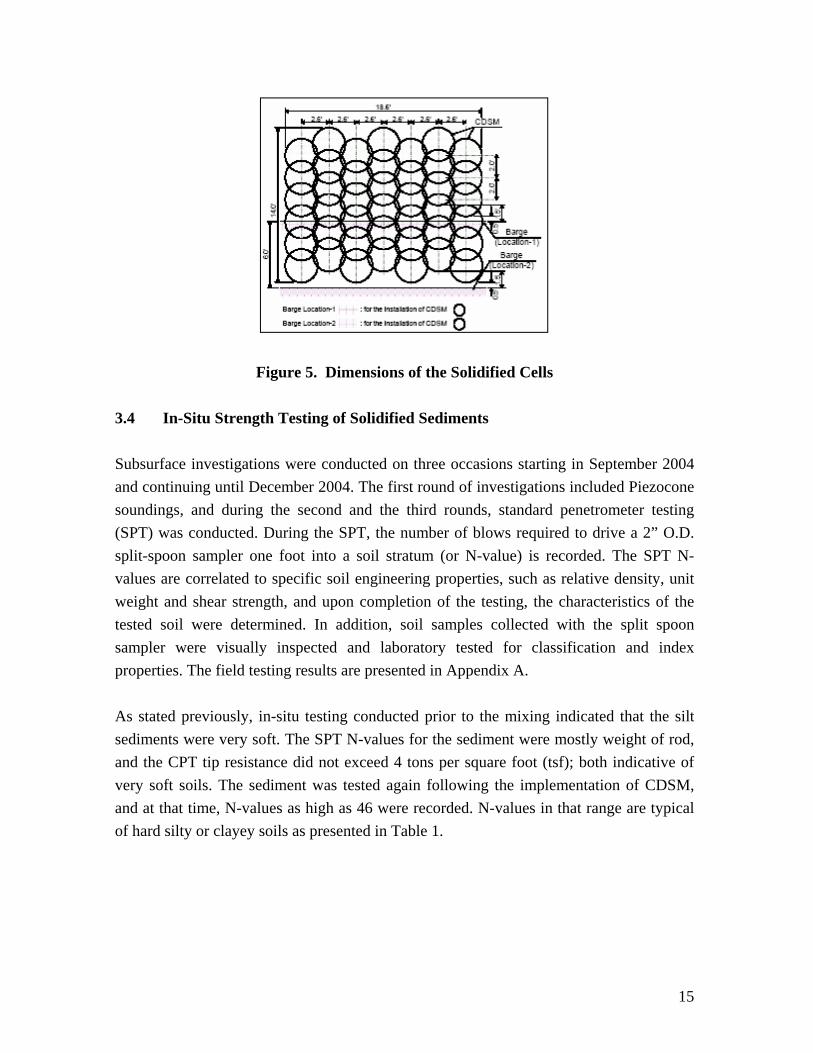
For the solidification of each cell, 14 elements were installed. The layout of each cell is presented in Figure 5. The approximate mixing time for each element to be completed was 10 minutes.
15
Figure 5. Dimensions of the Solidified Cells 3.4 In-Situ Strength Testing of Solidified Sediments
Subsurface investigations were conducted on three occasions starting in September 2004 and continuing until December 2004. The first round of investigations included Piezocone soundings, and during the second and the third rounds, standard penetrometer testing (SPT) was conducted. During the SPT, the number of blows required to drive a 2” O.D. split-spoon sampler one foot into a soil stratum (or N-value) is recorded. The SPT N-values are correlated to specific soil engineering properties, such as relative density, unit weight and shear strength, and upon completion of the testing, the characteristics of the tested soil were determined. In addition, soil samples collected with the split spoon sampler were visually inspected and laboratory tested for classification and index properties. The field testing results are presented in Appendix A. As stated previously, in-situ testing conducted prior to the mixing indicated that the silt sediments were very soft. The SPT N-values for the sediment were mostly weight of rod, and the CPT tip resistance did not exceed 4 tons per square foot (tsf); both indicative of very soft soils. The sediment was tested again following the implementation of CDSM, and at that time, N-values as high as 46 were recorded. N-values in that range are typical of hard silty or clayey soils as presented in Table 1.

16
Consistency N70 Shear Strength
(psf) Remarks
Very Soft 0-2 >250 Squishes between fingers when squeezed
Soft 3-5 250-500 Very easily deformed by squeezing
Medium 6-9 500-1000 --------- Stiff 10-16 1000-2000 Hard to deform by hand squeezing
Very Stiff 17-30 2000-4000 Very hard to deform by hand squeezing Hard >30 > 4000 Nearly impossible to deform by hand
N70 is N value corrected for 70% efficiency
Table 1. Consistency of Saturated Cohesive Soils (J.E. Bowels 1996)
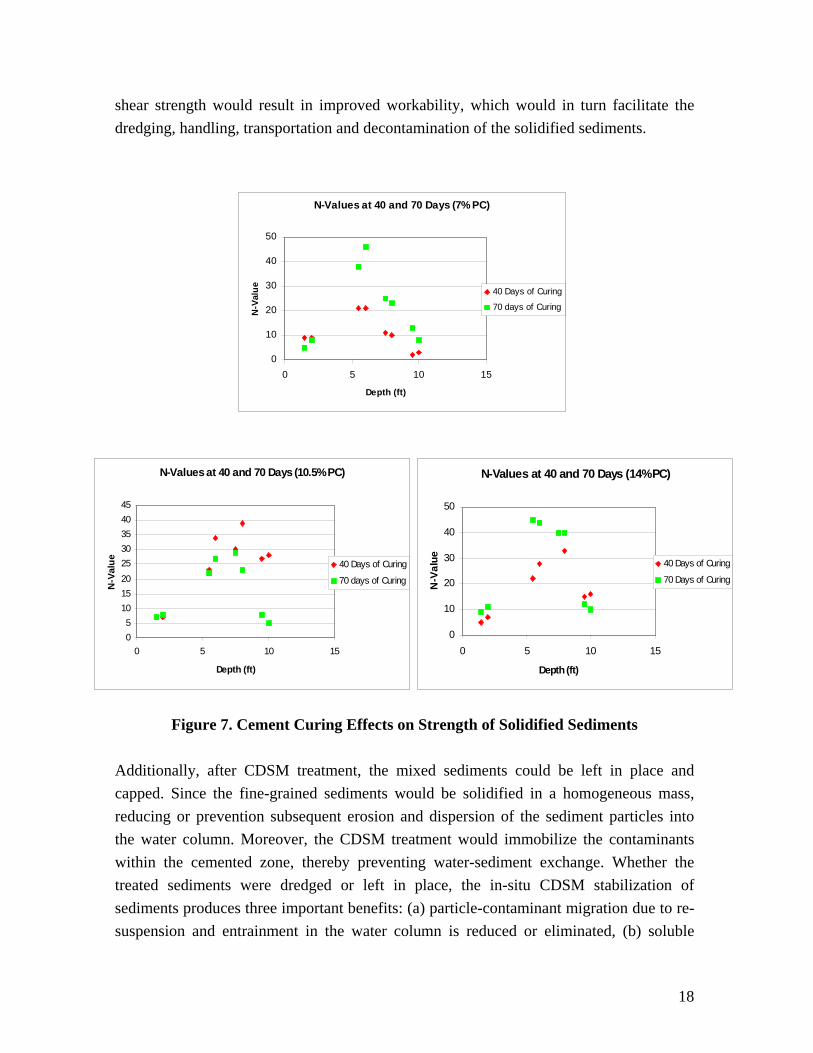
Split spoon samples were taken from the CDSM-treated sediment to a depth of 10 feet, the maximum depth of mixing. The N-values were corrected for depth and plotted for each of the three cells. Additionally, the N-values were recorded at different curing times, and were then plotted with respect to depth. The results are presented in Figures 6 and 7. The gap in the N-value data from two to four feet resulted because Shelby tube samples were collected at that depth within each cell. As shown in Figures 4 and 5, lower N-values were generally recorded within the upper two feet of each cell. This is because the upper two feet consisted primarily of the fluff generated during mixing (lack of confining effect). Similarly, lower N-values were associated with the bottom foot of mixed sediment because the bottom foot was subject to less mixing time, and therefore less additive, than was the rest of the column. For the zones between four and nine feet below the sediment surface N-values as high as 46 were recorded. On average, the N-values for the three cells, which were mixed with 7%, 10.5% and 14% cement, after 40 days of curing, were 16, 32, and 32, respectively.

17
Figure 6. Strength vs. Different Cement Contents After 70 days of curing, the N-values were 33, 25, and 45, respectively. The N-value of 25, which was recorded for the cell with 11% cement after 70 days of curing time, is lower than the N-value of 33, which was recorded for the cell with 7.5% cement. One explanation for this might be that the test location was near the edge of the cell, where the mixing would be somewhat less effective than in the center. In general, three trends were noted in reviewing the field investigation results:
• Mixing silt sediments with cement slurry significantly improves the engineering properties of the sediment. N-values were significantly increased following the addition of cement, having gone from as low as weight of rod to as high as 46 after 70 days of curing time.
• Higher dosages of cement in the mix resulted in higher strength gain in the
solidified sediments. The rate of strength gain decreased as the cement to silt ratio increased.
• Higher strengths were achieved as the solidified sediments were allowed to
cure for longer periods of time. The results of the subsurface investigation indicated that the CDSM technology could be efficiently utilized for solidifying soft river sediments. The significant improvement in
N-values vs. Depth (40 Days of Curing)
05
1015202530354045
0 2 4 6 8 10 12
Depth (ft)
N-V
alue
7% PC
10.5% PC
14% PC
N-Values vs. Depth (70 Days of Curing)
05
101520253035404550
0 5 10 15Depth (ft)
N-V
alue
7% PC
10.5% PC
14% PC
18
shear strength would result in improved workability, which would in turn facilitate the dredging, handling, transportation and decontamination of the solidified sediments.
Figure 7. Cement Curing Effects on Strength of Solidified Sediments
Additionally, after CDSM treatment, the mixed sediments could be left in place and capped. Since the fine-grained sediments would be solidified in a homogeneous mass, reducing or prevention subsequent erosion and dispersion of the sediment particles into the water column. Moreover, the CDSM treatment would immobilize the contaminants within the cemented zone, thereby preventing water-sediment exchange. Whether the treated sediments were dredged or left in place, the in-situ CDSM stabilization of sediments produces three important benefits: (a) particle-contaminant migration due to re-suspension and entrainment in the water column is reduced or eliminated, (b) soluble
N-Values at 40 and 70 Days (7% PC)
0
10
20
30
40
50
0 5 10 15
Depth (ft)
N-V
alue 40 Days of Curing
70 days of Curing
N-Values at 40 and 70 Days (14% PC)
0
10
20
30
40
50
0 5 10 15
Depth (ft)
N-V
alue 40 Days of Curing
70 Days of Curing
N-Values at 40 and 70 Days (10.5% PC)
05
1015202530354045
0 5 10 15
Depth (ft)
N-V
alue 40 Days of Curing
70 days of Curing
19
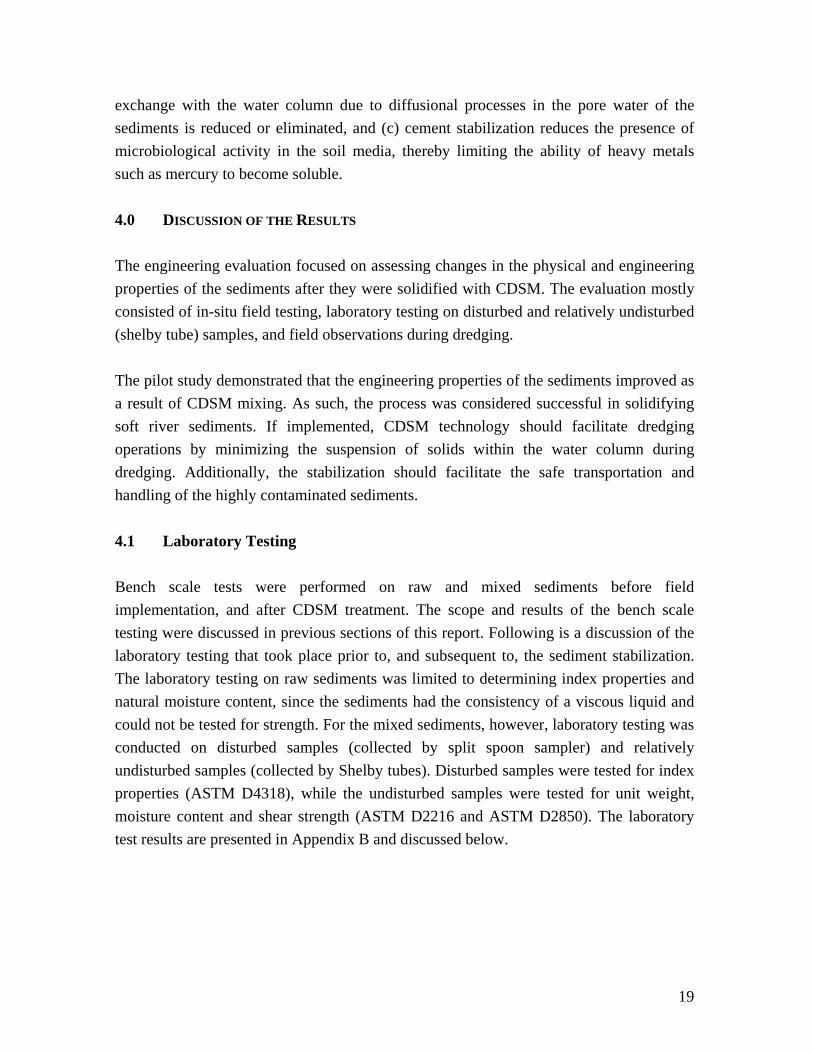
exchange with the water column due to diffusional processes in the pore water of the sediments is reduced or eliminated, and (c) cement stabilization reduces the presence of microbiological activity in the soil media, thereby limiting the ability of heavy metals such as mercury to become soluble. 4.0 DISCUSSION OF THE RESULTS The engineering evaluation focused on assessing changes in the physical and engineering properties of the sediments after they were solidified with CDSM. The evaluation mostly consisted of in-situ field testing, laboratory testing on disturbed and relatively undisturbed (shelby tube) samples, and field observations during dredging. The pilot study demonstrated that the engineering properties of the sediments improved as a result of CDSM mixing. As such, the process was considered successful in solidifying soft river sediments. If implemented, CDSM technology should facilitate dredging operations by minimizing the suspension of solids within the water column during dredging. Additionally, the stabilization should facilitate the safe transportation and handling of the highly contaminated sediments. 4.1 Laboratory Testing Bench scale tests were performed on raw and mixed sediments before field implementation, and after CDSM treatment. The scope and results of the bench scale testing were discussed in previous sections of this report. Following is a discussion of the laboratory testing that took place prior to, and subsequent to, the sediment stabilization. The laboratory testing on raw sediments was limited to determining index properties and natural moisture content, since the sediments had the consistency of a viscous liquid and could not be tested for strength. For the mixed sediments, however, laboratory testing was conducted on disturbed samples (collected by split spoon sampler) and relatively undisturbed samples (collected by Shelby tubes). Disturbed samples were tested for index properties (ASTM D4318), while the undisturbed samples were tested for unit weight, moisture content and shear strength (ASTM D2216 and ASTM D2850). The laboratory test results are presented in Appendix B and discussed below.

20
4.1.1 Moisture Content Table 2 shows the moisture content of the sediment samples prior to CDSM mixing, and after mixing with various percentages of cement.
Moisture Content Raw
Sediments
Cemented Sediments (7.0% PC)
Cemented Sediments
(10.5% PC)
Cemented Sediments (14% PC)
40 Days of Curing 0’-2’ 4’-6’ 6’-8’
8’-10’
135
128.9 92.9 89.6 94.3
142.6 96.4 88.7 87
132.5 84.2 81.9 78.7
Average 4’-10’ 135 92.3 90.1 81.6
70 Days of Curing 0’-2’ 4’-6’ 6’-8’
8’-10’
135
134.7 111.1 94.8 87.3
126.2 83.2 82.5 79.8
133
107.4 86.7 81.2
Average 4’-10’ 135 97.8 81.8 91.8
Table 2. Moisture Content of Raw and Cemented Sediments
As shown in Table 2, the addition of cement significantly reduced the moisture content of the sediments, thereby enhancing its strength properties and workability. While it is expected that the moisture content of mixed sediments would drop as the cement cures, the collected data were not conclusive in this respect. 4.1.2 Index Properties Samples of raw and mixed sediments were tested for Atterberg limits and plasticity index. Typically, the addition of cement reduces fine-grained soil’s range of plasticity, thereby increasing the workability of the material under different moisture conditions. The results from these tests are presented in Table 3.

21
Plasticity Index (Liquid Limit& Plastic Limit)
Raw Sediments
Cemented Sediments (7.0% PC)
Cemented Sediments
(10.5% PC)
Cemented Sediments
(14.0% PC) USCS*
40 Days of Curing
66 (110 & 44) 5 (72 & 67) 8 (90 & 82) Non Plastic High
Plasticity Silt 70 Days of
Curing Same as Above
4 (88 & 84) 3 (84 & 81) 2 (89 & 87) High
Plasticity Silt *Unified Soil Classification System
Table 3. Plasticity Index of Cemented Silt Sediments
As shown in Table 3, the addition of cement decreased the sediment’s Plasticity index. A Lower Plasticity index is desirable, as it translates to lower moisture sensitivity and higher workability in a wider range of moisture contents. 4.1.3 Shear Strength Shear strength tests including unconfined compression (ASTM D2216) and triaxial shear (ASTM D2850) were performed on relatively undisturbed samples that were collected subsequent to the mixing. Samples collected prior to mixing could not be tested for strength due to the very soft nature of the material. For the cemented soil samples, significant strength gain was measured as a result of mixing. The test results are summarized in Table 4. Soil samples were not saturated prior to testing in the triaxial chamber; therefore friction angle (φ) and cohesion were measured in an unconsolidated undrained shear test.
Cement Content Date Tested Cohesion (psf) Friction
Angle(φ) Unconfined
Compression Sample 1 Sample 2 Sample 3
10.5% 14% 7%
11/23/2004 11/23/2004 11/23/2004
1870 1278 771
--- --- ---
Triaxial Sample 1 Sample 2
10.5 %
14%
6/10/2005 6/10/2005
965
1282
22.5 24

22
Cement Content Date Tested Cohesion (psf) Friction
Angle(φ) Unconfined
Compression Sample 4 Sample 5 Sample 6 Sample 7
14% 14%
10.5% 10.5%
10/9/2005 10/9/2005 10/9/2005 10/9/2005
2553 2352 2188 1966
--- --- --- ---
Table 4. Shear Strength of Cemented Silt Sediments
The overall test results indicate that CDSM significantly improved the strength characteristics of the sediment. Samples were collected in November and December of 2004, and were tested in November of 2004, and in June of 2005 respectively. The initial strength gain was considerable, but the rate of strength gain over time significantly decreased from November 2004 to October 2005. In general, the long-term strength gain in cement treated soils is primarily a function of cement type, soil type, mixing and curing conditions. The most dominant soil characteristics affecting strength gain in cement treated soils are the organic content, pH, and the grain size distribution of the soil (Niina et al., 1977). The result of the laboratory investigation by Niina on more than 21 different types of soils showed that strength gain for a given amount of cement is more pronounced with higher pH, lower organic content and an average sand fraction of 60% in clay. Past research by Saitoh (1988) indicates that knowing the pozzolanic reaction of soil to cement beforehand can lead to selection of appropriate cement type for a given site condition. In evaluating the unconfined compressive strength of two cemented soils from the Ports of Yokohama and Osaka, Saitho concludes that Portland cement is more effective in treatment of Yokohama clay which has high pozzolanic reaction while blast furnace slag cement type B is more effective in treatment of soils with low pozzolanic reaction such as Osaka clay. In both of the soil types tested the ratio of strength gain at 2000 days to that of the 28 days strength did not exceed 5 and averaged about 3. The mixing time used in the preparation of the cemented soil has a direct impact on its strength. A longer mixing time produces higher strength in the mix (Nakamura et al., 1982). The temperature during curing also affects the strength gain. Saitho (1980) has
23
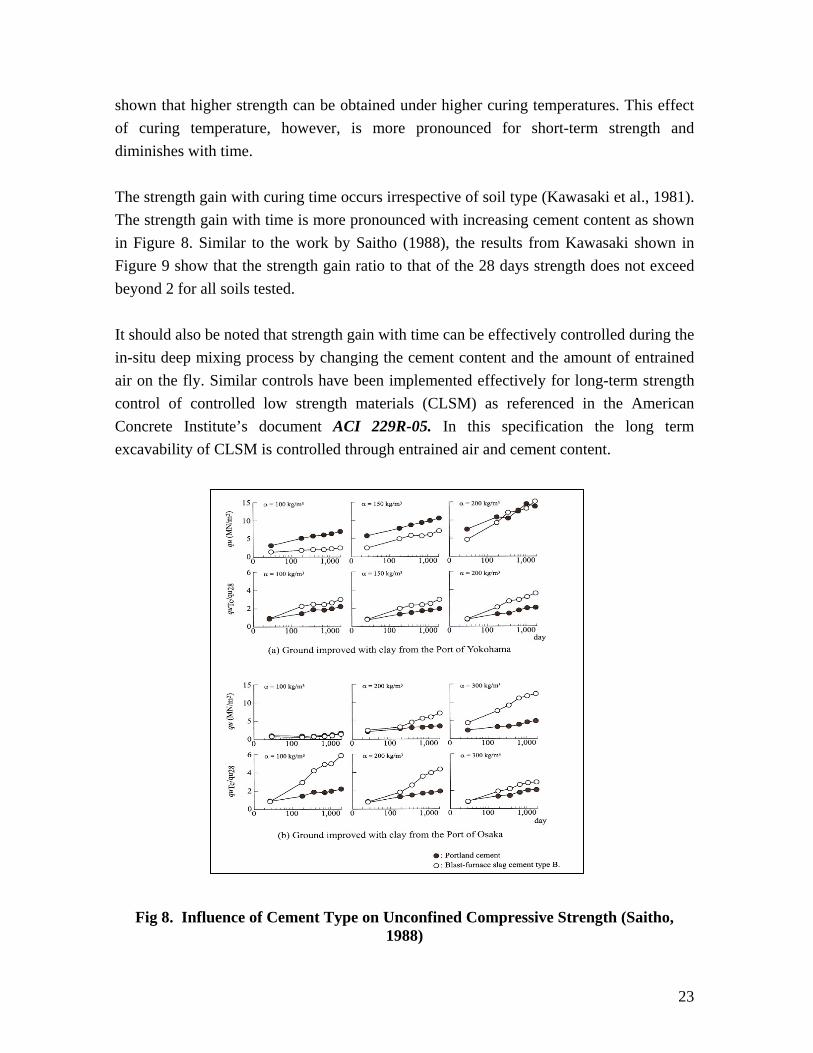
shown that higher strength can be obtained under higher curing temperatures. This effect of curing temperature, however, is more pronounced for short-term strength and diminishes with time. The strength gain with curing time occurs irrespective of soil type (Kawasaki et al., 1981). The strength gain with time is more pronounced with increasing cement content as shown in Figure 8. Similar to the work by Saitho (1988), the results from Kawasaki shown in Figure 9 show that the strength gain ratio to that of the 28 days strength does not exceed beyond 2 for all soils tested. It should also be noted that strength gain with time can be effectively controlled during the in-situ deep mixing process by changing the cement content and the amount of entrained air on the fly. Similar controls have been implemented effectively for long-term strength control of controlled low strength materials (CLSM) as referenced in the American Concrete Institute’s document ACI 229R-05. In this specification the long term excavability of CLSM is controlled through entrained air and cement content.
Fig 8. Influence of Cement Type on Unconfined Compressive Strength (Saitho, 1988)

24
Figure 9. Strength Increase with Curing Time (Kawasaki et al., 1981)
The following conclusions can be made on the basis of the strength tests:
• Significant strength gain was observed for cemented sediments that were cured under water, and a significant increase in the workability of the material should be expected,
• Although the strength gain was significant, it was not so high that sediment dredging would become problematic or would require unconventional dredging equipment, and
• If the sediments were left in-place and capped, the potential for future dredging would not be affected. The strength developed in long term in expected to be 2 to 3 times the initial (28-day) strength and will remain within the ranges of strength that allows for removal of sediments by conventional dredging equipment.
5.0 TOTAL SUSPENDED SOLIDS MONITORING Icon Engineering (ICON) was retained by Rutgers University to measure the total suspended sediments (TSS) and other conventional parameters at the Passaic River before and during the performance of the CDSM pilot study. The ICON’s Report and the appendices are presented in Appendix G of this report. The following is a summary of ICON’s findings:
25
5.1 Methodology The study area was located approximately 100 feet offshore from the Darling International bulkhead, at the terminus of the Passaic and Hackensack Rivers. Sampling took place prior to CDSM activities to determine baseline water quality conditions. Samples were tested in-situ for conductivity, temperature, pH, turbidity, dissolved oxygen and salinity. Selected samples were then sent to an analytical laboratory for determination of total suspended solids (TSS). The data generated during this initial sampling event were used to determine background TSS conditions. Sampling was then conducted during the application of CDSM. Again, samples were tested in-situ for conductivity, temperature, pH, turbidity, dissolved oxygen and salinity. Selected samples were sent to an analytical laboratory for TSS determination. Sampling depths corresponded to approximately 30% (9 feet), 60% (18 feet) and 90% (27 feet) of the total water depth at each sampling point. 5.2 Background Sampling The background sampling event was conducted over a three-day period from October 4 through October 6, 2004. To determine the average water quality characteristics for the Project site, a sampling grid was established. A total of 11 sample locations were selected from the grid, and a total of 71 individual samples were retrieved during the three-day sampling event. The grid encompassed approximately ¼ mile of shoreline at the Project site and extended 500 feet into Newark Bay (see Figures 3 and 4 of Appendix G). Grid locations that were sampled over the three-day period were C1, D1, A2, B2, C2, D2, E2, C3, B3 and C4. During the background sampling, no maritime or CDSM operations were being conducted at the Darling International Bulkhead. Based on the results of the three-day background sampling event, the average water quality characteristics were as follows: CONDUCTIVITY: 25.4 MS/CM TURBIDITY: 2.9 NTU DISSOLVED OXYGEN: 9.5 MG/L TEMPERATURE: 19.7 DEGREES C SALINITY: 1.6 % PH: 7.4 TSS: 18.0 MG/L The data also indicate homogeneous water quality conditions across the sampling grid. Some generalizations can be made based on the sampling depth and on the tidal cycles. Specifically, the greatest turbidity and highest concentrations of TSS were observed

26
closest to the river bottom, at approximately 90% of total depth (27 feet). Similarly, lower turbidity and TSS concentrations were associated with samples collected at a 30% depth (9 feet). Additionally, higher turbidity and TSS concentrations were observed at high tide. Field data collected during the background sampling event are presented in Table 1 at the end of this report. 5.3 Sampling during CDSM Operations CDSM operations were conducted between October 7 and October 8, 2004. During the CDSM operations, water samples were retrieved at locations closest to the augers (Refer to Figure 3 of Appendix G). Grid locations were chosen to “bracket” operations with up-stream and down-stream samples. However, to best determine the fate transport potential of the sediment, samples were primarily collected from the downstream grid positions during mixing activities. Given that this study was conducted in a tidal system, “upstream/downstream” is relative to tidal flow. The testing results are presented in Appendix G. 5.4 Data Evaluation and Results 5.4.1 TSS & Turbidity Measurements Both TSS and turbidity measure the amount of solids suspended in water, whether mineral (e.g., soil particles) or organic (e.g., algae). TSS concentrations measure the actual weight of the material per volume of water, while turbidity measures the amount of light scattered from a water sample.1 Since more suspended particles cause greater scattering, it is possible to correlate turbidity with TSS. It should be noted, however, that to a certain extent, the amount of light reflected is dependent not only on the number of suspended particles, but also on the properties of those particles, such as shape, color, and reflectivity. For these reasons, the correlation between turbidity and TSS is somewhat different for every location or situation given that TSS sampling and turbidity measurements were performed simultaneously at each location.
In this study, in-situ monitoring equipment was used to determine turbidity and other parameters at each sampling location. To better determine the correlation between
1 TSS concentrations are generally reported in units of milligrams of suspended solids per liter of water – mg/L. Turbidity is reported as Nephelometric Turbidity Units (NTU) or Jackson turbidity units (JTU), depending on the instrument used to perform the measurement.

27
turbidity and TSS, 67 samples were collected and sent to an analytical laboratory for analysis of TSS. Turbidity data collected in the field were plotted against the laboratory results for TSS, as presented in Figure 8.
Using least-square regression over paired measurements, the relation between TSS and turbidity (Tn) showing the best regression coefficient (0.9535) can be written using the following linear formula:
)(395.2)/( NTUTnLmgTSS =
This relation was then used to find the TSS concentration for all of the sampling points where turbidity was measured in-situ.
TSS vs. Turbidity
y = 2.3947xR2 = 0.9535
0
50
100
150
200
250
300
350
400
450
0 20 40 60 80 100 120 140 160 180
Turbidity (NTU)
TSS
(mg/
l)
Figure 10. Correlation between TSS and Turbidity
Correlations for other water quality parameters such as Salinity, pH, Electrical Conductivity, and Dissolved Oxygen were established. Those correlations are presented and discussed in detail in Appendix G.
5.4.2 pH Measurements
pH measurements were measured against TSS results, as shown in Figures 9. While no apparent correlation was found between pH and salinity; samples presenting higher pH generally had higher TSS concentrations, as indicated in the figure below. The addition of cement (and its effect on turbidity) appears to have had a noticeable effect on pH.

28
TSS vs. pH
y = 2E-05e1.8218x
R2 = 0.4515
0.0
50.0
100.0
150.0
200.0
250.0
300.0
350.0
400.0
450.0
500.0
7 7.2 7.4 7.6 7.8 8 8.2 8.4 8.6 8.8 9
pH
TSS
(ppm
)
Figure 11. pH vs. Turbidity Measurements
5.4.3 Parameter Evaluation Prior to CDSM operation, TSS concentrations for samples taken at approximately 30% of the total river depth ranged from 7.5 to 16 ppm, while deeper samples, 60% and 90% of the total river depth, reached 43.5 ppm (Figure 10). This increase in TSS over depth is typical of low-flow rivers such as the lower Passaic River.
TSS vs. Depth [NO OPERATION-All Samples]
0
5
10
15
20
25
30
0.0 5.0 10.0 15.0 20.0 25.0 30.0 35.0 40.0 45.0 50.0
TSS ppm
Dep
th (f
t)
Figure 12. Turbidity vs. Depth prior to CDSM Operation The TSS concentrations are summarized below:
29
AVERAGE
15.50 ST DEVIATION 6.88 SAMPLE SIZE 86 MAXIMUM 43.5 MINUMUM 7.0
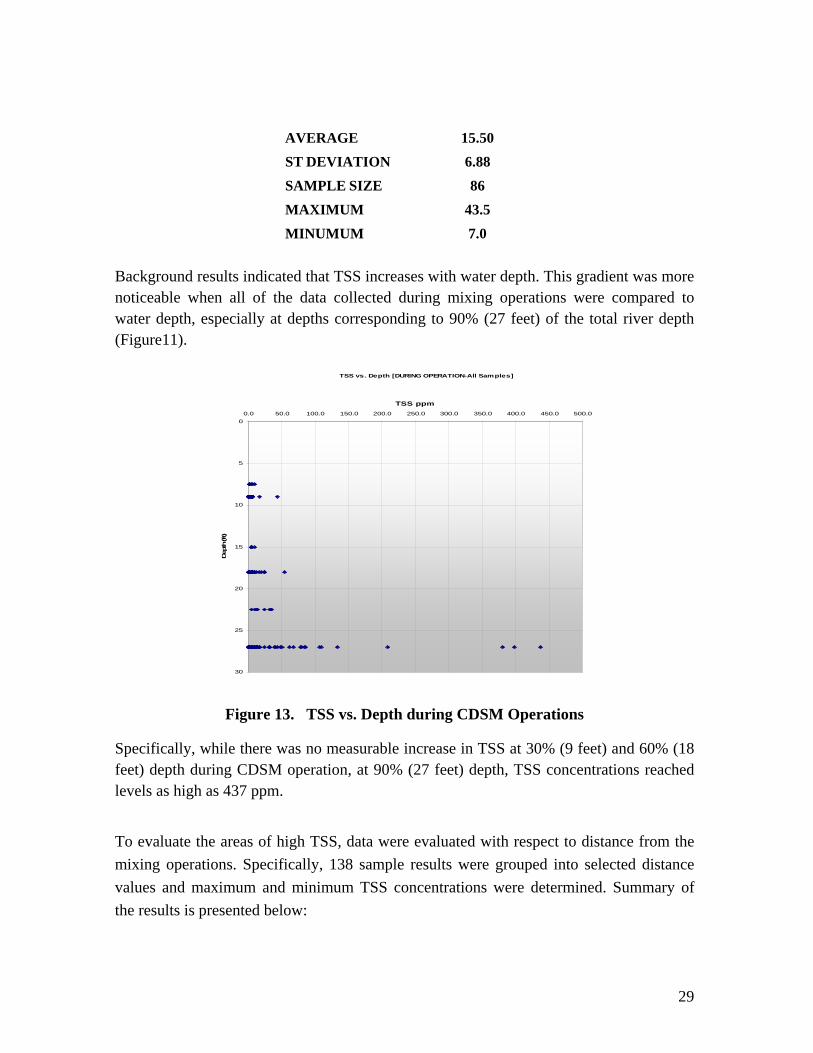
Background results indicated that TSS increases with water depth. This gradient was more noticeable when all of the data collected during mixing operations were compared to water depth, especially at depths corresponding to 90% (27 feet) of the total river depth (Figure11).
TSS vs. Depth [DURING OPERATION-All Samples]
0
5
10
15
20
25
30
0.0 50.0 100.0 150.0 200.0 250.0 300.0 350.0 400.0 450.0 500.0
TSS ppm
Dep
th (f
t)
Figure 13. TSS vs. Depth during CDSM Operations
Specifically, while there was no measurable increase in TSS at 30% (9 feet) and 60% (18 feet) depth during CDSM operation, at 90% (27 feet) depth, TSS concentrations reached levels as high as 437 ppm.
To evaluate the areas of high TSS, data were evaluated with respect to distance from the mixing operations. Specifically, 138 sample results were grouped into selected distance values and maximum and minimum TSS concentrations were determined. Summary of the results is presented below:

30
AVERAGE
31.33 ST DEVIATION 62.01
SAMPLE SIZE 138.00
MAXIMUM 437.00
MINUMUM 5.00
While the CDSM equipment was operating, there was a significant correlation between TSS and distance from the mixing area in both horizontal and vertical planes. Specifically, while sample locations at a distance of 0 to 75 feet from mixing operations exhibited TSS as high as 437 ppm, the TSS dropped to background at locations 135 feet from the mixing area. The highest TSS concentrations corresponded to samples collected at 90% depth, Samples taken at 15 feet or less (33% depth) were indistinguishable from background even in the 0 to 75 foot radius from CDSM augers. At distances between 75 and 125 feet, samples taken at 25 feet or less (66% depth) were at background. Once outside of a 125 foot radius, no samples were greater than background, regardless of depth. In summary, the TSS plume is at least 15 feet below the water’s surface, moundshaped, and in close proximity to the CDSM equipment.
5.5 Conclusions Noticeable TSS increases over background results were detected at sampling points 0 to 75 feet from the mixing activities at depths greater than 50% depth (15 feet). In addition, TSS levels in excess of background results were only recorded at depths greater than 25 feet for sampling points located 75 to 125 feet from mixing. Finally, TSS concentration levels were at background values at any depth for sampling points located more than 125 feet from the mixing activities.
The scope of work for TSS monitoring during this pilot study was limited to sequential sampling and by the use of basic in-situ monitoring equipment. As surface water quality and flow are dynamic, mapping of site TSS at a specific flood stage (time) was not possible. Nevertheless, the water zone influenced by mixing operations can be broadly display as follows:

31
0
1
2
3
4
5
6
7
8
9
10
11
12
13
14
15
Figure 14. TSS Concentration vs. Distance from CDSM Operation
The correlation between TSS and pH near the mixing zone seems to be due to the presence of cement in the water column. Cement and possibly suspended particles from the sediment being stabilized appear to be the source of increased TSS concentrations near the mixing zone. Nevertheless, this cannot be concluded without actual chemical characterization of: (a) sediments prior to and after stabilization; and (b) suspended and dissolved particles in the water zone influenced by the mixing operations.
6.0 ADDITIONAL STUDIES In addition to the various testing that was performed as part of this study, two additional studies beyond the original scope were conducted: (a) an evaluation of the effect that organic content found within silt sediments would have on soil-cement hydration and strength gain, and (b) an assessment of whether the cement stabilization/solidification of contaminated sediments immobilizes organic and inorganic contaminants within the sediment. The first study, evaluating the effects of organic content, was conducted at Iowa State University under the direction of Prof. Vernon R. Schaefer. A summary of this study is presented below. 6.1 Effect of Organic Content on Soil-Cement Hydration and Strength Gain

32
As stated above, this study was designed to determine whether organic content alters the stabilizing effects of Portland cement on dredged material. The dredged material was collected from the study site. The samples contained a wide variety of materials including clay, silt and sand, pieces of bricks, organic matter (grass), glass, and salt. Additionally, the sediment samples had a distinctive odor, suggesting the presence of diesel fuel. To assess the effects of organic matter on the stabilizing ability of the cement, several mixes were prepared and then tested. The mixes contained dredged material, Portland cement for stabilization, and varying amounts of motor oil. The oil used was 10W30 motor oil, and Type I Portland cement was used as the binder. The steps in the study included:
1. Preparing 2-inch x 2-inch cylindrical samples of the four mixes: (a) no oil, (b) 10% oil, (c) 20% oil, and (d) 30% oil of sediment wet weight. For all of the mixes, the content of Portland cement remained the same, 12% of sediment wet weight,
2. Determining the unconfined compressive strength of the mixes over time, and 3. Conducting Scanning Electron Microscopy (SEM) image analysis of the tested
samples. The study generated results for the following: (1) Unconfined compressive strength tests, (2) SEM Imaging, and (3) X-Ray mapping. These results are discussed more fully below, and the complete Iowa State University Report is presented in Appendix D. 6.1.1 Unconfined Compressive Strength Results The results of the unconfined compressive strength tests indicated a detrimental effect on the sediment when the percentage of motor oil was greater than 10% by wet weight. At more than 10%, the oil had a pronounced coating effect that inhibited the hydration of the cement, and in turn resulted in lower unconfined compressive strength. When the curing time was increased for the 10%-oil samples, the unconfined compressive strength increased due to an increase in hydrated cement particles. Another detrimental effect associated with high percentages of organic content was that the material’s wet unit weight decreased as the oil content increased. This is partly due to the low unit weight of the oil.

33
6.1.2 SEM Image Results The SEM image analysis showed a wide variety of materials present within the dredged sediment, including: fibers, sand, concrete, brick, and salt. SEM images also indicated that in samples with greater than 10% oil by dry weight, the cement particles tended to agglomerate and separate, an effect that would decrease the compressive strength of the material. Additionally, the SEM images (Presented in Appendix D) reveal that the addition of motor oil retards the hydration of the Portland cement. Specifically, the SEM images of samples containing motor oil and Portland cement show that the motor oil coats both the soil and the cement particles. This coating does not allow the cement particles to hydrate fully and interact with the individual soil grains. 6.1.3 X-Ray Map Results As in the case of the SEM results, The X-ray map results showed that the oil coats the particles, which inhibits the cementation process and in turn retards strength gain. The X-ray analysis also proved useful in categorizing elements and materials within the processed sediment, such as: cement, iron sulfates, sand, and salt. 6.2 Solidification/Stabilization of Contaminated Sediments using Cement
(Potential benefits of CDSM for In-Situ Stabilization)
6.2.1 Chemical Fixation and Solidification One alternative to dredging and disposing of contaminated sediment is to solidify the sediment in-situ using CDSM, and cover the stabilized sediment with a cap. In this scenario, the mixing is a viable way to reduce the potential for highly contaminated sediments to be eroded over time by natural hydrologic events, vessel traffic or dredging. In situations where decisions regarding removal of sediment have not yet been made or if management alternatives (decontamination) are not yet fully developed, the CDSM technology can be used to stabilize sediment for later removal. Chemical fixation and Solidification, CFS, also commonly referred to as Solidification/Stabilization Treatment, S/S, is a widely used treatment for the management and disposal of a broad range of wastes, especially those classified as hazardous. The initial application of the technology in the United States dates back to the 1950s when it was successfully used to treat and dispose of radioactive waste. The USEPA considers S/S an established treatment technology, and has identified it as the best demonstrated
34
available technology, BDAT, for 57 RCRA-listed wastes. It is estimated that 30% of the CERCLA (Superfund) remediation sites include the use of S/S (Reference 2). There is an ample body of technical literature that documents the fundamentals for applying S/S, as well as the practical experience using the technology in a wide variety of wastes, contaminants and chemical matrices (Reference 3). The applicability of using S/S to immobilize the principal contaminants in the Passaic River sediments was evaluated. The following sections briefly summarize those findings. 6.2.2 PCBs Due to the low solubility of PCBs in water, this family of compounds is a good candidate for the application of S/S technologies (Reference 4). The most commonly applied criterion for evaluating the fixation of a contaminant using S/S technology is leachability testing, which may be conducted using TCLP, SPLP or variations of these. Several reports referencing TCLP results for different S/S treatments of PCB-contaminated wastes are reported in the literatures (Reference 5). The following treatment combinations were evaluated on a synthetic waste: 1. Cement + soluble silicate 2. Cement + soluble silicate + FeCl2 3. Cement + soluble silicate + Na2S The best results were obtained with the first treatment. The results for treatments 2 and 3 were unsatisfactory. The successful application of S/S for immobilizing PCBs in a lagoon sludge dredge material is also reported (Reference 6). In this case, a combination of cement and kiln dust was used. Following the S/S treatment, levels of PCBs in the EPT leachate were reported below the detection limit of 0.001 ppm. There are several additives mentioned in the literature as potential enhancers of the PCB immobilization. These depend on the particular conditions of the application: 1. Organically modified clays 2. Activated carbon 3. Ferric hydroxide 4. Rubber particulate The successful application of these additives is dependent on the particular conditions of

35
each case, and a laboratory evaluation of their effects is recommended. Several other additives for enhancing the S/S process are also mentioned in the technical literature. The effectiveness of these additives depends on the particular characteristics of the soil and chemical matrix. A well-documented case where S/S was used for the immobilization of PCBs in contaminated soils is provided in the Yellow Water Road Dump in Duval County, Florida. In that case, a superfund site that started remedial action in 1984 (Reference 6) was removed from the NPL in 1999. During the remedial activities, 4472 cubic yards of PCB-contaminated soils were excavated and treated with S/S and placed back within the former operations area of the site. A groundwater monitoring program was established, and monitoring wells were installed to evaluate the future need for contingent pump-and-treat remedy. The site was monitored as part of the EPA five-year review program. In September 2000, the five-year-review report established that the selected remedy remained protective of human health and the environment. Site inspections and groundwater monitoring continue to ensure long-term protectiveness. 6.2.3 Dioxins The use of S/S technology for treating dioxin-contaminated wastes is reported in the literature for wood preservation waste. In one case, dioxins were present as a contaminant of one of the chemicals, PCP, used in wood preservation (Reference 7). The contaminated soils were subjected to a series of laboratory treatability tests for different S/S treatments. Three to six different formulations were tested. The following additives were evaluated as part of the study:
1. Fly Ash 2. Activated Carbon 3. OHMAR-8 4. STC P-l 5. STC P-4 Both TCLP and SPLP were used as part of the evaluation protocol. Contaminated soils with a wide range of concentrations of 2,3,7,8 tetrachlorodibenzo-p-dioxin (TCDD) (Reference 8) were used in the analysis. Soils from four different sites were studied. The results indicated that the SPLP test is
36
more restrictive than is the TCLP in this case. Higher concentrations of TCDD in the leachate were obtained more consistently in the extracts of SPLP than in the extracts from the TCLP test. The results indicated that in all cases dioxins were successfully stabilized as measured by the SPLP extracts, with reductions ranging from 95% to over 99% after adjusting for dilution by reagents. Target concentration levels were met for dioxins in SPLP leachates for all of the sites by at least one of the formulations tested. Here again, the need for a laboratory treatability study is emphasized. 6.2.4 Polyaromatic Hydrocarbons, PAH PAHs are slightly leachable before treatment, making them an excellent candidate for S/S. Some concerns exist with respect to volatilization due to the mixing process and the rise in temperature that takes place during the curing reaction of the cement with the soil. PAHs are considered semi-volatile substances. Volatilization of a semi-volatile compound during S/S has been reported in some instances (Reference 6). The significance of volatilization is particular to each case, as some studies report a high removal from the soil during the S/S processing, while other report limited effects. PAHs were also studied as part of the dioxin study presented above. The same treatments that were applied to each of the four sites in the laboratory treatability study were also applied here. All of the results were reported in terms of benzo(a)pyrene potency equivalents. SPLP extracts exhibited consistently higher concentrations of PAHs than TCLP extracts in treated soils. PAHs were successfully immobilized by the treatment, achieving reductions in concentrations in SPLP extracts of 90% or higher. SPLP leachates met the targets of PAHs for all sites where targets had been established. 6.2.5 Summary The literature review of S/S/ technology is summarized as follows: 1. S/S treatment that uses cement is an established technology. 2. The immobilization results presented in the literature for the three principal contaminants of concern in Passaic River sediments, namely PCBs, Dioxins and PAHs, indicate that the chemical fixation of these compounds using S/S could be expected, and that a significant reduction in the mobility of these substances would be obtained.

37
3. It would be expected that the two principal mechanisms of sediment-water column exchange, re-suspension of fine-grained sediments and pore water exchange, would be significantly reduced after the application of the S/S/ treatment. This, in turn, would minimize the potential for the contaminants to be released into the environment. 4. Laboratory treatability tests are recommended to confirm the expected results. 5. The effects of volatilization during S/S processing should also be further assessed as part of the laboratory evaluation. 6. The long-term immobilization of the contaminants by way of pore water exchange should be further evaluated if the S/S is proposed as part of in-situ treatment. 7.0 DREDGING/DISPOSAL OF THE SOLIDIFIED SEDIMENTS Upon completion of the in-situ testing and monitoring, the solidified sediments were dredged on April 1, 2005. The results of the final round of the in-situ testing were shared with dredging companies while dredging bids were solicited. The dredgers agreed that environmental buckets could not penetrate the solidified sediments and that a digging bucket would be required. According to the dredgers, environmental buckets currently available could penetrate sediments with SPT N-values no more than 1-2. For the cell with the lowest cement content (7%), N-values well above 2 were recorded. Therefore, it was decided that a conventional two yard digging bucket should be utilized to remove the solidified sediment. The dredged sediments were visually inspected during dredging and disposal. The dredged material consisted of a mix of chunks of cemented sediments (approximately one foot in diameter) and soft un-cemented sediments. The un-cemented sediments were mixed with the cemented chunks. There are two possible explanations for this:
• The soft material sloughed into the depression formed during dredging and;
• Drift of the dredging bucket to the outside of the cemented zone due to relatively fast river currents that resulted in the mixing of non-cemented and cemented sediments.

38
The size of the dredging bucket is approximately 4 by 10 feet while the dimensions of the solidified zone, as mentioned earlier, were 18.5 by 14 feet. The average river depth at the dredging location was 22 feet. Therefore, placing the dredging bucket exactly over the cemented zone proved difficult. During the second phase of the study, the size of the cemented area should be large enough that none of the factors responsible for the mixing and the cemented and non-cemented sediments would come into play. Visual observation indicated that the solidified sediments were uniformly mixed and were very stiff. Since the cemented sediments were dredged using a relatively light digging bucket, a further investigation could be conducted during the second phase of this study to determine whether higher cement contents could be used for solidification without rendering future dredging impractical. It should also be investigated whether it would be practical to manufacture environmental buckets heavier than those currently available and capable of excavating cemented sediments. Upon completion of dredging, dredged material was placed in a scow and transferred from the Darling International Site to the Bayshore Recycling Site at Keasbey, New Jersey to be unloaded. The dredged material then was trucked to the Encap Golf Site in East Rutherford, NJ for final disposal.
8.0 CONCLUSIONS
Restoration of the sediments of the NY/NJ Harbor will have a significant impact on the economy and quality of life in Northern New Jersey. As part of restoration of the Harbor, highly contaminated sediments in the Harbor and surrounding waterbodies may need to be dredged and disposed of in order to minimize future migration of contaminants. However, dredging of the highly contaminated sediments must be done in an environmentally sound fashion such that they are not dispersed beyond their existing location. In-situ solidification of sediments using CDSM could mitigate the potential risk of contaminant dispersion during dredging, transportation and processing. In a pilot project conducted at the mouth of the Passaic River, the CDSM technology was successfully implemented for the stabilization/solidification of slightly contaminated sediments. The site was selected because the sediments there have physical characteristics similar to those in known Harbor hot spots such as the Lower Passaic River. Cement is typically the preferred additive for solidification since it can be mixed in slurry form and is consistent in its chemical and physical properties.

39
A conventional digging bucket was used for dredging the solidified sediments. The strength of the solidified sediments did not impede the dredging operation. Therefore, cement contents of 14%, or possibly higher, could be used without posing any practical problems for dredging. Significant improvement in the shear strength of the mixed sediments was measured following stabilization. The SPT N-values increased from “weight of rod” to 46. An average reduction of 40% in moisture content was measured within the solidified sediments. Shear strengths ranging from 770 to 1870 psf were measured in laboratory-tested samples in 40 days following the mixing. One-year shear strength reached ranged from 1996 to 2533 psf. A reduction in the material’s moisture content, and an increase in its shear strength, resulted in increased workability, thus facilitating efficient handling and transportation of contaminated sediments. A TSS study was conducted prior to, during and subsequent to the sediment mixing at high and low tides. The TSS study indicated that noticeable TSS increases (reaching a maximum of 450 ppm) over background results were detected from 0 to 75 feet from the location where the mixing had taken place at depths greater than 15 feet. TSS slightly over background results were only noticed at depths greater than 25 feet for those sampling points located 75 to 125 feet from the mixing. Irrespective of depth, TSS was at background values for sampling points located more than 125 feet from the mixing. The generation of suspended solids during the dredging of untreated and treated sediments was not evaluated in this study, however it is expected that the generation of suspended solids would be reduced following stabilization. The strength gained during the solidification process, as shown in this study, would minimize any potential for erosion or migration of the sediments subjected to high river flows (floods). The strength gain over time is typically three times or less the initial strength (28-day) and the sediments should remain in a state suitable for dredging indefinitely. Therefore, solidified sediments could be left in situ and capped while further remedial options are investigated and decisions are made regarding final solutions. 9.0 PHASE II STUDY The results of the pilot study demonstrated that the CDSM technology is a viable solution

40
for stabilization/solidification of contaminated sediments. Sediments could be dredged in solid form, which would facilitate material handling, transportation and disposal. Alternatively, if the sediments were to be solidified and capped, mixing sediments with cement-based additives would immobilize contaminants within the soil matrix and improve the leachate characteristics. However, before recommending CDSM for full-scale solidification/stabilization, several practical issues need to be addressed. Some of these issues are as follows:
1. The logistics and operational aspects of CDSM in a river environment, for example the optimal barge size and its maneuverability.
2. Perimeter containment during CDSM operations to minimize potential migration of sediments during mixing and the solidification process.
3. Addressing specific health and safety measures during field operations. 4. Real-time monitoring of suspended solids before, during, and after field operations
in river environment. Once the results are available, determination could be made if perimeter containment is required or not.
5. Validation of CSDM stabilization process for improving leachate characteristics, which is of critical importance for in-situ stabilization. The study would require a comprehensive chemical analysis and an evaluation of the bulk chemistry and leachate characteristics of the sediments prior to and after treatment.
6. Optimization of the cement content in the mixed sediments to (a) solidify the sediments to the extent that the desired workability is achieved, and (b) immobilize contaminants present in the soil matrix if the sediments are to be solidified in-situ and capped.
7. Post treatment behavior of the solidified/stabilized mass with respect to structural integrity and leachate characteristics.
8. The effects of volatilization of contaminants during S/S processing should also be further assessed as part of the laboratory evaluation.
9. Development of practical guidelines for the use of CDSM for the in-situ solidification/stabilization of river sediments.
41
REFERENCES 1- Wilk C, 1999, Solidification/Stabilization Treatment: Principles and Practice, EM Air and Waste Management Association, page 31 2- EP A, 1999, Solidification/Stabilization Resource Guide
3- Conner, J, 1990, Chemical Fixation and Solidification of Hazardous Wastes, Van Nostrand Reinhold
4- Opus cit.
5- EPA, 2000, 5-year Review Report, Yellow Water Road Dump, Florida NPLINPL Caliber Cleanup Site Summaries. 6- Bates, E, Sable, Grosse, 1999, Solidification/Stabilization for Remediation of Wood Preserving Sites: Treatment of Dioxins, PCP, Creosote, Metals. PCA RP371 7- Douglas W. Scott, Lawrence Baier, Richard J. Gimello, and James Lodge 2003, “A Comprehensive Strategy for Managing Contaminated Dredged Materials in the Port of New York and New Jersey” Journal of Dredging Engineering. 5(3): 1-12. 8-Saitho, S. 1988. Experimental Study of engineering properties of cement improved ground by deep mixing method. PhD. Thesis, Nihon University 9- Niina, A. S., Saitho, S., Babasaki, R., Tsutumi, I., and Kawasaki, T., 1977. Study on DMM using cement hardening agent (Part O). Proceedings of the 12th Japan National Conference on Soil Mechanics and Foundation Engineering: 1325-1328. 10- Kawasaki, T., Niina, A., Saitho, S., Suzuki, Y., Honjyo, Y., 1981. “Deep mixing method using cement hardening agent”. Proceedings of the 10th International Conference on Soil Mechanics and Foundation Engineering, 3:721-724. 11- Miskewitz, Robert, 2004, “Measurement of PCB’s Released to the Atmosphere from Stabilized Dredged Material”, Ph.D. Dissertation


