SOLIDIFICATION AND SOLID STATE PHASE TRANSFORMATION … · SOLIDIFICATION AND SOLID STATE PHASE...
13
SOLIDIFICATION AND SOLID STATE PHASE TRANSFORMATION OF ALLVAC ® 718PLUS™ ALLOY Wei-Di Cao ATI Allvac, an Allegheny Technologies Company, 2020 Ashcraft Avenue, Monroe, NC 28110, USA Keywords: 718Plus, Solidification, Aging, phase Abstract Solidification and solid state transformations of Allvac ® 718Plus™ alloy were studied by modeling and experiment. Solidification behavior was investigated by DTA and SEM/EDS techniques and compared with modeling calculations. Various phases were identified and formation of the cast structure was interpreted on the basis of a pseudo-binary phase diagram developed in this work. The chemistry, crystal structure and growth rate of hardening phases and their precipitation kinetics were studied. Aging behavior and the effect of solution temperature and plastic deformation were addressed. Special attention was paid to phase precipitation. The nature, morphology and formation kinetics of phase were investigated and its effect on mechanical properties are discussed. Introduction In recent decades, an effort has been made to develop a Ni-base superalloy that has temperature capability at least 55°C higher than that of alloy 718 with 718-like processability and a cost lower than that of alloys applied at equivalent temperatures such as Waspaloy. As part of this effort, a new alloy, Allvac ® 718Plus™, was developed at ATI Allvac [1]. The chemistry of this alloy was determined by detailed modeling and experimental studies and the results have been reported [2]. Much experimental work demonstrated that this alloy has excellent mechanical properties up to 704°C, processability approaching that of alloy 718 and cost lower than alloys such as Waspaloy and René 41 [3-4]. The chemistry of this alloy, together with alloys 718 and Waspaloy is shown in Table I. Table I. Nominal Chemistry Comparison of Alloys 718Plus™, 718 and Waspaloy Chemistry, wt% Alloy C Cr Mo W Co Fe Nb Ti Al P B 718Plus 0.025 18.0 2.70 1.0 9.0 10.0 5.40 0.70 1.45 0.007 0.004 718 0.025 18.1 2.90 – – 18.0 5.40 1.00 0.45 0.007 0.004 Waspaloy 0.035 19.4 4.25 – 13.25 – – 3.00 1.30 0.006 0.006 Like other superalloys, the processing of alloy 718Plus, especially solidification, hot working and heat treatment practices, has to be carefully controlled to generate a desirable microstructure and therefore the required mechanical properties. A thorough understanding on the relationships among processing, microstructure and mechanical properties is very critical to the application of this alloy. This type of study obviously requires many years effort by many researchers, as shown in some highly successful alloys such as 718. Therefore, only a few relevant topics could 165 Superalloys 718, 625, 706 and Derivatives 2005 Edited by E.A. Loria TMS (The Minerals, Metals & Materials Society), 2005
-
Upload
truongphuc -
Category
Documents
-
view
223 -
download
0
Transcript of SOLIDIFICATION AND SOLID STATE PHASE TRANSFORMATION … · SOLIDIFICATION AND SOLID STATE PHASE...
SOLIDIFICATION AND SOLID STATE PHASE TRANSFORMATION OF ALLVAC® 718PLUS™ ALLOY
Wei-Di Cao
ATI Allvac, an Allegheny Technologies Company, 2020 Ashcraft Avenue, Monroe, NC 28110, USA
Keywords: 718Plus, Solidification, Aging, phase
Abstract
Solidification and solid state transformations of Allvac® 718Plus™ alloy were studied by modeling and experiment. Solidification behavior was investigated by DTA and SEM/EDS techniques and compared with modeling calculations. Various phases were identified and formation of the cast structure was interpreted on the basis of a pseudo-binary phase diagram developed in this work. The chemistry, crystal structure and growth rate of hardening phases and their precipitation kinetics were studied. Aging behavior and the effect of solution temperature and plastic deformation were addressed. Special attention was paid to phase precipitation. The nature, morphology and formation kinetics of phase were investigated and its effect on mechanical properties are discussed.
Introduction
In recent decades, an effort has been made to develop a Ni-base superalloy that has temperature capability at least 55°C higher than that of alloy 718 with 718-like processability and a cost lower than that of alloys applied at equivalent temperatures such as Waspaloy. As part of this effort, a new alloy, Allvac® 718Plus™, was developed at ATI Allvac [1]. The chemistry of this alloy was determined by detailed modeling and experimental studies and the results have been reported [2]. Much experimental work demonstrated that this alloy has excellent mechanical properties up to 704°C, processability approaching that of alloy 718 and cost lower than alloys such as Waspaloy and René 41 [3-4]. The chemistry of this alloy, together with alloys 718 and Waspaloy is shown in Table I.
Table I. Nominal Chemistry Comparison of Alloys 718Plus™, 718 and WaspaloyChemistry, wt% Alloy
C Cr Mo W Co Fe Nb Ti Al P B718Plus 0.025 18.0 2.70 1.0 9.0 10.0 5.40 0.70 1.45 0.007 0.004
718 0.025 18.1 2.90 – – 18.0 5.40 1.00 0.45 0.007 0.004Waspaloy 0.035 19.4 4.25 – 13.25 – – 3.00 1.30 0.006 0.006
Like other superalloys, the processing of alloy 718Plus, especially solidification, hot working and heat treatment practices, has to be carefully controlled to generate a desirable microstructure and therefore the required mechanical properties. A thorough understanding on the relationships among processing, microstructure and mechanical properties is very critical to the application of this alloy. This type of study obviously requires many years effort by many researchers, as shown in some highly successful alloys such as 718. Therefore, only a few relevant topics could
165
Superalloys 718, 625, 706 and Derivatives 2005 Edited by E.A. LoriaTMS (The Minerals, Metals & Materials Society), 2005
be addressed in this study and the results must be preliminary in nature. Solidification structure,'/ " precipitate state and phase precipitation among others play a very critical role in forming
the mechanical properties of this alloy. This paper will concentrate on these issues and briefly introduce the results of relevant studies.
Solidification Behavior
Solidification structure, including macro-, microsegregation and various eutectic reactions,significantly influence the mechanical properties of wrought products, and the behavior in solidification will determine the size of ingot that can be readily made from this alloy. The behavior during solidification was investigated by modeling calculations, differential thermalanalysis (DTA) and detailed SEM/EDS study of the cast structure.
Modeling Analysis
Modeling analysis of the solidification process was conducted, using the JMatPro software tool, on both alloys 718 and 718Plus. A comparison was made of the solidification temperature range, Nb segregation and carbide formation of both alloys. As shown in Table II, both alloys have similar liquidus, solidus and, therefore, solidification temperature ranges with those of alloy 718Plus being slightly lower. Segregation of Nb in alloy 718Plus is actually slightly lower than alloy 718 although both have the same Nb content. The carbide precipitation in both alloys are also very similar.
Table II. Modeling Results of Solidification Characteristics of Alloys 718Plus™ and 718 Solidification Temperature
°CNb Segregation MC Carbide Precipitation
AlloyLiquidus
TL
SolidusTS
TL - TS
PartitionCoefficient
KNb
Nb in liquid at Solidus
PrecipitationTemperature
°C
MC at Solidus
718Plus 1346 1201 145 0.40 13.43 % 1260 0.160 % 718 1358 1214 144 0.35 15.42 % 1267 0.155 %
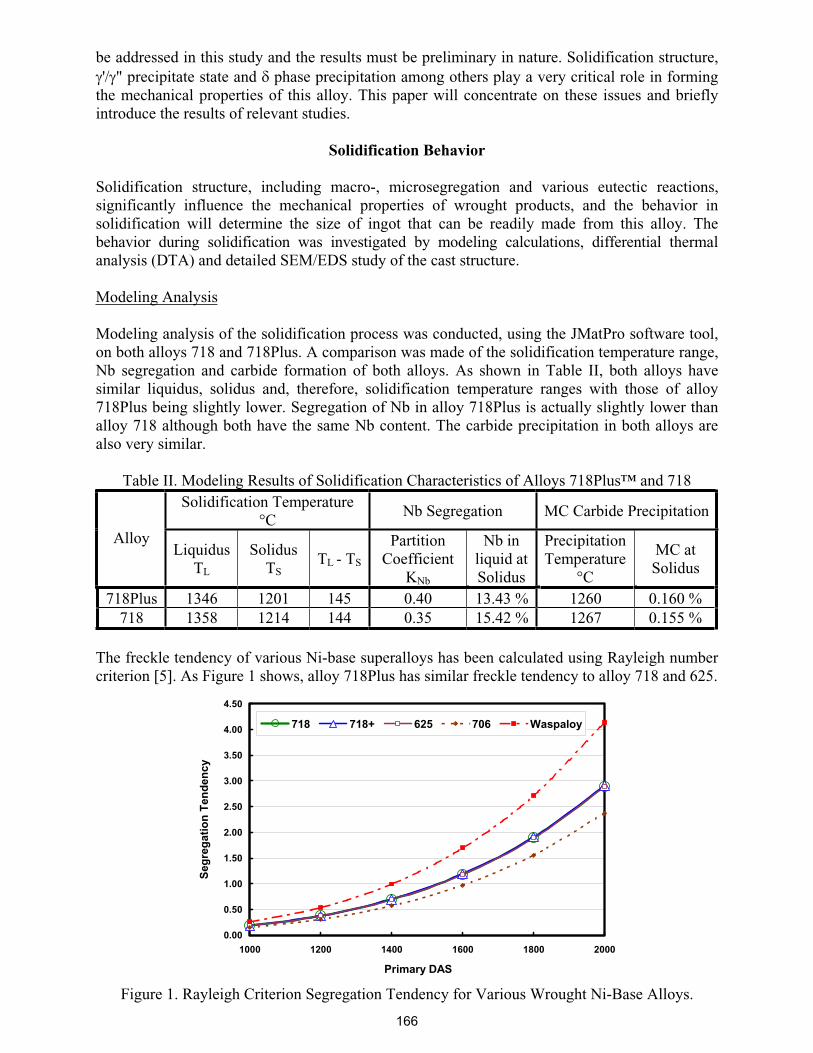
The freckle tendency of various Ni-base superalloys has been calculated using Rayleigh numbercriterion [5]. As Figure 1 shows, alloy 718Plus has similar freckle tendency to alloy 718 and 625.
0.00
0.50
1.00
1.50
2.00
2.50
3.00
3.50
4.00
4.50
1000 1200 1400 1600 1800 2000
Primary DAS
Seg
reg
atio
n T
end
ency
718 718+ 625 706 Waspaloy
Figure 1. Rayleigh Criterion Segregation Tendency for Various Wrought Ni-Base Alloys.
166
Waspaloy has the highest freckle tendency among all alloys calculated. This, coupled with the data in Table II, suggests that the capability of alloy 718Plus for making large size ingot mightbe similar to that of alloy 718 and better than Waspaloy.
Differential Thermal Analysis (DTA) Study
To clarify non-equilibrium behavior, a DTA study was conducted on alloy 718Plus. A comparison with data on alloy 718 [6] is made in Table III. It shows that both alloys have quitesimilar behavior in a non-equilibrium condition. Both alloys showed a Laves eutectic reaction at similar temperatures during solidification. This eutectic could be eliminated by long timehomogenization because Laves eutectic reaction did not show up in the DTA on-heating cycle of homogenized material and was only seen in the on-cooling solidification cycle. It appears that DTA gives a higher liquidus for alloy 718Plus and higher solidus for both alloys, which meansthe solidification range drops from 145°C (modeling) to 88°C (DTA) for alloy 718Plus and from144°C (modeling) to 110°C (DTA) for alloy 718.
Table III. Critical Phase Transformation Temperatures of Alloys 718Plus™ and 718 Modeling DTA MetallographyPhase
Transformation 718Plus°C
718°C
718Plus°C
718°C
718Plus°C
718°C
Liquidus 1346 1358 1353 1345 – –MC Eutectic 1261 1246 1292 1286 – –
Solidus 1201 1214 1265 1235 – 1230Laves Eutectic – – 1173 1167 – 1165
Solvus 1065 1027 – – 1002- 1018 996- 1015
' Solvus 995 909 963 936 954- 982 –
" Solvus 968 946 – – – –
As-Cast Microstructure and Pseudo-Binary Phase Diagram
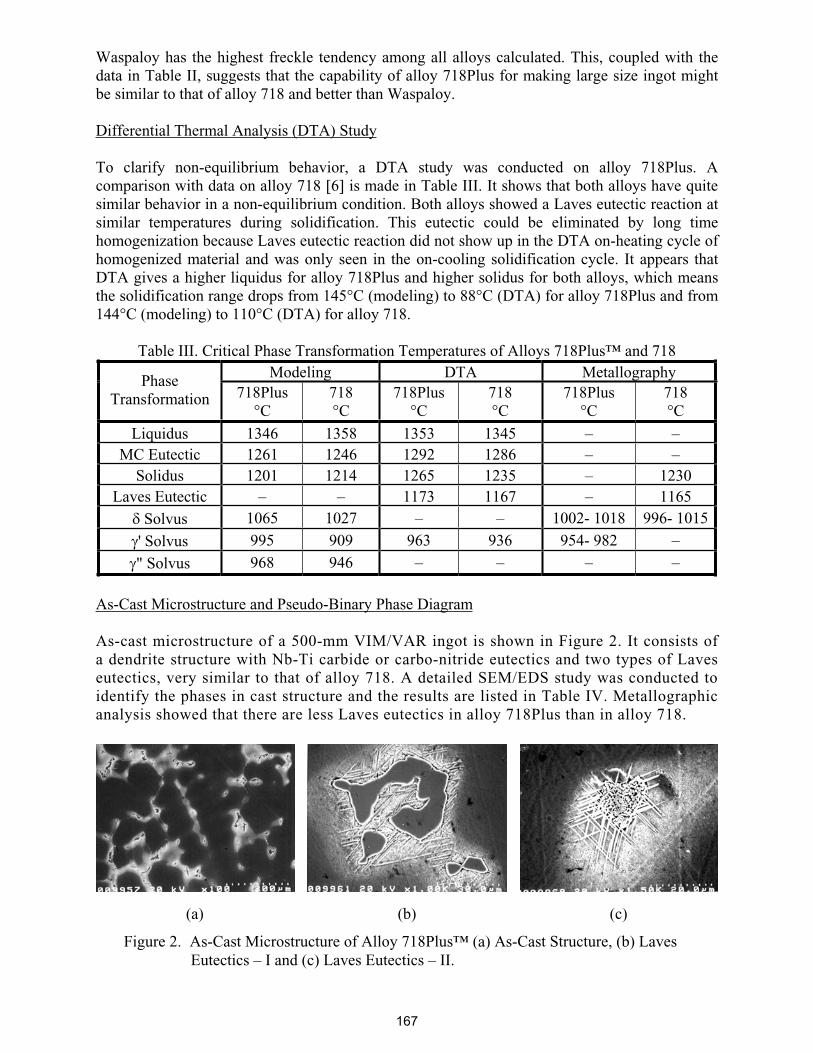
As-cast microstructure of a 500-mm VIM/VAR ingot is shown in Figure 2. It consists of a dendrite structure with Nb-Ti carbide or carbo-nitride eutectics and two types of Laves eutectics, very similar to that of alloy 718. A detailed SEM/EDS study was conducted to identify the phases in cast structure and the results are listed in Table IV. Metallographicanalysis showed that there are less Laves eutectics in alloy 718Plus than in alloy 718.
(a) (b) (c)
Figure 2. As-Cast Microstructure of Alloy 718Plus™ (a) As-Cast Structure, (b) Laves Eutectics – I and (c) Laves Eutectics – II.
167
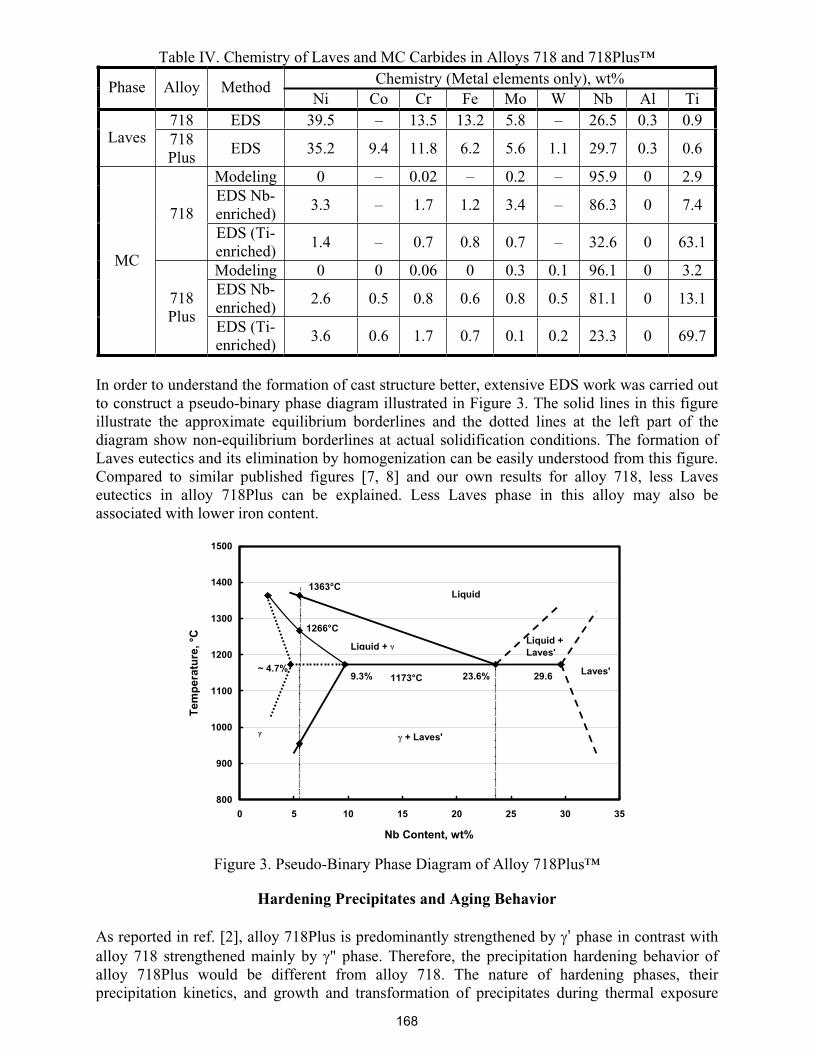
Table IV. Chemistry of Laves and MC Carbides in Alloys 718 and 718Plus™ Chemistry (Metal elements only), wt% Phase Alloy Method
Ni Co Cr Fe Mo W Nb Al Ti718 EDS 39.5 – 13.5 13.2 5.8 – 26.5 0.3 0.9
Laves 718Plus
EDS 35.2 9.4 11.8 6.2 5.6 1.1 29.7 0.3 0.6
Modeling 0 – 0.02 – 0.2 – 95.9 0 2.9EDS Nb-enriched)
3.3 – 1.7 1.2 3.4 – 86.3 0 7.4718EDS (Ti-enriched)
1.4 – 0.7 0.8 0.7 – 32.6 0 63.1
Modeling 0 0 0.06 0 0.3 0.1 96.1 0 3.2EDS Nb-enriched)
2.6 0.5 0.8 0.6 0.8 0.5 81.1 0 13.1
MC
718Plus
EDS (Ti-enriched)
3.6 0.6 1.7 0.7 0.1 0.2 23.3 0 69.7
In order to understand the formation of cast structure better, extensive EDS work was carried out to construct a pseudo-binary phase diagram illustrated in Figure 3. The solid lines in this figure illustrate the approximate equilibrium borderlines and the dotted lines at the left part of the diagram show non-equilibrium borderlines at actual solidification conditions. The formation of Laves eutectics and its elimination by homogenization can be easily understood from this figure. Compared to similar published figures [7, 8] and our own results for alloy 718, less Laves eutectics in alloy 718Plus can be explained. Less Laves phase in this alloy may also be associated with lower iron content.
800
900
1000
1100
1200
1300
1400
1500
0 5 10 15 20 25 30 35
Nb Content, wt%
Tem
per
atu
re, °
C
1173°C
1266°C
1363°C
~ 4.7%9.3% 23.6% 29.6
Liquid
Liquid +
+ Laves'
Laves'
Liquid +Laves'
Figure 3. Pseudo-Binary Phase Diagram of Alloy 718Plus™
Hardening Precipitates and Aging Behavior
As reported in ref. [2], alloy 718Plus is predominantly strengthened by ’ phase in contrast with alloy 718 strengthened mainly by " phase. Therefore, the precipitation hardening behavior of alloy 718Plus would be different from alloy 718. The nature of hardening phases, their precipitation kinetics, and growth and transformation of precipitates during thermal exposure
168
was studied by modeling and various experimental techniques. The aging process and the effect of solution temperature and plastic deformation were also investigated.
Precipitation Hardening Phases
The modeling results of precipitation hardening phases are listed in Table V. It is obvious that the predominant hardening phase in this alloy is ’ phase, and its quantity ranges from 19.7% to 23.2%, depending on the quantity of phase. The ” phase does not exceed 6.64%.
Table V. Modeling Results of Hardening Phases in Alloy 718Plus™ (650°C) Chemistry, wt% Phase Solvus
°C Ni Co Cr Fe Mo W Nb Al TiContent
wt%
With 995 72 3.7 0.9 1.1 0.4 0.9 11.6 5.9 3.5 19.7’
suspended1002 71 3.9 0.9 1.0 0.3 0.8 13.8 5.4 3.0 23.2
”suspended
968 60 5.8 0.3 0.3 0.8 – 32.0 0.5 0.4 6.64
The chemistry and quantity of precipitates in alloy 718Plus were analyzed by X-ray diffraction (XRD) of residual obtained from electrolytic extraction and separation [9], and the results are summarized in Table VI.
Table VI. XRD Results of Precipitation Hardening Phases in Alloy 718Plus™ Crystal
Structure Chemistry, wt%
Precipitates* Lattice a, A Ni Co Cr Fe Mo W Nb Al Ti
Contentat 20°C
wt%
' (+ Few ") FCC 3.62 69 3.0 3.2 1.4 0.5 0.6 14.8 4.8 2.6 20.9
* Sample was heat–treated at 954°C x 1 hr, AC + 788°C x 2 hrs, 55°C/h to 650°C x 8 hrs, AC. Microstructure contains < 0.5% phase. " phase cannot be detected.
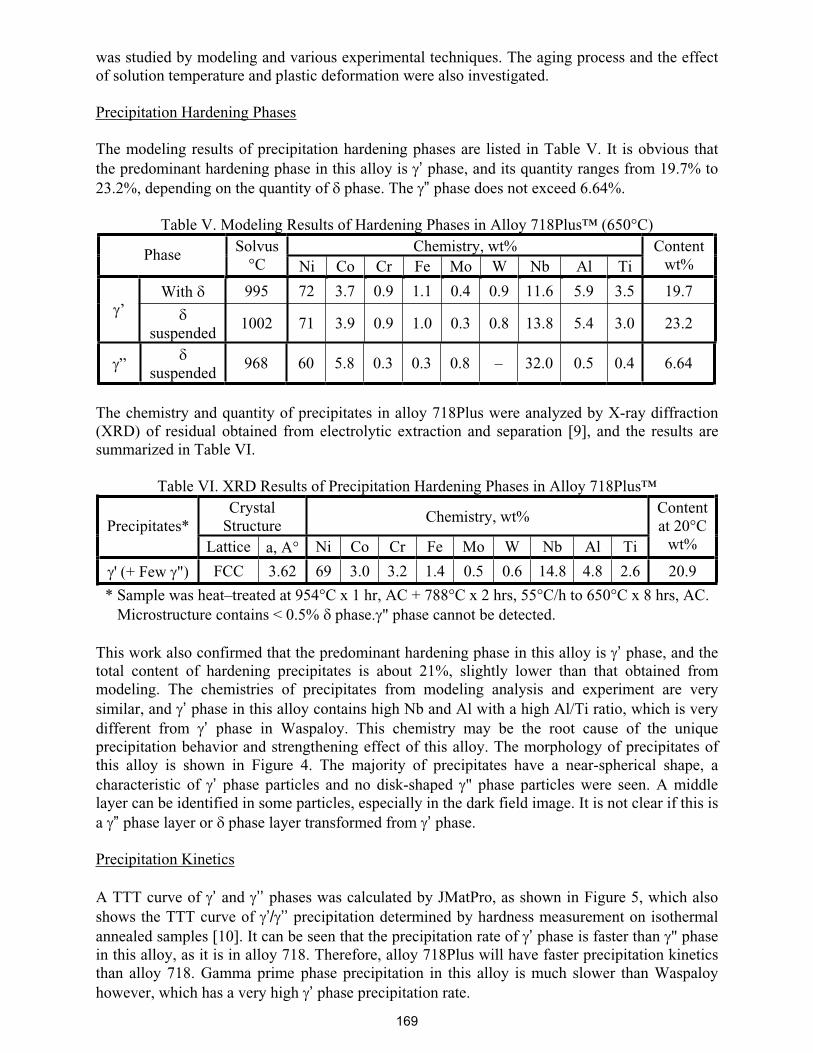
This work also confirmed that the predominant hardening phase in this alloy is ’ phase, and the total content of hardening precipitates is about 21%, slightly lower than that obtained from modeling. The chemistries of precipitates from modeling analysis and experiment are very similar, and ’ phase in this alloy contains high Nb and Al with a high Al/Ti ratio, which is very different from ’ phase in Waspaloy. This chemistry may be the root cause of the unique precipitation behavior and strengthening effect of this alloy. The morphology of precipitates of this alloy is shown in Figure 4. The majority of precipitates have a near-spherical shape, a characteristic of ’ phase particles and no disk-shaped " phase particles were seen. A middle layer can be identified in some particles, especially in the dark field image. It is not clear if this is a ” phase layer or phase layer transformed from ’ phase.
Precipitation Kinetics
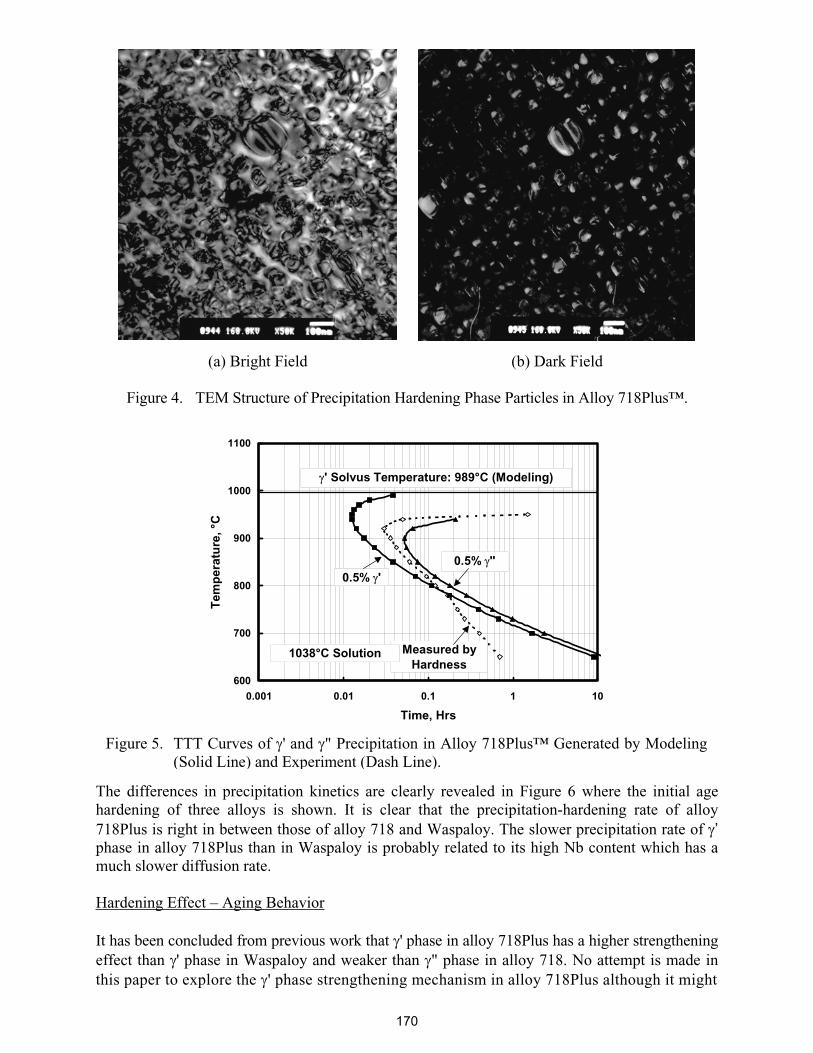
A TTT curve of ’ and ’’ phases was calculated by JMatPro, as shown in Figure 5, which also shows the TTT curve of ’/ ’’ precipitation determined by hardness measurement on isothermal annealed samples [10]. It can be seen that the precipitation rate of ’ phase is faster than " phase in this alloy, as it is in alloy 718. Therefore, alloy 718Plus will have faster precipitation kinetics than alloy 718. Gamma prime phase precipitation in this alloy is much slower than Waspaloy however, which has a very high ’ phase precipitation rate.
169
(a) Bright Field (b) Dark Field
Figure 4. TEM Structure of Precipitation Hardening Phase Particles in Alloy 718Plus™.
600
700
800
900
1000
1100
0.001 0.01 0.1 1 10
Time, Hrs
Tem
per
atu
re, °
C
Measured byHardness
0.5% "0.5% '
1038°C Solution
' Solvus Temperature: 989°C (Modeling)
Figure 5. TTT Curves of ' and " Precipitation in Alloy 718Plus™ Generated by Modeling(Solid Line) and Experiment (Dash Line).
The differences in precipitation kinetics are clearly revealed in Figure 6 where the initial agehardening of three alloys is shown. It is clear that the precipitation-hardening rate of alloy 718Plus is right in between those of alloy 718 and Waspaloy. The slower precipitation rate of ’phase in alloy 718Plus than in Waspaloy is probably related to its high Nb content which has a much slower diffusion rate.
Hardening Effect – Aging Behavior
It has been concluded from previous work that ' phase in alloy 718Plus has a higher strengtheningeffect than ' phase in Waspaloy and weaker than " phase in alloy 718. No attempt is made in this paper to explore the ' phase strengthening mechanism in alloy 718Plus although it might
170
15
20
25
30
35
40
0 10 20 30 40 50 60 70
Aging Time, minutes
Hard
nes
s,
HR
C
T = 704°C
Waspaloy
718Plus
Alloy 718
10
15
20
25
30
35
0 10 20 30 40 50 60 70
Aging Time, minutes
Hard
ness, H
RC
T = 650°C
Alloy 718
718Plus
Waspaloy
(a) (b)
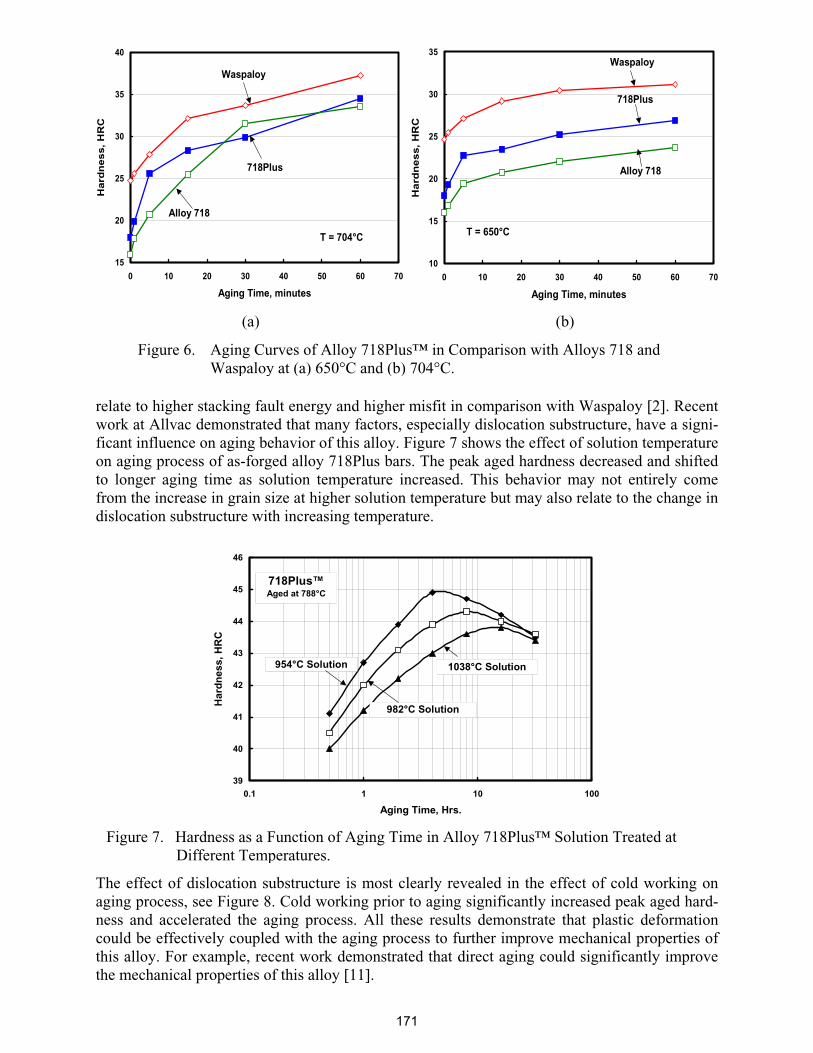
Figure 6. Aging Curves of Alloy 718Plus™ in Comparison with Alloys 718 and Waspaloy at (a) 650°C and (b) 704°C.
relate to higher stacking fault energy and higher misfit in comparison with Waspaloy [2]. Recent work at Allvac demonstrated that many factors, especially dislocation substructure, have a signi-ficant influence on aging behavior of this alloy. Figure 7 shows the effect of solution temperatureon aging process of as-forged alloy 718Plus bars. The peak aged hardness decreased and shifted to longer aging time as solution temperature increased. This behavior may not entirely comefrom the increase in grain size at higher solution temperature but may also relate to the change in dislocation substructure with increasing temperature.
39
40
41
42
43
44
45
46
0.1 1 10 100
Aging Time, Hrs.
Har
dn
ess,
HR
C
718Plus™Aged at 788°C
954°C Solution
982°C Solution
1038°C Solution
Figure 7. Hardness as a Function of Aging Time in Alloy 718Plus™ Solution Treated at Different Temperatures.
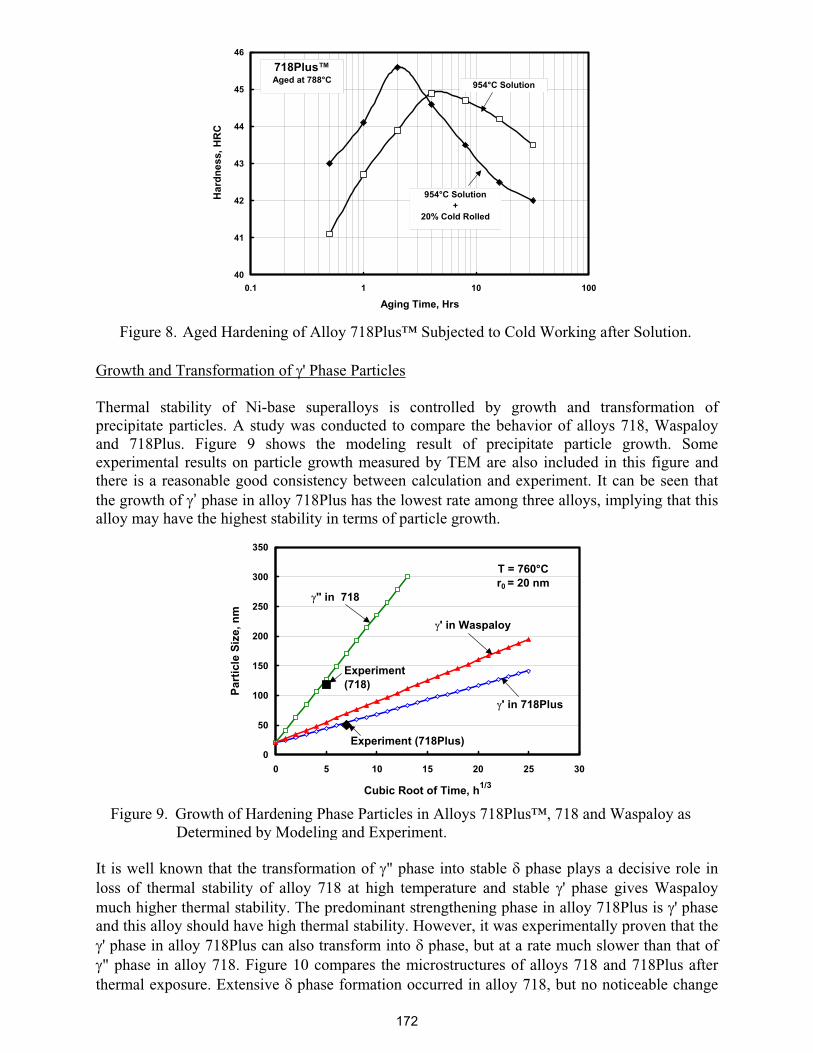
The effect of dislocation substructure is most clearly revealed in the effect of cold working on aging process, see Figure 8. Cold working prior to aging significantly increased peak aged hard-ness and accelerated the aging process. All these results demonstrate that plastic deformationcould be effectively coupled with the aging process to further improve mechanical properties of this alloy. For example, recent work demonstrated that direct aging could significantly improvethe mechanical properties of this alloy [11].
171
40
41
42
43
44
45
46
0.1 1 10 100
Aging Time, Hrs
Har
dn
ess,
HR
C
954°C Solution
954°C Solution+
20% Cold Rolled
718Plus™Aged at 788°C
Figure 8. Aged Hardening of Alloy 718Plus™ Subjected to Cold Working after Solution.
Growth and Transformation of ' Phase Particles
Thermal stability of Ni-base superalloys is controlled by growth and transformation of precipitate particles. A study was conducted to compare the behavior of alloys 718, Waspaloy and 718Plus. Figure 9 shows the modeling result of precipitate particle growth. Someexperimental results on particle growth measured by TEM are also included in this figure and there is a reasonable good consistency between calculation and experiment. It can be seen that the growth of ’ phase in alloy 718Plus has the lowest rate among three alloys, implying that this alloy may have the highest stability in terms of particle growth.
0
50
100
150
200
250
300
350
0 5 10 15 20 25 30
Cubic Root of Time, h1/3
Par
ticl
e S
ize,
nm
" in 718
' in 718Plus
' in Waspaloy
Experiment (718Plus)
Experiment(718)
T = 760°Cr0 = 20 nm
Figure 9. Growth of Hardening Phase Particles in Alloys 718Plus™, 718 and Waspaloy as Determined by Modeling and Experiment.
It is well known that the transformation of " phase into stable phase plays a decisive role in loss of thermal stability of alloy 718 at high temperature and stable ' phase gives Waspaloymuch higher thermal stability. The predominant strengthening phase in alloy 718Plus is ' phaseand this alloy should have high thermal stability. However, it was experimentally proven that the' phase in alloy 718Plus can also transform into phase, but at a rate much slower than that of" phase in alloy 718. Figure 10 compares the microstructures of alloys 718 and 718Plus after
thermal exposure. Extensive phase formation occurred in alloy 718, but no noticeable change
172
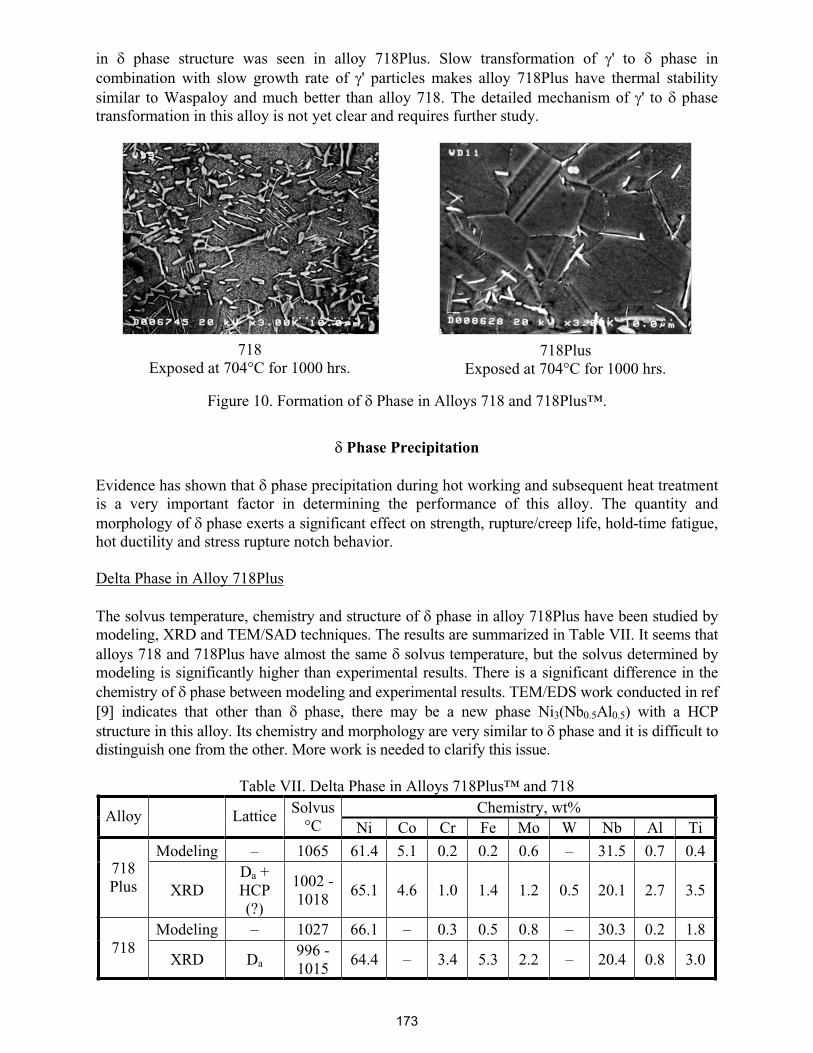
in phase structure was seen in alloy 718Plus. Slow transformation of ' to phase in combination with slow growth rate of ' particles makes alloy 718Plus have thermal stability similar to Waspaloy and much better than alloy 718. The detailed mechanism of ' to phasetransformation in this alloy is not yet clear and requires further study.
718Exposed at 704°C for 1000 hrs.
718PlusExposed at 704°C for 1000 hrs.
Figure 10. Formation of Phase in Alloys 718 and 718Plus™.
Phase Precipitation
Evidence has shown that phase precipitation during hot working and subsequent heat treatmentis a very important factor in determining the performance of this alloy. The quantity and morphology of phase exerts a significant effect on strength, rupture/creep life, hold-time fatigue,hot ductility and stress rupture notch behavior.
Delta Phase in Alloy 718Plus
The solvus temperature, chemistry and structure of phase in alloy 718Plus have been studied by modeling, XRD and TEM/SAD techniques. The results are summarized in Table VII. It seems thatalloys 718 and 718Plus have almost the same solvus temperature, but the solvus determined by modeling is significantly higher than experimental results. There is a significant difference in the chemistry of phase between modeling and experimental results. TEM/EDS work conducted in ref[9] indicates that other than phase, there may be a new phase Ni3(Nb0.5Al0.5) with a HCP structure in this alloy. Its chemistry and morphology are very similar to phase and it is difficult to distinguish one from the other. More work is needed to clarify this issue.
Table VII. Delta Phase in Alloys 718Plus™ and 718 Chemistry, wt% Alloy Lattice Solvus
°C Ni Co Cr Fe Mo W Nb Al Ti
Modeling – 1065 61.4 5.1 0.2 0.2 0.6 – 31.5 0.7 0.4718Plus XRD
Da + HCP(?)
1002 -1018
65.1 4.6 1.0 1.4 1.2 0.5 20.1 2.7 3.5
Modeling – 1027 66.1 – 0.3 0.5 0.8 – 30.3 0.2 1.8718
XRD Da996 -1015
64.4 – 3.4 5.3 2.2 – 20.4 0.8 3.0
173
Precipitation Kinetics
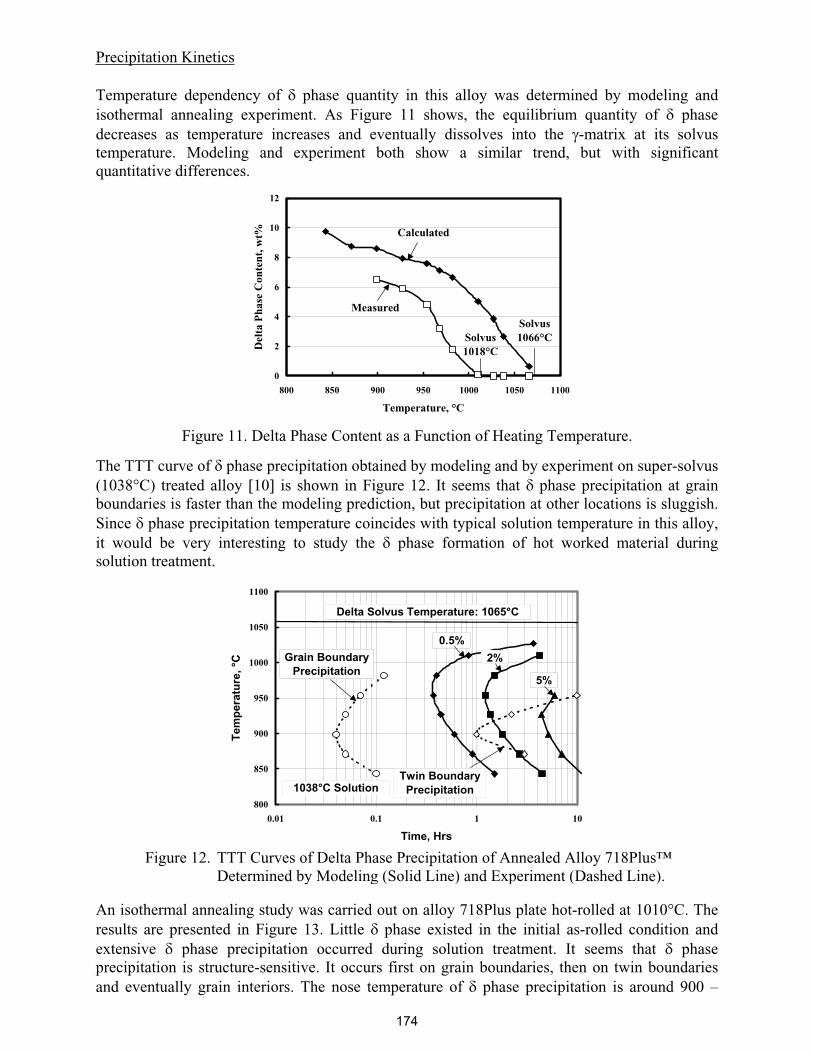
Temperature dependency of phase quantity in this alloy was determined by modeling and isothermal annealing experiment. As Figure 11 shows, the equilibrium quantity of phasedecreases as temperature increases and eventually dissolves into the -matrix at its solvustemperature. Modeling and experiment both show a similar trend, but with significant quantitative differences.
0
2
4
6
8
10
12
800 850 900 950 1000 1050 1100
Temperature, °C
Del
ta P
hase
Con
tent
, wt%
Measured
Calculated
Solvus1018°C
Solvus1066°C
Figure 11. Delta Phase Content as a Function of Heating Temperature.
The TTT curve of phase precipitation obtained by modeling and by experiment on super-solvus (1038°C) treated alloy [10] is shown in Figure 12. It seems that phase precipitation at grain boundaries is faster than the modeling prediction, but precipitation at other locations is sluggish. Since phase precipitation temperature coincides with typical solution temperature in this alloy, it would be very interesting to study the phase formation of hot worked material during solution treatment.
800
850
900
950
1000
1050
1100
0.01 0.1 1 10
Time, Hrs
Tem
per
atu
re, °
C
0.5%
5%
Grain BoundaryPrecipitation
Twin BoundaryPrecipitation
Delta Solvus Temperature: 1065°C
1038°C Solution
2%
Figure 12. TTT Curves of Delta Phase Precipitation of Annealed Alloy 718Plus™ Determined by Modeling (Solid Line) and Experiment (Dashed Line).
An isothermal annealing study was carried out on alloy 718Plus plate hot-rolled at 1010°C. The results are presented in Figure 13. Little phase existed in the initial as-rolled condition andextensive phase precipitation occurred during solution treatment. It seems that phaseprecipitation is structure-sensitive. It occurs first on grain boundaries, then on twin boundaries and eventually grain interiors. The nose temperature of phase precipitation is around 900 –
174
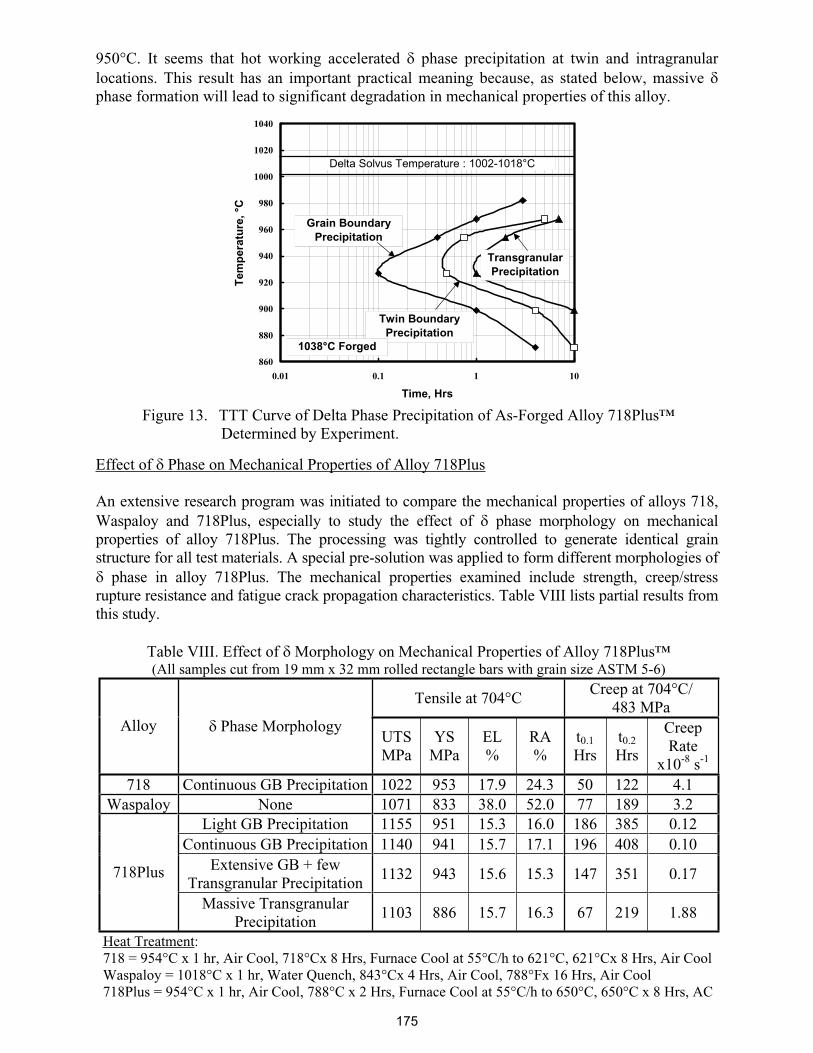
950°C. It seems that hot working accelerated phase precipitation at twin and intragranular locations. This result has an important practical meaning because, as stated below, massivephase formation will lead to significant degradation in mechanical properties of this alloy.
860
880
900
920
940
960
980
1000
1020
1040
0.01 0.1 1 10
Time, Hrs
Tem
per
atu
re, °
CGrain Boundary
Precipitation
Twin BoundaryPrecipitation
TransgranularPrecipitation
Delta Solvus Temperature : 1002-1018°C
1038°C Forged
Figure 13. TTT Curve of Delta Phase Precipitation of As-Forged Alloy 718Plus™ Determined by Experiment.
Effect of Phase on Mechanical Properties of Alloy 718Plus
An extensive research program was initiated to compare the mechanical properties of alloys 718,Waspaloy and 718Plus, especially to study the effect of phase morphology on mechanicalproperties of alloy 718Plus. The processing was tightly controlled to generate identical grain structure for all test materials. A special pre-solution was applied to form different morphologies of phase in alloy 718Plus. The mechanical properties examined include strength, creep/stress
rupture resistance and fatigue crack propagation characteristics. Table VIII lists partial results fromthis study.
Table VIII. Effect of Morphology on Mechanical Properties of Alloy 718Plus™(All samples cut from 19 mm x 32 mm rolled rectangle bars with grain size ASTM 5-6)
Tensile at 704°C Creep at 704°C/
483 MPa Alloy Phase Morphology
UTSMPa
YSMPa
EL%
RA%
t0.1
Hrst0.2
Hrs
CreepRate
x10-8 s-1
718 Continuous GB Precipitation 1022 953 17.9 24.3 50 122 4.1Waspaloy None 1071 833 38.0 52.0 77 189 3.2
Light GB Precipitation 1155 951 15.3 16.0 186 385 0.12Continuous GB Precipitation 1140 941 15.7 17.1 196 408 0.10
Extensive GB + fewTransgranular Precipitation
1132 943 15.6 15.3 147 351 0.17718Plus
Massive TransgranularPrecipitation
1103 886 15.7 16.3 67 219 1.88
Heat Treatment:718 = 954°C x 1 hr, Air Cool, 718°Cx 8 Hrs, Furnace Cool at 55°C/h to 621°C, 621°Cx 8 Hrs, Air CoolWaspaloy = 1018°C x 1 hr, Water Quench, 843°Cx 4 Hrs, Air Cool, 788°Fx 16 Hrs, Air Cool 718Plus = 954°C x 1 hr, Air Cool, 788°C x 2 Hrs, Furnace Cool at 55°C/h to 650°C, 650°C x 8 Hrs, AC
175
The complete results of this study will be reported elsewhere. As one can see, alloy 718Plus does show strength and creep resistance superior to both 718 and Waspaloy, and phase morphology has a significant effect on its mechanical properties. The optimum morphology would be a smallamount of nearly-continuous, short rod-shaped particles on the majority of grain boundaries. Mechanical properties significantly degraded once massive transgranular, long needle-like phaseparticle formation occurred. However, too few phase particles in this alloy may cause some otherproblems such as low hot ductility and stress rupture notch sensitivity.
Table IX shows the effect of solution temperature and time on the mechanical properties of alloy 718Plus that has very few phase particles prior to solution treatment. Massive transgranular precipitation of phase particles occurred with long solution time at 954°C, which led to reductionin both strength and rupture life. Solution at 982°C caused low ductility and especially notch break in stress rupture test, most likely due to lack of phase precipitation at this temperature.
Table IX. Effect of Solution Temperature and Time on Mechanical Propertiesof Alloy 718Plus™
Tensile at 704°C Stress Rupture at 704°C/552 MPa Solution
TemperatureSolution
Time UTSMPa
YSMPa
EL%
RA%
LifeHrs.
EL%
1 hr. 1174 1005 24.1 30.7 433.1 35.43 hrs. 1120 914 27.8 33.8 190.4 32.8
954°C
4 hrs. 1121 942 25.8 30.6 185.1 47.51 hr. 1108 863 12.4 14.1 1.9 NB3 hrs. 969 745 8.3 12.5 0.3 NB
982°C
4 hrs. 958 739 9.1 15.3 0.3 NBAging Treatment: 788°C x 2 Hrs. Furnace Cool at 55°C/hr. to 650°C x 8 Hrs., Air Cool
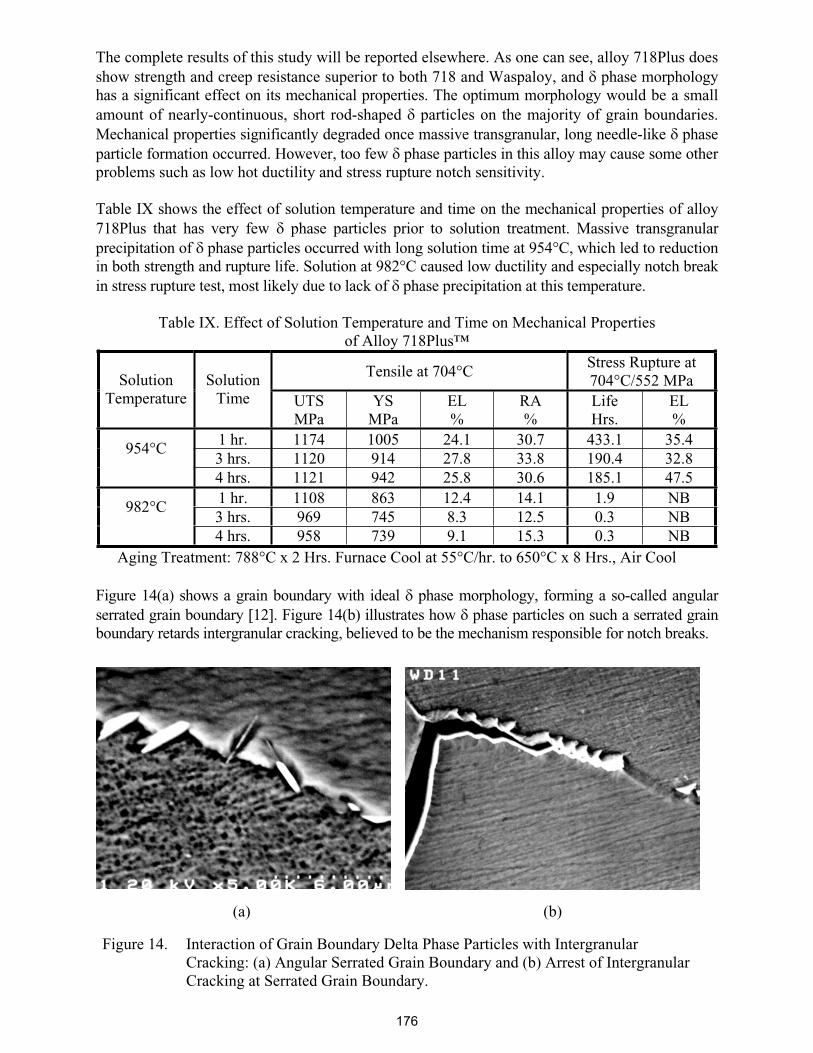
Figure 14(a) shows a grain boundary with ideal phase morphology, forming a so-called angular serrated grain boundary [12]. Figure 14(b) illustrates how phase particles on such a serrated grainboundary retards intergranular cracking, believed to be the mechanism responsible for notch breaks.
(a) (b)
Figure 14. Interaction of Grain Boundary Delta Phase Particles with Intergranular Cracking: (a) Angular Serrated Grain Boundary and (b) Arrest of Intergranular Cracking at Serrated Grain Boundary.
176
Conclusions
A significant amount of effort has gone into understanding the metallurgy of alloy 718Plus in order to be able to relate processing, structure and properties. Some of the conclusions drawn to date include the following:
1. Solidification characteristics of alloy 718Plus are very similar to those of alloy 718. It should be possible to make alloy 718Plus ingot as large as that of alloy 718.
2. The predominant precipitation hardening phase of this alloy is ' phase containing high levels of Nb and Al. The precipitation and growth rates of ' phase in this alloy are slow in comparison with other ' phase strengthening alloys such as Waspaloy, probably due to low diffusivity of Nb.
3. Solution temperature and plastic deformation can drastically alter the kinetics of ' phase precipitation.
4. Alloy 718Plus has high resistance to phase formation and therefore high thermal stability. The quantity and morphology of phase particles strongly affect the mechanical properties of this alloy. A small quantity of short, rod-shaped phase particles precipitated in a nearly continuous manner on grain boundaries can improve mechanical properties, especially preventing stress rupture notch sensitivity.
References
1. W.D. Cao, US Patent No.: 6,730.254 B2, 2004.
2. W.D. Cao and R.L. Kennedy, Superalloy 2004, ed. K.A. Green et al., TMS, 2004, 91–99.
3. R.L. Kennedy, W.D. Cao, T.D. Bayha and R. Jeniski, Niobium, High Temperature Applications, ed. Y.W. Kim et al., TMS, 2003, 11-22.
4. W.D. Cao and R.L. Kennedy, Acta Metallugica Sinica, Vol. 18, 2005, 39–46.
5. S. Ballantyne, Allvac Internal Report, 2004.
6. W.D. Cao, R.L. Kennedy and M.P. Willis, Superalloys 718, 625 and Various Derivatives,ed. E.A. Loria, TMS, 1991, 147–160.
7. G.K. Bouse, Superalloys 718 – Metallurgy and Applications, ed. E.A. Loria, TMS, 1989, 69-77.
8. M.J. Cieslak, G.A. Knorovsky, T.J. Headley and A.D. Romig, Jr, Superalloys 718 – Metallurgy and Applications, ed. E.A. Loria, TMS, 1989, 59-68.
9. X.S. Xie, G.L. Wang, J.X. Dong, G.M. Xu, W.D. Cao and R.L. Kennedy, Superalloys 718, 625 and Various Derivatives, ed. E.A. Loria, TMS, 2005.
10. X.S. Xie, G.M. Xu, G.L. Wang, J.X. Dong, W.D. Cao and R.L. Kennedy, Superalloys 718, 625 and Various Derivatives, ed. E.A. Loria, TMS, 2005.
11. W.D. Cao and R.L. Kennedy, Superalloys 718, 625 and Various Derivatives, ed. E.A. Loria, TMS, 2005.
12. A.K. Koul and R. Thamburaj, Metall. Trans., Vol. 16A, 1985, p. 17.
177
![Investigation of Homogenization and its Influence on the ... · Alloy 718 [3] although the chemistry of the cast version of Allvac 718Plus alloy is not yet firmly established and](https://static.fdocuments.net/doc/165x107/5e331fbb9546b22f4c43034f/investigation-of-homogenization-and-its-influence-on-the-alloy-718-3-although.jpg)