Solid Waste Plan 2040 - Needs Assessment -...
60
Needs Assessment
Transcript of Solid Waste Plan 2040 - Needs Assessment -...

Needs Assessment

Solid Waste Plan 2040 Page i Needs Assessment
Table of Contents Section 1 –– Introduction ........................................................................................................... 1
1.1 Background.................................................................................................................. 1
1.2 Solid Waste Types Managed ....................................................................................... 2
1.3 Needs Assessment Contents ....................................................................................... 3
Section 2 – Planning Area .......................................................................................................... 4
2.1 Population .................................................................................................................... 4
2.2 Employment Data ........................................................................................................ 5
2.3 Urban Growth Patterns ................................................................................................ 5
Section 3 – Current Waste Management Practices .................................................................... 7
3.1 Solid Waste and Recyclables Collection Practices ....................................................... 7
3.1.1 Recyclables and Yard Waste Collection ................................................................... 8
3.2 Waste Handling and Management Facilities ................................................................ 9
3.2.1 Recycling Processing Centers .................................................................................. 9
3.2.2 Transfer Stations ...................................................................................................... 9
3.2.3 Waste Diversion Programs ......................................................................................10
3.3 Disposal Facilities .......................................................................................................17
3.3.1 Bluff Road Landfill ...................................................................................................17
3.3.2 North 48th Street C&D Landfill .................................................................................18
3.3.3 Other Disposal Facilities ..........................................................................................19
3.3.4 Competing Facilities ................................................................................................19
3.4 Regulatory/Permit Requirements ................................................................................20
3.4.1 The Integrated Solid Waste Management Act .........................................................20
3.4.2 Lincoln Municipal Code ...........................................................................................22
3.4.3 NDEQ Regulatory Requirements .............................................................................23
3.4.4 Transfer Stations and Processing Facilities .............................................................24
3.4.5 C&D Processing and Disposal .................................................................................24
3.4.6 Waste-to-Energy .....................................................................................................25
3.4.7 Handling Requirements for Unique, Universal and Special Wastes .........................25
3.5 Greenhouse Gas Emissions from the Solid Waste Management System ...................27
3.5.1 GHG from Solid Waste Collection System ...............................................................28
3.5.2 Solid Waste Operations Energy Use Impacts ..........................................................30
3.5.3 LFG Emission Impacts ............................................................................................30
3.5.4 Material Recovery Diversion Credits ........................................................................31

Solid Waste Plan 2040 Page ii Needs Assessment
Section 4 – Generation and Composition ..................................................................................32
4.1 Historical Waste Generation .......................................................................................32
4.2 Reporting and Data Collection Methods ......................................................................32
4.3 Analysis Methodology .................................................................................................32
4.4 Generation Rates ........................................................................................................32
4.5 Seasonal Fluctuations .................................................................................................34
4.6 Waste Composition .....................................................................................................34
4.7 Waste Diversion ..........................................................................................................36
Section 5 – Future Management and Disposal Needs...............................................................37
5.1 Future Quantity Forecasts ...........................................................................................37
5.2 Waste Disposal Capacity ............................................................................................38
5.3 Facilities Needs ..........................................................................................................39
5.4 Management Programs ..............................................................................................39
5.5 Regulatory/Permit Requirements ................................................................................40
5.6 Regional Programs and Facilities ................................................................................41
5.7 Summary of Solid Waste Management Needs ............................................................41
5.8 Forecast Variables ......................................................................................................41
5.9 Waste Tracking Needs ................................................................................................44
List of Tables Table 2-1 – 2010 U.S. Census Data ........................................................................................... 4
Table 2-2 – LPlan 2040 Plan Population Projections .................................................................. 5
Table 2-3 – 2010 Lancaster County Employment Data .............................................................. 5
Table 3-1 –Tons of Materials Recycled at Public Drop-off Sites ................................................12
Table 3-2 – Tons of Materials Recycled (Reported by Private-Sector) ......................................13
Table 3-3 – Recycled Tons of Concrete and Asphalt Reported by Private-Sector .....................14
Table 3-4 – Pounds of HHW Collected Per Year .......................................................................16
Table 3-5 – Historical Quantities Disposed from Planning Area (Tons) .....................................18
Table 3-6 – Regional Landfills (2012$) ......................................................................................20
Table 3-7 – GHG Emission Factors ...........................................................................................28
Table 3-8 – Estimated Annual Refuse Collection Related GHG Emissions (MTCO2e) .............29
Table 3-9 – Average Annual GHG Emissions from Solid Waste Operations .............................30
Table 3-10 – Estimated Annual GHG Emissions from City Landfills in 2011/2012 .....................31
Table 4-1 – Historical Solid Waste Generation Tonnage in Lancaster County ...........................33
Table 4-2 – 2008 Nebraska Waste Characterization Study (Bluff Road Landfill) – Consolidated Composition Data .......................................................................... 35

Solid Waste Plan 2040 Page iii Needs Assessment
Table 5-1 – Waste Generation Projections ................................................................................37
Table 5-2 – Comparison of Projected MSW Generated for Disposal, Tons ...............................38
List of Figures Figure 2-1 – Lincoln-Lancaster Urban Growth Projections ......................................................... 6
Figure 5-1 – 2011 Waste Disposal and Diversion, by Percentage .............................................39
Figure 5-2 – Waste Generation and Management Baseline ......................................................43
List of Appendices Appendix A 2008 Nebraska Waste Characterization Study – Excerpts
Appendix B Waste Generation Projections

Solid Waste Plan 2040 Page 1 Needs Assessment
Section 1 –– Introduction The purpose of this Needs Assessment is to assist the City of Lincoln (City) and Lancaster County (County) (collectively City-County) in assessing their existing solid waste management systems, facilities, programs and planning for future needs in Lincoln and Lancaster County (Planning Area). The information and projections presented in this report were prepared to establish a basis for the development of the long-term, comprehensive, integrated solid waste management plan (Solid Waste Plan 2040 or Plan).
This Needs Assessment addresses:
1) The volumes and types of waste being generated; 2) The existing waste management practices; and 3) The anticipated future waste management needs in the Planning Area.
Regulatory and environmental information is included to provide a broad-based perspective on existing conditions and future practices that may be affected by regulatory and environmental changes. Because regional market forces external to the Planning Area have some potential to affect the long-term plans, a limited amount of background data on regional solid waste practices have also been provided for informational purposes.
This Needs Assessment establishes the foundation for solid waste management planning, system and facility identification, and sizing of components. This report will also serve as a tool for use in communicating the overall City-County basis for future actions.
This Needs Assessment provides a definition of the status of the current systems, facilities and program activities, documents and known information on waste diversion efforts and serves as a resource in developing the Solid Waste Plan 2040.
1.1 Background In 1991 to 1993 the City worked with citizen advisory committees to develop a solid waste management plan for Lincoln and Lancaster County. The plan provided a "blueprint for action" for local solid waste management to achieve state waste reduction and recycling goals and establish a plan for management of solid waste for the subsequent 20 years. The plan was adopted and submitted to the Nebraska Department of Environmental Quality (NDEQ) for their review in September 1994, and was intended to cover the period from 1995 through 2015.
The original planning effort was undertaken, in part, to conform to the Integrated Solid Waste Management Act (Nebraska Revised Statutes Section 13-2001 to 2043) for Nebraska communities. The current planning effort is also intended to complement and enhance other planning efforts in the City and County, including the Lincoln-Lancaster County 2040 Comprehensive Plan (LPlan 2040).
Two solid waste guiding principles were identified in the LPlan2040. They are as follows:
♦ “No out-of-county waste is accepted for landfill disposal. This policy reserves landfill capacity for city and county residents and allow administration of programs under existing authorities.
♦ The City policy of privately owned and operated collection of refuse and recyclables coupled with public ownership, operation and financing of disposal and selected integrated solid waste management services will continue during the planning period.”
LPlan2040 also identified six strategies for solid waste management:

Solid Waste Plan 2040 Page 2 Needs Assessment
♦ Develop standards for future commercial and industrial development to ensure proper space for separation and handling of recyclables and solid waste. Investigate amending zoning ordinances to encourage new commercial centers to provide space for recycling drop-off facilities.
♦ Discourage future urban acreage developments in the area around the Bluff Road Landfill and LES power generating operations, which are located between N. 56th Street and N. 84th Streets. Acreage development could impact the current and future landfill and LES operations.
♦ Develop a 20-year comprehensive integrated Solid Waste Management Plan for Lincoln/Lancaster County.
♦ Create a county-wide integrated efficient environmentally safe and conservation-oriented recycling and waste management system. Promote and support markets for waste materials and recycled products.
♦ Minimize the use of energy in Solid Waste Management processes. ♦ Continue the development of the Landfill Gas Collection and Control Project.
As a part of the Solid Waste Plan 2040 development the City-County have identified five guiding principles:
♦ Encourage the COMMUNITY ♦ Encourage PUBLIC-PRIVATE PARTNERSHIPS ♦ Ensure sufficient SYSTEM CAPACITY ♦ Emphasize the WASTE MANAGEMENT HIERARCHY ♦ Embrace SUSTAINABLE PRINCIPLES
1.2 Solid Waste Types Managed The solid waste streams that will be considered in the Plan include:
♦ Solid waste from residential sources; ♦ Solid waste from commercial (business, industrial, and institutional) sources; ♦ Building rubbish and demolition debris; ♦ Other wastes, including the following:
o Household hazardous waste (HHW); and Conditionally Exempt Small Quantity Generator (CESQG) Wastes, those needing special handling and banned wastes.
o Recycled and diverted Material.
Solid waste from residential and commercial sources are collectively referred to as Municipal Solid Waste (MSW)
Wastewater treatment sludge (biosolids) and coal combustion residues (CCR) are not included in the Plan.
Solid waste, as defined in Section 8.32.010 of the Lincoln Municipal Code (LMC), includes but is not limited to the following items:
♦ Garbage ♦ Refuse ♦ Commercial and industrial wastes ♦ Demolition debris ♦ Building rubbish ♦ Special Waste ♦ Lawn waste

Solid Waste Plan 2040 Page 3 Needs Assessment
All of the above terms, which are part of the definition of solid waste, are further defined in the LMC. By the definition of “refuse” in the LMC, solid waste excludes “recyclables that have been separated out at the source.”
1.3 Needs Assessment Contents In order to continue to provide for the orderly, efficient and safe collection, diversion, recycling and disposal of solid waste, the City-County is preparing a Plan to address its needs for the 30-year period from 2012 to 2042. To achieve this objective, it is necessary to compile and update data available on the existing solid waste management systems, facilities and programs and to project the types and quantities of waste that need to be managed in the future.
The Needs Assessment is divided into five sections. This first section is an introduction, describing the regulatory and planning background, and guiding principles.
Section 2 – Planning Area describes the various demographic and geographic data sources related to this Needs Assessment. Included in this section are the historical population data and recent estimates of population and employment. The population data include projections that are used to help identify and project future solid waste quantities.
Section 3 – Current Waste Management Practices describes current waste management practices, including the collection, transportation, waste diversion/reduction, and disposal of solid waste generated in the City-County. This section also addresses regulatory and environmental information to provide a broad-based perspective on existing conditions.
Section 4 – Generation and Composition presents waste generation and compositional data and establishes relationships and the methodology used to estimate future waste quantities.
Section 5 – Future Management and Disposal Needs presents waste quantity projections based on historical generation rates and forecasted changes in demographics of the Planning Area. This section also addresses such topics as (landfill) waste disposal capacity, facility needs, management programs, regulatory/permit requirements, and related systems, facilities and program management needs.

Solid Waste Plan 2040 Page 4 Needs Assessment
Section 2 – Planning Area Solid waste management is a dynamic industry and is affected by changes in the economy, laws, public policy and other considerations. As such, this Needs Assessment looked at key demographic factors as key predictors of waste management and disposal needs within the Planning Area. Some of the variables that directly affect the generation of solid waste are:
♦ Population ♦ Levels of employment in various business and industry types ♦ Economic conditions ♦ Level of transient/seasonal visitors
The solid waste Planning Area is the County (See Figure 2-1); but because most of the population resides in the City, the majority of the evaluation focuses on the City. Located in southeastern Nebraska about 50 miles west of the Missouri River, the County, like other counties surrounding it, is primarily agricultural. The County has a large urbanized area, the City, in its geographic center. The County covers a geographic area of approximately 847 square miles; the City has corporate limits of approximately 80 square miles.
2.1 Population In 2010, the U.S. Census reported that the total population of the County was 285,407. The City is the second largest community in the State of Nebraska, with a 2010 census reported population of 258,379. This represents 91 percent of the County's population. Table 2-1 lists the County's 2010 population by community. There are two other cities, ten villages and two census-designated places in the County. The census also reported a total of 113,373 occupied housing units in the County in 2010. This represented a 14.3 percent increase over 2000. It is estimated that 21 percent of the population in the Planning Area reside in multi-family housing units. The census data also indicate that an average household size is approximately 2.5 people.
Table 2-1 – 2010 U.S. Census Data
Place2010
Population Percent Bennet village 719 0.25% Davey village 154 0.05% Denton village 190 0.07% Firth village 590 0.21% Hallam village 213 0.07% Hickman city 1,657 0.58% Lincoln city 258,379 90.53% Malcolm village 382 0.13% Panama village 256 0.09% Raymond village 167 0.06% Roca village 220 0.08% Sprague village 142 0.05% Walton CDP 306 0.11% Waverly city 3,277 1.15% Yankee Hill CDP 292 0.10%Unincorporated Area 18,463 6.47%Lancaster County 285,407 100%
Source: http://2010.census.gov/2010census/

Solid Waste Plan 2040 Page 5 Needs Assessment
The census data for the County show a population increase of approximately 33.6 percent (an average of 2.9 percent per year) from a base of 213,642 in 1990. This population growth has also resulted in an increase in solid waste generated in the County.
Table 2-2 lists the County's population projections though 2040 as presented in the LPlan 2040. The “Trend Series” projections, which were developed prior to finalization of the 2010 Census, most closely match the census results. Therefore, the Trend Series was selected for use in baseline projections for the Needs Assessment; the actual census data were used for evaluations of 2010 data. The Trend Series growth assumptions were applied to the 2010 census data.
Table 2-2 – LPlan 2040 Plan Population Projections Source Year Low Series Trend Series High SeriesCensus 2000 250,291 250,291 250,291 Projected 2010 282,434 286,955 291,371 Projected 2015 297,229 306,711 316,218 Projected 2020 311,915 326,864 341,752 Projected 2025 327,881 347,088 366,713 Projected 2030 344,864 368,844 393,900 Projected 2035 364,809 390,838 418,456 Projected 2040 384,781 412,697 442,507
2.2 Employment Data Based on the U.S. Department of Labor, Bureau of Labor Statistics data, there were a total 152,806 jobs in the County in 2010. Table 2-3 summarizes the employment by various employment categories. Since there are no employment growth projections available, only population forecasts will be used to prepare future solid waste projections.
Table 2-3 – 2010 Lancaster County Employment Data Employment Categories 2010 PercentNatural Resources and Mining 341 0.2%Construction 6,464 4.2%Manufacturing 11,695 7.7%Trade Transportation and Utilities 29,887 19.6%Information 2,145 1.4%Financial Activities 11,528 7.5%Professional and Business Services 17,449 11.4%Education and Health Services` 38,602 25.3%Leisure and Hospitality 15,568 10.2%Other Services 4,728 3.1%Public Administration 13,543 8.9%Undefined 856 0.6%
Total County Employment 152,806 100.0% Source: http://data.bls.gov
2.3 Urban Growth Patterns The City is growing in population and in land area. According to the LPlan 2040, the City has a tiered growth pattern that is mostly to the south and east, in the near term (Figure 2-1). The plan also encourages in-fill develop within the urban core. These LPlan 2040 projected growth patterns will be used to evaluate long-term solid waste needs in preparation of the Plan.

Solid Waste Plan 2040 Page 6 Needs Assessment
Figure 2-1 – Lincoln-Lancaster Urban Growth Projections

Solid Waste Plan 2040 Page 7 Needs Assessment
Section 3 – Current Waste Management Practices Current solid waste management practices include the following major components:
♦ Solid waste, lawn waste, and recyclables collection; ♦ Solid waste and recyclables handling facilities (transfer station, recycling centers,
recycling processing centers, and composting facilities); ♦ Diversion programs; and, ♦ Disposal facilities (landfills).
3.1 Solid Waste and Recyclables Collection Practices Solid waste and recyclables collection in the City-County is performed by approximately forty independent, licensed waste haulers in an open-competitive collection system. Two villages (Roca and Firth) in the Planning Area contract with a waste hauler for solid waste collection services; three villages (Bennet, Davey and Panama) contract with a waste hauler to provide a solid waste compactor which serves as a transfer station for community residents; the remaining communities in the Planning Area have an open-subscription collection system.
Independent waste haulers generally provide a varying menu of services to residents and businesses. By law (LMC), all residences must receive once or twice per week solid waste collection. Optional collection services available through various waste hauler or recycling contractors include programs such as lawn waste (grass and leaves) collection (typically April 1st until December 1st), fall-only (October and November) leaf collection and collection of recyclable materials. There are no reporting requirements for waste and recyclables haulers; as a result, no data is available on the number of residents subscribing to the various levels of collection services.
Several private hauling companies provide curbside collection of recyclables on a subscription basis in Lincoln and surrounding communities. Based on the Baseline Assessment Survey conducted as part of the planning process, an estimated 24 percent of the household in Lincoln subscribe to curbside recycling. None of the municipalities in the County provide either public or franchise curbside collection service for recyclables. Curbside residential recyclables collection programs are funded by program users through subscription fees and revenue derived from the collected materials.
Most of the curbside recycling programs provided to residents are “single stream” services, which mean that all acceptable recyclables are placed in a common container(s) and sorted at a remote recycling processing center.
Historically, commercial recycling services for source separated office paper, cardboard (OCC), and other recyclables has been provided by private recyclers from Lincoln or Omaha. Some larger commercial refuse haulers have provided separate cardboard recycling containers at selected retail locations. Recently, some refuse haulers have expanded their waste collection business to include recycling services for both residential and commercial customers. This has resulted in more recycling services available for commercial recycling. Commercial recycling programs are funded by program users through, subscription fees and revenue derived from the collected materials.
Firms providing source separated recyclables collection services are not required to license their (source separated recyclables) collection vehicles and report any information regarding their service areas, type of services provided, type and quantity of material diverted/recycled, or the number of customers they service. As a result, the number of waste haulers providing recycling services and participation levels are not known. Private recycling processing centers

Solid Waste Plan 2040 Page 8 Needs Assessment
operate in the City and collect/accept recyclables from business customers and sort and process them to meet market specifications. These facilities process a wide variety of paper, plastics and metals for shipment to various markets and some offer confidential document shredding and recycling. The capacity to process significantly larger volumes of materials would need to be evaluated if a significant increase of recyclables resulted from an expanded recycling program.
Building rubbish and construction debris (referenced herein as construction and demolition (C&D waste) are typically hauled by the C&D companies’ specialty firms, trucking companies (that provide container handling services) or by small businesses and residents who generate the C&D waste. These entities typically make decisions on how to handle waste materials based on cost, convenience, storage and handling options, regulatory requirements, material composition, and management options (recycle, fill, disposal). When materials are hauled to C&D recycling and processing facilities these materials are considered source separated and trucking operations are exempt from both licensing requirements and the Occupation Tax; they are further exempt from reporting any information regarding the type of services provided and type and quantity of material diverted/recycled.
The C&D waste management business has evolved significantly since the 1994 Plan was developed, with much greater volumes of these waste being diverted from disposal; this can be seen in the decrease in tonnages delivered to the North 48th Street C&D Waste Landfill in Table 3-5. Based on processing rates shown in Table 3-3, it is apparent that significant quantities of potential C&D waste (e.g., concrete and asphalt) are being diverted from disposal and reused rather than landfilled. It is also known that significant quantities of metals from construction and demolition projects are being diverted, but these are not quantifiable. The C&D waste that requires disposal (i.e., is not recycled/reused) is principally hauled to the North 48th Street C&D Landfill, the Bluff Road MSW Landfill or other private disposal sites in the region.
All waste haulers operating within the 3-mile corporate limits of the City are required to have a license to collect, haul or convey garbage, putrescible waste, or infectious waste except for:
♦ A homeowner conveying garbage, putrescible waste, or infectious waste from his or her own residence to the public sanitary landfills.
♦ Collecting, hauling or conveying dead animals, grease, and other putrescible wastes to rendering facilities.
♦ Collecting, hauling or conveying liquid wastes if said person holds a current Cleaner and Liquid Waste Hauler permit issued by the Lincoln-Lancaster County Health Department (LLCHD) Health Director.
♦ Collecting, hauling and conveying lawn waste.
The majority of un-recycled solid waste generated in the County is hauled to the Bluff Road Landfill
3.1.1 Recyclables and Yard Waste Collection The City and County promote recycling. Among the methods by which they encourage it is by publishing the names of hauling companies that will collect recyclables at the curbside and by publishing maps of the City-provided drop-off recycling sites throughout the Planning Area.
Residents, lawn service companies and waste haulers deliver source-separated lawn waste (defined in the LMC as grass cuttings or clippings and leaves) to the composting facility located at the Bluff Road Landfill or the North 48th Street Transfer Station site. Yard waste and other compostable waste delivered to the North 48th Street site are taken to the Bluff Road site for further processing and composting.

Solid Waste Plan 2040 Page 9 Needs Assessment
The Villages of Bennet, Davey, Firth, Panama and Roca as well as the cities of Hickman and Waverly have brush drop-off areas where the material is burned, after obtaining a burn permit from the Lincoln-Lancaster County Health Department. The City of Hickman and the villages of Bennet, Davey, Firth and Panama also accept grass clippings at their drop-off sites. The grass clippings are either burned with the brush or composted on site.
3.2 Waste Handling and Management Facilities Waste handling and management facilities in the County include transfer stations, recycling processing centers, recycling centers and composting operations. Collected and transported materials are directed to these various waste handling and management facilities, based on vehicle size and material characteristics. For the convenience of citizens, the City operates a network of 29 multi-material recycling (drop-off) centers and 4 newspaper-only recycling (drop-off) centers in the Planning Area; most are open 24-hours per day. Two private recycling processing centers also operate multi-material recycling drop-off centers in the City. One village, (Hallam), operates its own recycling drop-off center. All total there are 36 drop-off sites; 27 are located in the City, and nine of these are in areas of the County outside of the City. The City contracts with a private hauler to collect and deliver the deposited materials from these recycling centers to a recycling processing center under contract with the City to process and market these materials. The City provided facilities are funded primarily through the Occupation Tax, revenues from the sale of recyclables and grant funds.
3.2.1 Recycling Processing Centers Three private recycling processing centers operate in the City and accept recyclables from residential and business customers, and sort and process them to meet market specifications. Some businesses that generate large quantities of cardboard ship it directly to processors outside the Planning Area.
3.2.2 Transfer Stations There are four transfer stations operating within the County. None of these facilities requires permits under NDEQ regulations.
3.2.2.1 North 48th Street Transfer The City’s small vehicle transfer station is located at 5101 North 48th Street, approximately 1 mile north of the intersection of North 48th Street and Superior Street. This transfer station is used by cars, pickups, trailers, and other small vehicles that have specified maximum cargo box dimensions. Based on City records, this facility accepted an average of approximately 7,800 tons per year of solid waste over the last five years. This facility also accepts and manages lawn waste, brush, appliances, metals and tires that are sorted out and placed in designated storage areas on the site for additional processing or recycling. Waste oil and lead-acid batteries are also accepted for recycling at this facility. The number of vehicles using the transfer station has averaged approximately 25,000 vehicles per year over the past 5 years.
3.2.2.2 Bennet Refuse Transfer Station The Village of Bennet operates a transfer station utilizing a compactor and a 40-cubic-yard (CY) roll-off container, which is emptied on a regular schedule. This operation serves community residents and area farmers that pay an annual permit fee to use the facility. The Village contracts with a private firm to provide the waste container. The Village also operates a yard waste and brush drop-off area at its transfer station. This material is burned pursuant to a burn permit. The transfer station site also serves as a multi-material drop-off site for recyclables.

Solid Waste Plan 2040 Page 10 Needs Assessment
3.2.2.3 Davey Refuse Transfer Station The Village of Davey operates a transfer station utilizing a compactor and a 40 CY container, which is emptied on a regular schedule. This operation serves community residents and area farmers that pay an annual permit fee to use the facility. The Village contracts with a private firm to provide the waste container. The transfer station site also serves as a multi-material drop-off site for recyclables as well as for brush and yard waste. The brush is burned pursuant to a burn permit. The yard waste is composted and distributed to users of the facility.
3.2.2.4 Panama Transfer The Village of Panama operates a transfer station utilizing a compactor and a 40 CY roll-off container, which is emptied on a regular schedule. The City contracts with a waste hauler to provide the container. The operation serves residents and area farmers that pay an annual permit fee to use the facility. The Village also operates a yard waste and brush drop-off area at its transfer station. This material is burned pursuant to a burn permit. The transfer station site also serves as a multi-material drop-off site for recyclables.
3.2.3 Waste Diversion Programs Nationally, the U.S. Environmental Protection Agency (USEPA) data indicate that the quantities of waste recycled and diverted from disposal are increasing; USEPA data also show that the quantities of MSW disposed are remaining relatively steady (USEPA Municipal Solid Waste in the United States: 2010 Facts and Figures, December 2011). USEPA estimated that in 2000, 22.1 percent of solid waste was recycled and 6.9 percent was composted. In 2010, USEPA estimated that 34.1 percent of solid waste was recycled or composted.
Waste diversion includes source reduction, reuse, recycling, composting and other resource recovery techniques. Source reduction (diversion and minimization) strategies focus on conservation of resources, reduction in waste toxicity, environmental protection (of air and groundwater), reuse, and methods to increase the useful life of manufactured products. A key part of the overall diversion and minimization effort is educating consumers on options to avoid or minimize waste generation and disposal.
Information on the existing waste diversion and minimization programs was gathered from the City, County and various private companies currently active in waste management, waste reduction and recycling programs in the Planning Area.
3.2.3.1 Source Reduction (Conserve, Reduce, Reuse) Source reduction activities reduce the amount of materials entering the waste stream. The City-County currently support a wide range of public and private waste reduction programs for source reduction. These efforts are best illustrated in the Lincoln-Lancaster County’s Official Waste Reduction & Recycling Guide (updated annually) and through the following websites:
♦ City’s Solid Waste Operations’ website http://lincoln.ne.gove/city/pworks/waste/sldwaste/
♦ Lincoln-Lancaster County Health Department website http://lincoln.ne.gov/city/health/environ/pollu/indet.htm
This publication provides sources of information regarding essentially all of the solid waste programs and solid waste management systems, facilities, and diversion programs available to City and County residents, including specific information on:
♦ Managing solid waste and yard waste ♦ Information on recycling centers, curbside recycling haulers and litter prevention ♦ Schedule for backyard composting workshops

Solid Waste Plan 2040 Page 11 Needs Assessment
♦ Waste reduction, reuse, recycling and diversion of a wide array of materials, ♦ Management of HHW
o Schedules for HHW collection events o Advice on proper disposal options for items such as latex paint, antifreeze and
medications
The Waste Reduction & Recycling Guide includes a list of some of the private diversion opportunities inside as well as outside the Planning Area.
3.2.3.2 Recycling The City provides public drop-off recycling centers for recyclable materials. Private haulers also offer subscription curbside recyclables collection for residents, collection services for business customers, and buyback centers, as discussed later in this section.
In addition to the North 48th Street Transfer Station, the City’s Bluff Road Landfill has separate drop-off areas for appliances, tires and automobile batteries.
The appliances received at the Bluff Road site are transported to the 48th Street Transfer Station Appliance De-manufacturing facility for removal of Freon and PCB (polychlorinated biphenyl) capacitors and then recycled. The 48th Street Transfer also accepts used oil for recycling.
3.2.3.3 Recycling Center Drop-off Facilities As noted above, there are currently 36 recycling center drop-off sites available to residents of the City and County. There are 27 recycling center drop-off sites located in the City of Lincoln and nine located in other communities or locations in the County. The eight sites outside the City are all multi-material recycling center sites and include facilities in the following communities:
♦ Hickman ♦ Waverly ♦ Bennet ♦ Davey ♦ Denton ♦ Firth ♦ Hallam ♦ Malcolm ♦ Panama
Since FY1990-1991, the recycling center drop-off facilities managed by the City have collected 114,163 tons of recyclables. The diversion rate through these facilities peaked at 7,437 tons per year in FY2007-2008 (see Table 3-1) and has declined since that time. The decline in volumes collected at the recycling drop-off sites may be attributed to: 1) global recession; 2) reduced size of newspaper and reduced subscriptions; and, 3) increase in curbside recycling subscription. Table 3-1 – Tons of Materials Recycled at Public Drop-off Sites shows the breakdown in material and overall tonnages of materials collected at drop-off sites over the past 11 years.

Solid Waste Plan 2040 Page 12 Needs Assessment
Table 3-1 –Tons of Materials Recycled at Public Drop-off Sites F.Y. Newsprint Paperboard Mixed Total
Aluminum PET & HDPE Glass Metals & OCC Paper Tons00-01 3,317 27 178 577 117 732 1,239 6,18701-02 3,222 25 176 569 118 696 1,236 6,04202-03 3,219 32 190 594 133 738 1,349 6,25503-04 3,154 35 200 613 123 739 1,436 6,30004-05 3,161 36 230 628 126 865 1,511 6,55705-06 3,162 39 228 675 129 875 1,573 6,68106-07 3,210 43 281 726 122 966 1,727 7,07507-08 3,101 51 336 853 127 1,138 1,831 7,43708-09 2,474 64 396 928 125 1,180 1,641 6,80809-10 2,155 68 413 978 128 1,210 1,449 6,40110-11 1,932 59 392 940 120 1,209 1,370 6,022
Containers
The City also provides Christmas tree grinding and mulching for approximately 3 weeks following the Christmas holiday. Christmas trees can be dropped off at drop-off sites located throughout the City. In the last 25 years, the City has recycled approximately 205,000 trees (approximately 2,950 tons), with an annual average of approximately 118 tons.
3.2.3.4 Private Recycling Processing Centers There are eight buyback center locations in the City for metal cans and scrap metal; two of the centers only accept metal cans. Two firms have facilities located in the Planning Area, and handle large volumes of scrap from the Planning Area, including automobile and demolition scrap metals. Their local facilities also accept and recycle materials from other recyclers in the region.
As mentioned above, there are also three local material recovery facilities. All the facilities have warehouses, which are used for sorting and baling recyclables. These facilities process a wide variety of paper, plastics and metals for shipment to various markets and may offer confidential document shredding and recycling for a large part of eastern Nebraska and western Iowa.
An annual City survey of recyclers provides some data on the quantity of residential and commercial recyclables handled by private-sector recyclers. Table 3-2 summarizes the reported data since 2000 for various recycled materials. The quantities originally reported include metals associated with auto scrap, as well as salvage and demolition activities; quantities of metals in Table 3-2 were adjusted in an effort to reflect only metals from commercial and residential recycling operations. These quantities exclude materials such as tires, oil, wood pallets, electronics and other miscellaneous materials, because these materials have been inconsistently reported. The totals in Table 3-2 also exclude recycled concrete and asphalt materials (construction and demolition waste recycling).

Solid Waste Plan 2040 Page 13 Needs Assessment
Table 3-2 – Tons of Materials Recycled (Reported by Private-Sector)
Calendar Year Metals (1) Papers Cardboard Glass Plastics Totals
2000 5,967 10,095 12,412 1,899 92 30,465 2001 3,205 9,891 11,260 2,931 74 27,361 2002 5,623 11,343 13,690 2,665 281 33,603 2003 5,188 18,937 11,495 1,633 513 37,766 2004 7,962 14,108 14,464 1,702 276 38,512 2005 9,505 20,277 13,098 1,183 342 44,405 2006 7,434 12,262 20,931 1,696 461 42,784 2007 7,777 16,962 21,673 1,542 399 48,353 2008 9,716 9,227 14,317 316 449 34,025 2009 7,247 9,638 16,017 327 618 33,847 2010 9,815 14,252 16,750 1,874 1,308 43,999 2011 9,710 14,020 17,298 834 1,249 43,111
Notes: (1) Actual quantities of reported ferrous metals have been adjusted to reflect 3 percent of the waste stream
to correspond to the percentages of metals in NDEQ statewide waste composition study. Adjustments were made because the values reported to the City include items such as scrap automobiles and metals from salvage and demolition operations.
The average amount of materials reported to be recycled by these private sector activities since 2000 has been approximately 38,000 tons per year. These quantities have not been verified and it is not known what amounts come from subscription recycling service, buybacks, or other internal corporate recycling programs. Quantities of recyclables imported and exported are also unknown.
C&D contractors can haul the debris from their project sites to various processing sites in the region that recover materials such as metals, wood, asphalt shingles, concrete, and asphalt. Table 3-3 shows the reported quantities of concrete and asphalt that have been diverted from disposal since 2000.
The concrete and asphalt diversion tonnage has been relatively consistent year to year. Based on the data in Table 3-3, the private-sector recycling operations have diverted an average of approximately 352,000 tons per year of these materials, since 2000. Using FY 2010/2011 C&D disposal data and 2011 C&D diversion rates, the current C&D diversion rate is 75 percent

Solid Waste Plan 2040 Page 14 Needs Assessment
Table 3-2 – Recycled Tons of Concrete and Asphalt Reported by Private-Sector Calendar
Year Clean
Concrete Asphalt Totals 2000 174,524 82,876 257,400 2001 228,628 101,920 330,548 2002 272,194 100,813 373,007 2003 275,029 92,881 367,910 2004 198,732 116,020 314,752 2005 215,784 152,807 368,591 2006 315,557 101,258 416,815 2007 283,385 77,249 360,634 2008 291,514 80,863 372,377 2009 291,506 70,122 361,628 2010 263,946 77,962 341,908 2011 146,995 83,752 230,747
3.2.3.5 Composting Facilities Adjacent to the City’s Bluff Road Landfill site is the City’s 13-acre commercial composting operation, which processes segregated loads of lawn waste delivered directly to the Bluff Road site and delivered via the North 48th Street transfer station. The lawn waste composting facility at the Bluff Road site is accessible to commercial waste haulers and commercial lawn maintenance companies. Brush or tree wastes, which are free of soil and other debris, may also be taken to this facility. However, small vehicles hauling lawn waste and brush must use the site associated with the North 48th Street transfer station. Lawn waste delivered to the North 48th Street site is transported to the compost facility adjacent to the Bluff Road Landfill.
The City grinds wood chips at the Bluffs Road site and at the North 48th Street site. The chips are transported to the Bluff Road composting operation and used as a bulking agent in the composting operation or used to replace crushed rock to construct temporary roads during wet weather conditions.
Approximately eight percent of the total MSW generation in the Planning Area is estimated to be yard waste. Of the total yard waste collected for management 67 percent is currently estimated to be managed by composting (through the City’s composting site). The NDEQ’s 2008 Nebraska Waste Characterization Study included a waste sort and characterization at the Bluff Road Landfill. This study estimated that approximately three percent, by weight, of the material disposed of at the Bluff Road Landfill was yard waste; based on fiscal year 2011 disposal rates this is equivalent to slightly more than 9,700 tons per year. The City’s composting operations processed an average of 14,800 tons of yard waste and 4,600 tons of wood waste per year over the past five years. The facility produces approximately 4,600 tons of wood chips per year and over the last 5 years has distributed an average of about 8,900 cubic yards of finished compost and wood chips. The villages of Bennet, Davey, Firth, Hickman, and Panama, operate yard waste and brush collection areas while Roca and Waverly operate brush only collection areas for their residents.
As noted above, City of Hickman, Waverly and other villages in the County operate brush drop-off sites. Several villages also accept grass clippings and leaves and either burn or compost it. There are also two private livestock composting operations in Lancaster County and a private yard waste composting facility near Lincoln. One of the livestock waste composting operations is reported to accept a small amount of lawn waste and other organic wastes. Permit

Solid Waste Plan 2040 Page 15 Needs Assessment
requirements for these facilities do not allow them to accept more than 1,000 cubic yards of other organic wastes. Livestock waste is not a waste type addressed in the Solid Waste Plan 2040 and as such is not discussed further in this paper.
3.2.3.6 Appliance De-Manufacturing Facilities Currently, appliances are processed at the City-owned de-manufacturing facility located at the North 48th Street site. The facility accepts all appliances, which include clothes washers and dryers, refrigerators, freezers, hot water heaters, dishwashers (also referred to as “white goods”) as well as window air conditioners. City staff inspects the appliances and removes any Freon, PCB capacitors and mercury switches. They then place the de-manufactured appliances into roll-off boxes that are taken to a private scrap metals facility for further processing. Over the last five years the City has processed an average of 3,000 appliances per year at the de-manufacturing facility, which is equivalent to 540 tons per year of scrap metal over the last five years. This operation is financed through a $5.00 per appliance user fee, revenues from the sale of recycled metals, grants and the Occupation Tax.
3.2.3.7 Household Hazardous & Conditionally-Exempt Small Quantity Generator (Small Business) Hazardous Waste
The LLCHD coordinates programs for toxics reduction/hazardous materials management for households and small businesses. These programs include but are not limited to community education (focused on choosing least toxic alternatives and buying only the amount needed) and an annual series of hazardous waste collection events for households and small businesses (CESQG). The HHW events are typically scheduled from March through November, and currently include two by appointment only events. The LLCHD also shares responsibility with Aging Partners for oversight of the Safe Homes for Seniors service that provides in-home household hazardous waste assessments, sorting and proper disposal for seniors and other home-bound populations. The City also provides for management of certain hazardous materials from households at its North 48th Street Landfill, where it also accepts used motor oil, batteries, as well as the above noted program for removal of hazardous components from appliances, as part of its appliance de-manufacturing facility. Private industries provide materials management through programs that reuse, recycle or otherwise properly manage batteries, computer components, oils, latex paints, compact fluorescent light bulbs, devices containing mercury and others.
HHW is a relatively small proportion of the municipal solid waste disposed at landfills. The NDEQ conducted a series of waste composition studies in 2007 and 2008. The portion of the study conducted at the City’s Bluff Road Landfill showed 0.02 percent of waste stream was HHW – this excluded electronic waste (0.41 percent), and dry cell batteries (0.08 percent). This totals 0.51 percent of Lincoln’s MSW that may be considered HHW. Table 3-4 provides a summary of quantities of HHW materials collected at the LLCHD HHW events over the past 11 years and the technique employed to manage or dispose of these materials. This represents an average collection rate of approximately 40 tons per year, with approximately 50 percent diverted from disposal.

Solid Waste Plan 2040 Page 16 Needs Assessment
Table 3-3 – Pounds of HHW Collected Per Year Year Recyclables Fuels Blending Incinerable Landfill Totals2001 34,760 19,037 21,452 681 75,930 2002 2,341 35,161 29,071 385 66,958 2003 7,472 37,083 32,487 1,235 78,277 2004 21,246 36,570 33,667 364 91,847 2005 3,931 26,858 29,179 1,553 61,521 2006 6,664 28,604 23,046 2,447 60,761 2007 7,013 37,209 44,144 1,194 89,560 2008 50,058 17,444 72,963 - 140,465 2009 4,325 13,558 59,285 37 77,205 2010 3,615 12,394 53,374 - 69,383 2011 4,065 35,974 44,571 - 84,610
Totals 145,490 299,892 443,239 7,896 896,517 Totals in Tons 72.75 149.95 221.62 3.95 448.26
There are only two CESQG events per year. Participating businesses pay the cost for waste disposal and the balance of the costs are paid from refuse hauler occupation tax and State grants.
3.2.3.8 Universal, Special and Unique Wastes Universal, Special and Unique wastes are those materials that require special handling and care for safe reuse, recycling, collection, treatment, and disposal.
Universal wastes are hazardous wastes that are generated by small and large businesses and are regulated under the NDEQ Title 128 – Nebraska Hazardous Waste Regulations. Universal Wastes include the following:
♦ Batteries ♦ Pesticides ♦ Mercury-Containing Items ♦ Spent Lamps (fluorescent, high-pressure sodium, mercury vapor, metal halide) ♦ Electronic Items
Special Waste is defined by NDEQ Title 132 – Integrated Solid Waste Management Regulations and also by Lincoln Municipal Code (LMC) 8.32.080, which defines six groups or categories of Special Waste, as listed below:
Group I: Wastes That May Contain Free Liquids Group II: Petroleum-Based Wastes Group III: Empty Containers Group IV: Solvents, Absorbents, Filters, and Residues Group V: Hazardous or Toxic Chemical Products Group VI: Miscellaneous
Unique Wastes typically refer to those that require special handling or those that may be more difficult to manage, reuse or recycle at a household or business level. Examples of Unique Waste include but are not limited to the following:
♦ Tires ♦ Electronic Waste (e-waste) ♦ Scrap Metals and Appliances ♦ Household Medical Waste and Pharmaceutical Waste

Solid Waste Plan 2040 Page 17 Needs Assessment
♦ Paints (Latex and Oil) ♦ Difficult to Handle Materials (tree root balls, large lumber, furniture, mattresses,
carpeting, disaster debris rigid materials)
Because Universal wastes are hazardous wastes they are banned from disposal at the City’s landfills. Pursuant to LMC 8.32, the LLCHD administers a Special Waste permit program. There are also private and not-for profit initiatives for the diversion and recycling of unique and universal wastes such as: tires, e-waste, appliances, paint, select pharmaceuticals, CFL’s and other fluorescent lamps.
3.3 Disposal Facilities The LMC and the City-Council by resolution have designated two public landfills for purposes of dumping and disposal of solid waste (and other offensive and obnoxious substances); these are the Bluff Road and the North 48th Street sites. These are the only approved locations allowed within the corporate limits of the City and within a 3-mile radius of the City limits.
3.3.1 Bluff Road Landfill The Bluff Road Landfill, 6001 Bluff Road, currently operates in the western half of this approximately 1 square-mile property. The site is permitted by NDEQ as a Municipal Solid Waste Disposal Area. The Bluff Road Landfill began operations in 1988 and only accepts solid waste generated from within the County. The permitted site contains 350 acres, of which 171 acre are permitted as a disposal area (landfill). As noted in Section 5, the permitted disposal area is currently projected to reach capacity in 2032. The Bluff Road Landfill has accepted for disposal an average of 279,500 tons per year of solid waste over the last five (5) fiscal years.
The Bluff Road Landfill is the only MSW landfill permitted in the County. This landfill is used by commercial waste and refuse haulers or customers hauling materials in large trucks and trailers with cargo boxes. C&D waste can be delivered to and disposed of at the Bluff Road or North 48th Street Landfill. A portion of the waste generated in the City and County is also exported to other regional landfills. Table 3-5 provides a summary of historical tonnages of solid waste disposal at the Bluff Road Landfill.
Facilities on the Bluff Road site include the scale, scale house, office and the maintenance facility, a training building, as well as a leachate load-out facility and a landfill gas (LFG) management system (including a blow and flare). The scale located adjacent to the scale house is used to measure the tonnages received from waste haulers and in calculating disposal fees.
The 171 acres of permitted disposal has an air space capacity of over 25.2 million CY (excluding the liner system and final cover). Based on projections in the 2012 permit renewal, the remaining air space capacity is approximately 12.5 million CY (excluding final soil cover) of landfill volume.

Solid Waste Plan 2040 Page 18 Needs Assessment
Table 3-5 – Historical Quantities Disposed from Planning Area (Tons)
FY MSW Landfilled in County (1)(2)
MSW Exported
Total MSW Landfilled
C&D Waste Landfilled
Total MSW & C&D Landfilled
88-89 278,338 - 278,338 138,676 417,014 89-90 289,604 - 289,604 121,701 411,305 90-91 296,897 - 296,897 147,563 444,460 91-92 280,449 - 280,449 202,380 482,829 92-93 258,828 - 258,828 269,201 528,029 93-94 265,414 - 265,414 356,764 622,178 94-95 257,957 - 257,957 167,405 425,362 95-96 265,196 - 265,196 112,379 377,575 96-97 284,536 - 284,536 92,868 377,404 97-98 275,512 - 275,512 88,341 363,853 98-99 286,322 - 286,322 101,682 388,004 99-00 289,542 - 289,542 86,760 376,302 00-01 278,351 15,330 293,681 61,305 354,986 01-02 265,027 32,854 297,881 88,227 386,108 02-03 275,049 27,092 302,141 78,649 380,790 03-04 282,263 29,477 311,740 98,174 409,914 04-05 280,105 29,888 309,993 76,746 386,739 05-06 285,253 36,515 321,768 86,159 407,927 06-07 288,102 31,618 319,720 75,491 395,211 07-08 288,298 22,165 310,463 89,446 399,909 08-09 261,910 16,397 278,307 53,185 331,492 09-10 272,443 15,880 288,323 59,119 347,442 10-11 287,211 17,709 304,920 76,337 381,257
Notes: (1) Solid Waste is defined in LMC and includes garbage, refuse, commercial and industrial waste, demolition
debris, building refuse, including those designated as Special Waste. MSW tons also include tonnages received from the North 48th Street Transfer Station.
(2) Biosolids were disposed of at the Bluff Road Landfill for the first 4 years of operation. After fiscal year 92-93, biosolids were diverted from landfill disposal via a land application program.
3.3.2 North 48th Street C&D Landfill The N. 48th Street Construction and Demolition Waste Landfill, 5101 North 48th Street, is located on City owned land. The North 48th Street site is approximately 450 acres in size; the 2012 permit renewal identifies 121 acres as a C&D waste disposal area. The City’s North 48th Street Construction and Demolition Waste Landfill is located above an area where MSW from Lincoln and Lancaster County were disposed, starting in approximately 1956; in 1990 this site discontinued taking all wastes with the exception of demolition debris and building rubbish. These materials are used to correct grading and drainage above the historic MSW landfill area. The North 48th Street Construction and Demolition Waste Landfill has accepted an average of 70,700 tons per year of C&D waste over the last five (5) years. Lincoln’s C&D Landfill has historically been more restrictive on waste types accepted, than other C&D Landfill operations permitted by NDEQ. The City has limited the acceptance of large quantities of certain C&D and beneficial fill materials such as paper, gypsum board, rubber, plastics, shingles and asphalt. The City has also prohibited painted and treated wood. The amount of acceptable wood debris has generally been restricted to approximately 50 percent per each load. This limitation, on what is

Solid Waste Plan 2040 Page 19 Needs Assessment
accepted at Lincoln’s C&D Landfill, results in a portion of the construction and demolition waste being disposed of at the Bluff Road Landfill.
The closed MSW landfill areas require ongoing maintenance and the City continues to monitor groundwater and for landfill gas migration, associated with historic use of the site for MSW disposal.
There are specialty firms, trucking companies (that provide containers and container handling services), small businesses and residents that handle C&D waste. A portion of the C&D waste stream generated in the City and County is exported to other disposal sites in the region, but the quantities exported are not required to be reported. Table 3-5 provides a summary of historical C&D tonnages disposed at the North 48th Street Landfill. The decline in tonnage since 1994 is largely attributed to increased levels of recycling of the concrete, asphalt and metal from C&D waste streams as well as waste exports.
Facilities on site include the scale, scale house, transfer station, recyclables drop-off area, lawn waste drop-off area, wood grinding area, appliance de-manufacturing facility, maintenance building, and storage building. The old maintenance building located on the south side of the C&D disposal area will eventually be demolished when filling progresses to this area.
The 2012 permit renewal identifies an air space capacity of approximately 2.26 million CY (excluding the final cover). Based on projections contained in Section 5 of this Needs Assessment, this landfill is expected to reach capacity in approximately 2030. Based on projections included in the 2012 permit renewal, the remaining air space capacity is approximately 1.1 million CY (excluding final soil cover) of landfill volume.
3.3.3 Other Disposal Facilities The Bluff Road and North 48th Street Landfills are the only permitted sanitary landfill in Lancaster County. Some solid waste generated in the City and the County is transported by private waste haulers to landfills outside of the County. It is estimated that an average of 24,750 tons per year (over the past five years) of refuse generated within the County was transported to landfills outside of the County. The LMC imposes an Occupation Tax of $7.00 on each ton of refuse collected by a refuse hauler within the corporate limits of the City; such tax must be paid even if the refuse is hauled to a landfill outside of the County. This occupation tax does not extend to the following:
♦ Refuse designed for deposit at any location outside of the State of Nebraska ♦ Building rubbish or demolition rubbish deposited at the North 48th Street landfill ♦ Liquid waste
3.3.4 Competing Facilities
3.3.4.1 Solid Waste Landfills There are 23 permitted landfills in the State of Nebraska, and most of these are relatively remote and charge higher disposal fees than the Bluff Road and North 48th Street landfills. However, there are two privately owned and operated landfills within 60 miles of the City’s facilities: one in Milford, Nebraska, in Seward County and one near David City, Nebraska, in Butler County, which even though they have higher posted tipping fees, are known to receive waste from the Planning Area. Table 3-6 summarizes the posted tipping fees and haul distances to MSW landfills within approximately 60 miles of the Planning Area.

Solid Waste Plan 2040 Page 20 Needs Assessment
Table 3-6 – Regional Landfills (2012$) Posted Tipping Fee
($/ ton) Distance from
Lincoln (miles)
Operation/ Ownership In County Out of County
Butler County Landfill $38.75 $38.75 50 Private/Private Milford Landfill $45.00 $45.00 25 Private/Private Bluff Road Landfill $21.00 NA - Public/Public N. 48th Street (C&D) Landfill $4.00 NA - Public/Public York Area Landfill $38.00 $38.00 50 Public/Public Beatrice Landfill (1) Avg. $39.00 Varies 40 Public/Public Pheasant Point Landfill $24.20 $24.20 62 Private/Private Sarpy County Landfill $24.85 $31.52 47 Public/Public
Notes: (1) Beatrice charges vary based on cubic yard; average tip fee estimated based on FY2010 revenues divided
by tons NA indicates Not Applicable
3.3.4.2 Limited Landfills The LMC, Section 8.32, defines “limited landfills” as “a type of operation approved by the Health Director in which only building rubbish and demolition debris are disposed of by plan on a specified parcel of land and operated and maintained in such a manner as to present no danger to the health and safety and welfare of human beings.” There are no limited landfills permitted in Lancaster County.
3.4 Regulatory/Permit Requirements Solid waste systems, facilities and programs generally fall within the regulatory requirements of Nebraska’s Integrated Solid Waste Management Act (Nebr. Rev. Statutes Chapter 13, Section 13-2001 to 2043), LMC Section 8.32 - Solid Waste, and NDEQ Title 132 - Integrated Solid Waste Management Regulations and Title 129 – Nebraska Air Quality Regulation. Other rules, regulations and requirements may exist, which are specific to elements of these systems, facilities and programs, such as permits associated with construction, operation, zoning, stormwater management and other aspects.
3.4.1 The Integrated Solid Waste Management Act This act was originally created in 1992 and is a part of the Chapter 13 of the statutes on Cities, Counties, and Other Political Subdivisions. The Act addresses a wide range of waste management related topics including: empowered units of government relative to solid waste management program implementation
The following key excerpts from the Act are provided to further define the regulatory structure under which solid waste is to be managed:
13-2002 Legislative findings and declarations “(5) Local governments are currently authorized to provide solid waste management
services. As a group, counties and municipalities are best positioned to develop efficient solid waste management programs;

Solid Waste Plan 2040 Page 21 Needs Assessment
(6) An assignment of responsibility for integrated solid waste management should not prohibit governmental entities from procuring services from other units of governments or from private persons. …
(7) A variety of benefits results from a policy of integrated solid waste management, including the following environmental, economic, governmental, and public benefits….”
13-2018 Solid waste management hierarchy; established; cooperative program; established
“(1) An effective and efficient program of integrated solid waste management protects the environment and the public and provides the most practical and beneficial use of the solid waste material. While recognizing the continuing necessity for the existence of landfills, alternative methods of managing solid waste and a reduction in the reliance upon land disposal of solid waste are encouraged. In the promotion of these goals, the following solid waste management hierarchy, in descending order of preference, is established as the integrated solid waste management policy of the state:
(a) Volume reduction at the source;
(b) Recycling, reuse, and vegetative waste composting;
(c) Land disposal; …”
13-2020 County, municipality, or agency; provide or contract for disposal of solid waste; joint ownership of facility; governing body; powers and duties; rates and charges
“(1) Effective October 1, 1993, each county and municipality shall provide or contract for facilities and systems as necessary for the safe and sanitary disposal of solid waste generated within its solid waste jurisdictional area….
(3) A county, municipality or agency may, either alone or in combination with any other county, municipality, or agency, contract with any person to provide any service, facility or system required by the Integrated Solid Waste Management Act.
(4) The governing body of a county, municipality, or agency may make all necessary rules and regulations governing the use, operation, and control of a facility or system. Such governing body may establish just and equitable rates or charges to be paid to it for the use of such facility or system…"
13-2023 County, municipality, or agency; regulations authorized; limitations; noncompliance fee
“A county, municipality, or agency may, by ordinance or resolution, adopt regulations governing collection, source separation, storage, transportation, transfer, processing, treatment, and disposal of solid waste within its solid waste jurisdiction area as necessary to protect the public health and welfare and the environment.”
13-2026 Municipalities, counties, and agencies; regulate solid waste management; when
“In furtherance of the policy of the state as set forth in the Integrated Solid Waste Management Act, municipalities, counties, and agencies may by ordinance or resolution adopt rules and regulations or may adopt bylaws or enter into written agreements between and among themselves or other persons which regulate and govern solid waste management within their solid waste jurisdiction areas,

Solid Waste Plan 2040 Page 22 Needs Assessment
including the establishment of conditions to assure that a specified amount and type of solid waste will be delivered to a specific facility.”
13-2032 Integrated solid waste management plan; minimum requirements; waste reduction and recycling program; priorities; updated plan
“(2) The integrated solid waste management plan shall provide for a local waste reduction and recycling program. If technically and economically feasible, the volume of materials disposed of in landfills as of July 1, 1994, shall be reduced by twenty-five percent as of July 1, 1996, by forty percent as of July 1, 1999, and by fifty percent as of July 1, 2002.…The following wastes shall be given first priority when developing reduction and recycling programs and related timetables in relation to an integrated solid waste management plan:
(a) Yard wastes;
(b) Unregulated hazardous wastes, except household hazardous waste, which are exempt from the regulations under the Environmental Protection Act;
(c) Discarded tires;
(d) Waste oil;
(e) Lead-acid batteries; and
(f) Discarded household appliances.
In addition, such plan shall provide a methodology for implementing a program of separation of wastes, including, but not limited to glass, plastic, paper, and metal.
(3) The solid waste management plan shall be updated for compliance with federal and state laws and regulations as required by the department and may be updated, subject to approval by the department, at any time to reflect local needs and conditions.”
3.4.2 Lincoln Municipal Code The following key excerpts from the LMC are provided to further define the regulatory structure adopted locally and under which solid waste is to be managed in the Planning Area:
8.32.030 Sanitary Landfill; Designated by Council “The City Council shall, by resolution, designate a place or places for the operation of a public sanitary landfill to be used for the disposal of solid waste, and other offensive or obnoxious substances.”
8.32.040 Public Sanitary Landfills; Location; Type of Solid Waste Accepted for Disposal
“Two public sanitary landfills are hereby designated for purposes of dumping and disposal of solid waste. One public sanitary landfill shall be located on 48th Street, … The second public sanitary landfill shall be located at …. 56th Street and Bluff Road.”
8.32.080 Special Waste Disposal; Permit Required “(b) No industry, commercial operation, or home occupation shall dispose of any special
wastes in quantities greater than that provided from time to time by resolution of the City Council as authorized by Section 8.32.090 of the Lincoln Municipal Code, without first obtaining a written permit from the Health Director.”
8.32.110 Waste Haulers; License Required

Solid Waste Plan 2040 Page 23 Needs Assessment
“It shall be unlawful for any person to collect, haul, or convey garbage, putrescible waste, or infectious waste from property within the corporate limits of the city or within three miles thereof without first having procured a license to do so under the provisions of this chapter; provided, however, no license shall be required:
(a) For a homeowner conveying garbage, putrescible waste, or infectious waste from his or her own residence to the public sanitary landfills; or
(b) For collecting, hauling or conveying dead animals, grease, and other putrescible wastes to rendering facilities.
(c) For collecting, hauling or conveying liquid wastes if said person holds a current Cleaner and Liquid Waste Hauler permit issued by the Health Director pursuant to Lincoln Municipal Code Section 24.38.060.
(d) For collecting, hauling and conveying lawn waste.”
8.32.150 Occupation Tax “(a) There is hereby imposed an occupation tax of $7.00 on each ton of refuse collected
by a refuse hauler within the corporate limits of the City of Lincoln, and a tax of $7.00 on each ton of refuse collected by a refuse hauler outside the corporate limits of the City of Lincoln and deposited in the public sanitary landfills as designated in Section 8.32.040 of the Lincoln Municipal Code. The occupation taxes authorized herein shall be used exclusively for funding solid waste management programs, including the payment of principal and interest on revenue bonds issued by the City of Lincoln.” [Note: by Definition, the term refuse shall not include … recyclables, as defined in Section 5.41.010 of this code, that have been separated out at the source.]
8.32.205 Garbage Service to be Provided “The owner of every dwelling in the city shall provide for the collection and removal of solid waste by a licensed waste hauler at least once a week, subject to any exceptions or additional requirements provided by governing law.
3.4.3 NDEQ Regulatory Requirements
The primary NDEQ regulations governing the landfill operations are Title 132 and 129. The City also has obligations related to protect ground water and for releases to surface water (e.g., Title 119 - Rules and Regulations Pertaining to the Issuance of Permits under the National Pollution Discharge Elimination System (surface water quality)), as well as other requirements as cross-referenced within Title 132 and 129 regulations. Title 132 – Integrated Solid Waste Management Regulations
Title 132 is the primary regulations governing solid waste management in Nebraska as it relates to the following:
• Chapter 2 – Permits: Application Procedures • Chapter 3 – Criteria for Municipal Solid Waste Disposal Areas [design, construction,
operation, closure], Delisted Waste Disposal Areas, Industrial Waste Disposal Areas and Land Application Units for Repeated Disposal or Treatment of Special Wastes
• Chapter 5 – Criteria for Construction and Demolition Waste Disposal Areas • Chapter 6 – Criteria for Solid Waste Processing Facilities • Chapter 8 – Financial Assurance Criteria: Solid Waste Management Facilities

Solid Waste Plan 2040 Page 24 Needs Assessment
• Chapter 13 – Special Wastes • Chapter 14 – Waste Tires • Chapter 16 – Prohibited Land Disposal of Certain Solid Wastes
NDEQ Title 132 regulations allow local governing bodies to develop and enforce local ordinances, codes or rules and regulations on solid wastes disposal or processing facilities equal to or more stringent than the Title 132 rules and regulations.
Title 129 – Nebraska Air Quality Regulations
Title 129 contains the primary regulations governing air emissions such as dust and gases from the landfill. The program for permitting the construction and operation of these facilities (as emission sources) are managed and administered by the LLCHD.
3.4.4 Transfer Stations and Processing Facilities NDEQ Title 132, Integrated Solid Waste Management Regulations, defines solid waste processing facilities to “mean any facility where solid wastes are processed, and shall include, but not be limited to solid waste compost sites, materials recovery facilities, recycling centers and solid waste transfer stations.” The regulations require that “No person shall construct or operate a solid waste management facility without a permit issued by the Department [NDEQ] pursuant to this Section unless otherwise provided in these regulations.”
Partial exemptions from permit requirements exist for solid waste processing facilities when:
♦ A solid waste compost site receives between 20,000 and 100,000 CY per year of lawn wastes only;
♦ A solid waste compost site receives less than 1,000 CY per year of material; ♦ A solid waste compost site receives between 20,000 and 100,000 CY per year of
material that consists of lawn waste in combination with less than 1,000 CY of other materials; or
♦ A solid waste transfer station receives waste from vehicles other than those vehicles designed to compact solid waste.
The final partial exemption on this list is the reason none of the transfer stations in the County are required to have an NDEQ issued permit.
The NDEQ regulations also include specific restrictions on the siting of solid waste processing facilities.
3.4.5 C&D Processing and Disposal C&D wastes may be managed in a wide variety of manners. It may be landfilled at either sanitary landfill or C&D landfills; portions of this may be used as “fill” for the purpose of erosion control, erosion repair, channel stabilization, landscaping, roadbed preparation or other land improvement. C&D may also be processed (often by grinding) to form materials suitable for replacement of sands and gravels. Portions of the material from C&D projects may also be recovered for reuse, such as metals, woods and certain building materials.
NDEQ Title 132 regulations define Construction and Demolition waste as “waste which results from land clearing, the demolition of buildings, roads or other structures, including, but not limited to, fill materials, wood (including painted and treated wood), land clearing debris other than lawn waste, wall coverings (including wall paper, paneling and tile), drywall, plaster, non-asbestos insulation, roofing shingles and other roof coverings, plumbing fixtures, glass, plastic, carpeting, electrical wiring, pipe and metals. Such waste shall also include the above listed types of waste that result from construction projects.” Construction and demolition waste does not include “friable asbestos waste, special waste, liquid waste, hazardous waste and waste

Solid Waste Plan 2040 Page 25 Needs Assessment
that contains polychlorinated biphenyl (PCB), putrescible waste, household waste, industrial solid waste, corrugated cardboard, appliances, tires, drums, and fuel tanks.”
Based on Title 132 regulation, “Fill” means solid waste that consists only of one or more of the following: sand, gravel, stone, soil, rock, brick, concrete rubble, asphalt rubble or similar material. C&D material used as “Fill” for erosion control, erosion repair, channel stabilization, landscaping, roadbed preparation or other land improvement is exempt from regulation and does not require regulatory reporting or disposal in a licensed facility. Disposal sites in Nebraska that accept C&D material are required to report disposal quantities to NDEQ. C&D processing facilities in Nebraska are required to have a permit from NDEQ but are only required to report quantities of processed material sent to disposal (not total quantities processed or quantities diverted).
3.4.6 Waste-to-Energy Waste-to-energy (WTE) facilities, also called conversion technologies are classified under solid waste processing facilities and must also be permitted under the Title 132 regulations. In addition, these facilities must comply with NDEQ Title 129 regulations as a major air emission source. There are two basic types of air quality permits: construction permits, which must be obtained prior to starting construction of a new or modified facility, and operating permits, which must be obtained to allow continued operation of those facilities. For a new WTE facility, the construction permit would likely be the more critical element of air quality permitting.
The City has obtained both construction and operating permits in conjunction with its current LFG recovery and flaring operations. As part of the ongoing construction of an LFG to energy system by Lincoln Electric Service (LES), LES must also obtain construction and operating permits for its electrical generating facility.
3.4.7 Handling Requirements for Unique, Universal and Special Wastes The State of Nebraska bans the disposal of selected waste types. In addition, there are certain unique, universal and special wastes that have specific handling requirements, as presented in the following sections.
3.4.7.1 Tires With a few minor exceptions, land disposal of recyclable waste tires in any form is prohibited in Nebraska. As such, all tires generated in the Planning Area must either be beneficially reused or shipped out of state. NDEQ Title 132 defines beneficial reuse of waste tires as including: use for agricultural purposes; as fish habitat; as blowout stabilization; tire mats for bank stabilization; or burned for energy recovery. Tires are also ground into chips and used for a variety of other applications (e.g., drainage applications and playground mats).
NDEQ Title 132 requires that any person, business or other entity engaged in the business of picking up, hauling, and transporting waste tires for accumulation, processing, or recycling obtain a permit from NDEQ before engaging in such activity. As part of that permit, the waste tire haulers are required to submit an annual report that includes: the location in which waste tire business is conducted; the name and location of the business/individual where the waste tires were collected; the annual quantity or weight and type of waste tires collected at each location; the name and location of the business/individual where the waste tires were delivered; and, the annual quantity or weight and type of waste tires delivered to each location. However, NDEQ’s current management of this data is not conducive to estimating the quantities actually generated and managed or exported from the Planning Area.
The City accepts tires at both its Bluff Road and North 48th Street Landfills, but these are not disposed of in the City’s landfills. There is no reliable reporting mechanism for the quantities of

Solid Waste Plan 2040 Page 26 Needs Assessment
waste tires generated in the Planning Area. Using a general industry rule-of-thumb for estimating tire generation of one tire per person per year, it is estimated that there are approximately 5,800 tons of waste tires generated each year in the County.
3.4.7.2 Oil In Nebraska, land disposal of waste oil is prohibited. NDEQ Title 132 defines waste oil as any oil that has been refined from crude oil, or any synthetic oil, that has been used and, as a result of such use, is contaminated by physical or chemical impurities, or used oil as defined in Title 128, Nebraska Hazardous Waste Regulations. NDEQ Title 132 regulations also do not allow waste oil disposal in landfills. Along with an extensive array of automotive service stations, the City does provide for waste oil drop-off and ultimately recycling through its North 48th Street Transfer Station.
3.4.7.3 Batteries In Nebraska, land disposal of lead-acid batteries is prohibited. NDEQ Title 132 defines lead-acid batteries as “electrical storage batteries with cells that contain lead electrodes and an acidic electrolyte, such as those commonly used in motor vehicles.” This regulation does not necessarily extend to the many other types, sizes and shapes of batteries, including new batteries that continue to result from the electronic devices now common in society. Also, this regulation does not extend to the commonly disposed alkaline batteries found in flashlights, mobile audio and other handheld devices. While recycling options are available for most lead and non-lead batteries, there is no central source of information available on battery management. The City does provide for lead-acid battery drop-off and ultimately recycling through its North 48th Street Transfer Station.
3.4.7.4 Electronics Waste The term electronic waste (e-waste) can include a wide variety of materials, from fluorescent light bulbs (tubes and compact bulbs) to computers and TVs to components of other appliances. Currently, federal law does not require recycling of e-waste; however, there have been numerous efforts to require solutions through voluntary programs and federal laws (that have not been adopted into law). There are also household exemptions to the hazardous waste laws that allow for disposal in MSW landfills, including the following:
♦ Household Electronics: Used computer monitors or televisions generated by households are not considered hazardous waste and are not regulated under Federal regulations and as such can be sent to disposal. However, residents are encouraged to take electronic waste to local recyclers.
♦ Business Electronic: Federal and state laws allow conditionally exempt small quantity generators (SQCEG) to dispose of computers, monitors and televisions, in municipal landfills. However, the City does not allow any business, regardless of size, to dispose of these materials in the Bluff Road Landfill.
These exemptions do not mean that a waste does not exhibit hazardous characteristics or is not potentially threatening to the environment, but rather allows small quantities to be disposed of in properly constructed MSW landfills rather than be managed as hazardous waste. E-waste does represent a potential for reuse, refurbishment or recycling of functional items such as computer monitors or computer peripherals, but because of equipment obsolescence, residents and businesses often look for options to discard/dispose such items as waste. There is not a comprehensive e-waste management program in the Planning Area; however, the City Solid Waste Operations, and LLCHD through their websites, provide information on disposal and management options for several types of e-waste. There are a number of private retailers, computer repair firms and recyclers that will recycle e-waste. Most assess a recycling fee.

Solid Waste Plan 2040 Page 27 Needs Assessment
3.4.7.5 Biosolids Although biosolids were previously disposed in the Bluff Road Landfill until 1992, the dewatered biosolids from the Theresa Street and the Northeast Waste Water Treatment Facilities (WWTF) are now transported and applied to agricultural grounds located in the County as part of the Land Application Program managed by the University of Nebraska Cooperative Extension. The City’s WWTF produces approximately 35,000 tons of biosolids per year. The Cooperative Extension service coordinates the distribution of the biosolids to the participants in the program and determines the appropriate cropland application rates; maps and records the land applications; and educates local farmers on the benefits of biosolids usage. Roughly 1,200 acres of cropland in Lancaster County have biosolids applied annually.
3.4.7.6 Coal Combustion Residues (CCR) The Nebraska Public Power District (NPPD) operates the Sheldon Station power plant that is located in the County near Hallam. The CCR from this plant is currently managed on site. The bottom ash is processed by a private contractor to create an aggregate product that is used to manufacture shingles. The remaining ash is disposed in an on-site dedicated ash monofill permitted by NDEQ under Title 132, Fossil Fuel Disposal Site regulations. Although CCR is not a solid waste to be managed under this Plan, there are pending federal regulatory changes that may have an impact on how this CCR is managed in the future, but it is anticipated that it will be managed separately by NPPD.
3.4.7.7 Special Waste As noted in Section 3.2.3.8, LMC 8.32.080 defines special wastes to include:
1) Wastes that contain free liquids 2) Petroleum-based wastes 3) Empty containers (e.g., pressurized, fuel tanks, hazardous materials) 4) Solvents, absorbents, filters, and residues 5) Hazardous or toxic chemicals or chemical products 6) Miscellaneous (e.g., infectious wastes, polychlorinated biphenyls, asbestos, treated
wood)
Any industry, commercial operation or home occupation wanting to dispose of any Special Wastes must apply for a written permit from the LLCHD. Some, of these materials are prohibited from disposal in the Bluff Road Landfill. The Bluff Road Landfill, through its Special Waste permit program, does accept asbestos, treated wood, and certain petroleum-based wastes. The Special Waste Permitting Program is also used to educate and inform business and industrial waste generators of items that are hazardous and how to dispose of them properly.
3.5 Greenhouse Gas Emissions from the Solid Waste Management System Many chemical compounds found in the Earth’s atmosphere act as greenhouse gases (GHG). GHG absorb infrared radiation from sunlight and trap the heat in the atmosphere. The primary GHG in the Earth's atmosphere are water vapor, carbon dioxide, methane, nitrous oxide, and ozone. However there are numerous other compounds that produce the same effect. Since these GHG compounds have different levels of impact, the international community has developed a uniform measurement protocol for GHG emissions, which are reported in terms of metric tons (tonne) carbon dioxide equivalents (MTCO2e).
A separate and detailed evaluation may be necessary to more accurately address GHG emissions associated with existing and possible future solid waste management systems. The following general evaluation focuses on the areas of waste collection and transportation,

Solid Waste Plan 2040 Page 28 Needs Assessment
management and disposal, and fugitive emissions associated with existing landfill operations. GHG emissions and emission reductions are large and complex issues; for purposes of the Plan, efforts will be limited to defining actions that have been taken or may be viable to reduce current emission levels using the baseline values below. One direct way that GHG reductions can be accomplished is through a reduction in use of fossil fuels. One of the solid waste management strategies identified in the LPlan 2040 was to “minimize the use of energy in solid waste management processes.” Another strategy in that plan was to “continue the development of the Lincoln Gas Collection and Control Project.”
In defining the carbon footprint or basis for GHG emissions, it is also important to define what is included or excluded in the overall estimate. For this plan, the focus is on fossil fuels used directly in waste collection and disposal as well as methane emissions from the landfill. Other sources such as electricity and fuel in support vehicles or used for heating are generally not included in this analysis, in part because of the time and effort required to accurately collect such information and in part because it is not anticipated that planning efforts will address these matters (e.g., how much electricity private waste haulers use to maintain their fleet or support offices). Table 3-7 provides the factors used to convert various energy types to equivalent GHG emissions reported as CO2 equivalent. With the exception of electricity factors in Table 3-7 are from the Climate Registry’s General Reporting Protocol (GRP)1
Table 3-7 – GHG Emission Factors
, (Table 12.1, 2012 Climate Registry Default Emission Factors).
Energy Type Emission Factors
Electricity: 1637.82 lbs CO2/MWh (USEPA’s eGRID2012 emissions rate for the MROW sub region)
Natural gas: 53.02 kg CO2/MMBtu (weighted U.S. average carbon content of natural gas)
Motor Gasoline: 8.78 kg CO2/gal
Diesel: 10.21 kg CO2/gal
Propane: 5.59 kg CO2/gal
3.5.1 GHG from Solid Waste Collection System
It is difficult to define the GHG emissions that result from the collection of solid waste since there is no data readily available on the fuel consumption by the private refuse haulers in the Planning Area. However, a limited estimate of a collection vehicle’s emissions was developed for use in future assessments of the waste collection and transfer station options. This analysis is based on the following assumptions:
♦ The payload delivered to the Bluff Road Landfill by a refuse collection vehicle (whether hauling residential or commercial /industrial waste) averages 5.6 tons per load (based on City scale records).
♦ An estimated half of the 304,920 tons of MSW from the Planning Area sent to landfill disposal in FY 2010/2011 came from single-family and duplex residential waste collection programs, and the other one-half come from commercial/industrial/institutional and multi-plex residential type collection programs.
♦ The average haul distance from the end of the waste collection route to the landfill is approximately 24 miles (approximately the distance from the Bluff Road Landfill to the geographic center of the City.
1 1 http://www.theclimateregistry.org/resources/protocols/general-reporting-protocol/

Solid Waste Plan 2040 Page 29 Needs Assessment
♦ Residential refuse collection vehicles consume approximately 4 miles per gallon of diesel fuel while collecting and driving collection routes and 7 miles per gallon of diesel fuel while driving from the end of their collection routes to the landfill.
♦ Commercial refuse collection vehicles consume approximately 6 miles per gallon of diesel fuel while collecting and driving collection routes and 7 miles per gallon of diesel fuel while driving from the end of their collection routes to the landfill.
Because fuel consumption is higher per mile during waste collection than it is during the transportation of waste to the landfill, the estimates of GHG emissions were prepared based on two components:
♦ Fuel consumed in collection ♦ Fuel consumed in transportation to the landfill
For the purpose of approximating fuel consumed in residential waste collection, it was assumed that at a minimum one refuse truck per week drove every mile of the approximately 782 miles of residential streets (per City Public Works and Utilities Department) in the City. For the purpose of approximating fuel consumed in commercial/industrial waste collection, it was assumed that a minimum of one commercial refuse truck traveled two-thirds the distance of the residential streets in achieving a full payload. Because it is known that a portion of the residential neighborhoods are served by multiple refuse haulers and that multiple refuse haulers serve business/industrial/institutional and multi-family areas, the estimates for residential and commercial MSW collection related GHG emissions were developed based on concepts of 1.0, 1.5 and 2.0 vehicles driving every residential streets or commercial routes in the City each week; these are intended to reflect averages that may exist within the City and not precise estimates.
Based on these assumptions, a rough estimate of the annual GHG emissions from refuse collection and hauling operations was developed. These estimates are generally considered lower than actual because they exclude the component of the waste that is self-hauled, collection in rural areas where the routes involve considerably more miles travelled, and travel to landfills outside the Planning Area. Table 3-8 summarizes the estimated annual GHG emissions associated with these assumptions.
Table 3-8 – Estimated Annual Refuse Collection Related GHG Emissions (MTCO2e)
Category Average Vehicles Per Route 1.0 1.5 2.0
Residential MSW Collection 100 160 210 Residential MSW Travel
960 960 960 to/from Landfill
Subtotal 1,060 1,120 1,170
Commercial MSW Collection 50 70 90 Commercial MSW Travel 960 960 960
to/from Landfill Subtotal 1,010 1,030 1,050
TOTAL GHG Emissions 2,070 2,150 2,220

Solid Waste Plan 2040 Page 30 Needs Assessment
3.5.2 Solid Waste Operations Energy Use Impacts
In 2010, the City’s Wastewater Division (which included Solid Waste Operations) conducted a ”Division Sustainability Baseline Analysis” of its annual electricity, gas, water and fuel use data for fiscal years 2004-2008, for use in future sustainability planning efforts. As part of this data collection and analysis, GHG emissions, calculated for each City department, within the Division, were compiled to serve as a reference point against which future progress toward energy efficiency goals could be measured.
City staff gathered and provided existing data for establishing the Solid Waste Operations’ energy usage baseline. Data were separated out by facility location. In general, the data summarized energy use and related emissions data relative to the various operational components, including the use of diesel fuel in landfill and transfer station operations.
GHG emissions were estimated using industry standard GHG accounting methodologies found in the GRP. Emissions factors for each emissions-producing activity were identified from the GRP unless otherwise noted. National average and default emissions factors were used due to lack of local fuel data, except in the case of electricity. The factors were updated to reflect the most recently available data and used to estimate GHG emissions as shown in Table 3-7.
The average annual GHG emissions resulting from the Solid Waste Operations Division operations for the fiscal years 2004 through 2008 are summarized in Table 3-9. These data exclude the above noted solid waste collection operations, which are provided by private haulers.
Table 3-9 – Average Annual GHG Emissions from Solid Waste Operations
Energy TypeBluff Road
Landfill
North 48th St Transfer
Station
C&D Landfill Operations
Compost Operations
Recycling Operations TOTAL
GHG Emissions
(tonnes CO2e )
Natural Gas Usage (MMBtu/yr) 0 0 0 0 0 0 0Propane Usage (Gallons/yr) 7,184 2,070 564 1,794 0 11,611 65Diesel Usage (Gallons/yr) 86,734 6,364 6,013 17,562 0 116,673 1,191Gasoline Usage (Gallons/yr) 2,472 1,240 915 1,041 641 6,309 55Electricity Purchased (kWh/yr) 232,985 167,095 0 0 0 400,080 297
Total Division GHG Emissions = 1,609
3.5.3 LFG Emission Impacts
Solid waste landfills generate LFG (typically 50 percent methane), which if not captured and controlled, contributes the GHG emissions. The capture and destruction of the methane from LFG reduces GHG gas emissions to the atmosphere. Methane is 21 times more potent as a GHG than CO2, so the capture and destruction of methane can produce significant reductions in the GHG emissions within the Planning Area. In addition, the production of energy from the captured methane can offset emissions from fossil fuels.
A LFG collection and flaring system was installed at the Bluff Road Landfill in 2010/2011 and began operation in 2011. The City and LES have since negotiated a contract to utilize a portion of this LFG for the generation of electricity. The LFG to energy facility is expected to commence operation in 2013.

Solid Waste Plan 2040 Page 31 Needs Assessment
The two City landfills are required to annually report, to the USEPA, their GHG emissions from LFG, pursuant to the USEPA GHG reporting regulations, which have been in effect since 2010. Prior to 2010, there was no collection, capture or destruction of GHG from the Bluff Road Landfill. No capture or utilization system is installed or anticipated at the North 48th Street Landfill. To arrive at current estimates of GHG emissions from the Bluff Road Landfill, estimates of LFG generation (as reported to the USEPA for 2011), and gas extraction and destruction rates (from the City’s LFG collection system operating records) were utilized. These calculations generally assume that the LFG collection system would recover and destroy 95 percent of the methane collected from the closed and capped areas of the landfill; as such, the majority of emissions come from active and uncapped areas of the landfill. Emissions estimates for the North 48th Street Landfill, were taken from the City’s annual GHG emissions report submitted to the USEPA. Table 3-10 presents an estimate of 2012 LFG related GHG emissions from the Bluff Road Landfill, assuming this collection system functions as anticipated. In the future, as the total quantities of waste landfilled increases, the rate of LFG generation will also increase. To deal with this, the City has planned expansions of the gas collections system, and its agreement with LES anticipates future expansions of the LFG to energy system.
Table 3-10 – Estimated Annual GHG Emissions from City Landfills in 2011/2012
Landfill GHG Emissions (MTCO2e)
N 48th Street Landfill 92,000 Bluff Road Landfill 80,000
3.5.4 Material Recovery Diversion Credits
USEPA has developed estimates of the GHG reductions that can be achieved through the recovery and reuse of recyclable materials based on the reduction of the amount of energy required for producing new products from these materials versus the use of raw materials. As such, no effort has been made to estimate GHG emissions from various recycling operations. These factors will be discussed and used in subsequent evaluations of various recycling options.

Solid Waste Plan 2040 Page 32 Needs Assessment
Section 4 – Generation and Composition 4.1 Historical Waste Generation The solid waste generated from residential, commercial and industrial sources in the County increased over the last 20 years in terms of total tons generated, which is generally attributed to population growth, while the pound per capita per year (generation rate) has shown a slight decline over the same period. State and nation-wide economic conditions may have also had an impact on the annual per capita generated rate from 2008 to the present. The total amount of solid waste generated (MSW and C&D) in the County in FY2010/2011 was estimated to be 681,016 tons including quantities landfilled, exported and recycled (by public and private programs). Beginning in about FY2000/2001, a portion of the solid waste generated in the County began to be exported to other landfills in the region. This exportation was apparent in the drop in waste disposal that occurred at the Bluff Road Landfill in that year. In June 2003 the City enacted an ordinance, requiring the weighing of all refuse prior to export; quantities prior to that date were estimated.
4.2 Reporting and Data Collection Methods Since the collection of waste is handled solely by the private sector and is not subject to reporting requirements, the data used for determining waste generation in the County relied on two sources:
♦ The City’s annual surveys of the recycling and C&D processors servicing the County and the information they voluntarily report
♦ Available waste disposal records from the City solid waste operations, HHW collection events and from limited waste export records.
4.3 Analysis Methodology In order to estimate the waste generation and diversion quantities in the Planning Area, the methodology developed in the 1994 Plan was updated. The method utilized consisted of totaling the known quantity of solid waste disposed of in the Planning Area and the known quantity of materials recycled, composted or otherwise diverted from final disposal, using measured and reported data. This data, along with waste export data, were added to determine the total quantity of waste currently generated within the Planning Area.
City Solid Waste Operations provided data based on scaled tonnages at their Bluff Road and North 48th Street Landfills for solid waste and lawn waste and diverted tonnages based on their records obtained from various private system operators. The City also furnished information it obtained through annual hauler surveys. These data were utilized to estimate and project the residential and commercial solid waste generation; these data were also used to estimate diversion rates in the County. C&D quantities are analyzed separately based on historical trends since they are not as directly related to population growth.
4.4 Generation Rates Based on USEPA data for the last few decades, the generation, recycling, composting and disposal of MSW have changed substantially. While USEPA estimates that the MSW generation rate (pounds per person per day) has increased by approximately 21 percent between 1980 and 2010, the recycling rate has also increased from less than 10 percent of MSW generated in 1980 to approximately 34 percent in 2010. USEPA also estimates that disposal of MSW to a landfill has decreased from 89 percent of the amount generated in 1980 to about 54 percent of MSW generated in 2010, in part due to the use of waste incineration as a

Solid Waste Plan 2040 Page 33 Needs Assessment
disposal technique. USEPA estimates that on a nation-wide basis 55 to 65 percent of total MSW generated is residential waste (including waste from apartment houses), and waste from commercial and institutional locations, such as businesses, schools and hospitals accounts for 35 to 45 percent of the MSW stream.2
MSW is defined by USEPA to include durable goods, nondurable goods, containers and packaging, food wastes and yard trimmings, and miscellaneous inorganic wastes from residential, commercial, institutional and industrial sources. This definition only focuses on specific industry components and does not include all of the wastes typically generated within a community, such as automotive scrap, biosolids, CCR, construction debris and contaminated soils. In addition, it is a national average that does not take into account differences between metropolitan and rural areas.
An MSW generation rate was calculated for the last 10 years for the County based on the methodology discussed in Section 4.3. As shown in Table 4-1, the average MSW generation rate for the entire County over the last 10-year period is approximately 7.53 pounds per capita per day. This waste generation rate will be utilized for planning projections and in conjunction with waste disposal composition data for evaluation of potential future waste reduction and diversion options. While data collected at the Bluff Road Landfill does not allow a clear distinction between residential and commercial MSW, the City has utilized information on vehicle types and tonnages over the past five years and concluded that approximately one-half of the waste delivered to the Bluff Road Landfill represents residential waste (the other one-half would represent commercial waste). Using these City values, it was estimated that the residential generation rate is equivalent to 3.77 pounds per capita per day.
Table 4-1 – Historical Solid Waste Generation Tonnage in Lancaster County
Fiscal Year
MSW Landfilled in County
MSW Exported
Recyclables/ Composted
Materials Diverted
Total MSW Generation
Per Capita Generation
(lbs/day)
C&D Landfilled in County
C&D Diverted
Total C&D Generation
Total MSW and C&D
Generation
County Population
(Mid-Yr)
01-02 265,027 32,854 58,742 356,623 7.68 88,227 373,007 461,234 817,857 254,357
02-03 275,049 27,092 65,015 367,156 7.80 78,649 367,910 446,559 813,715 257,876
03-04 282,263 29,477 65,641 377,381 7.90 98,174 314,752 412,926 790,307 261,814
04-05 280,105 29,888 70,615 380,608 7.90 76,746 368,591 445,337 825,945 263,849
05-06 285,253 36,515 68,899 390,667 8.01 86,159 416,815 502,974 893,641 267,233
06-07 288,102 31,618 74,992 394,712 8.00 75,491 360,634 436,125 830,837 270,288
07-08 288,298 22,165 62,894 373,357 7.47 89,446 372,377 461,823 835,180 273,857
08-09 261,910 16,397 58,313 336,620 6.65 53,185 361,628 414,813 751,433 277,266
09-10 272,443 15,880 71,437 359,760 7.03 59,119 341,908 401,027 760,787 280,554
10-11 287,211 17,709 69,013 373,932 7.23 76,337 230,747 307,084 681,016 283,428
Note: Solid waste values used in this table exclude Coal Combustion Residues and biosolids materials.
As a validation of the above information on waste generation (recycling and disposal) rates, the data were compared to similar data from the 2012 Integrated Solid Waste Management Plan Update, prepared by the Metropolitan Area Planning Agency (MAPA) for Douglas and Sarpy Counties in Nebraska, including the City of Omaha.
The MAPA data included good information on residential generation rates because three of the larger Cities in this planning area (Omaha, Bellevue and Ralston) have organized collection
2 “Municipal Solid Waste Generation, Recycling and Disposal in the United States: Facts and Figures for
2010” USEPA , December 2011

Solid Waste Plan 2040 Page 34 Needs Assessment
programs for waste, recyclables and yard waste; however, the MAPA data has some inherent limitations relative to non-residential waste generation data. The MAPA planning area community data indicate that single-family residences generated MSW (waste, recyclables and yard waste materials) at an approximately average rate of 3.3 pounds per capita per day. It is recognized that residential generation rates, in general, will vary by household based on a number of factors including household size, demographic factors, and housing density. In addition, total MSW generation can vary significantly based on differences in waste generation rates that are a function of industry types in a community. When combined with the MSW from commercial and business establishments, the average generation rate from the 2012 MAPA plan was approximately 7.1 pounds per capita per day (versus the 7.53 pounds per capita per day). This difference in generation rates is not deemed significant and may be significantly influenced by the quality of the data available. As noted above, while portions of the data in the MAPA study were of very high quality, portions such as waste exports and imports and actual diversion rates were likely of a lesser quality than is available for planning purposes in Solid Waste Plan 2040.
4.5 Seasonal Fluctuations Solid waste unit generation rates were developed for the Planning Area based on the total annual waste quantities divided by population and 365 days per year. Factors that contribute to seasonal variation include: growing season (i.e., lawn wastes), weather patterns, sporting events and seasonal outdoor activities, such as construction and special events.
Another factor that can create dramatic fluctuations in seasonal waste quantities is natural disasters such as floods, tornados and building fires. Because existing systems and facilities are equipped to deal with such fluctuations, no further evaluation of the effects of such seasonal fluctuations are considered in this Needs Assessment.
4.6 Waste Composition In evaluating possible changes to solid waste management systems, facilities and programs; it is helpful to have an understanding of the composition of the waste stream.
NDEQ conducted a series of waste composition studies in 2007 and 2008. National data and recent waste composition studies completed by NDEQ are available and can provide useful data and insights into total waste generation and diversion quantities. While estimates of detailed waste composition may be useful in evaluating future waste management systems (including increased diversions, waste bans, HHW, WTE and/or other programs), it is equally important to recognize that waste received at the landfill is a heterogeneous mix and that most of these materials are not currently collected or managed in a form conducive to large volume recovery (i.e., they are all mixed together and cross-contaminated by other waste products).
NDEQ’s composition study included four seasonal sampling events (2007 to 2008) at the Bluff Road Landfill. The main objectives of this study were to determine the characteristics of Nebraska’s solid waste stream and establish a baseline of waste characterization data for the state. In addition, the results of the study provide a differentiation of the characteristics of Nebraska’s solid waste stream among: (1) facilities based upon size; (2) the four seasons; (3) the generating sectors – residential, commercial, and mixed; and (4) items sighted during the visual inspection process.
Table 4.2 shows the results of the NDEQ composition study for all waste types at the Bluff Road Landfill. Diversion from land disposal will be explored through other source reduction, recycling and composting, and resource recovery programs.

Solid Waste Plan 2040 Page 35 Needs Assessment
The NDEQ study reported that for the consolidated waste composition, the three main components of Bluff Road Landfill’s waste stream (by weight) were paper fibers (44 percent), plastics (19 percent) and food (16 percent). The NDEQ composition study also suggested that of the 19 percent plastics, 8 percent by weight was “plastic film/wrap/bags.”
Details of the data from the 526-page NDEQ report, relative to the Bluff Road Landfill, are included in Appendix A and summarized below. Data present in Table 4-2 represents a consolidation of composition information on material disposed of in Bluff Road landfill and does not include waste sent to the North 48th Street C&D landfill disposal sites. Because of the extensive nature of the composition study and the fact that this landfill is the principal MSW disposal site in the Planning Area, this composition information is considered accurate for planning additional diversion programs and has not been modified by national data.
Table 4-2 – 2008 Nebraska Waste Characterization Study (Bluff Road Landfill) – Consolidated Composition Data
Material Category Percent of TotalCardboard 9.51%Office Paper 4.87%Newsprint 5.13%Magazines 3.87%Paperboard 4.80%Mixed Paper 15.95%
Total Paper 44.11%PET #1 2.95%HDPE #2 1.52%Other Containers 3.14%Plastics Film 7.68%Other Plastics 4.18%
Total Plastics 19.47%Clear Glass 2.33%Brown Glass 1.20%Green Glass 0.49%Blue Glass 0.01%Other Glass 0.16%
Total Glass 4.18%Aluminum Cans 1.00%Other Aluminum 0.29%Tin Cans 1.54%Other Tin 0.15%Other Mixed Metals 0.22%
Total Metals 3.20%Food 16.02%Textiles/Rubber/Leather 4.27%Yard Waste 2.88%Wood 0.31%Misc C/D 0.17%Diapers 3.07%Household Hazardous 0.02%Electronic Waste 0.41%Dry Cell Batteries 0.08%Empty Aerosol Cans 0.17%Non-Distinct 1.14%Other Misc Waste 0.50%
Total Other Waste 29.03%Total Sample 100.00%

Solid Waste Plan 2040 Page 36 Needs Assessment
4.7 Waste Diversion Waste diversion includes many types of activities including source reduction, recycling and composting. Estimates of waste diversion, for purposes of this document are limited to recycling and composting (including wood waste management) that are reasonably documentable from City activities and private efforts. The City maintains records on the quantities of diverted materials handled through City systems, facilities and programs (e.g. drop-off site, North 48th Street Transfer Station, Bluff Road composting facility, etc.). The City also routinely conducts surveys of private-sector recyclers in an effort to document and track quantities diverted through a variety of programs (curbside recycling, processing facilities, , scrap yards, etc.). The data provided by these private-sector recycling programs is provided on a voluntary basis; while it is assumed accurate for purposes of planning, there is no way to confirm the accuracy or completeness.
The facilities that process recyclables may also take in materials such as scrap metals from automobiles and other types of recyclable materials not included in the materials types addressed by this planning effort. Efforts have been undertaken to correct the raw data on ferrous metals to account for these automobiles. It is also not know how much recyclable materials are exported or imported into the Planning Area, since there is not mechanism to track or report such information.
Data and assumptions used in documenting current diversion rates are provided in this Needs Assessment (Sections 3 and 4) to allow a better understanding of estimates of existing conditions. In forecasting future waste generation and diversion (Section 5), it is generally assumed that current relationships (ratios) between quantities disposed versus diverted will remain constant. This baseline assumption can then be used to prepare evaluations of alternatives that may lead greater diversion and the implication of such changes on baseline estimates of waste disposal.

Solid Waste Plan 2040 Page 37 Needs Assessment
Section 5 – Future Management and Disposal Needs Projections of future waste generation quantities for the Planning Area are presented below. In planning for waste management facilities, it is important to reasonably and realistically project the potential quantity of waste expected to be managed or disposed of by the various systems, facilities and programs. Underestimating quantities of waste and/or overestimating recycling and diversion can reduce the life of the landfill, increasing the need for further planning adjustments. As described more fully below, the unit generation rates established in Section 4 have been applied to population, summarized in Section 2. USEPA has reported that the growth in unit waste generation rates, which had increased from the 1960s through the early 1990s, had leveled off between 1990 and 2007 and shown a decrease through 2010 (USEPA, December 2011). Because the decrease in the unit generation rate is assumed to be associated with the economic recession, it was assumed that previously calculated unit generation rates (pounds per capita per day) will remain constant and that only population growth will affect increases in quantities in future projections.
5.1 Future Quantity Forecasts Future waste quantities are forecasted using the unit waste generation rates derived in Section 4 and the population projections presented below. These forecasts represent the waste quantities baseline expected to be generated and disposed from the Planning Area. Table 5-1 show baseline projections of total waste quantities generated and disposed of in landfills (in-county and out-of-county landfills). The difference between total generation and total disposal is considered to be diversion quantities, based on status quo.
Table 5-1 – Waste Generation Projections
Waste Generation FY2011 FY2015 FY2020 FY2025 FY2030 FY2035 FY2040
MSW Generation - Total 373,932 423,600 451,433 479,364 509,412 539,788 569,977 MSW Diversion 69,013 78,179 83,316 88,471 94,016 99,623 105,194 MSW Disposal Total 304,920 345,420 368,117 390,893 415,395 440,165 464,783
MSW Disposal - In County 287,211 325,360 346,738 368,192 391,270 414,602 437,790 MSW Disposal - Export 17,709 20,061 21,379 22,702 24,125 25,563 26,993
C&D Generation - Total 307,084 490,770 523,017 555,378 590,190 625,383 660,359 C&D Diversion 230,747 401,362 427,734 454,199 482,669 511,451 540,055
C&D Disposal 76,337 89,408 95,283 101,179 107,521 113,932 120,304
These are described as a baseline forecast because the forecasts assume no significant change in disposal, export and diversion practices. The disposal quantities baseline forecasted will serve as the basis for further evaluation of alternatives and identification of Planning Area needs. Waste generation projections are presented in Table 5-1 for the years 2015, 2020, 2025, 2030, 2035 and 2040 based on population growth rates provided in Table 2-2, as discussed in Section 2. Detailed annual projections are provided in Appendix B. A variety of factors can affect the accuracy of these projections, including fluctuations in economic activities, lawn waste management practices, diversion practices, regulatory and policy changes, actual population growth rates, and the limits of the data used to derive waste generation rates (i.e., lack of formal data reporting mechanisms for certain data). C&D generation has fluctuated over the years based on numerous factors including economic activity, exports, diversion and other factors, but has been relatively stable over the past 10 years. C&D waste generation is not directly related to population growth; therefore, it is more difficult to predict C&D waste

Solid Waste Plan 2040 Page 38 Needs Assessment
generation. For projection purposes, the average growth rate has been assumed to be equal to the population growth rates reflected in Table 2-2 “Trend Series”..
Table 5-2 shows a comparison of projected disposal requirements at the Bluff Road Landfill using the information included in Table 5-1 and information included in the 2012 Bluff Road Landfill permit renewal. The permit renewal used historic trends over the history of the site (which were influenced by exports, diversion and economic factors) to calculate a growth rate for waste disposal; the calculated growth rate is 0.25 percent per year. As can be seen from the comparison, historic trends project lower disposal rates in the Bluff Road site and, as such, a longer site life. Using the information from Table 5-1, the Bluff Road Landfill would be projected to close in 2032 in contrast to the forecasted 2037 closure timeframe contained in the NDEQ permit for this facility. The 2032 closure value, derived from population growth pattern forecasts, will be used in the development of the Solid Waste Plan 2040.
Table 5-2 – Comparison of Projected MSW Generated for Disposal, Tons
Fiscal Year Permit Projections Plan Projections FY2015 284,510 325,360 FY2020 288,080 346,738 FY2025 291,700 368,192 FY2030 295,360 391,270 FY2035 299,070 414,602
5.2 Waste Disposal Capacity As shown in Table 5-1, using 2011 data it is estimated that approximately 77 percent of the generated MSW waste (excluding C&D waste (e.g., concrete and asphalt)) is disposed in the Bluff Road Landfill, another 5 percent is exported to out-of-county landfills and the remaining 18 percent is diverted by reuse, recycling, composting or related techniques. If the quantities of the C&D waste (concrete and asphalt) are included with the MSW to estimate the “total waste generation”, approximately 53 percent of the generated waste is disposed of in City landfills, another 3 percent is exported to out-of-county landfills, and the remaining 44 percent is diverted by reuse, recycling, composting or related techniques (see Figure 5-1).

Solid Waste Plan 2040 Page 39 Needs Assessment
Figure 5-1 – 2011 Waste Disposal and Diversion, by Percentage
5.3 Facilities Needs Site life projections for the Bluff Road Landfill using the two methods of estimating waste disposal quantities presented in Table 5-2 provide estimates of this site reaching capacity between 2032 and 2037, assuming no significant change in current waste generation rates. Future evaluations conducted as part of the planning process will examine options to reduce waste disposal as well as decisions such as an expanded service area, which could lead to a potential shorter site life. However, for planning purposes, since the baseline estimate of remaining life at the Bluff Road site suggests that it will reach capacity prior to 2040, the planning effort will also address means to provide future disposal capacity beyond 2040. The need for such additional long-term disposal capacity was also identified in the LPlan 2040.
As noted above, the North 48th Street C&D Landfill is projected to have capacity through 2030. Thus, a new facility for handling construction and demolition debris will need to be identified during the planning period. The LPlan 2040 also says that “While this landfill should be completed and closed, the N 48th Street transfer station and recycling areas are scheduled to remain.”
Subsequent evaluation conducted as part of the Solid Waste Plan 2040 will also consider the need for new facilities, including a permanent facility for HHW, new or expanded transfer station operations, facilities to handle or divert other wastes, the existing recycling drop-off centers and possibly others. If the Solid Waste Plan 2040 includes significant increases in recycling additional evaluations may be necessary to determine whether existing processing facilities have adequate capacity to process such increases or whether additional facilities may be required.
5.4 Management Programs The data collected through the public awareness baseline survey and further evaluations will examine the need for and options to modify existing programs or develop new programs. The

Solid Waste Plan 2040 Page 40 Needs Assessment
types of management programs that will be addressed in the planning process are anticipated to include the following:
♦ Source reduction ♦ Material Reuse ♦ Collection system ♦ Recycling (residential and commercial) ♦ Recycling Incentives ♦ Transfer stations and processing facilities ♦ Disposal facilities ♦ Management programs specific to:
o Municipal solid waste o Construction and demolition wastes o Organic waste:
Composting Yard waste
o Wastes requiring special handling: HHW Universal wastes Unique waste streams Special Waste Wastes banned from disposal
5.5 Regulatory/Permit Requirements The implementation of the goals and objectives established as part of the planning process is anticipated to require various definitive actions, including those that may have policy, regulatory or permitting implications. The primary regulatory areas of focus will be those included in the state law (specifically NDEQ regulations) and the LMC, which govern solid waste management systems, facilities and programs. There are also pending federal regulations that could affect management of biosolids, CCR, e-waste and other components of the waste stream.
While changes to NDEQ regulations are not anticipated as a result of the Plan, it is anticipated that City policies and regulations may require enhancements or changes to ultimately implement recommendations of the Plan. Recommended changes will be indentified in the planning process, but implementation of these actions is beyond the scope of the planning process. Additionally, to implement some of the changes, it may be necessary for the City-County to establish additional permit requirements or to enhance existing permit programs.
New regulations, laws or policies may be necessary to reach goals stated in the Plan (or other related planning efforts within the Planning Area); they may be necessary to establish or secure funding and to capture the value of solid waste; or they may be necessary to further ensure safe, sound, environmentally responsible waste management practices. For example:
♦ There are currently only limited regulations on transfer stations and processing facilities in the Planning Area, including criteria that would be used to judge the need or appropriateness for construction of new facilities.
♦ There are no regulations (locally or at the state level) requiring firms involved in waste diversion, collection and recycling operations to report tonnages handled or information on type and source, or in some instances destination of waste/materials received.
For many of the waste and material types generated in the Planning Area, each has its own set of regulatory constraints, management options, management infrastructure and programs. The potential need for policy and regulatory changes may also need to focus on how to fund various

Solid Waste Plan 2040 Page 41 Needs Assessment
changes, which may require additional regulations. In general, it is anticipated that future changes necessary to implement recommendations of the Plan would require further regulatory evaluation, policy changes, and additional laws or regulations.
5.6 Regional Programs and Facilities Section 3.3.4 of this report identifies existing regional and potentially competing disposal facilities. There are also programs and facilities in the region that can or do complement the existing solid waste management system, such as regional recycling facilities, waste education programs, facilities that accept difficult to manage materials such as batteries, tires, chemical and pharmaceutical wastes. In the development of the Plan, efforts will be made to identify regional opportunities for units of government to cooperatively provide solid waste management facilities or programs for the benefit of Planning Area members. With program options identified to be evaluated, the planning effort will consider those that may be implemented cooperatively on a multi-jurisdictional basis. In such instances, cooperative agreements may be applicable.
5.7 Summary of Solid Waste Management Needs While consideration of the program options, as a part of the planning process, may identify a wide range of potential changes or enhancements, the key needs identified in developing the Needs Assessment were as follows:
♦ Compliance with state and local laws, regulations and policies. ♦ Under the status quo, a new MSW landfill will be needed prior to the end of the planning
period. ♦ Under the status quo, a new C&D landfill will be needed prior to the end of the planning
period. ♦ Additional mechanisms may be necessary to better collect information on types and
quantities of materials being diverted and possibly on waste exports.
While not strictly considered essential needs, the planning process may identify additional systems, facilities or programs that are deemed needed to meet societal demands, or environment and economic goals and objectives identified in the planning process (e.g. household hazardous waste facility, additional recycling and composting, processing facilities and markets for recovered/diverted materials).
5.8 Forecast Variables Due to the limited uncertainty associated with preparing waste projections, there are three major factors that have the potential to significantly impact the estimates of local disposal capacity needed:
♦ Regulatory changes related to management of biosolids and CCR ♦ Changes in waste export quantities or imports ♦ Changes in diversion practices associated with NDEQ regulations, which now allow
disposal of yard waste in the Bluff Road Landfill
The current management practices for diversion of CCR and biosolids are being evaluated by USEPA. Changes to regulations regarding biosolids have the potential to require this material to be directed to a disposal site rather than land application. If all the biosolids from the Planning Area were directed to the Bluff Road Landfill starting in 2013, it would represent an increase of 11 percent in projected disposal quantities at this landfill. This would theoretically decrease the overall life of the landfill by approximately 2 years.
Currently, CCR materials are largely recycled with only a small portion disposed of in a dedicated landfill (Monofill). While regulatory changes may reduce the quantities that can be

Solid Waste Plan 2040 Page 42 Needs Assessment
diverted, it is not currently projected that CCR materials will be directed to the Bluff Road Landfill; as such, changes in regulation may reduce diversion rates but are not anticipated to affect the remaining MSW landfill capacity in the Planning Area.
As noted above, waste exports represent approximately 5 percent of the MSW that might otherwise be sent to the Bluff Road Landfill. If waste exports were to cease starting in 2013, the increase in disposal tonnage would reduce the life of the landfill by approximately 1 year. The LMC (LMC 8.32.070) stipulates that the designated public sanitary landfills in the County (Bluff Road Landfill and North 48th Street Landfill) are authorized for the citizens of the City, residents of the County, and for the disposal of solid waste generated within the County. As part of the planning process, the City may examine options to allow waste to enter the County for disposal; if this were to occur, there may be benefits to the City, but the increase in disposal quantities would reduce the overall life of the landfills.
All solid waste currently directed to the City’s transfer station is disposed of at the Bluff Road Landfill. If additional transfer stations are build in the Planning Area, they could change the quantities exported, but absent such decision, it is beyond the scope of this Needs Assessment to speculate on how such uncertain changes could affect waste exports.
As shown in Table 4-2, above, approximately 3 percent of the material currently disposed of at the Bluff Road Landfill was estimated to be yard waste. However, approximately 8 percent of the total MSW generation in the Planning Area is yard waste (which includes brush and wood wastes). Of the total yard waste and wood collected for management, in the Planning Area, two-thirds is currently estimated to be managed by composting and chipping (through the City’s composting site). If all of the yard and wood waste materials collected in the County were directed to the Bluff Road Landfill starting in 2013, it would decrease the overall life of the landfill by approximately 1 year.
While it is possible to examine a wide range of factors that might affect variations in waste generation (i.e., changes in projections for population and employment growth) or improvements in waste reduction and recycling, the results of any such assumptions are still only assumed values. As such, the baseline estimates for landfilled waste at the Bluff Road Landfill have been shown with an upper and lower range of plus or minus 20 percent. The upper range may reflect one or more of the following considerations: 1) higher than projected employment, 2) higher than projected increases in population, 3) lower than projected exports, 4) imports, 5) disposal of biosolids, or 6) disposal of increase quantities of yard waste. The lower range may reflect one or more of the following considerations: 1) lower than projected employment, 2) lower than projected increases in population, 3) increased diversions, or 4) increased waste exports. If technologies such as waste combustion (e.g., WTE) are employed, they have the potential to reduce the volume of the waste requiring landfilling substantially. While not all waste would typically be managed by a WTE facility, for typical MSW, the combustion process can be expected to reduce the volume of the combusted fraction by 90 percent. The benefits of WTE will be addressed in the planning process, but depending on when such as system is assumed to be placed in service, it could substantially increase the life of an MSW landfill. C&D waste is mostly inert and as such would not be a candidate for volume reduction through the WTE technology.
The North 48th Street Landfill is projected to reach capacity in 2030. The quantities of C&D wastes currently delivered to this site are equivalent to approximately 20 to 30 percent of the solid waste disposed in the Bluff Road Landfill.
The results of these variations from the baseline are shown graphically in Figure 5-2. Figure 5-2 is intended to further illustrate the effects of uncertainties on the overall life of the City’s landfills. The baselines and banding are also intended to be used to as a basis of evaluation for future

Solid Waste Plan 2040 Page 43 Needs Assessment
diversion options and to illustrate how future programs may affect disposal capacity (existing or required).
Figure 5-2 – Waste Generation and Management Baseline C&D Disposal Requirements
MSW Disposal Requirements

Solid Waste Plan 2040 Page 44 Needs Assessment
5.9 Waste Tracking Needs To more accurately assess the quantity of waste generated and materials diverted from disposal, a better waste tracking system is needed. Where organized and municipally managed programs are in place, the collected, diverted and disposed quantities of material are tracked and the information is available. Currently, information on waste collection and recycling done on a free market and voluntary basis is provided on a voluntary basis, is not always readily available and in some instance is guarded by the businesses as confidential information. Because of this, more precise estimates of the true waste generation and diversion rates are not possible.
If the Planning Area members wish to have a more accurate assessment of these quantities, added regulations may be required; it is not currently anticipated that totally voluntary reporting efforts will provide this information. Additionally, to undertake this tracking will require added costs to compile the information and enforce requirements on reporting. It is generally anticipated that the most reliable means of obtaining accurate records will be through business and hauler licensing and reporting requirements tied to those licenses.

Appendix A 2008 Nebraska Waste
Characterization Study – Excerpts
A complete copy of the 437 pages, Appendix B of the FINAL REPORT, STATE OF NEBRASKA, WASTE CHARACTERIZATION STUDY is located on the City’s Solid Waste Operations website, http://lincoln.ne.gov/city/pworks/waste/sldwaste/ under the Documents tab. Appendix B, contains all compositional information related to the City’s Bluff Road Landfill.

FINAL REPORT STATE OF NEBRASKA WASTE CHARACTERIZATION STUDY Appendix B
Prepared for State of Nebraska Department of Environmental Quality 1200 N Street, Suite 400 Lincoln, Nebraska 68509
Prepared by Engineering Solutions & Design, Inc. 9393 W. 110th Street, Suite 500 Overland Park, Kansas 66210 (800) 298-1851
March 9, 2009
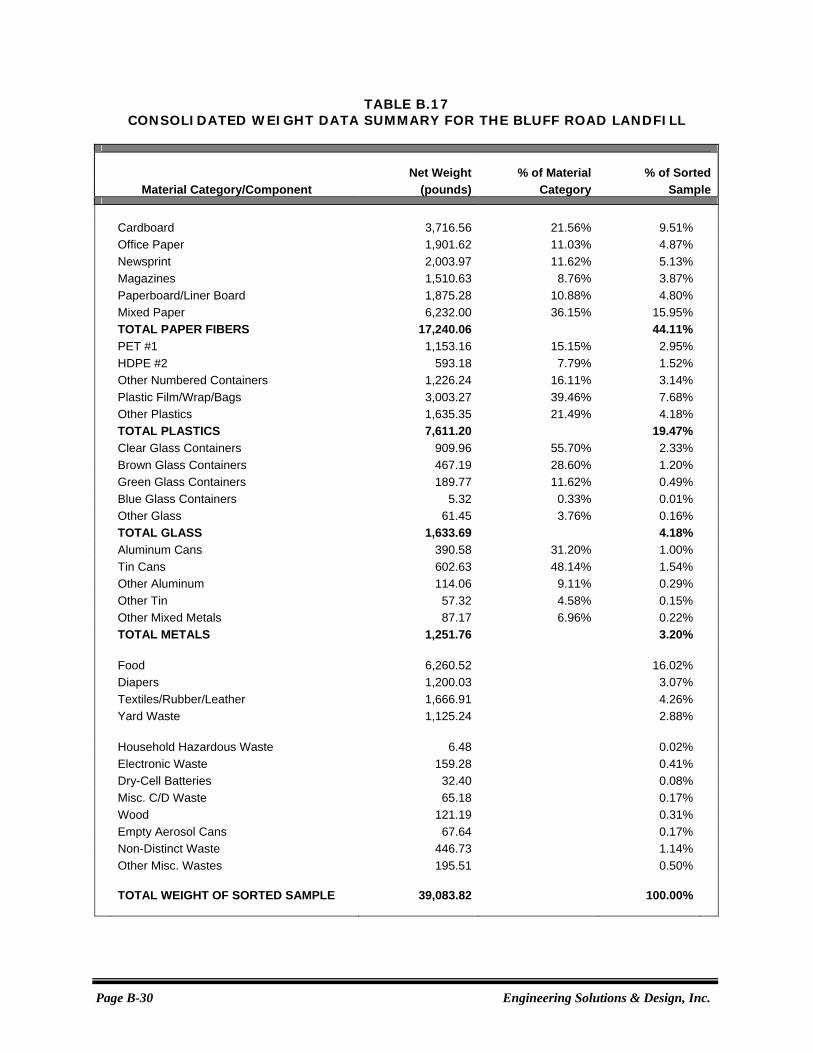
Page B-30 Engineering Solutions & Design, Inc.
TABLE B.17 CONSOLIDATED WEIGHT DATA SUMMARY FOR THE BLUFF ROAD LANDFILL
Net Weight % of Material % of Sorted Material Category/Component (pounds) Category Sample
Cardboard 3,716.56 21.56% 9.51% Office Paper 1,901.62 11.03% 4.87% Newsprint 2,003.97 11.62% 5.13% Magazines 1,510.63 8.76% 3.87% Paperboard/Liner Board 1,875.28 10.88% 4.80% Mixed Paper 6,232.00 36.15% 15.95% TOTAL PAPER FIBERS 17,240.06 44.11% PET #1 1,153.16 15.15% 2.95% HDPE #2 593.18 7.79% 1.52% Other Numbered Containers 1,226.24 16.11% 3.14% Plastic Film/Wrap/Bags 3,003.27 39.46% 7.68% Other Plastics 1,635.35 21.49% 4.18% TOTAL PLASTICS 7,611.20 19.47% Clear Glass Containers 909.96 55.70% 2.33% Brown Glass Containers 467.19 28.60% 1.20% Green Glass Containers 189.77 11.62% 0.49% Blue Glass Containers 5.32 0.33% 0.01% Other Glass 61.45 3.76% 0.16% TOTAL GLASS 1,633.69 4.18% Aluminum Cans 390.58 31.20% 1.00% Tin Cans 602.63 48.14% 1.54% Other Aluminum 114.06 9.11% 0.29% Other Tin 57.32 4.58% 0.15% Other Mixed Metals 87.17 6.96% 0.22% TOTAL METALS 1,251.76 3.20% Food 6,260.52 16.02% Diapers 1,200.03 3.07% Textiles/Rubber/Leather 1,666.91 4.26% Yard Waste 1,125.24 2.88% Household Hazardous Waste 6.48 0.02% Electronic Waste 159.28 0.41% Dry-Cell Batteries 32.40 0.08% Misc. C/D Waste 65.18 0.17% Wood 121.19 0.31% Empty Aerosol Cans 67.64 0.17% Non-Distinct Waste 446.73 1.14% Other Misc. Wastes 195.51 0.50% TOTAL WEIGHT OF SORTED SAMPLE 39,083.82 100.00%

Page B-32 Engineering Solutions & Design, Inc.
CHART B.1 DISTRIBUTION OF THE CONSOLIDATED WEIGHT DATA
FOR THE BLUFF ROAD LANDFILL
CHART B.2 DISTRIBUTION OF THE CONSOLIDATED VOLUME DATA
FOR THE BLUFF ROAD LANDFILL
Total Plastics 19.47%
Total Paper Fibers 44.11%
Diapers 3.07%
Total Glass 4.18%
Total Metals 3.20%
Food 16.02%
Yard Waste 2.88%
Textiles/Rubber/Leath 4.26%
All Other Waste 2.81%
0.00%
5.00%
10.00%
15.00%
20.00%
25.00%
30.00%
35.00%
40.00%
45.00%
50.00%
Total P
aper
Fibers
Total P
lastic
s
Total G
lass
Total M
etals
Food
Diapers
Textile
s/Rub
ber/L
eath
Yard W
aste

Page B-34 Engineering Solutions & Design, Inc.
TABLE B.19 RESIDENTIAL WEIGHT DATA SUMMARY FOR THE BLUFF ROAD LANDFILL
Net Weight % of Material % of Sorted Material Category/Component (pounds) Category Sample
Cardboard 257.85 4.02% 1.50% Office Paper 683.93 10.67% 3.99% Newsprint 1,151.88 17.97% 6.72% Magazines 886.67 13.83% 5.17% Paperboard/Liner Board 999.01 15.58% 5.83% Mixed Paper 2,432.27 37.94% 14.19% TOTAL PAPER FIBERS 6,411.61 37.39% PET #1 488.16 14.19% 2.85% HDPE #2 322.39 9.37% 1.88% Other Numbered Containers 514.16 14.95% 3.00% Plastic Film/Wrap/Bags 1,322.42 38.45% 7.71% Other Plastics 792.27 23.04% 4.62% TOTAL PLASTICS 3,439.40 20.06% Clear Glass Containers 536.42 58.59% 3.13% Brown Glass Containers 227.41 24.84% 1.33% Green Glass Containers 115.94 12.66% 0.68% Blue Glass Containers 1.08 0.12% 0.01% Other Glass 34.71 3.79% 0.20% TOTAL GLASS 915.56 5.34% Aluminum Cans 197.10 30.70% 1.15% Tin Cans 317.17 49.40% 1.85% Other Aluminum 53.25 8.29% 0.31% Other Tin 26.22 4.08% 0.15% Other Mixed Metals 48.36 7.53% 0.28% TOTAL METALS 642.10 3.74% Food 2,807.68 16.38% Diapers 782.43 4.56% Textiles/Rubber/Leather 984.01 5.74% Yard Waste 660.64 3.85% Household Hazardous Waste 3.85 0.02% Electronic Waste 80.88 0.47% Dry-Cell Batteries 21.35 0.12% Misc. C/D Waste 2.37 0.01% Wood 67.65 0.39% Empty Aerosol Cans 34.87 0.20% Non-Distinct Waste 286.29 1.67% Other Misc. Wastes 5.38 0.03% TOTAL WEIGHT OF SORTED SAMPLE 17,146.07 100.00%

Page B-36 Engineering Solutions & Design, Inc.
CHART B.3 DISTRIBUTION OF THE CONSOLIDATED RESIDENTIAL
WEIGHT DATA FOR THE BLUFF ROAD LANDFILL
CHART B.4 DISTRIBUTION OF THE CONSOLIDATED RESIDENTIAL
VOLUME DATA FOR THE BLUFF ROAD LANDFILL
Total Plastics 20.06%
Total Paper Fibers 37.39%
Diapers 4.56%
Total Glass 5.34%
Total Metals 3.74%
Food 16.38%
Yard Waste 3.85%
Textiles/Rubber/Leath 5.74%
All Other Waste 2.94%
0.00%
5.00%
10.00%
15.00%
20.00%
25.00%
30.00%
35.00%
40.00%
45.00%
Total P
aper
Fibers
Total P
lastic
s
Total G
lass
Total M
etals
Food
Diapers
Textile
s/Rub
ber/L
eath
Yard W
aste

Page B-38 Engineering Solutions & Design, Inc.
TABLE B.21 COMMERCIAL WEIGHT DATA SUMMARY FOR THE BLUFF ROAD LANDFILL
Net Weight % of Material % of Sorted Material Category/Component (pounds) Category Sample
Cardboard 3,407.96 31.91% 15.73% Office Paper 1,188.83 11.13% 5.49% Newsprint 839.80 7.86% 3.88% Magazines 614.69 5.76% 2.84% Paperboard/Liner Board 871.27 8.16% 4.02% Mixed Paper 3,756.33 35.18% 17.34% TOTAL PAPER FIBERS 10,678.88 49.28% PET #1 656.19 15.90% 3.03% HDPE #2 268.50 6.51% 1.24% Other Numbered Containers 707.82 17.15% 3.27% Plastic Film/Wrap/Bags 1,664.85 40.35% 7.68% Other Plastics 828.81 20.09% 3.83% TOTAL PLASTICS 4,126.17 19.04% Clear Glass Containers 373.54 52.08% 1.72% Brown Glass Containers 238.89 33.31% 1.10% Green Glass Containers 73.83 10.29% 0.34% Blue Glass Containers 4.24 0.59% 0.02% Other Glass 26.74 3.73% 0.12% TOTAL GLASS 717.24 3.31% Aluminum Cans 192.38 31.81% 0.89% Tin Cans 283.09 46.80% 1.31% Other Aluminum 60.30 9.97% 0.28% Other Tin 31.10 5.14% 0.14% Other Mixed Metals 37.96 6.28% 0.18% TOTAL METALS 604.83 2.79% Food 3,437.95 15.87% Diapers 415.67 1.92% Textiles/Rubber/Leather 681.78 3.15% Yard Waste 464.60 2.14% Household Hazardous Waste 2.63 0.01% Electronic Waste 78.40 0.36% Dry-Cell Batteries 11.05 0.05% Misc. C/D Waste 62.81 0.29% Wood 53.54 0.25% Empty Aerosol Cans 32.77 0.15% Non-Distinct Waste 160.06 0.74% Other Misc. Wastes 139.58 0.64% TOTAL WEIGHT OF SORTED SAMPLE 21,667.96 100.00%

Page B-40 Engineering Solutions & Design, Inc.
CHART B.5 DISTRIBUTION OF THE CONSOLIDATED COMMERCIAL
WEIGHT DATA FOR BLUFF ROAD LANDFILL
CHART B.6 DISTRIBUTION OF THE CONSOLIDATED COMMERCIAL
VOLUME DATA FOR BLUFF ROAD LANDFILL
0.00%
5.00%
10.00%
15.00%
20.00%
25.00%
30.00%
35.00%
40.00%
45.00%
50.00%
Total P
aper
Fibers
Total P
lastic
s
Total G
lass
Total M
etals
Food
Diapers
Textile
s/Rub
ber/L
eath
Yard W
aste
Total Plastics 19.04%
Total Paper Fibers 49.28%
Diapers 1.92%
Total Glass 3.31%
Total Metals 2.79%
Food 15.87%
Yard Waste 2.14%Textiles/Rubber/Leath
3.15%
All Other Waste 2.50%

Page B-44 Engineering Solutions & Design, Inc.
TABLE B.23 COMPARISON OF THE CONSOLIDATED WEIGHT DATA FOR
RESIDENTIAL AND COMMERCIAL SAMPLES AT THE BLUFF ROAD LANDFILL
CONSOLIDATED FIELD SORTING EVENTS (FALL 2007, WINTER 2008, SPRING 2008, AND SUMMER 2008) Percentage of the Net Weight of the Sorted Samples
Residential
Commercial Material Category/Component Waste Stream Waste Stream
Cardboard 1.50% 15.73% Office Paper 3.99% 5.49% Newsprint 6.72% 3.88% Magazines 5.17% 2.84% Paperboard/Liner Board 5.83% 4.02% Mixed Paper 14.19% 17.34% TOTAL PAPER FIBERS 37.39% 49.28% PET #1 2.85% 3.03% HDPE #2 1.88% 1.24% Other Numbered Containers 3.00% 3.27% Plastic Film/Wrap/Bags 7.71% 7.68% Other Plastics 4.62% 3.83% TOTAL PLASTICS 20.06% 19.04% Clear Glass Containers 3.13% 1.72% Brown Glass Containers 1.33% 1.10% Green Glass Containers 0.68% 0.34% Blue Glass Containers 0.01% 0.02% Other Glass 0.20% 0.12% TOTAL GLASS 5.34% 3.31% Aluminum Cans 1.15% 0.89% Tin Cans 1.85% 1.31% Other Aluminum 0.31% 0.28% Other Tin 0.15% 0.14% Other Mixed Metals 0.28% 0.18% TOTAL METALS 3.74% 2.79% Food 16.38% 15.87% Diapers 4.56% 1.92% Textiles/Rubber/Leather 5.74% 3.15% Yard Waste 3.85% 2.14% Household Hazardous Waste 0.02% 0.01% Electronic Waste 0.47% 0.36% Dry-Cell Batteries 0.12% 0.05% Misc. C/D Waste 0.01% 0.29% Wood 0.39% 0.25% Empty Aerosol Cans 0.20% 0.15% Non-Distinct Waste 1.67% 0.74% Other Misc. Wastes 0.03% 0.64%

Engineering Solutions & Design, Inc. Page B-45
CHART B.7 DISTRIBUTION OF CONSOLIDATED WEIGHT DATA FOR
RESIDENTIAL AND COMMERCIAL SAMPLES AT THE BLUFF ROADLANDFILL
0.00%
10.00%
20.00%
30.00%
40.00%
50.00%
60.00%
Total P
aper
Fibers
Total P
lastic
s
Total M
etals
Total G
lass
Food
Diapers
Textile
s/Rub
ber/L
eath
Yard W
aste
All Othe
r Was
te
Residential Waste Commercial Waste

Appendix B Waste Generation Projections

FY2013 FY2014 FY2015 FY2016 FY2017 FY2018 FY2019 FY2020 FY2021 FY2022 FY2023 FY2024 FY2025 FY2026 County Population
City Lincoln 269,372 273,139 276,959 280,832 284,759 288,742 292,780 296,875 301,026 305,236 309,505 313,833 318,222 322,673
Other Towns and Villages 9,103 9,290 9,481 9,676 9,874 10,077 10,284 10,495 10,710 10,930 11,154 11,383 11,617 11,856
Unincorporated Lancaster County 19,530 19,898 20,271 20,132 19,985 19,830 19,666 19,495 19,076 18,642 18,193 17,729 17,248 16,806
Total County Population 298,005 302,327 306,711 310,640 314,619 318,649 322,730 326,864 330,812 334,808 338,852 342,945 347,088 351,334
Waste Generation - Status Quo
MSW Generation 411,576 417,544 423,600 429,025 434,521 440,087 445,724 451,433 456,886 462,405 467,990 473,643 479,364 485,229
MSW Diversion 75,960 77,061 78,179 79,180 80,195 81,222 82,262 83,316 84,322 85,341 86,372 87,415 88,471 89,553
Yard Waste and Wood Chips 21,455 21,766 22,082 22,365 22,651 22,942 23,235 23,533 23,817 24,105 24,396 24,691 24,989 25,295
Other Recycling Programs 54,079 54,863 55,659 56,372 57,094 57,825 58,566 59,316 60,032 60,758 61,491 62,234 62,986 63,756
MSW Disposal Total 335,616 340,483 345,420 349,845 354,326 358,865 363,461 368,117 372,564 377,064 381,618 386,228 390,893 395,675
MSW Disposal - In County 316,124 320,709 325,360 329,527 333,748 338,023 342,353 346,738 350,926 355,165 359,455 363,797 368,192 372,696
MSW Disposal - Export 19,491 19,774 20,061 20,318 20,578 20,842 21,109 21,379 21,637 21,899 22,163 22,431 22,702 22,980
C&D Generation 435,616 441,934 448,343 454,086 459,902 465,793 471,759 477,802 483,573 489,415 495,326 501,310 507,365 513,572
C&D Diversion 356,256 361,422 366,664 371,360 376,117 380,935 385,814 390,756 395,476 400,253 405,088 409,981 414,933 420,009
C&D Disposal 79,360 80,511 81,679 82,725 83,785 84,858 85,945 87,046 88,097 89,161 90,238 91,328 92,432 93,562
FY2027 FY2028 FY2029 FY2030 FY2031 FY2032 FY2033 FY2034 FY2035 FY2036 FY2037 FY2038 FY2039 FY2040 County Population
City Lincoln 327,185 331,761 336,401 341,105 345,876 350,713 355,618 360,591 365,634 370,747 375,932 381,190 386,521 391,926
Other Towns and Villages 12,099 12,347 12,601 12,859 13,123 13,393 13,668 13,948 14,235 14,527 14,825 15,129 15,440 15,757
Unincorporated Lancaster County 16,348 15,874 15,385 14,879 14,142 13,383 12,602 11,797 10,969 9,841 8,682 7,491 6,269 5,014
Total County Population 355,632 359,983 364,386 368,844 373,141 377,489 381,887 386,337 390,838 395,115 399,439 403,810 408,230 412,697
Waste Generation - Status Quo
MSW Generation 491,164 497,173 503,255 509,412 515,347 521,351 527,426 533,571 539,788 545,695 551,667 557,704 563,807 569,977
MSW Diversion 90,649 91,758 92,880 94,016 95,112 96,220 97,341 98,475 99,623 100,713 101,815 102,929 104,056 105,194
Yard Waste and Wood Chips 25,604 25,918 26,235 26,556 26,865 27,178 27,495 27,815 28,139 28,447 28,758 29,073 29,391 29,713
Other Recycling Programs 64,536 65,326 66,125 66,934 67,714 68,503 69,301 70,108 70,925 71,701 72,486 73,279 74,081 74,892
MSW Disposal Total 400,516 405,415 410,375 415,395 420,235 425,131 430,085 435,096 440,165 444,982 449,852 454,775 459,751 464,783
MSW Disposal - In County 377,255 381,870 386,542 391,270 395,829 400,441 405,107 409,827 414,602 419,139 423,726 428,363 433,051 437,790
MSW Disposal - Export 23,261 23,545 23,833 24,125 24,406 24,690 24,978 25,269 25,563 25,843 26,126 26,412 26,701 26,993
C&D Generation 519,854 526,214 532,651 539,167 545,449 551,804 558,234 564,738 571,318 577,570 583,891 590,280 596,740 603,271
C&D Diversion 425,147 430,348 435,613 440,942 446,080 451,277 456,535 461,854 467,235 472,348 477,518 482,743 488,026 493,367
C&D Disposal 94,707 95,865 97,038 98,225 99,370 100,528 101,699 102,884 104,082 105,221 106,373 107,537 108,714 109,904