
Solar Powering Your Community -...
55
Solar Powering Your Community Incorporating Solar in Your Work 1
-
Upload
vuongquynh -
Category
Documents
-
view
217 -
download
1
Transcript of Solar Powering Your Community -...
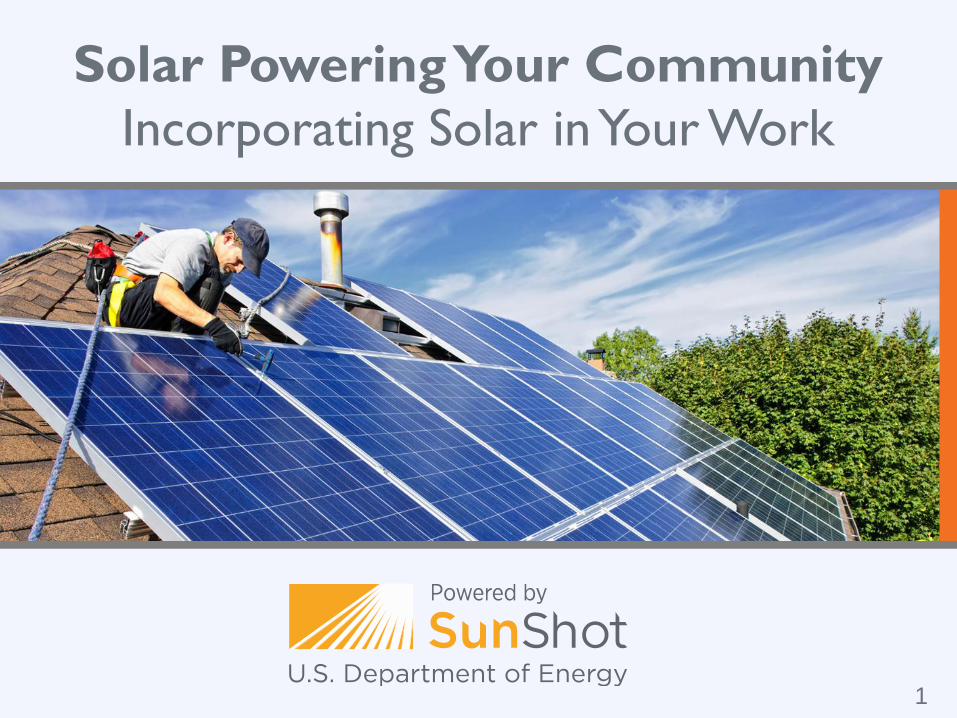
Solar Powering Your Community
Incorporating Solar in Your Work
1
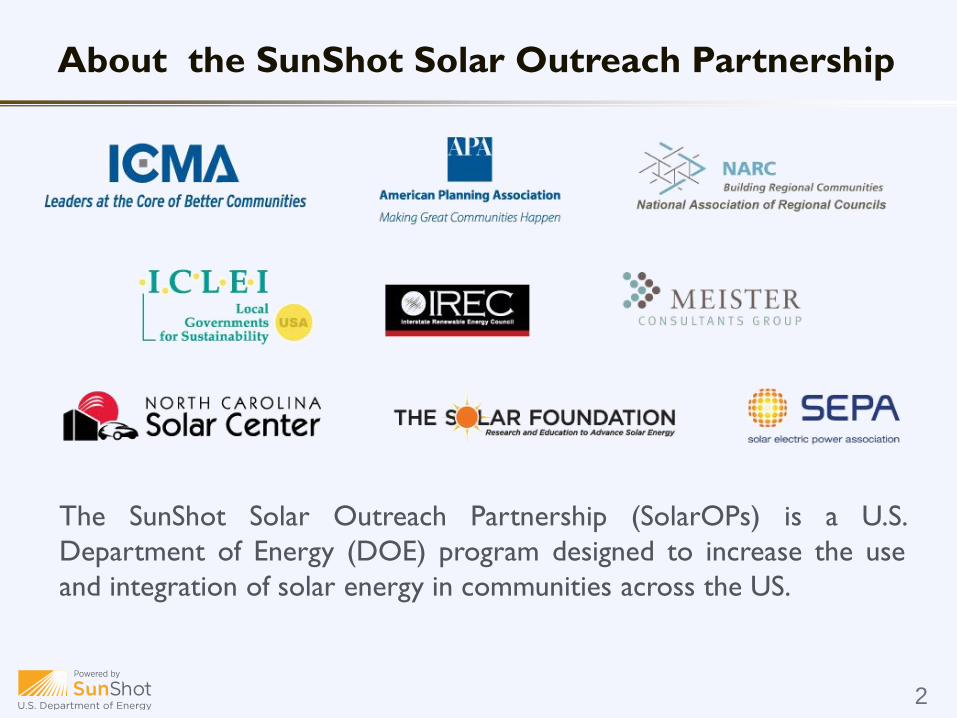
About the SunShot Solar Outreach Partnership
2
The SunShot Solar Outreach Partnership (SolarOPs) is a U.S.
Department of Energy (DOE) program designed to increase the use
and integration of solar energy in communities across the US.

Free Stuff!
3
Philip Haddix,
Project Manager
Colleen Crowninshield,
Clean Cities Manager
Georgia Nesselrode,
Director of Local Government
Services
David Warm,
Executive Director
Our Panel
4

Making the Case for Solar
Case Study: Pima Association of
Governments
Case Study: Mid-America
Regional Council
Q & A
Agenda
5
1:45 – 2:00
2:00 – 2:15
2:15 – 2:30
2:30 – 2:45
Making the Case for Solar
Case Study: Pima Association of
Governments
Case Study: Mid-America
Regional Council
Q & A
Agenda
6
1:45 – 2:00
2:00 – 2:15
2:15 – 2:30
2:30 – 2:45
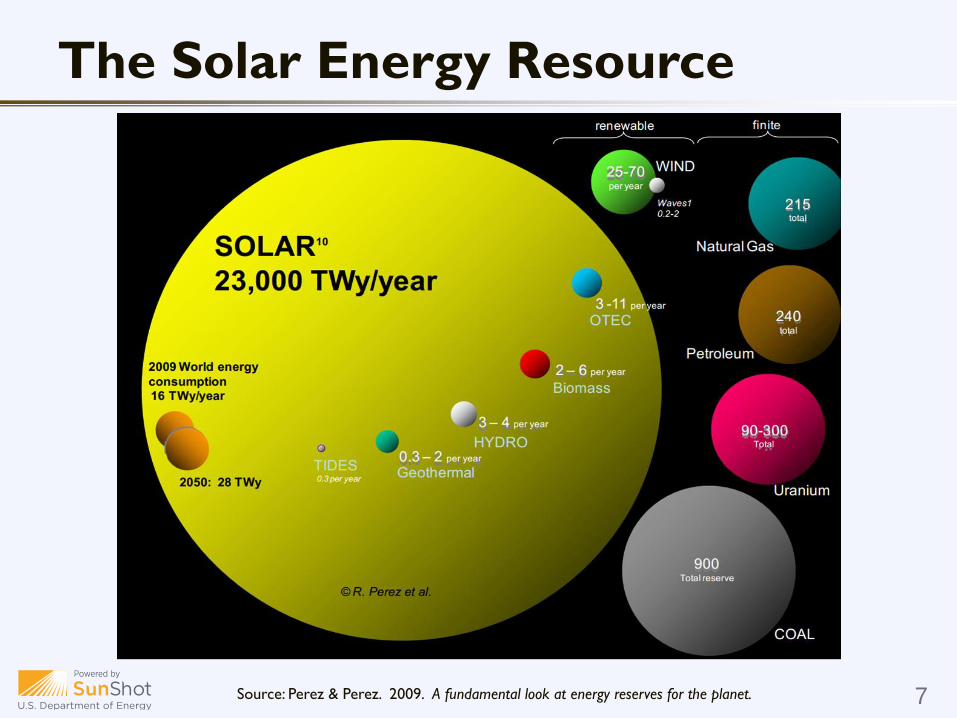
The Solar Energy Resource
Source: Perez & Perez. 2009. A fundamental look at energy reserves for the planet. 7
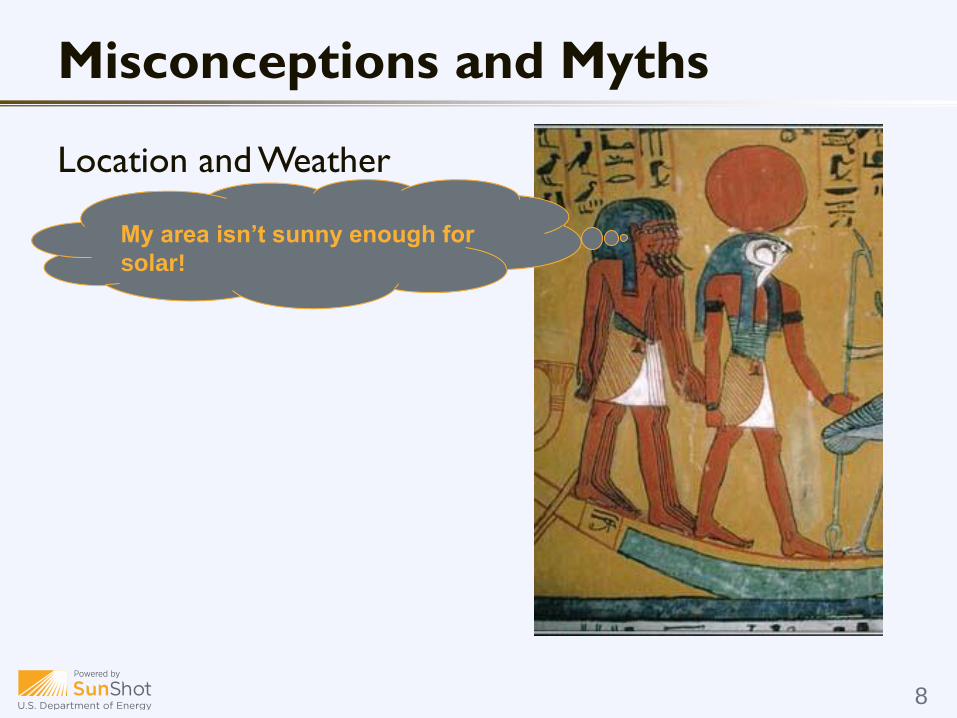
Location and Weather
Misconceptions and Myths
8
My area isn’t sunny enough for
solar!
Location and Weather
High Costs
Misconceptions and Myths
9
My area isn’t sunny enough for
solar!
Going solar is too expensive!
Immature Technology and
Industry
Misconceptions and Myths
10
Solar is not ready to compete as
a serious energy source.

Immature Technology and
Industry
Subsidies and Support
Misconceptions and Myths
11
Solar is not ready to compete as
a serious energy source.
The government should not
“pick winners and losers”.

Location and Weather
Image Source: National Renewable Energy Laboratory 12

High Cost: Installed Price is Falling
Source: SEIA/GTM Research. 2012. Solar Market Insight 2011 Year-in-Review. 13
$0.00
$1.00
$2.00
$3.00
$4.00
$5.00
$6.00
$7.00
$8.00
Q1 2010 Q2 2010 Q3 2010 Q4 2010 Q1 2011 Q2 2011 Q3 2011 Q4 2011
Inst
alle
d P
rice
($
/WD
C)
Residential Non-Residential Utility Blended
36%
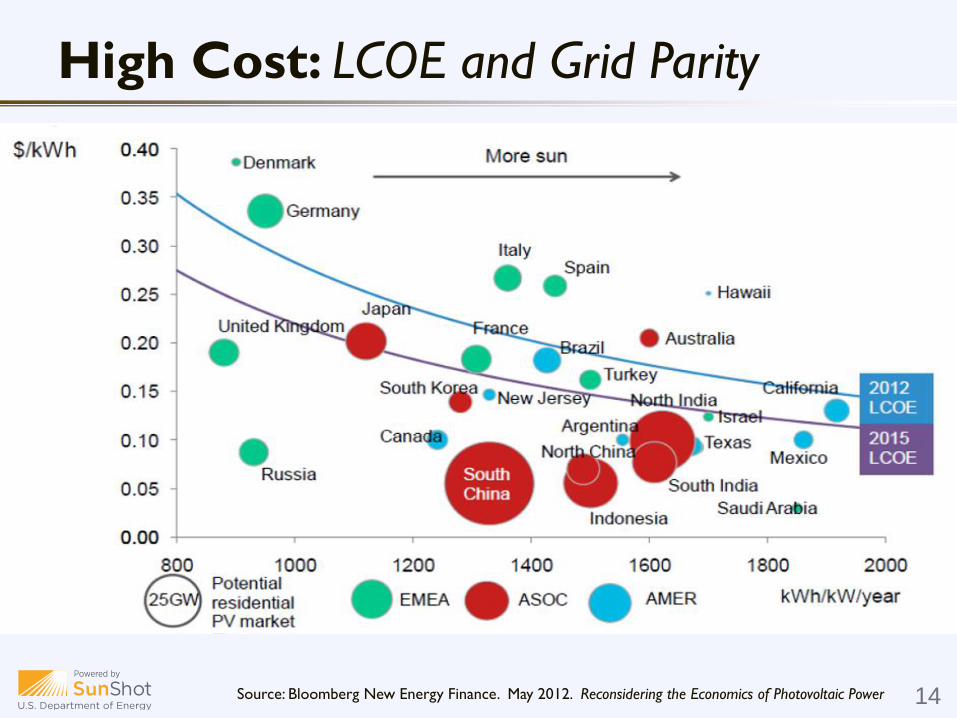
High Cost: LCOE and Grid Parity
Source: Bloomberg New Energy Finance. May 2012. Reconsidering the Economics of Photovoltaic Power 14
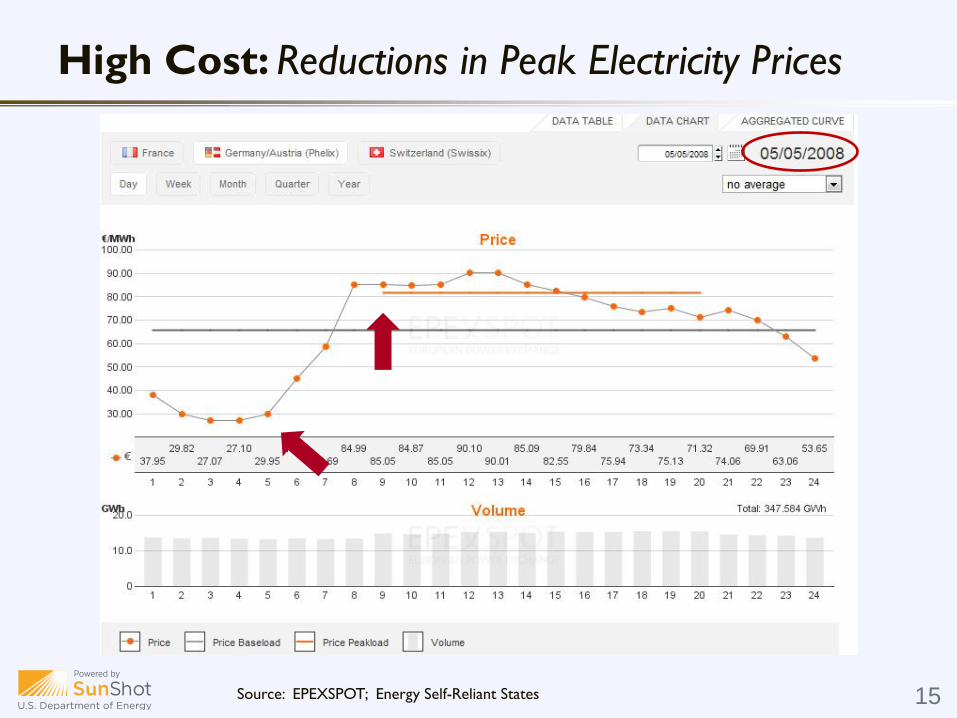
High Cost: Reductions in Peak Electricity Prices
Source: EPEXSPOT; Energy Self-Reliant States 15
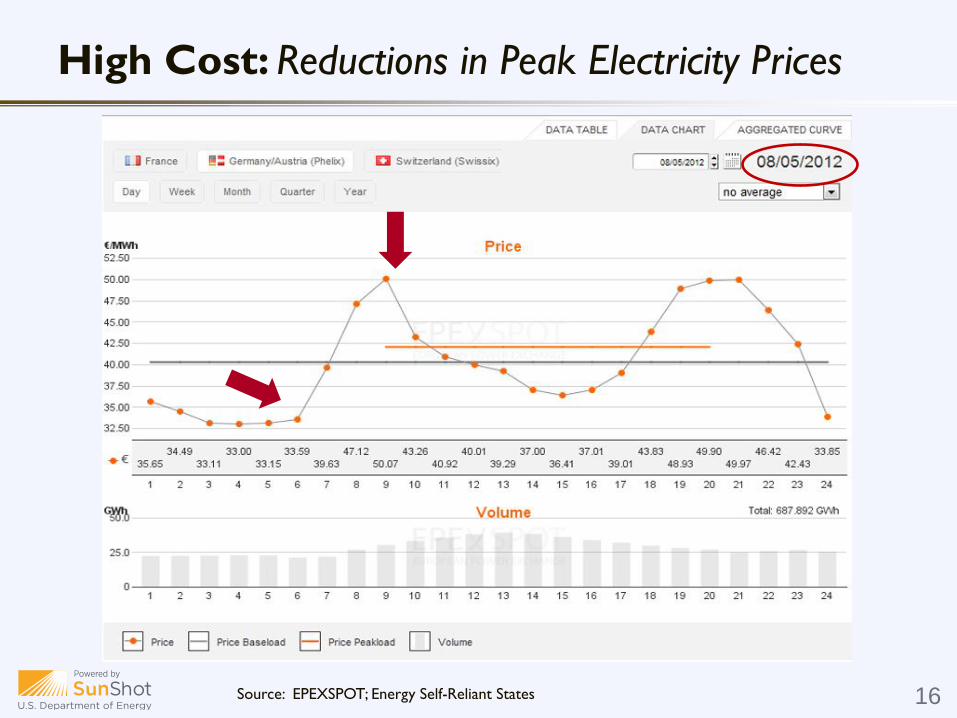
High Cost: Reductions in Peak Electricity Prices
Source: EPEXSPOT; Energy Self-Reliant States 16
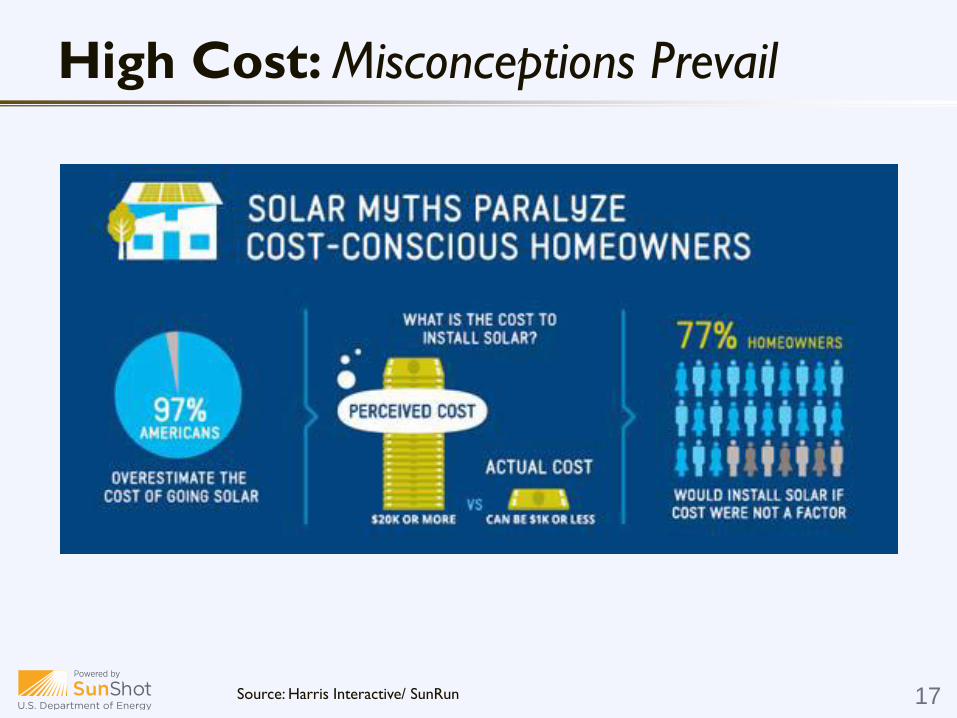
High Cost: Misconceptions Prevail
Source: Harris Interactive/ SunRun 17

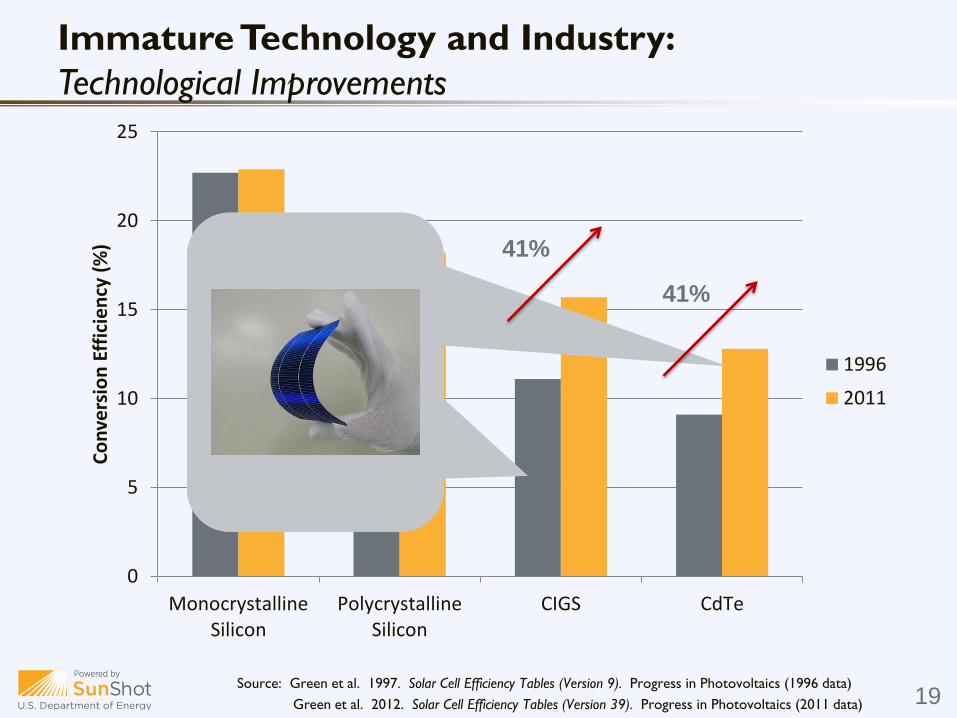
Immature Technology and Industry:
Technological Improvements
Source: Green et al. 1997. Solar Cell Efficiency Tables (Version 9). Progress in Photovoltaics (1996 data)
Green et al. 2012. Solar Cell Efficiency Tables (Version 39). Progress in Photovoltaics (2011 data) 18
0
5
10
15
20
25
MonocrystallineSilicon
PolycrystallineSilicon
CIGS CdTe
Co
nve
rsio
n E
ffic
ien
cy (
%)
1996
2011
19%
Immature Technology and Industry:
Technological Improvements
Source: Green et al. 1997. Solar Cell Efficiency Tables (Version 9). Progress in Photovoltaics (1996 data)
Green et al. 2012. Solar Cell Efficiency Tables (Version 39). Progress in Photovoltaics (2011 data) 19
0
5
10
15
20
25
MonocrystallineSilicon
PolycrystallineSilicon
CIGS CdTe
Co
nve
rsio
n E
ffic
ien
cy (
%)
1996
2011
41%
41%

Immature Technology and Industry:
National Standards and Certifications
20
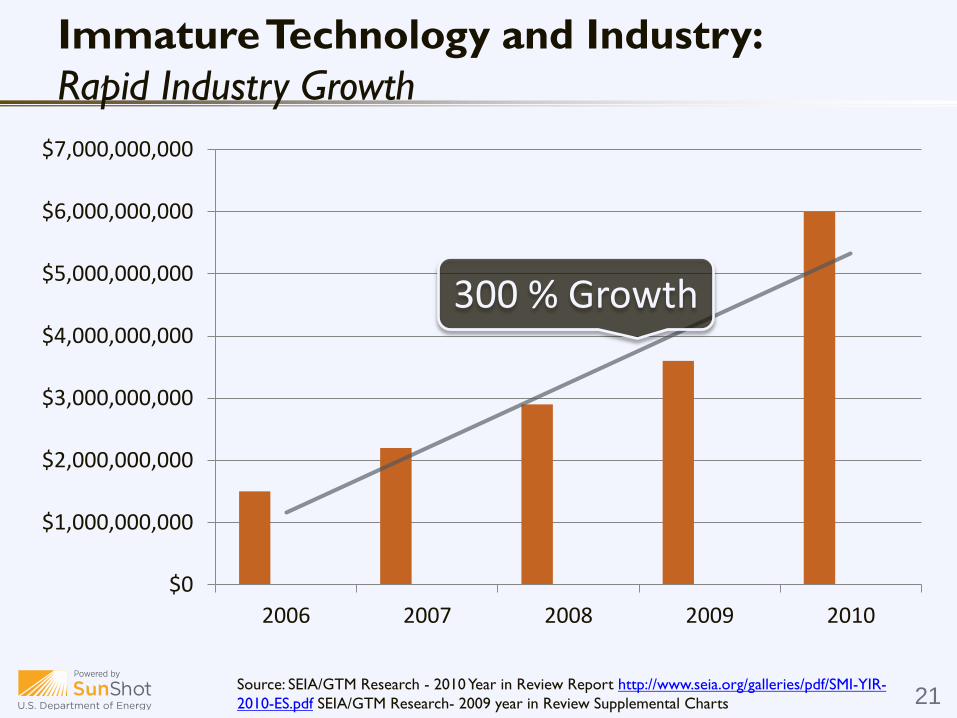
Immature Technology and Industry:
Rapid Industry Growth
Source: SEIA/GTM Research - 2010 Year in Review Report http://www.seia.org/galleries/pdf/SMI-YIR-
2010-ES.pdf SEIA/GTM Research- 2009 year in Review Supplemental Charts 21
$0
$1,000,000,000
$2,000,000,000
$3,000,000,000
$4,000,000,000
$5,000,000,000
$6,000,000,000
$7,000,000,000
2006 2007 2008 2009 2010
300 % Growth

Immature Technology and Industry:
Rapid Industry Growth
Source: SEIA/GTM Research. 2012. Solar Market Insight 2011 Year in Review.
SEIA/GTM Research. 2012. Solar Market Insight 2010 Year in Review. 22
0
200
400
600
800
1000
1200
1400
1600
1800
2000
2006 2007 2008 2009 2010 2011
Inst
alle
d C
apac
ity
(MW
DC)
CSP
PV
CAGR: 77%
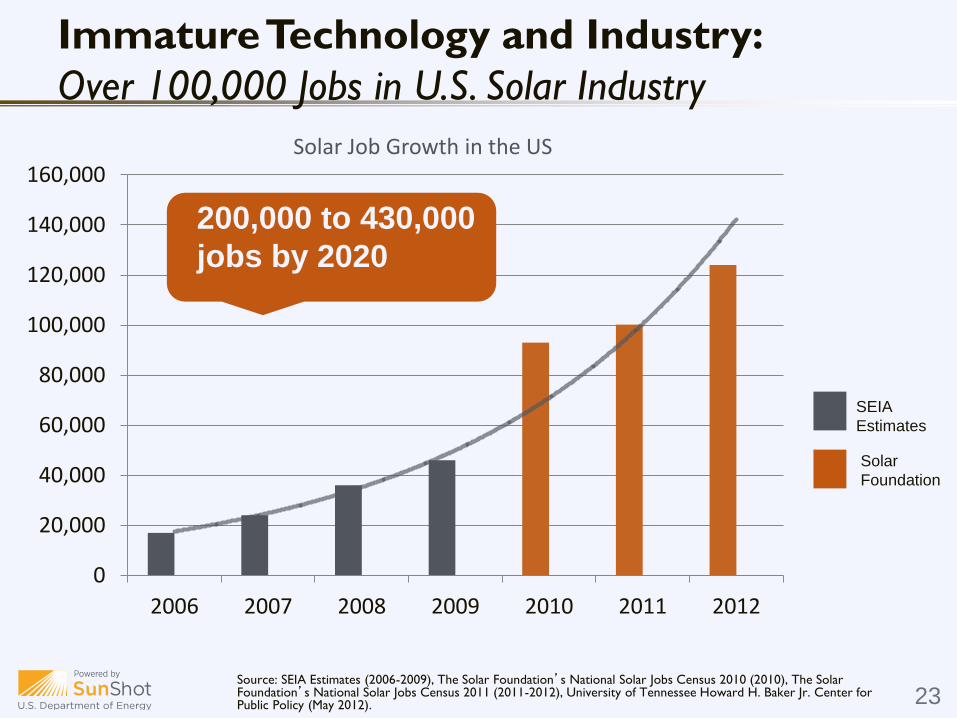
Immature Technology and Industry:
Over 100,000 Jobs in U.S. Solar Industry
Source: SEIA Estimates (2006-2009), The Solar Foundation’s National Solar Jobs Census 2010 (2010), The Solar Foundation’s National Solar Jobs Census 2011 (2011-2012), University of Tennessee Howard H. Baker Jr. Center for Public Policy (May 2012). 23
0
20,000
40,000
60,000
80,000
100,000
120,000
140,000
160,000
2006 2007 2008 2009 2010 2011 2012
Solar Job Growth in the US
SEIA
Estimates
Solar
Foundation
200,000 to 430,000
jobs by 2020

Subsidies and Support:
Federal Energy Incentives in 2010
Source: University of Tennessee Howard H. Baker Jr. Center for Public Policy. May 2012. Assessment
of Incentives and Employment Impacts of Solar Industry Deployment. 24
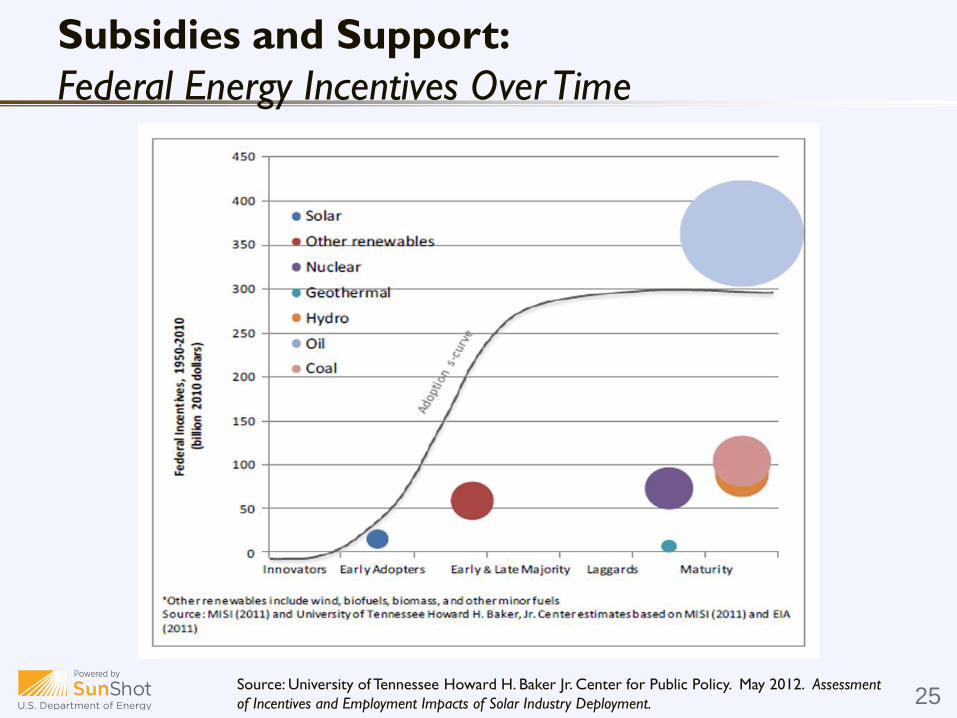
Subsidies and Support:
Federal Energy Incentives Over Time
Source: University of Tennessee Howard H. Baker Jr. Center for Public Policy. May 2012. Assessment
of Incentives and Employment Impacts of Solar Industry Deployment. 25
Making the Case for Solar
Case Study: Pima Association of
Governments
Case Study: Mid-America
Regional Council
Q & A
Agenda
27
1:45 – 2:00
2:00 – 2:15
2:15 – 2:30
2:30 – 2:45

Pima Association of Governments
Energy Programs
Solar Partnership
So. AZ Solar Standards Board Clean Cities Program
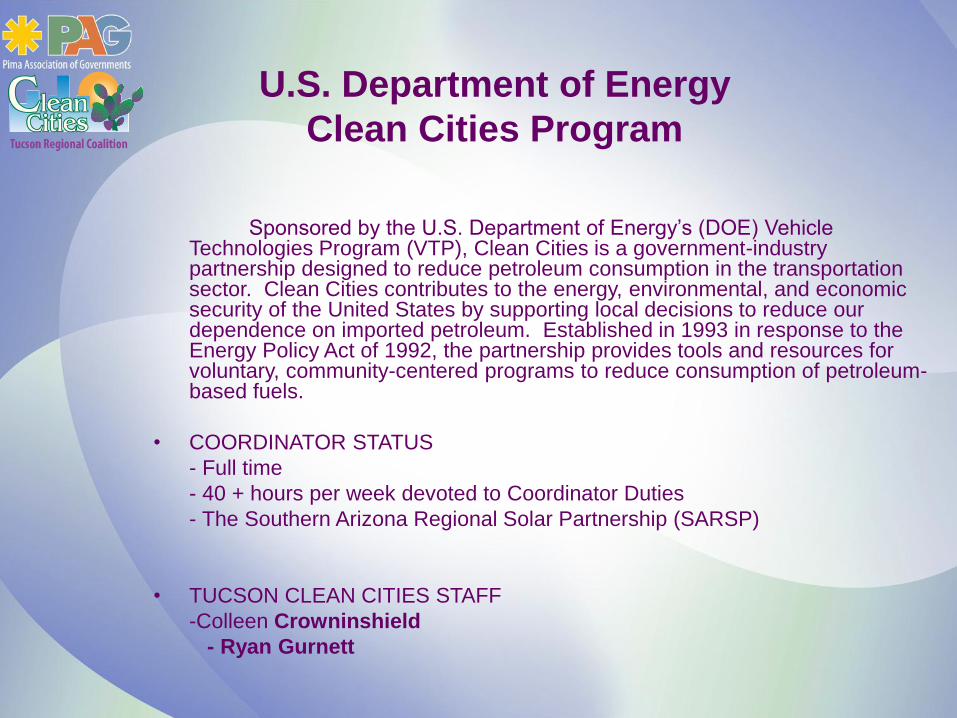
Sponsored by the U.S. Department of Energy’s (DOE) Vehicle Technologies Program (VTP), Clean Cities is a government-industry partnership designed to reduce petroleum consumption in the transportation sector. Clean Cities contributes to the energy, environmental, and economic security of the United States by supporting local decisions to reduce our dependence on imported petroleum. Established in 1993 in response to the Energy Policy Act of 1992, the partnership provides tools and resources for voluntary, community-centered programs to reduce consumption of petroleum-based fuels.
• COORDINATOR STATUS
- Full time
- 40 + hours per week devoted to Coordinator Duties
- The Southern Arizona Regional Solar Partnership (SARSP)
• TUCSON CLEAN CITIES STAFF
-Colleen Crowninshield
- Ryan Gurnett
U.S. Department of Energy
Clean Cities Program
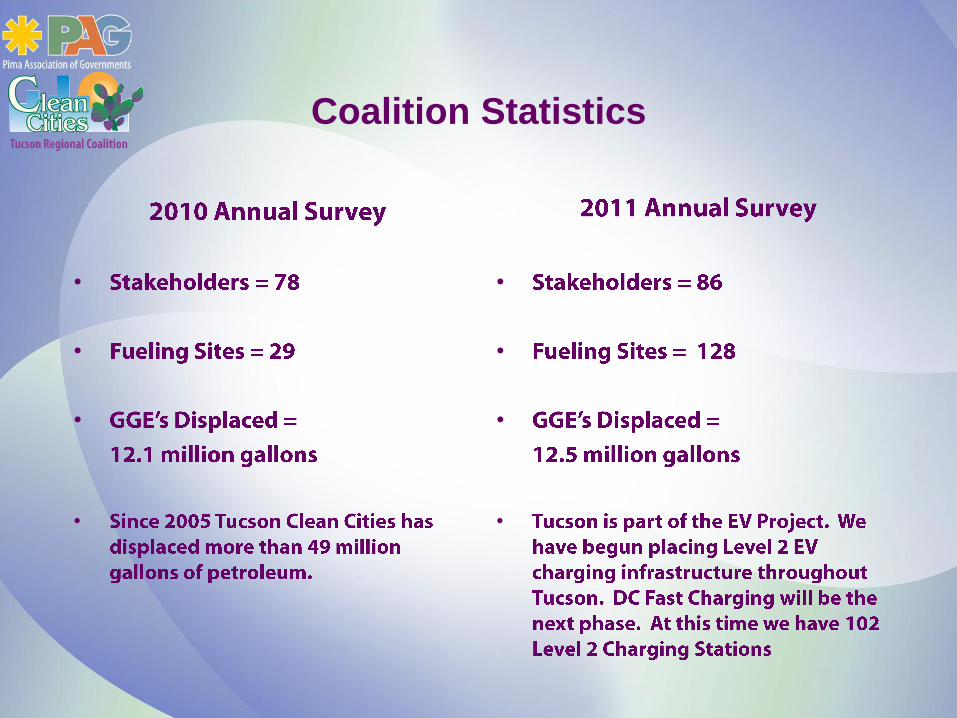
Coalition Statistics
•
•
•
•
•
•
•
•
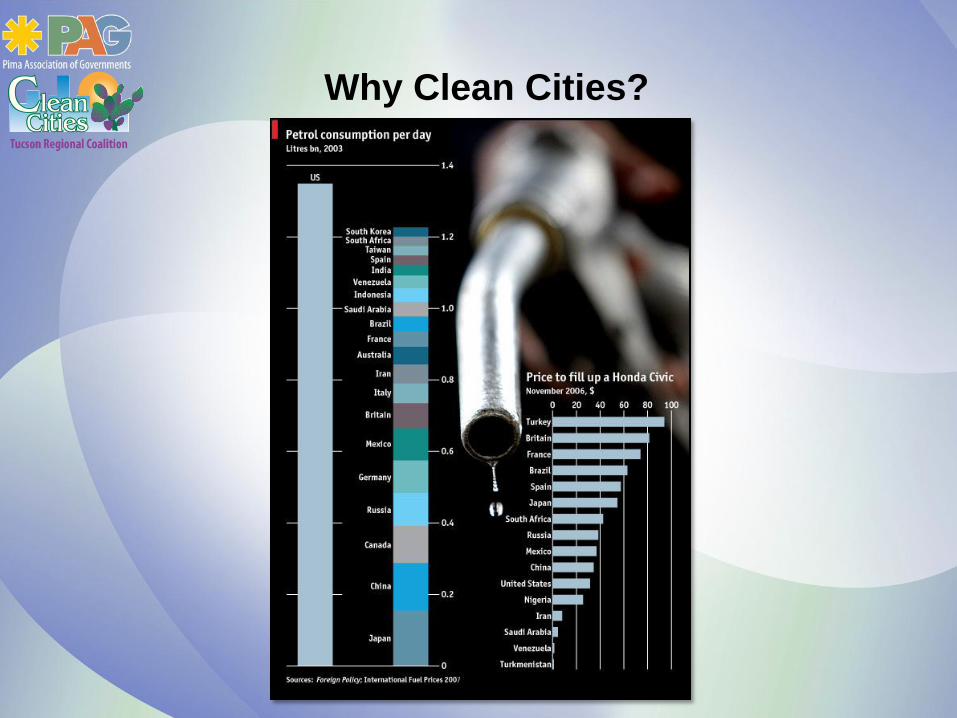
Why Clean Cities?

Southern Arizona Regional Solar Partnership
To foster and encourage a political and business environment in which solar energy becomes a
major source of economic activity within southern Arizona.
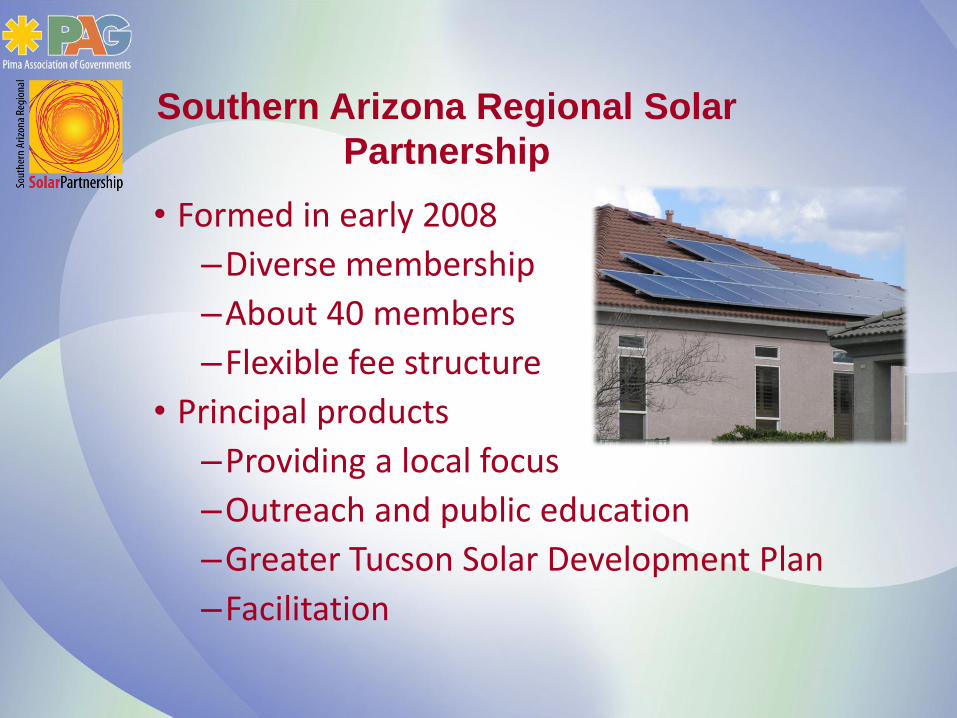
• Formed in early 2008
–Diverse membership
–About 40 members
–Flexible fee structure
• Principal products
–Providing a local focus
–Outreach and public education
–Greater Tucson Solar Development Plan
–Facilitation
Southern Arizona Regional Solar
Partnership

• Providing a connection
–A reason to interact
–An opportunity to share information
–Feedback and validation
–A starting point for action
–A coordinated response
–Maintaining momentum
Southern Arizona Regional Solar
Partnership
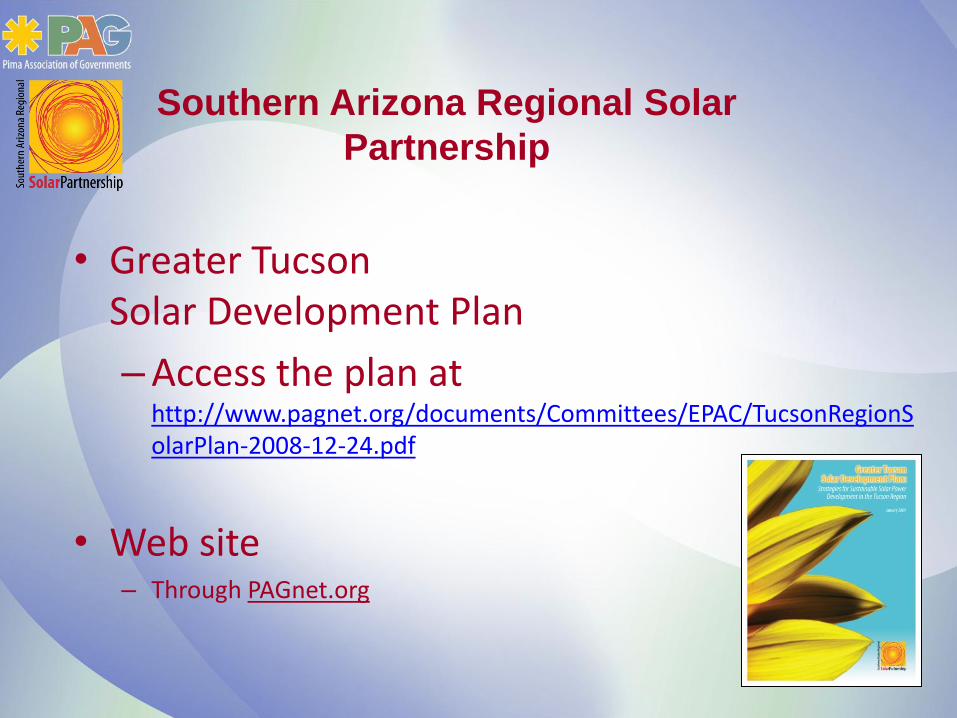
• Greater Tucson Solar Development Plan
– Access the plan at http://www.pagnet.org/documents/Committees/EPAC/TucsonRegionSolarPlan-2008-12-24.pdf
• Web site – Through PAGnet.org
Southern Arizona Regional Solar
Partnership
• Protecting Consumers - Promoting Quality - Ensuring Performance
Mission Statement
• To protect consumers and ensure the long-term success of the Arizona solar industry by promoting best practices, educating the general public and encouraging solar businesses to install long-lasting, quality installations.
• SASSB’s goal is to bring together all parties interested in the lasting success of the solar community.

Accreditation
Services for Accredited Companies
• Marketing: SASSB conducts advertising campaigns to promote its accredited companies.
• Training and Education: SASSB conducts seminars and workshops to improve our members' businesses.
• Communications: SASSB distributes an e-mail newsletter and holds regular monthly meetings as well as special bulletins and events to share information with and among our accredited members.
Services to Public
• Educational Web site containing: – Accredited Installer List - With a company profile – In Progress Installer List – Watch List for scams and bad business practices – Education for consumers – Solar facts and steps
• Activities and events:
– Breakfast/lunch/dinner meetings for education, networking and information sharing.
– Participation in events, trade shows and other suitable venues.

CORE REQUIREMENTS
• At least one NABCEP certified FTE employee on staff primarily working in southern Arizona in the field(s) related to accreditation. – (9-month grace period)
• In business for two years and have at least 10 utility verified system installs (both hot water and PV) within one year of joining.
• No more than two verified violations every year
• In good standing with the Arizona Registrar of Contractors, deemed an "approved installer" with applicable utilities, and properly licensed through all applicable Southern Arizona entities. No work can be done outside of allowable scope of licenses.
• Must adhere to ethical sales practices.
SASSB Structure
• 501(c)3 organization
• 5-member voting board of installers
– Elected by general members each year
• Regular public meetings at PAG’s downtown office.
• Jurisdiction includes:
– TEP, Unisource, SSVEC and Trico

Next Steps
• Solar Development Plan
– Access the plan at http://www.pagnet.org/documents/Committees/EPAC/TucsonRegionSolarPlan-2008-12-24.pdf
– SASSB.org

In closing…..
Making the Case for Solar
Case Study: Pima Association of
Governments
Case Study: Mid-America
Regional Council
Q & A
Agenda
45
1:45 – 2:00
2:00 – 2:15
2:15 – 2:30
2:30 – 2:45

MID-AMERICA REGIONAL COUNCIL
Advancing regional progress through
LEADERSHIP • PLANNING • ACTION
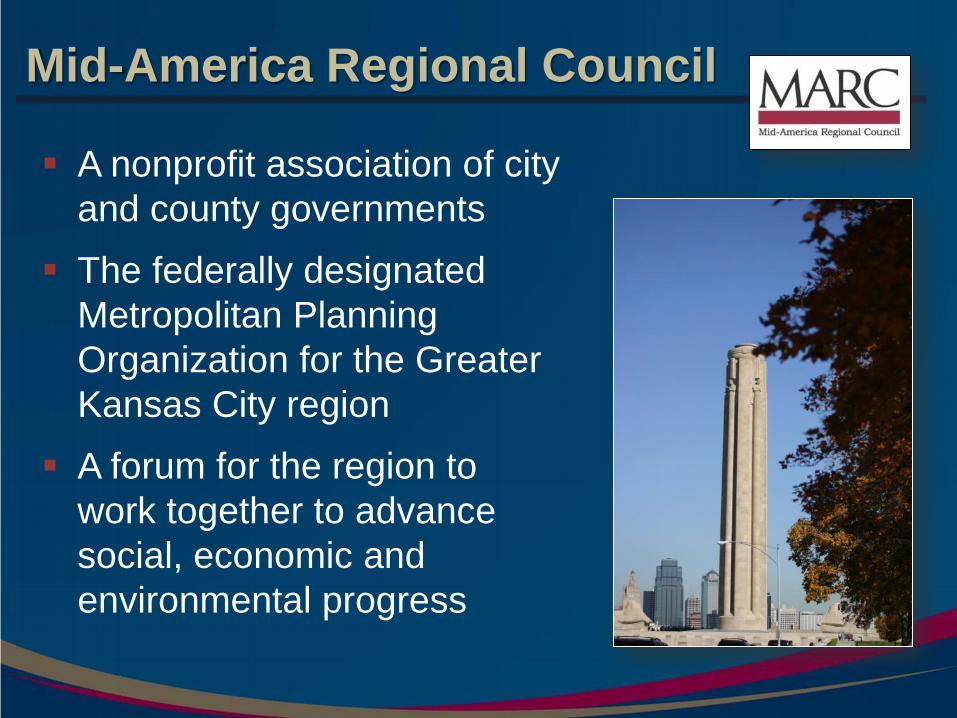
Mid-America Regional Council
A nonprofit association of city
and county governments
The federally designated
Metropolitan Planning
Organization for the Greater
Kansas City region
A forum for the region to
work together to advance
social, economic and
environmental progress
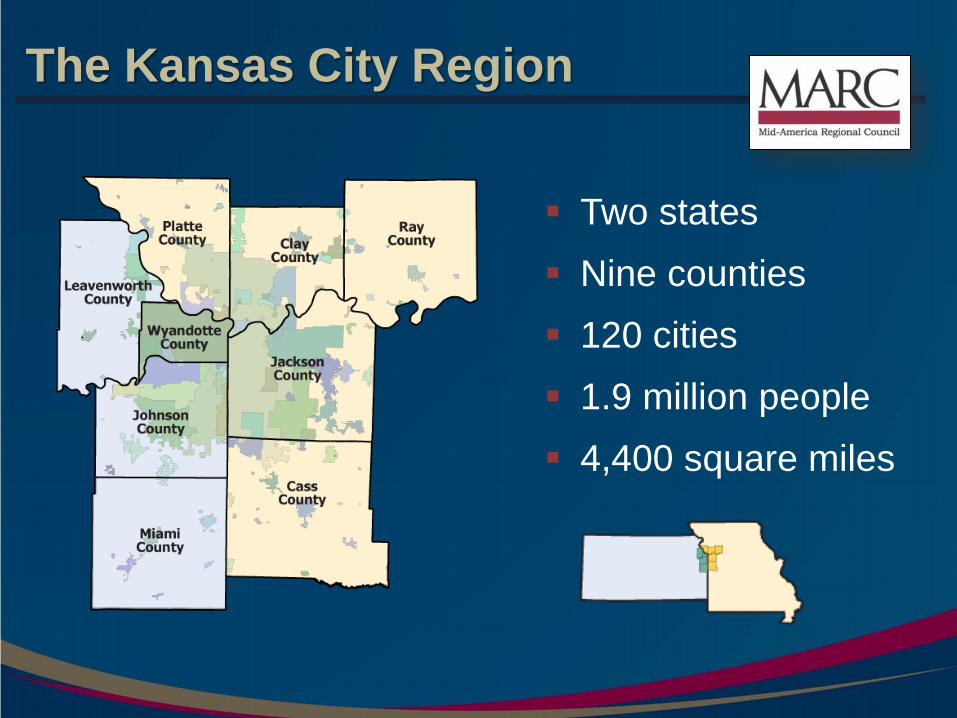
The Kansas City Region
Two states
Nine counties
120 cities
1.9 million people
4,400 square miles
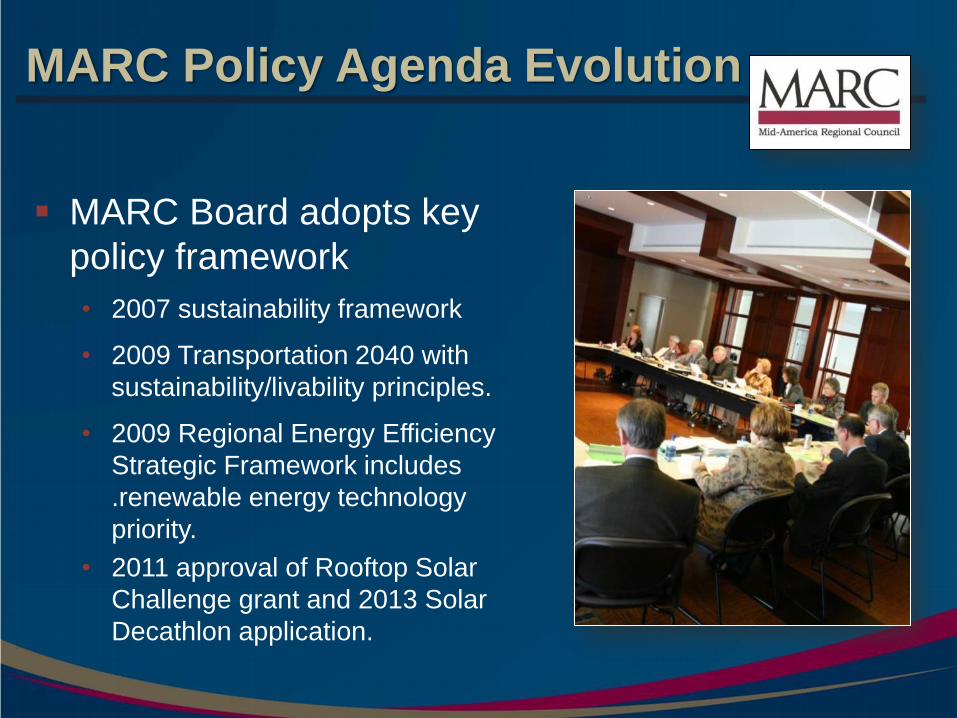
MARC Policy Agenda Evolution
MARC Board adopts key
policy framework
• 2007 sustainability framework
• 2009 Transportation 2040 with
sustainability/livability principles.
• 2009 Regional Energy Efficiency
Strategic Framework includes
.renewable energy technology
priority.
• 2011 approval of Rooftop Solar
Challenge grant and 2013 Solar
Decathlon application.
REECS Strategic Framework
Lead by example by modeling innovative practices.
Adopt and implement updated strategies for codes and standards.
Establish effective partnerships among state, regional and local
energy programs.
Implement education, outreach and public involvement strategies.
Create incentives for energy efficiency and conservation.
Link energy strategies with related sustainability efforts.
Assess, monitor and report the effectiveness of clean-energy
strategies.
Promote emerging solutions and technologies to encourage market
transformation.

Incorporating Solar
Conducted survey of local governments to
document current zoning and permitting policies.
• 41 jurisdictions responded;
• Issued report with data on aesthetic restrictions
- panel coloring, placement restrictions: visible
and not visible from public right-of-way;
• Data provided basis for Rooftop Solar
Challenge grant application.
REECS jurisdictions signed on to be grant
partners.

Integrating Solar
MARC and its regional partners have received
$140 million (includes match) in grants since
2009.
• Grant investments include funds from:
DOE; HUD; DOT; EPA, USDA, and EDA.
• All have sustainability and/or energy in their guiding
principles.
• Solar has been integrated in 5 out of 12 grant
initiatives.
• Further integration is expected.
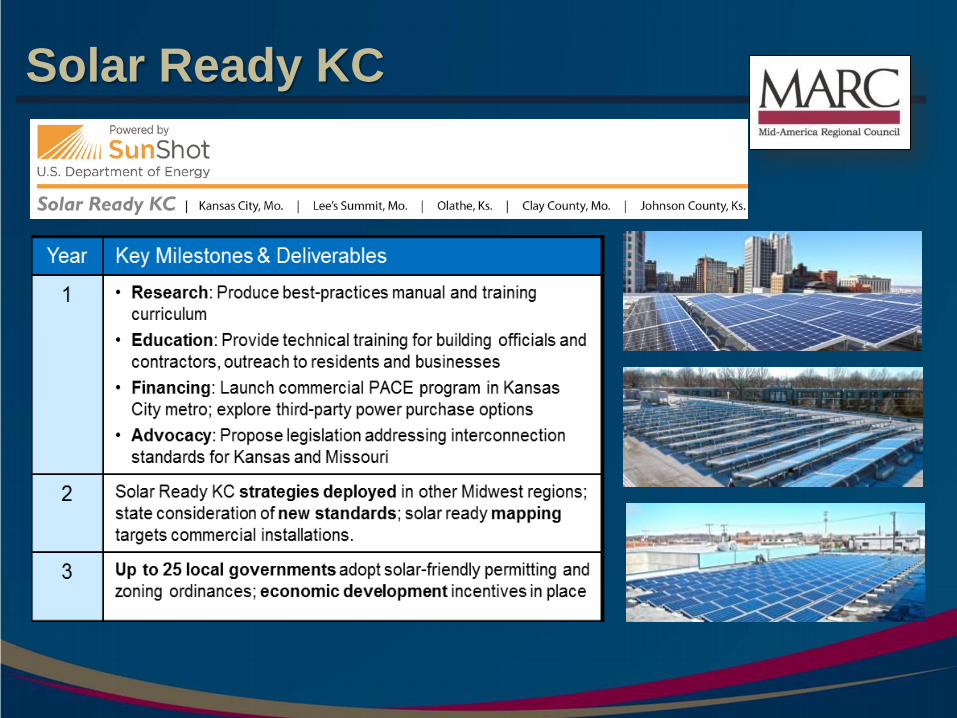
Solar Ready KC
600 Broadway, Suite 200, Kansas City, MO 64105-1659
Phone 816-474-4240 • Fax 816-421-7758
www.marc.org

Making the Case for Solar
Case Study: Pima Association of
Governments
Case Study: Mid-America
Regional Council
Q & A
Agenda
55
1:45 – 2:00
2:00 – 2:15
2:15 – 2:30
2:30 – 2:45