Solar-Powered Electrochemical Production of...
16
226 Chapter 9 Solar-Powered Electrochemical Production of Molecular Hydrogen from Water Sections reprinted with permission from Park, H.; Vecitis, C. D.; Choi, W.; Weres, O.; Hoffmann, M. R. Journal of Physical Chemistry C 2008, 112, 4, 885–889. © 2008 American Chemical Society
Transcript of Solar-Powered Electrochemical Production of...
226
Chapter 9
Solar-Powered Electrochemical Production
of Molecular Hydrogen from Water
Sections reprinted with permission from Park, H.; Vecitis, C. D.; Choi, W.; Weres, O.;
Hoffmann, M. R. Journal of Physical Chemistry C 2008, 112, 4, 885–889.
© 2008 American Chemical Society
227
Abstract
Electrochemical water splitting powered by conventional electricity or photovoltaic
arrays produces molecular hydrogen at the cathode while organic compound oxidation
under mild conditions takes place at the anode in competition with the production of
oxygen. An electrolytic cell, which is based on the coupling of bismuth-doped titanium
dioxide anodes (BiOx-TiO2) with stainless steel cathodes (SS), is characterized in terms
of hydrogen production efficiency and organic compound degradation. In the solar-
powered PV-electrochemical system, the production of molecular oxygen at the anode is
suppressed by the simultaneous oxidation and mineralization of organic compounds
dissolved in water. In addition, the anodic oxidation of organic substrates has a
synergistic effect on hydrogen production at the cathode that results in a 53% increase in
the energy efficiency for H2 generation at circum-neutral pH in the presence of dilute
electrolyte solutions.
228
Introduction
At the present time, the majority of industrial-scale hydrogen is produced by steam-
methane reformation (SMR), even though the high temperature conversion of methane to
hydrogen results in the concomitant production of carbon monoxide and carbon dioxide
at a weight ratio of CO2 to H2 equal to 2.5. As a consequence, SMR has a relatively large
carbon footprint. Carbon-free water electrolysis is considered to be less attractive given
the rising costs of electricity1-3. However, the direct utilization of solar light for hydrogen
production through photocatalytic4 or photo-electrochemical5,6 water splitting may
provide an economically viable alternative source of hydrogen in the future.
There have been several previous reports of electrolysis systems powered nominally by
photovoltaic arrays7-9. The PV arrays are used to convert solar light to electricity in order
to power alkaline (e.g., 27% KOH at pH 14.7) electrolyzers for producing hydrogen gas.
However, these systems are thought to be impractical in that the cost of hydrogen is
greater than conventional DC-electrolysis, which in turn, is more expensive than SMR.
Narayanan et al. describe a DC-powered hybrid system that drives a methanol fuel cell
in reverse10, while Soler et al. report on a solar-powered photo-Fenton process that
produces hydrogen noncatalytically under severe condition with a limited number of
organic substrates11. Mathieson et al. described a hybrid electrolytic system that
functions via the induced corrosion of the anode to release the corresponding metal ions
to solution, which lead to the coagulation and subsequent removal of high-molecular-
weight organic compounds from water12. Drew et al. reported TiO2/Ru-Pt hybrid catalyst
for boosting fuel cell performance13.
229
In this letter, we report on a hybrid photovoltaic electrochemical reactor that results in
the simultaneous production of molecular hydrogen via water splitting at stainless steel
cathodes, while organic substrates are oxidized at metal-doped TiO2 anodes (Scheme 9.1).
Semiconductor electrodes have been used to drive the electrochemical splitting of water
into hydrogen and oxygen. However, we have previously demonstrated that the oxidation
of water via an overall four-electron oxidation can be suppressed by using anodes made
with niobium-doped polycrystalline TiO2 particles attached to metallic titanium plates14.
Metal-doped TiO2 electrodes preferentially oxidize water to hydroxyl radical due to the
formation of surface titanol (>TiOH) groups on hydrated titanium dioxide surfaces at
current efficiencies approaching 50%. In addition, the surface-bound hydroxyl radicals on
the semiconductor anodes can be utilized to preferentially oxidize a wide variety of
organic and inorganic substrates14. In this letter, we characterize the electrochemistry of a
mixed-metal oxide anode that is based on a mixture of bismuth oxide and Bi-doped TiO2
that is coupled to a stainless-steel cathode and powered by a photovoltaic panel.
The BiOx-TiO2-coated titanium anode15 and stainless steel cathode were immersed in
an electrolyte solution (e.g., 50 mM NaCl) in a reactor with a total volume of either 200
mL in a single electrode couple or 20 L with multiple electrode couples. Organic
substrates were mixed into the background electrolyte solutions or added during the
course of electrolysis. A constant cell voltage or current was applied to the electrodes
either with a DC power supply (HP 6263B and 6260B) or with a commercial amorphous
silicon PV panel (Silicon Solar, Inc.) that has a power rating of 6.4 W with a peak output
potential, Epeak = 8–10V, and a peak current of Ipeak = 0.95A for an active surface area of
1280 cm2 (Scheme 9.1). The theoretical maximum solar-to-electric energy efficiency is
230
estimated to be 4.5% according to the specifications of the PV manufacturer. Solar
radiation was monitored by a pyranometer (Apogee) connected to a data-logger
(Campbell Scientific). Cell voltage (Ecell) and current (Icell) were monitored with a digital
multimeter (Fluke). The current efficiencies and the energy efficiencies are obtained as
follows in eqs. 9.1 and 9.2.
2 2 2# molecules produced (H , O , or CO ) or degraded (phenol)Current efficiency (%) = n 100# electrons
× ×
(9.1)
22
cell cell
(39W h/g H rate 2g/mol)H production energy efficiency (%) = 100E I
⋅ × ××
× (9.2)
where n = 2 and 4 for hydrogen and oxygen production cathodic current (CE) efficiencies,
respectively. For anodic current efficiencies, n = 1 for one-electron oxidation of phenol,
and n = 14/3 for complete mineralization from phenol carbon to carbon dioxide.
The electrolytic reactors were sealed to the atmosphere and the headspace gas was
extracted at a known rate by a peristaltic pump. The extracted headspace gas was pulled
through a stainless steel membrane into the vacuum chamber (5.0 × 10 torr), evacuated
by a membrane pump and a turbo pump (Pfeiffer Vacuum), where it was ionized by high-
energy electrons and analyzed by quadrupole mass spectrometry (Balzers). The volume
percent of the headspace was calculated by assuming that the observed signal intensity
was directly proportional to the ion current measured by the mass spectrometer (i.e., the
transfer of all gases through the membrane and their 70 eV electron ionization cross-
sections were roughly equivalent). This assumption is validated by the fact that ambient
air was measured to be 77% nitrogen, 17% oxygen, 5% water vapor, and 1% argon.
-6
Aqueous organic compounds including intermediates were analyzed by high
performance liquid chromatography (HPLC, Agilent 1100 series) with separation on a
231
C18 column. The eluent composition was 55% Milli-Q water (0.1 wt% acetic acid) and
45% acetonitrile at flow rate of 0.7 mL min . Analyte concentrations were monitored by
UV-Vis spectrophotometry. Total organic carbon measurements were made with an OI
Analytical Aurora Model 1030 TOC analyzer coupled to an autosampler (OI Analytical
Model 1096).
-1
The composite BiOx-TiO2 anodes, when coupled with stainless steel (SS) cathodes
have an inherent potential ranging from + 0.2 to + 0.5 V, due to the formation of a space-
charge layer within the TiO2 particles bound to the titanium substrate. Water splitting and
current flow commence at an applied cell voltage of + 2.0 V, with an observed a linear
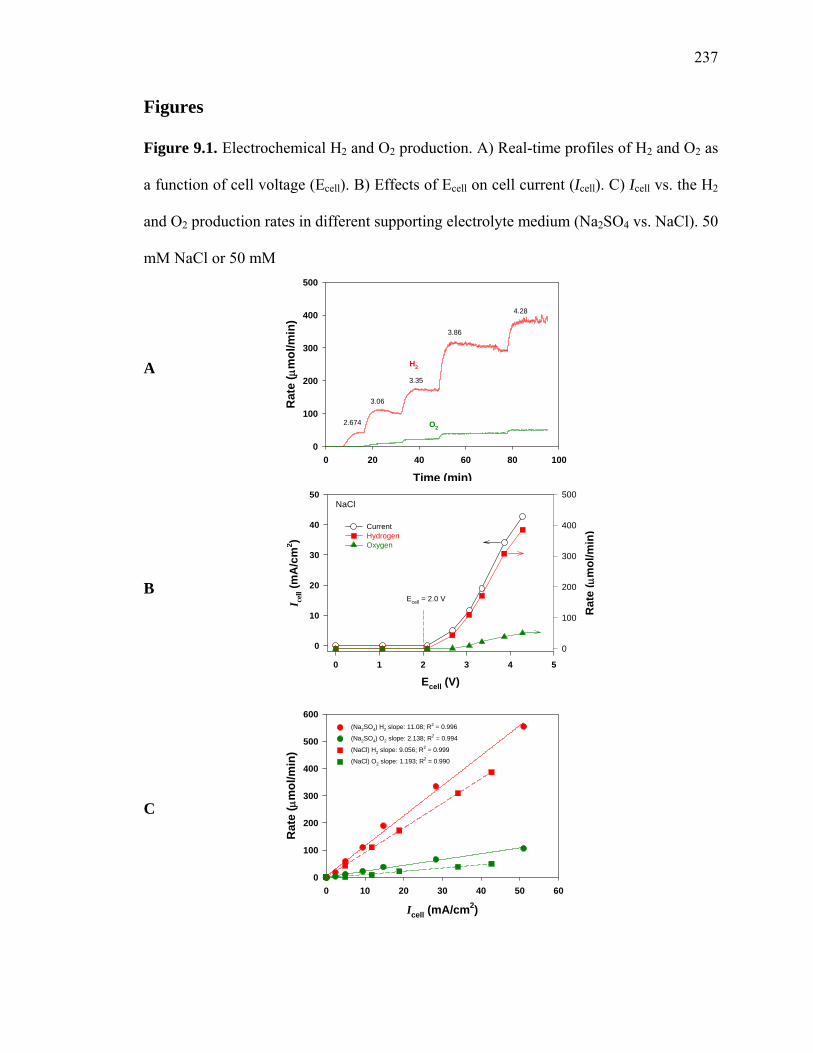
correlation between the measured rates of H2 and O2 production, eq. 9.3 (Figure 9.1).
(9.3) E 2.1 V22 H O 2 H O> +⎯⎯⎯⎯→ +2 2
The H2/O2 mole ratio for the electrolysis of pure water (i.e., without added substrates)
depends on the background electrolyte. In the case of sodium sulfate (50 mM), the
observed H2/O2 mole production ratio is 5.2, while in the presence of sodium chloride (50
mM) the corresponding mole ratio (H2/O2) is increased to 7.6 (Figure 9.1). The sharp
departures from a theoretical 2 to 1 mole ratio for water splitting indicate that
electrochemical reaction products or intermediates other than oxygen are being formed at
the semiconductor anode. These reactions include the oxidation of surface-bound
hydroxyl groups of hydrated TiO2 to produce hydroxyl radicals (i.e., eq. 9.4, as depicted
in Scheme 9.1), as well as the oxidation of the background electrolyte (e.g., Cl-; eq. 9.5).
(9.5) −• +>→> eOH-Ti OH-Ti
232
At applied potentials greater than 2.0 V, the one-electron oxidation of chloride
(E°(Cl•/Cl-) = 2.55 V vs. NHE) and sulfate (E°(SO4•-/SO4
2-) = 2.43 V vs. NHE) are
competitive with water oxidation.
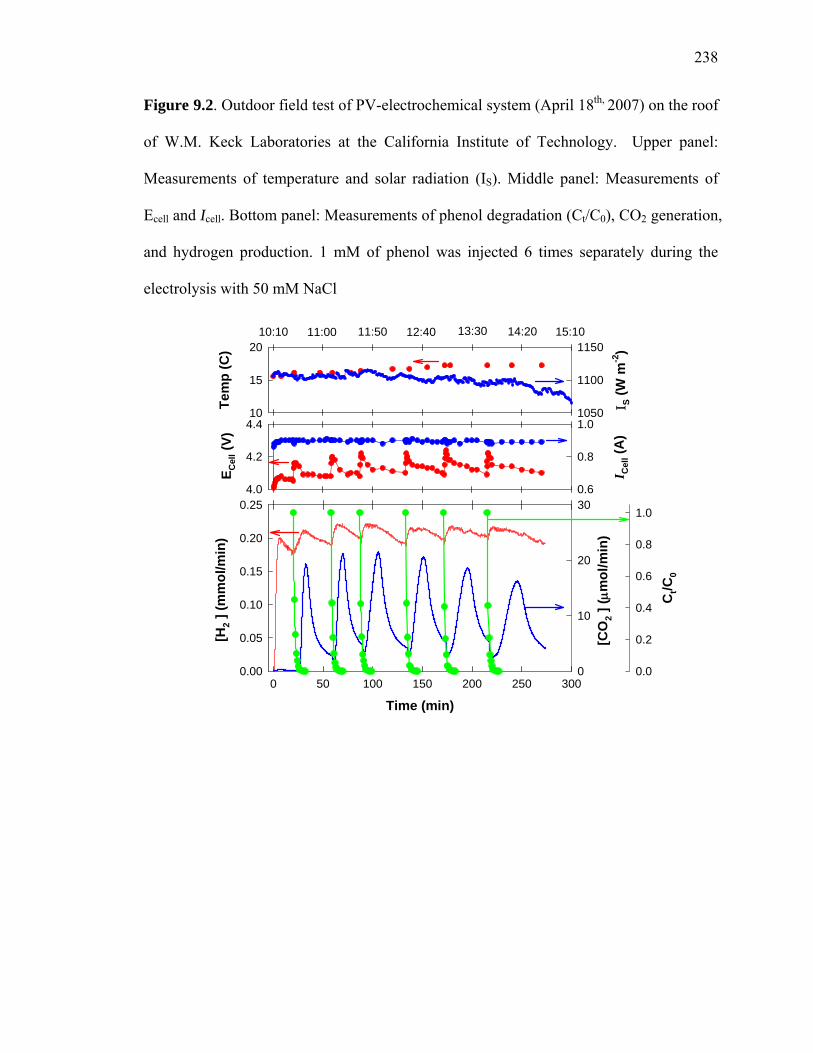
When powered by a photovoltaic (PV) panel, the cell voltage (Ecell) of the reactor
increases to +4 V with a corresponding current (Icell) close to 0.9 A (i.e., 30 mA cm-2), as
shown in Figure 9.2. The voltage and current of the electrodes are nearly constant under
steady sunlight irradiation at a measured solar flux of 1100 W⋅m-2. The hybrid PV-
electrochemical reactor system produces hydrogen at a rate of 0.18 mmol min-1 and
oxygen at rate of 0.028 mmol min-1, which corresponds to a ratio of the rates of
production (i.e., a H2/O2 mole ratio) that is near 7.
With the addition of phenol, the hydrogen production rate is enhanced by 20 to 30%
and the oxygen production rate is slightly decreased. The overall energy efficiency for H2
production ranges from 30 to 40% depending on the PV panel output energy. The DC-
powered current efficiency for the hybrid electrolysis ranges from 70 to 95%, while the
corresponding energy efficiencies for H2 production range from 36 to 61%, depending on
operating conditions (Table 9.1). These values compare favorably with industrial-scale
electrolysis employing alkaline or proton exchange membrane electrolyzers with reported
energy efficiencies ranging from 56 to 73%. Our hybrid PV- and DC-powered systems
operate at comparable efficiencies; however, they have distinct advantages over
commercial electrolytic devices, in that the hybrid system is efficient at low electrolyte
concentrations at circum-neutral pH under ambient temperature and pressure. The overall
solar-to-hydrogen energy efficiency is thereby limited by the actual solar light energy-to-
233
electric power conversion efficiency (ε) of the specific PV system that is used to drive
electrolytic water splitting with semiconductor electrodes.
In the case of phenol, oxidative degradation (> 99%) is achieved within 10 min (t1/2 ~ 1
min) (Figure 9.2). The electrolytic oxidation follows first-order kinetics with the
eventual conversion of the phenolic carbon into CO2. This overall process can be
repeated with each successive addition of phenol to the hybrid PV-electrolytic reactor.
The phase-delay for the detectable production of carbon dioxide relative to the
disappearance of phenol indicates that carbon-containing intermediates are produced and
are involved in further competitive reactions at the semiconductor anode. Reaction
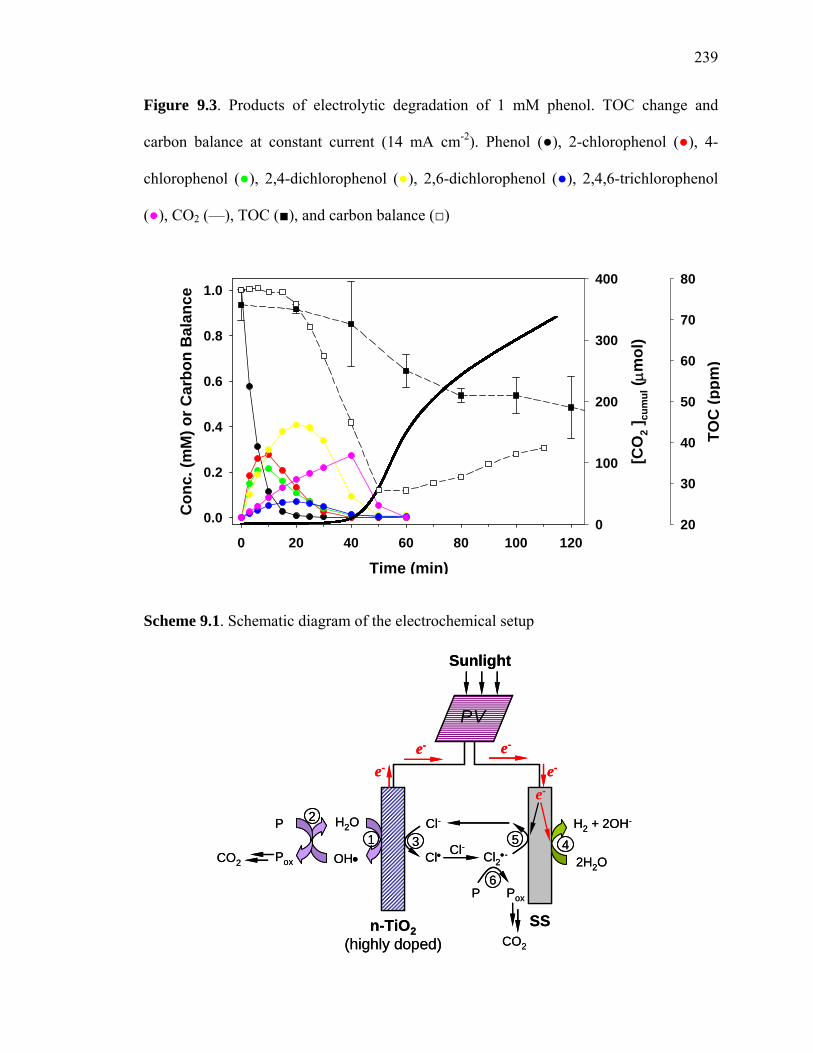
intermediates found during electrolysis at a constant current density of 14 mA cm-2 with
NaCl as the background electrolyte included mono-, di-, and tri-chlorophenol (Figure 9.3).
When added individually, the chlorinated phenols are destroyed in the following order of
relative electrochemical reactivity: 2,4,6-trichlorophenol (3.74) > 2,6-dichlorophenol
(1.84) > 2,4-dichlorophenol (1.38) > phenol (1.0) > 2-chlorophenol (0.78) > 4-
chlorophenol (0.57) (Table 9.1), where the numbers in parenthesis represent reaction
rates relative to phenol. The trichlorophenol reaction intermediate undergoes a sequential
dechlorination through a cyclopentene intermediate, followed by production of simple
aliphatic acids that are formed after ring opening. The aliphatic acid intermediates are
then oxidized to CO2 by surface-bound hydroxyl radicals that are produced at the anode
(R1 in Scheme 9.1). Due to the competitive reactions of phenol and intermediates at the
anode, the one-electron oxidation current efficiency for the oxidation of phenol is 10%,
even though the cathodic current efficiency for hydrogen production is close to 70%.
Production of the intermediate chlorinated phenols is consistent with the formation of
234
chlorine radicals such as Cl• and Cl2•− at the semiconductor anode (R3) when NaCl is
used as the background electrolyte. Furthermore, the overall degradation of the
chlorinated phenol intermediates leads to the generation of carbon dioxide. For phenol,
the total amount of carbon, from carbon dioxide in the PV-connected (30 min, Figure 9.2)
and the DC-powered (100 min, Figure 9.3) systems corresponds to around 25% of the
phenolic carbon with the time-scale for CO2 release depending on the initial substrate
concentration and reaction conditions (e.g., NaCl concentration). The remainder of the
phenolic carbon is present in solution as HCO2-, C2O4
2-, HCO3-, and CO3
2-.
When phenol is added to the electrochemical reactor, the cell-voltage increases from
4.0 V to 4.2 V, while, at the same time, the cell current appears to be invariant when
powered by the PV panel (Figure 9.2). It is clear from the data presented in Figure 9.2
that the addition of phenol increases the hydrogen rate under constant solar radiation (~
1100 W m-2). Hydrogen production rates are also enhanced with the addition of maleic
acid, oxalic acid, catechol, salicylic acid, and a variety of chlorinated phenols as shown in
Table 9.1. As depicted in Scheme 9.1, R5 is thermodynamically favored over R4
(E(Cl2•−/2Cl−) = +2.3 V; E(H2O/H2,OH− = −0.41 V at pH 7), and competes with R4 for
electron at the cathode. However, the added organic compounds react with the
intermediate radical species such as HO•, Cl•, Cl2•− (R6), which are produced at the
anode (R1 & R3) and reduced at the cathode. Since phenol and the other organic
substrates react with HO•, Cl•, and Cl2•− in solution, as opposed to the cathode surface,
more electrons are available for water or proton reduction at the cathode (R4), thereby
resulting in increasing H2 production energy efficiencies of 30 to 53% at lower Icell. In
contrast, aliphatic acids increase the observed H2 production energy efficiencies by a
235
smaller amount (~ 10%) due to their slower oxidation kinetics and lesser radical (e.g.,
Cl2•−) reaction rates.
We envision that hybrid PV electrochemical systems could be used for solar-powered
water purification, coupled with the generation of a potentially useful and energy rich
byproduct. Also, solar light could be directly irradiated to the anode connected to PV to
boost the organic oxidation and give much greater synergy effects on the hydrogen
production.
236
Tables
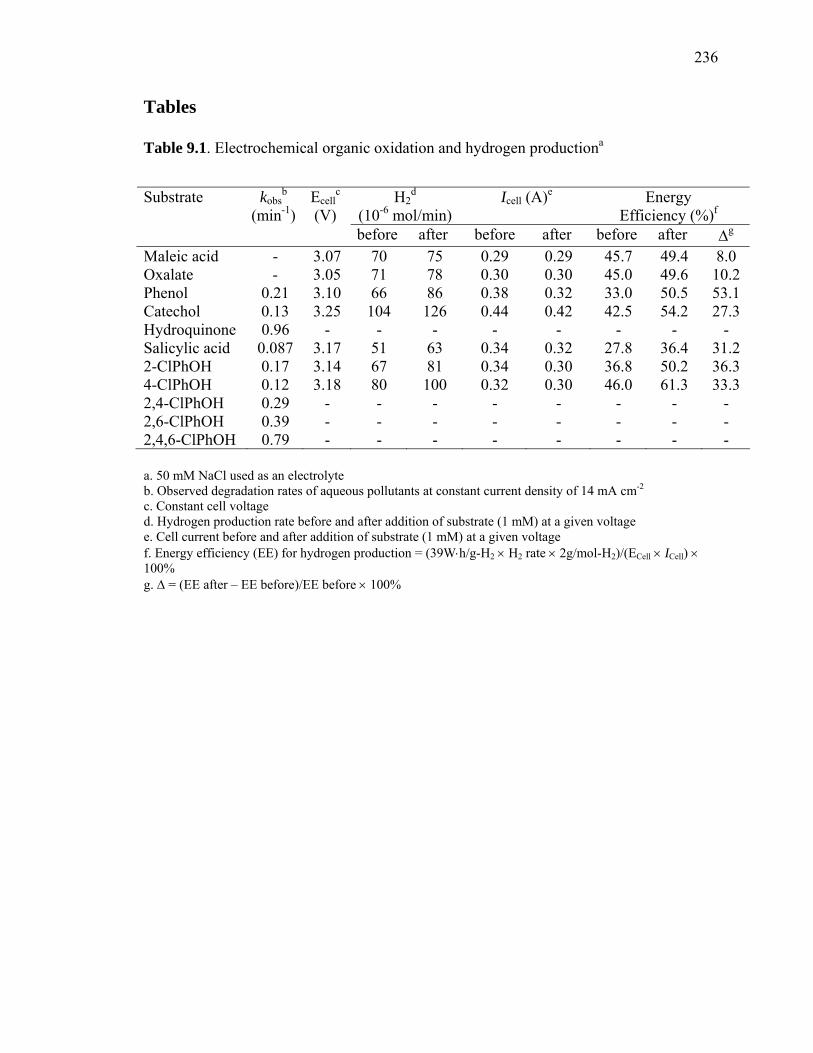
Table 9.1. Electrochemical organic oxidation and hydrogen productiona
a. 50 mM NaCl used as an electrolyte b. Observed degradation rates of aqueous pollutants at constant current density of 14 mA cm-2
c. Constant cell voltage d. Hydrogen production rate before and after addition of substrate (1 mM) at a given voltage e. Cell current before and after addition of substrate (1 mM) at a given voltage f. Energy efficiency (EE) for hydrogen production = (39W⋅h/g-H2 × H2 rate × 2g/mol-H2)/(ECell × ICell) × 100% g. Δ = (EE after – EE before)/EE before × 100%
H2d
(10-6 mol/min) Icell (A)e Energy
Efficiency (%)fSubstrate kobs
b Ecellc
(min-1) (V) before after before after before after Δg
Maleic acid - 3.07 70 75 0.29 0.29 45.7 49.4 8.0 Oxalate - 3.05 71 78 0.30 0.30 45.0 49.6 10.2 Phenol 0.21 3.10 66 86 0.38 0.32 33.0 50.5 53.1 Catechol 0.13 3.25 104 126 0.44 0.42 42.5 54.2 27.3 Hydroquinone 0.96 - - - - - - - - Salicylic acid 0.087 3.17 51 63 0.34 0.32 27.8 36.4 31.2 2-ClPhOH 0.17 3.14 67 81 0.34 0.30 36.8 50.2 36.3 4-ClPhOH 0.12 3.18 80 100 0.32 0.30 46.0 61.3 33.3 2,4-ClPhOH 0.29 - - - - - - - - 2,6-ClPhOH 0.39 - - - - - - - - 2,4,6-ClPhOH 0.79 - - - - - - - -
237
Figures
Figure 9.1. Electrochemical H2 and O2 production. A) Real-time profiles of H2 and O2 as
a function of cell voltage (Ecell). B) Effects of Ecell on cell current (Icell). C) Icell vs. the H2
and O2 production rates in different supporting electrolyte medium (Na2SO4 vs. NaCl). 50
mM NaCl or 50 mM
Time (min)0 20 40 60 80 100
Rat
e ( μ
mol
/min
)
0
100
200
300
400
500
2.674
3.06
3.35
3.86
4.28
A H2
O2
NaCl
Ecell (V)0 1 2 3 4 5
I cell (
mA
/cm
2 )
0
10
20
30
40
50
Rat
e ( μ
mol
/min
)
0
100
200
300
400
500
Current
HydrogenOxygen
B Ecell = 2.0 V
C
Icell (mA/cm2)0 10 20 30 40 50 60
Rat
e ( μ
mol
/min
)
0
100
200
300
400
500
600(Na2SO4) H2 slope: 11.08; R2 = 0.996
(Na2SO4) O2 slope: 2.138; R2 = 0.994
(NaCl) H2 slope: 9.056; R2 = 0.999
(NaCl) O2 slope: 1.193; R2 = 0.990
238
Figure 9.2. Outdoor field test of PV-electrochemical system (April 18th, 2007) on the roof
of W.M. Keck Laboratories at the California Institute of Technology. Upper panel:
Measurements of temperature and solar radiation (IS). Middle panel: Measurements of
Ecell and Icell. Bottom panel: Measurements of phenol degradation (Ct/C0), CO2 generation,
and hydrogen production. 1 mM of phenol was injected 6 times separately during the
electrolysis with 50 mM NaCl
Time (min)0 50 100 150 200 250 300
[H2 ]
(mm
ol/m
in)
0.00
0.05
0.10
0.15
0.20
0.25
[CO
2 ] ( μ
mol
/min
)
0
10
20
30
Ct/C
00.0
0.2
0.4
0.6
0.8
1.0
Tem
p (C
)
10
15
20
Ι S (W
m-2
)
1050
1100
1150
E Cel
l (V)
4.0
4.2
4.4
I Cel
l (A
)
0.6
0.8
1.0
10:10 11:00 11:50 12:40 13:30 14:20 15:10
239
Figure 9.3. Products of electrolytic degradation of 1 mM phenol. TOC change and
carbon balance at constant current (14 mA cm-2). Phenol (●), 2-chlorophenol (●), 4-
chlorophenol (●), 2,4-dichlorophenol (●), 2,6-dichlorophenol (●), 2,4,6-trichlorophenol
(●), CO2 (—), TOC (■), and carbon balance (□)
Time (min)0 20 40 60 80 100 120
Con
c. (m
M) o
r Car
bon
Bal
ance
0.0
0.2
0.4
0.6
0.8
1.0
[CO
2 ]cu
mul
( μm
ol)
0
100
200
300
400
TOC
(ppm
)
20
30
40
50
60
70
80
Scheme 9.1. Schematic diagram of the electrochemical setup
H2O
OH•
P
PoxCO2
Cl-
Cl• Cl- Cl2•-
P Pox
CO2
2H2O
H2 + 2OH-
PV
e-e- e-
e-
e-
Sunlight
n-TiO2(highly doped)
SS
PV
1
2
3 45
6
H2O
OH•
P
PoxCO2
Cl-
Cl• Cl- Cl2•-
P Pox
CO2
2H2O
H2 + 2OH-
e-e- e-
e-
e-
Sunlight
n-TiO2(highly doped)
SS
2
1 53 4
6
240
References
1. Turner, J. A. Science 2004, 305, 972.
2. Solar and Wind Technologies for Hydrogen Production, available at
http://www.hydrogen.energy.gov/congress_reports.html.
3. Ivy, J. Summary of Electrolytic Hydrogen Production: Milestone Completion
Report, available at www.nrel.gov/hydrogen/pdfs/36734.pdf.
4. Maeda, K.; Teramura, K.; Lu, D. L.; Takata, T.; Saito, N.; Inoue, Y.; Domen, K.
Nature 2006, 440, 295.
5. Grätzel, M. Nature 2001, 414, 338.
6. Khaselev, O.; Turner, J. A. Science 1998, 280, 425.
7. Friberg, R. Int. J. Hydrogen Energy 1993, 18, 853.
8. Ahmad, G. E.; El Shenawy, E. T. Renewable Energy 2006, 31, 1043.
9. Lehman, P. A.; Chamberlin, C. E.; Pauletto, G.; Rocheleau, M. A. Int. J.
Hydrogen Energy 1997, 22, 465.
10. Narayanan, S. R.; W., C.; Jeffries-Nakamura, B.; Valdez, T. I. Hydrogen
Generation by Electrolysis of Aqueous Organic Solutions; U.S. Patent 6,368,492;
Apr. 9, 2002.
11. Soler, L.; Macanas, J.; Munoz, M.; Casado, J. Int. J. Hydrogen Energy 2006, 31,
129.
12. Mathieson, G.; Langdon, A.; Jamieson, G. Dev. Chem. Eng. Mineral Process
2006, 14, 71.
13. Drew, K.; Girishkumar, G.; Vinodgopal, K.; Kamat, P.V. J. Phys. Chem. B 2005,
109, 11851.
241
14. Kesselman, J. M.; Weres, O.; Lewis, N. S.; Hoffmann, M. R. J. Phys. Chem. B
1997, 101, 2637.
15. Weres, O. Electrode with Surface Comprising Oxides of Titanium and Bismuth
and Water Purification Process Using This Electrode; U.S. Patent 0,000,774
A1; Jan. 4, 2007.


![Photoelectrochemical Production of Hydrogen · stainless steel), for solar hydrogen production [Miller & Rocheleau, 2001]. In the illustration of a generic hydrogen photoelectrode](https://static.fdocuments.net/doc/165x107/5ea93ce75a148409cd011fb5/photoelectrochemical-production-of-hydrogen-stainless-steel-for-solar-hydrogen.jpg)