
Sol-Gel Synthesis of Phosphate-Based Glasses for...
202
Sol-Gel Synthesis of Phosphate-Based Glasses for Biomedical Applications Thesis submitted by Farzad Foroutan For the degree of DOCTOR OF PHILOSOPHY Division of Biomaterials and Tissue Engineering UCL Eastman Dental Institute, University College London 256 Gray’s Inn Road, London, WC1X 8LD, UK. -2015-
Transcript of Sol-Gel Synthesis of Phosphate-Based Glasses for...

Sol-Gel Synthesis of Phosphate-Based
Glasses for Biomedical Applications
Thesis submitted by
Farzad Foroutan
For the degree of
DOCTOR OF PHILOSOPHY
Division of Biomaterials and Tissue Engineering
UCL Eastman Dental Institute, University College London
256 Gray’s Inn Road, London, WC1X 8LD, UK.
-2015-

1
Declaration
I, Farzad Forouran, confirm that the work presented in this thesis is my own. Where
information has been derived from other sources, I confirm that this has been
included in the thesis.

2
Dedicated to My Mother and
in Memory of My Father

3
Acknowledgements
I would like to convey my sincere thanks and deep appreciation to those who have
supported and inspired me during my PhD. First and foremost, special thanks to my
supervisors Prof. Jonathan Knowles and Prof. Nora De Leeuw. I would not be able
to complete my project without their invaluable guidance, encouragement and
support. It has been an honour and a pleasure to work with them.
I am most thankful to the UCL Industrial Doctorate Centre in Molecular Modelling &
Materials Science and UCL Graduate School for their financial support. This work
was also supported by the WCU program through the National Research Centers
Program funded by the Ministry of Education, Science and Technology, Republic of
Korea.
I would like to thank Drs. George Georgiou, Graham Palmer, and Nicola Mordan for
their advice and technical support. My colleague and friends specifically Nick Walter
and Dr. Gareth Owens for their guidance and help with cell culture and ion
chromatography studies. Those PhD students who graduated before me, including
Nilay and In-Ho for their precious guidance during my PhD. I would also like to
thank Omaer, Mustafa, and Piyaphong who made my time memorable and
enjoyable in the office and the other students in our department who have been
very helpful.
Outside the department, I would like to gratefully acknowledge Dr. Jesse Jokerst
from the Department of Radiology at Stanford University for performing cell culture
and ultrasound imaging studies. Dr. Richard Martin from the School of Engineering
at Aston University for his guidance with XANES study at Diamond Light Source
Centre. EPSRC NMR Service at Chemistry Department-Durham University and Dr.
David Apperley for performing MAS NMR measurements.

4
Special thanks go to my wife, Mitra. Her understanding and encouragement helped
me to move forward throughout this journey.
Most importantly, I would especially like to thank to my mother for her
encouragement throughout the years in my life and I would not be able to succeed
without her support. Last but not least, thanks to my sisters Farnaz and Farnoush
for their support during my PhD.

5
Abstract
This thesis concerns the development of a new and facile sol-gel synthesis route for
production of phosphate-based glasses for biomedical applications including; tissue
engineering, imaging contrast agents and drug delivery systems. The structure of
the prepared samples was probed by XRD, 31P MAS-NMR, EDX and FTIR
spectroscopy that confirmed successful synthesis and production of phosphate-
based glasses via the sol-gel method. In this study, for the first time, quaternary
phosphate-based sol-gel derived glasses in the P2O5–CaO–Na2O–TiO2 system with
a high TiO2 content of up to 30 mol% were synthesised. While incorporating a high
percentage of titanium into the phosphate network is non-trivial via traditional melt-
quench methods. Investigation of quaternary glasses with the general formula of
(P2O5)55–(CaO)25–(Na2O)(20-x)–(TiO2)x, where X = 0, 5, 10 or 15 revealed,
substituting titanium in place of sodium significantly improves the stability and
prolongs the degradation of these glasses, which opens up a number of potential
biomedical applications. Cell studies on titanium-stabilised glasses suggested
glasses containing 5 or 10 mol% TiO2 have optimal potential for bone tissue
engineering applications. Electrospraying was used to prepare (P2O5)55–(CaO)30–
(Na2O)15 glass nanospheres with a diameter size range of 200-500 nm. These glass
nanospheres were used as a transient contrast agent for ultrasound imaging to
label mesenchymal stem cells and it was determined in vitro and in vivo that these
nanospheres had a detection limit of 5 and 9 µg.mL-1, respectively. Cell counts
down to 4000 could be measured with ultrasound imaging with no cytotoxicity at
doses required for imaging. Glass nanospheres were also used as a carrier for drug
delivery applications with a linear release of tetracycline hydrochloride molecules
within the first 4 hours of the study period. Importantly, ion release studies
confirmed these glass nanospheres biodegrade into an aqueous medium with
degradation products that can be easily metabolised in the body. To the knowledge

6
of the author, this is the first report of sol-gel synthesis and electrospraying to
prepare glass nanospheres at low processing temperature and the first use of such
a system for both diagnostic and therapeutic purposes.

7
Table of Contents
CHAPTER 1. Introduction and Literature Review 22
1.1. Biomaterials 23
1.2. Biomaterials classifications 24
1.2.1. Bioinert materials 24
1.2.2. Bioactive materials 25
1.2.2.1. Bioactive glasses 26
1.2.3. Bioresorbable materials 28
1.2.3.1. Bioresorbable glasses 30
1.3. Phosphate-based glasses 30
1.3.1. Structure 30
1.3.2. Synthesis methods 32
1.3.2.1. Melt-quench 32
1.3.2.2. Sol-gel 33
1.3.2.2.1. Preparation of sol 35
1.3.2.2.2. Colloid formation 36
1.3.2.2.3. Gel formation 36
1.3.2.2.4. Ageing and drying 37
1.3.2.2.5. Preparation of bulk sol-gel derived glasses 38
1.3.3. Solubility and degradation rate of phosphate-based
glasses
39
1.4. Biomaterial applications 41
1.4.1. Orthopaedics 41
1.4.2. Tissue engineering 42
1.4.3. Drug delivery 45
1.4.3.1. Therapeutic nanoparticles 46
1.4.4. Diagnostic contrast agents 49
1.4.4.1. Diagnostic nanparticles 49
1.5. Potential biomedical applications of phosphate-based
glass systems
51
1.5.1. Binary P2O5-TiO2 glasses 51
1.5.2. Ternary P2O5-CaO-TiO2 glasses 52
1.5.3. Ternary P2O5-CaO-Na2O glasses 53
1.5.4. Quaternary P2O5-CaO-Na2O-TiO2 glasses 53

8
References 56
CHAPTER 2. Sol-Gel Synthesis and Characterisation of Phosphate-
Based Glasses Using Triethyl Phosphate as a
Phosphorus Precursor
70
2.1. Introduction 71
2.2. Materials and methods 72
2.2.1. Materials 72
2.2.2. Sol-gel synthesis methods 74
2.2.2.1. Binary P2O5-TiO2 glasses 74
2.2.2.2. Ternary P2O5-CaO-TiO2 glasses 75
2.2.2.3. Ternary P2O5-CaO-Na2O glasses 76
2.2.2.4. Quaternary P2O5-CaO-Na2O-TiO2 77
2.2.3 Drying procedure 78
2.2.4. Structural characterisation 79
2.2.4.1. X-ray diffraction 79
2.2.4.1.1. XRD analysis method 80
2.2.4.2. Energy dispersive X-ray 80
2.2.4.2.1. EDX analysis method 81
2.2.4.3. Nuclear magnetic resonance 81
2.2.4.3.1. 31P MAS-NMR analysis method 83
2.2.4.4. Fourier transform infrared spectroscopy 83
2.2.4.4.1. FTIR analysis method 84
2.3. Results 85
2.3.1. Sample preparation 85
2.3.2. XRD 87
2.3.2.1. Binary P2O5-TiO2 glasses 87
2.3.2.2. Ternary P2O5-CaO-TiO2 and P2O5-CaO-Na2O glasses 90
2.3.2.3. Quaternary P2O5-CaO-Na2O-TiO2 glasses 91
2.3.3. EDX 92
2.3.4. 31P MAS-NMR 94
2.3.4.1. Binary P2O5-TiO2 and ternary P2O5-CaO-TiO2 and P2O5-
CaO-Na2O glasses
94
2.3.4.2. Quaternary P2O5-CaO-Na2O-TiO2 glasses 97
2.3.5. FTIR spectroscopy 98
2.4. Discussion 102
9
References 107
CHAPTER 3. Sol-Gel Synthesis and Characterisation of Ternary
P2O5-CaO-Na2O and Quaternary P2O5-CaO-Na2O-TiO2
Glass Systems Using n-butyl Phosphate as a
Phosphorus Precursor.
110
3.1. Introduction 111
3.2. Materials and methods 112
3.2.1. Materials 112
3.2.2. Sol-gel synthesis methods 113
3.2.3. Drying procedure 114
3.2.4. Structural characterisation methods 115
3.2.4.1. XRD and EDX 115
3.2.4.2. 31P MAS-NMR and FTIR 115
3.3. Results 115
3.3.1. Sample preparation 115
3.3.2. XRD 117
3.3.3. EDX 118
3.3.4. 31P MAS-NMR 119
3.3.5 FTIR 122
3.4. Discussion 124
References
126
CHAPTER 4. Bone Tissue Engineering Applications of Titanium-
Stabilised Sol-Gel Derived Glasses
128
4.1. Introduction 129
4.2. Aims 130
4.3. Materials and methods 131
4.3.1. Sol-gel synthesis 131
4.3.2. pH change measurement 131
4.3.3. Ion release measurement 132
4.3.3.1. Cation release 132
4.3.3.2. Anion release 133
4.3.4. Cell studies 133
4.3.4.1. Cell culture 133
4.3.4.2. Cytocompatibility assay 134
10
4.3.4.3. Cell and particle imaging 135
4.4. Results 136
4.4.1. pH change measurement 136
4.4.2. Ion release measurement 137
4.4.3. Cytocompatibility 139
4.4.4. Cell and particle imaging 140
4.5. Discussion 144
References
147
CHAPTER 5. Sol-gel Synthesis and Electrospraying of Ternary
(P2O5)0.55-(CaO)0.30-(Na2O)0.15 Glass Nanospheres for
Diagnostic and Therapeutic Applications.
149
5.1. Introduction 150
5.2 Aims 152
5.3. Materials and methods 153
5.3.1. Design of electrospraying 153
5.3.2. Synthesis of the sol for subsequent electrospraying 154
5.4. Structural characterisation methods 155
5.4.1. SEM 155
5.4.2. XRD and EDX 156
5.4.3. 31P MAS-NMR and FTIR 156
5.4.4. Cell culture, labelling, and cytotoxicity 156
5.4.5. Biodegradation monitoring 158
5.4.6. In vitro ultrasound imaging 159
5.4.7. In vivo ultrasound imaging 159
5.4.8. Drug release measurement 160
5.5. Results 160
5.5.1. SEM and EDX 160
5.5.2. XRD 162
5.5.3. 31P MAS-NMR 163
5.5.4. FTIR 164
5.5.5. Ion release study 165
5.5.6. Cytotoxicity study 166
5.5.7. In vitro ultrasound imaging 168
5.5.8. In vivo ultrasound imaging 171

11
5.5.9 Ultrasound cellular imaging 173
5.5.10. Drug release measurement 177
5.6. Discussion 178
References
182
CHAPTER 6. General Discussion and Future Directions 187
References
192
APPENDICIES 193
Appendix I 194
Appendix II: List of publications 199
Appendix III: List of conferences
200

12
List of Tables
CHAPTER 1
Table 1.1. Surface tension and boiling points of various solvents. 39
CHAPTER 2
Table 2.1. Theoretical compositions of sol-gel synthesised phosphate-
based glasses using triethyl phosphate as a phosphorus
precursor.
72
Table 2.2. Effect of heat treatment on phosphate-based sol-gel derived
glasses using triethyl phosphate as a phosphorus precursor.
87
Table 2.3. Intended compositions and measured values of sol-gel
derived glasses using triethyl phosphate as a phosphorus
precursor determined by EDX (in parentheses).
93
Table 2.4. 31P MAS-NMR peak parameters of binary and ternary
phosphate-based sol-gel derived glasses using triethyl
phosphate as a phosphorus precursor.
96
Table 2.5. 31P MAS-NMR peak parameters of quaternary P2O5-CaO-
Na2O-TiO2 sol-gel derived glasses using triethyl phosphate
as a phosphorus precursor.
98
Table 2.6. Infrared band assignment of phosphate-based sol-gel
derived glasses using triethyl phosphate as a phosphorus
precursor. (ʋ, stretching; s, symmetric; as, asymmetric).
101
CHAPTER 3
Table 3.1. Compositions of starting solution for ternary P2O5-CaO-
Na2O and quaternary P2O5-CaO-NaO-TiO2 sol-gel derived
samples using n-butyl phosphate as a phosphorus
precursor.
112
Table 3.2. The effect of drying procedure in ternary P2O5-CaO-Na2O
and quaternary P2O5-CaO-Na2O-TiO2 sol-gel derived
samples using n-butyl phosphate as a phosphorus
precursor.
116
Table 3.3. Intended compositions and measured values of sol-gel
derived glasses using n-butyl phosphate as a phosphorus
precursor determined by EDX (in parentheses).
119
Table 3.4. 31P MAS-NMR peak parameters of ternary P2O5-CaO-Na2O 121

13
and quaternary P2O5-CaO-Na2O-TiO2 sol-gel derived
glasses using n-butyl phosphate as a precursor.
Table 3.5. Infrared band assignment of phosphate-based sol-gel
derived glasses using n-butyl phosphate as a phosphorus
precursor.
122
CHAPTER 4
Table 4.1. The theoretical compositions of phosphate-based sol-gel
derived glasses using n-butyl phosphate as a phosphorus
precursor.
131
CHAPTER 5
Table 5.1. Intended composition and measured values of sol-gel
derived glasses determined by EDX (in parentheses).
162
Table 5.2. 31P MAS-NMR peak parameters of phosphate-based glass
nanospheres.
169
14
List of Figures
CHAPTER 1
Figure 1.1. Schematic phosphate structure as a function of
composition.
32
Figure 1.2. Four types of aggregated colloids that are coacervates,
tactoid, crystalloids, and flocks.
36
Figure 1.3. Tissue engineering concept includes; (a) isolating patients'
cells, (b) in vitro cultivation of cells on a two-dimensional
surface, (c) seeding cells in a porous scaffold and adding
growth factors, small molecules and etc., (d) further cell
cultivation in bioreactor, and (e) transplantation of the
engineered tissue.
43
CHAPTER 2
Figure 2.1. Structure of; (a) triethyl phosphate, (b) titanium
isopropoxide, (c) 2-methoxyethanol, (d) n-dimethyl
formamide, (e) calcium methoxyethoxide, and (f) sodium
methoxide solution.
73
Figure 2.2. Schematic of the sol-gel synthesis of binary P2O5-TiO2
glasses.
74
Figure 2.3. Flow diagram of the sol-gel synthesis of ternary P2O5-TiO2-
CaO glasses.
75
Figure 2.4. Schematic of the sol-gel synthesis of ternary P2O5-CaO-
Na2O glasses.
76
Figure 2.5. Schematic of the sol-gel synthesis of quaternary P2O5-CaO-
Na2O-TiO2 glasses.
77
Figure 2.6. Heat treatment diagram for the sol-gel synthesised
phosphate-based glasses.
78
Figure 2.7. Representations of PO4 tetrahedra with various
polymerisation.
83
Figure 2.8. Photographs of heat treated; (A) EP55T45, (B) EP50T50, (C)
EP55CT30, and (D) EP55CNT15 sol-gel derived glasses.
86
Figure 2.9. XRD patterns of binary sol-gel derived samples in P2O5-TiO2
system using triethyl phosphate as a phosphorus precursor. Crystalline patterns were observed for EP65T35 and EP70T30
88

15
sol-gel derived samples.
Figure 2.10. XRD patterns of; (a) EP65T35 and (b) EP70T30 sol-gel derived
samples. Crystalline phases were identified using the
Crystallographica Search-Match software which are
corresponded to TiP2O7 crystalline structure.
89
Figure 2.11. XRD patterns of ternary sol-gel derived glasses in the P2O5-
CaO-TiO2 system using triethyl phosphate as a phosphorus
precursor. All patterns are free from any detectable
crystalline phases.
90
Figure 2.12. XRD patterns of ternary sol-gel derived glasses in the P2O5-
CaO-Na2O systems using triethyl phosphate as a
phosphorus precursor which showed no evidence of any
detectable crystalline phases.
91
Figure 2.13. XRD patterns of the quaternary sol-gel derived samples in
P2O5-CaO-Na2O-TiO2 system using triethyl phosphate as a
phosphorus precursor which are free from any detectable
crystalline phase.
92
Figure 2.14. 31P MAS-NMR spectra of binary P2O5-TiO2 sol-gel derived
glasses using triethyl phosphate as a phosphorus precursor.
The peaks correspond to mainly Q1 and Q2 phosphate units.
94
Figure 2.15. 31P MAS-NMR spectra of ternary sol-gel derived glasses
using triethyl phosphate as a phosphorus precursor in; (a)
P2O5-CaO-TiO2 and (b) P2O5-CaO-Na2O systems. The
peaks correspond to mainly Q1 and Q2 phosphate units.
95
Figure 2.16. 31P MAS-NMR spectra of quaternary P2O5-CaO-Na2O-TiO2
sol-gel derived glasses using triethyl phosphate as a
phosphorus precursor. The peaks correspond to mainly Q1
and Q2 phosphate units.
97
Figure 2.17. FTIR spectra of binary P2O5-TiO2 sol-gel derived glasses using triethyl phosphate as a phosphorus precursor.
99
Figure 2.18. FTIR spectra of ternary sol-gel derived glasses using triethyl
phosphate as a phosphorus precursor in; (a) P2O5-CaO-
TiO2 and (b) P2O5-CaO-Na2O systems.
100
Figure 2.19 FTIR spectra of quaternary P2O5-CaO-Na2O-TiO2 sol-gel
derived glasses using triethyl phosphate as a phosphorus
precursor.
101
16
Figure 2.20. Schematic setup to analyse the evaporated gas from
ternary EP55CN20 sol-gel derived sample via FTIR
spectroscopy during the heat treatment cycle.
104
Figure 2.21. FTIR spectra of ternary EP55CN20 sol-gel derived sample
during the heat treatment cycle from 100 to 220 °C.
105
CHAPTER 3
Figure 3.1. Structural formula of n-butyl phosphate; a mixture of (a)
mono butyl phosphate (C4H11O4P) and (b) di-butyl
phosphate (C8H19O4P).
113
Figure 3.2. Schematic sol-gel synthesis of; (A) ternary P2O5-CaO-Na2O
and (B) quaternary P2O5-CaO-Na2O-TiO2 samples using n-
butyl phosphate as a phosphorus precursor.
114
Figure 3.3. Photographs of; A) BP40CNT25, B) BP40CNT30, and C)
BP55CNT15 sol-gel derived glasses using n-butyl phosphate
as a phosphorus precursor. The scale bar for A, B, and C is
1 cm.
116
Figure 3.4. XRD patterns of ternary P2O5-CaO-Na2O sol-gel derived
samples using n-butyl phosphate as a phosphorus
precursor that are free from any detectable crystalline
phase.
117
Figure 3.5. XRD patterns of quaternary P2O5-CaO-Na2O-TiO2 sol-gel
derived samples using n-butyl phosphate as a phosphorus
precursor that showed no evidence of any detectable
crystalline phase.
118
Figure 3.6. 31P MAS-NMR spectra of; (a) ternary P2O5-CaO-Na2O and
(b) quaternary P2O5-CaO-Na2O-TiO2 sol-gel derived glasses
using n-butyl phosphate as a phosphorus precursor. The
peaks correspond to mainly Q1 and Q2 phosphate units.
120
Figure 3.7. FTIR spectra of; (a) ternary P2O5-CaO-Na2O and (b)
quaternary P2O5-CaO-Na2O-TiO2 sol-gel derived glasses
glasses using n-butyl phosphate as a phosphorus
precursor.
123
CHAPTER 4
Figure 4.1. pH measurement after 0, 1, 3 and 7 days immersion of sol-
gel derived glass microparticles in deionised water that
137

17
shows significant decrease in pH after 24 hours. Error bars
represent the standard deviation of 3 samples.
Figure 4.2. Cumulative release of (a) Ca2+and (b) Na+ cations and (c)
P2O74-, (d) P3O10
5-, (e) P3O93- and (f) PO4
3- anions from sol-
gel derived glass microparticles after 1, 3 and 7 days
storage in deionised water. Error bars represent the
standard deviation of 3 samples.
138
Figure 4.3. Cytocompatibility of sol-gel glass microparticles containing
0, 5, 10 or 15 mol% Ti with MG-63 at 1, 3 and 7 days.
Dotted line represents initial seeding density. Error bars
represent the standard deviation of 3 samples.
139
Figure 4.4. Scanning electron micrographs showing particles
morphology and cell attachment. (A, B) Control (cells on cell
culture support), (C, D) Ti0, (E, F) Ti5, (G-I) Ti10, and (J, K)
Ti15.
142
Figure 4.5. Confocal micrographs showing cells attached to sol-gel
glass microparticles containing (A, B) 5 or (C, D) 10 mol%
TiO2. The green fluorescent stain (phalloidin) shows
filamentous actin and red (propidium iodide) shows nuclei.
143
CHAPTER 5
Figure 5.1. Schematic of the electrospraying setup including; syringe
pump, nozzle (stainless steel needle), high voltage supply,
collection substrate, and hot plate. The high voltage
between the nozzle and the ground creates nanospheres
from the needle tip and these are propelled toward the
heated silicone oil as a substrate to obtain dried gel
nanospheres.
154
Figure 5.2. SEM image of (A, B) washed and heat-treated PGNs (the
scale bars represent 5 and 2µm) and (C, D) dispersed
PGNs in ethanol solution after heat-treatment (the scale
bars represent 2 µm). The PGNs have an approximate size
distribution of 200 - 500 nm with a mean diameter of 320 nm
based on measurement of more than100 particles.
161
Figure 5.3. The XRD pattern of PGNs which is free from any detectable
crystalline phase.
162
Figure 5.4. 31P MAS-NMR spectrum of PGNs that correspond to mainly 163

18
Q1 and Q2 phosphate units.
Figure 5.5. FTIR spectrum and band assignment for PGNs (ʋ,
stretching; s, symmetric; as, asymmetric).
164
Figure 5.6. Cumulative release of phosphorus, calcium, and sodium in
deionized water as a function of time for the investigated
PGNs. Error bars represent the standard deviation of 3
samples.
165
Figure 5.7. Increasing concentrations of PGNs were used to label
MSCs for 4 hours followed by treatment with different
markers of cytotoxicity. All experiments were validated with
a positive control (POS). A) Cells were plated, tagged with
DCFDA, and then perturbed with PGNs. Any ROS
generation resulted in fluorescence from the DCFDA probe.
Only the 1000 µg.mL-1 sample significantly upregulated
ROS. A hydrogen peroxide positive control validated the
assay. The negative control was wells with no cells. B) The
MTS reagent measures cell metabolism and showed no
decrease at any concentration studied. Here, we used both
freshly dissolved PGNs (fresh) and PGNs that had been in
solution for 24 hours (degraded). No concentration
decreased metabolism. Error bars represent the standard
deviation of 6 wells.
167
Figure 5.8. Ultrasound images in the z-axis for inclusions with 0 mg.mL-
1 PGNs (A) and 1 mg.mL-1 PGNs at 40 MHz (B). The
increased backscatter results from the increasing number of
particles that was further quantified for multiple fields of view
in (C). PGNs (0.25 mg.mL-1) at various time points were
imaged with ultrasound to understand how signal changes
as a function of time (D). These data indicate that
ultrasound signal decreases as the PGNs degrades
because of decreased acoustic impedance. The imaging
window is within the first four hours of dissolution.
169
Figure 5.9. Panel A is an ultrasound image in the z-axis for1 mg.mL-1
PGNs at 16 MHz, and B is signal and signal-to-background
for both 16 and 40 MHz. Here, the signal was defined as
echogenicity of the sample and background was adjacent
170
19
agar. While the signal was higher at 40 MHz, the signal-to-
background at 16 MHz was 4.6-fold higher than 40 MHz
because of a lower background signal. These data indicate
that the PGNs are suitable for imaging at both clinical and
pre-clinical frequencies.
Figure 5.10. Nude mice received 100 µL boluses of 2 mg.mL-1 PGNs in
1:1 matrigel:PBS and imaged at 40 MHz immediately after
implantation (A) and 1 day after (B). Red outlines in A and B
indicate the region of implantation.
172
Figure 5.11. Decreasing concentrations of PGNs were also implanted to
calculate the limit of detection and variance between
animals (A). Error bars represent the standard error of
measurement. Changes in ultrasound backscatter for PGNs
indicate a 3.5-fold decrease in signal-to-background ratio
(SBR) (B). Error bars represent the standard deviation.
173
Figure 5.12. The optimal labeling conditions were tested empirically
including starting concentration of PGNs (A) and incubation
time (B). We found a nearly linear relationship between
starting concentration and cell fluorescence (A). These
concentrations used 2 hours of labeling. In B, we studied
the effect of time and found that incubation times beyond 2
hours offered no additional signal. (C) MSCs labelled with
these conditions (500 µg.mL-1 and 2 hours) were imaged
with 40 MHz ultrasound—the limit of detection is 4000
MSCs.
175
Figure 5.13. Phase contrast/fluorescence microscopy of naive MSCs (A)
and MSCs labelled with PGNs shows that fluorescence only
corresponds to the cells (low non-specific binding) (B).
Panel C is ultrasound image of blank agarose phantom (no
cells), panel D is the ultrasound backscatter from 225,000
MSCs, and panel E is the same number MSCs labelled with
PGNs in an agar phantom. The PGNs increased the
backscatter two-fold versus unlabelled cells. Panel F is a
confocal image through the medial slice of adherent cells
labelled with fluorescently tagged PGNs. The image shows
that the nanoparticles are located throughout the cell and
176

20
are localized in the cytoplasm and are not simply on the cell
surface.
Figure 5.14. TCH release measurement of drug-loaded PGNs determined via UPLC. Highest release occurred within the
first 4 hours of the entire study. Error bars represent the
standard deviation of 3 samples.
177
APPENDICES Figure A.1. Schematic of sol-gel synthesis of phosphate-based glasses
to prepare thin film coating, glass nanospheres via
electrospraying and subsequent heat-treatment or to obtain
bulk glasses via carefully controlled heat-treatment of the
gel over three weeks.
195
Figure A.2. Various electrospraying modes (A) and steps of
nanospheres production via electrospraying (B)
196
Figure A.3. SEM images of sol-gel derived glasses (after heat-
treatment) created by electrospraying at; A) voltage of 12 kV
and flow rate of 1 mL.h-1, B) voltage of 15 kV and flow rate
of 0.5 mL.h-1, C) voltage of 18 kV and flow rate of 0.5
mL.h-1, D) voltage of 20 kV and flow rate of 0.4 mL.h-1, and
voltage of 20 kV and flow rate of 0.2 mL.h-1 (E and F).
197
Figure A.4. Photographs of; electrospray deposition of quaternary
(P2O5)55-(CaO)25-(Na2O)10-(TiO2)10 glass on (A) aluminium
foil and (B) titanium disc. C) SEM image of coated titanium
disc after heat-treatment at 250 °C.
198
21
Abbreviations
HA Hydroxyapatite
SBF Simulated Body Fluid
PLLA Poly-L-Lactic Acid
PGA Polyglycolic Acid
PLA Polylactic Acid
HCA carbonated hydroxyapatite
PCA Poly Cyanoacrylate
PCL Poly (ε-Caprolactone)
XRD X-Ray Diffraction
FTIR Fourier Transform Infrared
EDX Energy Dispersive X-Ray 31P MAS-NMR 31P Magic Angle Spinning Nuclear Magnetic Resonance
n-DMF n-Dimethyl Formamide
SEM Scanning Electron Microscopy
CLSM Confocal Laser Scanning Microscopy
IC Ion Chromatography
ICP-MS Inductively Coupled Plasma Mass Spectroscopy
PGN Phosphate-based Glass Nanospheres
UPLC Ultra Performance Liquid Chromatography
DCFDA 2’,7’ –Dichlorofluorescin Diacetate
MSC Human mesenchymal stem cell
MTS 3-(4,5-dimethylthiazol-2-yl)-5-(3-carboxymethoxyphenyl)-
(4-sulfophenyl)-2H-tetrazolium
DMSO Dimethyl Sulfoxide
HBSS Hanks Buffered Saline Solution
SB Signal-to-Background
TCH Tetracycline Hydrochloride
POS Positive Control
NEG Negative Control
ROS Reactive Oxygen Species

CHAPTER 1
22
CHAPTER 1
Introduction and Literature Review

CHAPTER 1
23
1.1. Biomaterials
Over the past 50 years, medical care has been developed and human life
expectancy has increased dramatically. Since the mean age of the population of
developed countries is continuously increasing, there is a significant and growing
need for materials to replace diseased or damaged human tissues. These materials
are required to be compatible with the body, that is related to the behaviour of the
material in various contexts. They must have the ability to perform with an
appropriate host response in a specific situation which considered to be one of the
most specific properties of biomaterials and is called biocompatibility. A
biocompatible material must elicit minimal immune response and should not disturb
the blood flow (Cook et al., 2003).
Ceramics have shown great potential as biomaterials, due to their physicochemical
properties. Almost any ceramic material that is not toxic can be potentially used as
a biomaterial and can be defined as substances that augment the function of soft
and hard tissues such as repair and reconstruction of bone defects and diseased or
damaged musculoskeletal system (Ben-Nissan, 2004). Bioceramic materials are
inorganic and usually contain both metallic and non-metallic elements where the
atomic bonding is almost entirely ionic and can be subclassified as amorphous and
crystalline. Amorphous bioceramics show order only on a very short length scale
and are called glasses, but crystalline bioceramics show regular atomic arrays over
large distances.
Bioceramics have a long history but only since the 1960s with the improvement of
surgical techniques, the replacement of body parts has become more
commonplace (Hench and Wilson, 1991, Peppas and Langer, 1994). Undoubtedly,
bioceramics have had a great impact on the practice of contemporary medicine and
patient care in both saving, and improving the quality of the lives of humans and

CHAPTER 1
24
animals. Some of their major clinical applications are in dentistry, orthopaedics,
maxillofacial surgery, and more recently drug delivery and imaging contrast agents
(Jones and Hench, 2003, Vallet-Regi and Ruiz-Hernandez, 2011, Jokerst et al.,
2013, Foroutan et al., 2015).
1.2. Biomaterial classifications
Biomaterials can be derived either from natural or synthetic components and can be
classified into two main categories: biological with a natural origin or biomedical
with an artificial origin. The main problems with the biological materials are their
limitation of the amount that can be collected and increasing the risk of viral and
bacterial infections (Chai et al., 2011) as well as control of sample to sample and
batch to batch variability. While artificial materials can be supplied from a variety of
materials (polymers, ceramics, and metals) and can be sterilised to reduce the risk
of bacterial infections.
One of the main material groups being developed are bioceramics, since they show
very good interaction with their surrounded tissues. According to their biological
response, bioceramics can be classified as (Hulbert et al., 1982); 1) bioinert
(alumina and zirconia), 2) bioactive or surface reactive (sintered HA and bioglass),
and 3) bioresorbable (phosphate-based glasses).
1.2.1. Bioinert materials
Up to a few decades ago, bioceramics were expected to have appropriate physical
properties to suit the function of the replaced tissue with minimal cytotoxicity
(Hench, 1980). Bioinert materials belong to the first generation of bioceramics and
are characterised to be accepted by the body with minimal or low interaction with

CHAPTER 1
25
the physiological environment. These materials do not elicit a significant response
from the body and a mechano-chemical bond is formed with the bone and tissue.
They are typically based on dense or porous ceramics such as alumina or zirconia.
Alumina ceramics have proven their bioinertness with high hardness and abrasion
resistance mainly for dental and orthopaedic applications. According the American
Society for Testing and Materials (ASTM), alumina implants should contain 99.5 %
pure alumina and other alkali oxides with less than 0.1 % of SiO2 (Park, 2003).
Zirconia ceramics are in clinical use in total hip replacement because of their
inertness, high mechanical strength and fracture toughness (Hentrich et al., 1969).
1.2.2. Bioactive materials
The second generation of bioceramics is defined as bioactive with a surface that
has a spontaneous capability to interact with physiological fluids in the human body
and form a bone-like layer which is very similar to the mineral phase of the bone.
The bone-like layer made of hydroxyapatite (HA) and can exhibit fast reaction
kinetics that results in the formation of a good chemical bond between the material
and the tissue at the interface (Kokubo et al., 2003). This property makes these
materials ideal for various biomedical applications such as orthopaedics and dental
prosthetics to induce regeneration of the damaged bone and tissue. As research
developed from bioinert toward bioactive ceramics, scientists focused on their
different structures (crystalline, glass, and glass-ceramic). They found that the
compositions that mimicked the inorganic component of bone, could form a good
interaction with hard and soft tissues (Urist et al., 1994). One of the most widely
used crystalline bioactive ceramic is dense HA (hydroxyapatite). However, it shows
poor mechanical properties which limit its application to space filling or use as a

CHAPTER 1
26
coating for other biomaterials with good mechanical properties. Meanwhile, among
amorphous bioactive ceramics, silicate-based glasses have been more popular,
with good interaction with the bone and surrounding tissues (Hench and Wilson,
1991, Hench, 1998).
1.2.2.1. Bioactive glasses
Generally, the term glass includes every solid that possesses a non-crystalline
structure and exhibits a glass transition when heated towards the liquid state.
Bioactive glasses have been defined as materials that induce a specific biological
activity and show specific surface reaction when implanted into the body (Rahaman
et al., 2011). Indeed, one of the most attractive features of glasses is their non-
stoichiometry and thus compositional flexibility, which allows researchers to tailor
the properties to the end application. These glasses also have the potential to
initiate a range of biological responses by releasing ions into the local environment
(Hench and Wilson, 1984). The most applicable bioactive glasses are silicate-based
glasses that have been used extensively in non-load bearing applications and there
is a possibility to design these glasses with specific clinical properties, mainly for
tissue regeneration applications (Hench and Wilson, 1991). The first silicate-based
bioactive glass was discovered by Hench et al. (Hench and Wilson, 1991, Hench,
1998) as a second generation of biomaterials with a reactive surface which could
exhibit reaction kinetics to bond with the bone at the interface (Hench and Polak,
2002). The base components of these bioactive glasses are usually SiO2 (silicate is
the main component), Na2O, CaO, and P2O5. These glasses are stable to
hydrolysis because of their high silica content, but they can promote direct
osteoblast cell attachment and proliferation. Studies have shown that the content of
Si cations in the human body varies, around 100 ppm in bone and ligaments to
CHAPTER 1
27
around 200-600 ppm in cartilage and other connective tissues. Release of Si4+ ions
in an aqueous medium has been demonstrated to promote osteoblast proliferation,
differentiation and collagen production (Carlisle, 1970, Pietak et al., 2007).
However, glasses with a significantly lower molar ratio of Ca and P do not generate
direct bonding with the bone.
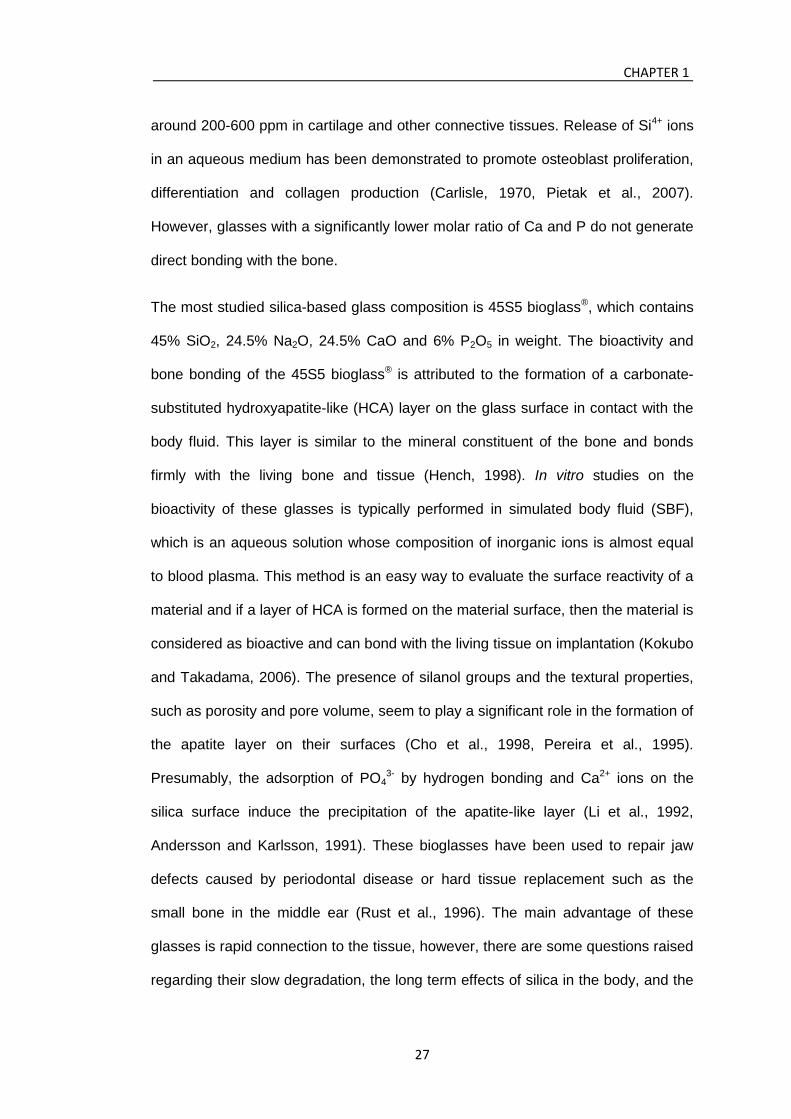
The most studied silica-based glass composition is 45S5 bioglass®, which contains
45% SiO2, 24.5% Na2O, 24.5% CaO and 6% P2O5 in weight. The bioactivity and
bone bonding of the 45S5 bioglass® is attributed to the formation of a carbonate-
substituted hydroxyapatite-like (HCA) layer on the glass surface in contact with the
body fluid. This layer is similar to the mineral constituent of the bone and bonds
firmly with the living bone and tissue (Hench, 1998). In vitro studies on the
bioactivity of these glasses is typically performed in simulated body fluid (SBF),
which is an aqueous solution whose composition of inorganic ions is almost equal
to blood plasma. This method is an easy way to evaluate the surface reactivity of a
material and if a layer of HCA is formed on the material surface, then the material is
considered as bioactive and can bond with the living tissue on implantation (Kokubo
and Takadama, 2006). The presence of silanol groups and the textural properties,
such as porosity and pore volume, seem to play a significant role in the formation of
the apatite layer on their surfaces (Cho et al., 1998, Pereira et al., 1995).
Presumably, the adsorption of PO43- by hydrogen bonding and Ca2+ ions on the
silica surface induce the precipitation of the apatite-like layer (Li et al., 1992,
Andersson and Karlsson, 1991). These bioglasses have been used to repair jaw
defects caused by periodontal disease or hard tissue replacement such as the
small bone in the middle ear (Rust et al., 1996). The main advantage of these
glasses is rapid connection to the tissue, however, there are some questions raised
regarding their slow degradation, the long term effects of silica in the body, and the

CHAPTER 1
28
poor mechanical properties that may limit the application of these glasses for bone
replacement purposes.
1.2.3. Bioresorbable materials
Different terms (e.g. degradable, resorbable, absorbable) are used to indicate that a
given material will gradually disappear after being introduced into a living organ and
is defined as a third generation of biomaterials. These materials react and dissolve
in the physiological fluid and can be replaced by bone and tissue cells over a
specific period of time (Vallet-Regi, 2001). Bioresorbable materials offer a potential
solution to complications such as tissue irritation and inflammation that may require
secondary surgery to remove the implant. The degradation rate of these materials
should not exceed the rate of tissue formation and to ensure a gradual stress
transfer from implant to tissue, the rate at which the implant weakens should be
matched with the increase in tissue strength. The newly replaced tissue is
completely biological and should have very similar properties to the surrounding
tissue.
A good bioresorbable material should have the following properties:
I. Dissolution rate matches with the regeneration rate of the damaged tissue
II. The interface between tissue and implant remains stable during the
regeneration
III. The break-down components are easily metabolised in the body
The use of polymers as bioresorbale materials has been extensively studied. One
of the earliest studies on bioresorbable materials was done by Kulkarni et al.
(Kulkarni et al., 1966) who studied the application of poly-L-lactic acid (PLLA) with

CHAPTER 1
29
the slow degradation rate in animals and no serious tissue reactions. Later, the use
of various bioresorbable materials such as polyglycolic acid (PGA) and polylactic
acid (PLA) led to materials with better biodegradation (Rokkanen et al., 2000).
However, the degradation of these polymer-based systems could result in polymer
fragments with heterogeneous chain-lengths that may lead to toxicity (Suuronen et
al., 2004).
Calcium phosphate ceramics are generally bioactive and have been widely used in
medicine as bone substitutes, maxillofacial reconstruction, dental implant coatings,
and orthopaedic prostheses. These ceramics show excellent biocompatibility
because of their chemical and structural similarities to the inorganic phase of
human bone, but only some of them are bioresorbable. Bioresorbability of these
ceramics depends on the composition, porosity, particle size, and preparation
condition. For example, pure hydroxyapatite sintered at high temperature is
minimally resorbabale, whereas, it is resorbable if sintered at lower temperatures
(900 C) (LeGeros, 2008). Tricalcium phosphate ceramics are also known as
bioresorbable materials with a greater dissolution rate in comparison to the
hydroxyapatite and are usually resorbed within one month of implantation (Suzuki
et al., 1997). These bioresorbable ceramics have been used clinically as a bone
filler to repair periodontal defects, augmentation, and have been formed into a
number of different geometries, to be used as a drug delivery system (Park, 2003,
Damien and Parsons, 1991). Phosphate-based glasses may also offer a great
potential for soft and hard tissue regeneration since they are bioresorbable with a
controllable solubility by altering their compositions (Franks et al., 2000, Knowles,
2003).

CHAPTER 1
30
1.2.3.1. Bioresorbable glasses
Phosphate-based glasses seem to be an attractive material for biomedical
applications since they are highly biocompatible with controllable degradation rate
and break-down components that can easily be metabolised in the body (Knowles,
2003, Kiani et al., 2012). Studies confirmed that these glasses show a controllable
degradation rate in aqueous medium (from a few days to several months) and can
be used when the implant is needed for a certain length of time (mostly short term
and non-load bearing applications) to promote healing or growth surrounding
damaged tissue or to enhance and promote tissue regeneration through the
delivery of cells and bone growth factors (Knowles, 2003, Navarro et al., 2003b).
The addition of metal oxides such as TiO2 and Fe2O3 to these glasses can increase
their durability to make them more applicable to be used as a third generation of
biomaterials in the field of tissue engineering (Knowles, 2003, Pickup et al., 2008b,
Ahmed et al., 2004a, Lakhkar et al., 2012).
1.3. Phosphate-based glasses
1.3.1. Structure
Phosphate-based glasses are inorganic polymers based upon the tetrahedral
phosphate anion, which is linked to form a three-dimensional network (Brow, 2000).
These glasses are formed of sp3 hybrid orbitals by the phosphorus outer electrons
(3s23p3). The fifth electron is promoted to the 3d orbital where strong molecular
bonding orbitals are obtained with oxygen 2p electrons, which is charge balanced
by polymerisation or the presence of metallic ions (Cruickshank, 1961). The
tetrahedra are classified using the Qi terminology originally devised for silicate-
based glasses, but has been applied to phosphates where (i) represents the

CHAPTER 1
31
number of bridging oxygen atoms per tetrahedron (Lippmaa et al., 1980, Abou Neel
et al., 2009).
The prevalence of any particular Qi species depends on the cation content of the
glass composition. If phosphorus pentoxide is heated without adding any cation
then the PO4 tetrahedra can be attached to a maximum of three neighbouring
tetrahedra forming a three-dimensional network (Q3 species) that is named
ultraphosphate (Navarro et al., 2003a, Jager et al., 2000). The Q3 species will be
the only phosphate group within highly cross-linked phosphate network. Adding
metal cations such as Li+, Na+, and K+ change the Q3 to Q2 species (Brow, 2000).
The positive charge for every phosphate anion, with theoretically infinite phosphate
chain lengths, and when the concentration of cations is equal to anions, only Q2
species are present and is named a meta-phosphate composition (Engelhar.G,
1972, Vanwazer and Holst, 1950, Martin, 1991). The addition of further cations will
form terminating Q1 species that decrease the possible chain length and when the
concentration of cations is twice the anions, only Q1 species dominate. As this
anion can only form on oxygen bridges, it is termed a chain terminator, producing
only phosphate dimers, or pyrophosphate, when it is the only species present and
increasing the amount of cations up to three times higher the number of anions
changes the Q1 to Q0 species and is denoted orthophosphate (Engelhar.G, 1972,
Vanwazer and Holst, 1950, Martin, 1991). Contamination with water can also cause
compositional anomalies when making phosphate glasses. Water has a similar role
to alkali oxides, which reduces the polymerisation by the formation of hydroxyl
groups (Brow et al., 1990). Figure 1.1 shows the schematic phosphate structure as
a function of composition.

CHAPTER 1
32
Figure 1.1. Schematic phosphate structure as a function of composition (Vanwazer
and Griffith, 1955).
1.3.2. Synthesis methods
1.3.2.1. Melt-quench
In the melt-quench method a mixture of oxide precursors is melted in a furnace at
temperatures of usually over 1000 ˚C (the exact melting temperature depends on
the glass composition) and amorphous solid can be obtained by rapid quenching of
the melt obtained by the fusion of one or more precursors (Lakhkar et al., 2011,
Abou Neel et al., 2009). When the cooling rate is sufficiently high to suppress
nucleation and crystal growth, the melt’s disordered state is maintained in the solid
state. To achieve a high cooling rate the melt is usually spread on a solid surface of
a high thermally conductive material like steel. Alternatively, the molten glass can
be poured into a preheated mould to form different shapes such as plates or rods.
In this case, the mould with the molten glass is placed in an annealing furnace and

CHAPTER 1
33
the glass is cooled down gradually to the room temperature to remove any residual
stress.
Since the main component in the phosphate-based glasses (phosphorus pentoxide)
is highly hygroscopic, the presence of small amounts of water can promote
crystallisation (Brow et al., 1990). To overcome this problem some proportion of
phosphorus can be added in the form of a stable oxides such as CaHPO4 or
NaH2PO4 and then adding any remaining minimal amount as pure P2O5 or melting
the glass in ampoules or covered crucibles. For instance, to synthesise ternary
P2O5-CaO-Na2O glass systems; P2O5, NaH2PO4, and CaCO3 powders can be used
as the sources of phosphorus, sodium and calcium. The solid mixture is melted for
0.5-2 hour in a Pt/Rh crucible in a range of 800-1550 ˚C depending on the
composition. The melt is then poured into a metal or graphite mould and annealed
to the room temperature from 350-500 ˚C with a cooling rate of 5-10 ˚C.min-1 to
remove any residual stresses (Franks et al., 2001, Abou Neel et al., 2009).
1.3.2.2. Sol-gel
The sol-gel method serves as a useful alternative (depending on the end
application) to the conventional melt-quench method and refers to a low-
temperature synthesis method by using chemical precursors in liquid form to
produce ceramics and glasses with high purity and homogeneity. The interest in
producing glasses via sol-gel routes has been increasing very rapidly since the
processing temperature is usually below the crystallisation temperature of the oxide
elements that allows for the production of novel glass compositions (Carta et al.,
2005). Another advantage of sol-gel synthesis over the other methods is the
tunable structure that allows control over the morphology, porosity, size, and the

CHAPTER 1
34
ability to modify the surface that is not achievable via the melt-quench route. Such
examples include spraying methods and spin casting as processing methods which
allow structures such as ultra-thin and uniform coatings to be achieved.
The main advantages of the sol-gel synthesis are;
I. High purity
II. Homogeneity
III. Low processing temperature that allows to incorporate different kinds of
inorganic, organic, and biomolecules during the formation of a gel matrix
IV. Low energy required in comparison with the melt-quench method
V. A variety of shapes and morphologies can be obtained
The sol-gel process occurs where one or many elements are used to form a sol
from which is obtained a homogeneous and amorphous gel solid by the transition
from a liquid sol to a solid gel (Gupta and Kumar, 2008). In this process, choosing
the right precursors, temperature of the precursor solutions, and appropriate ageing
time have been found to be critical processing factors (Hench and West, 1990). At a
very early stage of the development of sol-gel technology, the need for precursor
compounds that have high solubility in an organic solvent that can easily transform
into chemically reactive forms are essential. Studies have shown phosphoric acid
(H3PO4) cannot be used as a phosphorus precursor because it is too reactive and
leads to precipitation rather than gelation and more convenient precursors could be
obtained by dissolving P2O5 into alcohol solutions (Livage et al., 1992, Christensen
et al., 1990).
The interest in phosphate-based sol-gel materials has been increased by the
availability of PO(OH)3-x(OR)x (R=alkyl group) as a better phosphate precursor
choice (Noda et al., 1997). Tang et al. (Tang et al., 2005) successfully synthesised

CHAPTER 1
35
transparent titanophophate sol-gel derived glasses with high refractive index for
optical applications by using triethyl phosphate as a phosphorus precursor. In
another study by Carta et al. (Carta et al., 2005), quaternary phosphate-based
glasses in the P2O5-CaO-Na2O-SiO2 system with low silica content were
successfully prepared by using P2O5 dissolved in anhydrous ethanol. Following that
silicate free sol-gel glasses in the P2O5-CaO-Na2O system were successfully
synthesised for biomedical application purposes (Carta et al., 2007a, Lee et al.,
2013). The process of reacting from the liquid may allow these sol-gel derived
glasses to be drawn into fibres, micro/nano-sized glass spheres, or as a thin film on
a substrate. Low processing temperatures also have direct and positive implications
for biomedical applications, specifically in drug delivery systems that offer molecular
control over the incorporation of active biological ingredients such as antibiotics and
chemotherapeutic molecules into the glass structure (Pickup et al., 2012). A
comparison between sol-gel and melt-derived glasses with similar compositions
also appear to have similar structure and atomic correlations (Carta et al., 2007b).
1.3.2.2.1. Preparation of the sol
The first step involves the mix of components in the solution and consists of a
series of successive reactions. Generally, a sol is a colloidal suspension of solid
particles in a liquid and since the particles do not adhere to adjacent particles, each
particle remains completely dispersed (Zelinski and Uhlmann, 1984, Kendall and
Stainton, 2001). Sols are the simplest colloid dispersion and can be formed with
different kinds of structure depending on the suspension.
CHAPTER 1
36
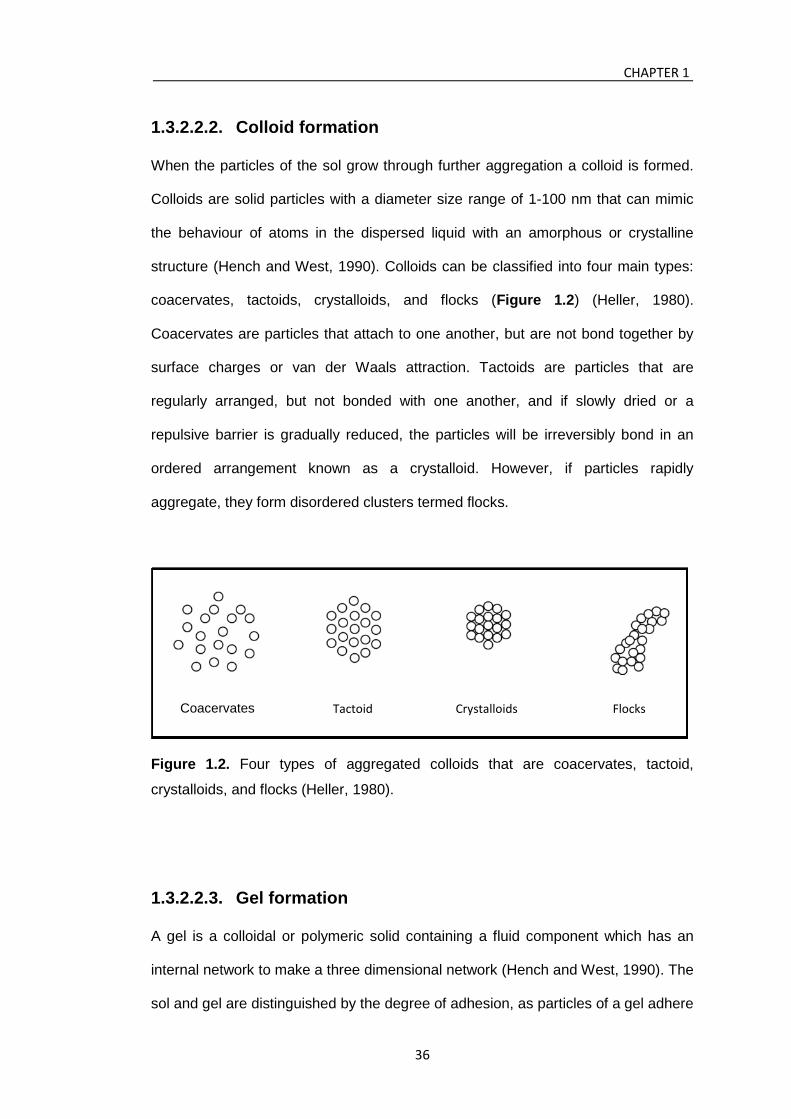
1.3.2.2.2. Colloid formation
When the particles of the sol grow through further aggregation a colloid is formed.
Colloids are solid particles with a diameter size range of 1-100 nm that can mimic
the behaviour of atoms in the dispersed liquid with an amorphous or crystalline
structure (Hench and West, 1990). Colloids can be classified into four main types:
coacervates, tactoids, crystalloids, and flocks (Figure 1.2) (Heller, 1980).
Coacervates are particles that attach to one another, but are not bond together by
surface charges or van der Waals attraction. Tactoids are particles that are
regularly arranged, but not bonded with one another, and if slowly dried or a
repulsive barrier is gradually reduced, the particles will be irreversibly bond in an
ordered arrangement known as a crystalloid. However, if particles rapidly
aggregate, they form disordered clusters termed flocks.
Figure 1.2. Four types of aggregated colloids that are coacervates, tactoid,
crystalloids, and flocks (Heller, 1980).
1.3.2.2.3. Gel formation
A gel is a colloidal or polymeric solid containing a fluid component which has an
internal network to make a three dimensional network (Hench and West, 1990). The
sol and gel are distinguished by the degree of adhesion, as particles of a gel adhere
Coacervates Tactoid Crystalloids Flocks

CHAPTER 1
37
strongly, whereas sol particles disperse discretely (Kendall and Stainton, 2001).
The high coordination number (the number of adhesive points with gel particles) of
a gel determines the gel structure and if it is strong enough, it does not crack when
the liquid is removed, but the gel may collapse when it is less well connected. The
strength of a gel depends on whether the bonding between the solid phase is
permanent or reversible, which depends on the mechanism of gelation. During
gelation, aggregated particles grow into clusters and then these clusters link
together to produce a gel. The gel point is identified as the moment when the last
bond is formed in the cluster that causes a sharp increase in the viscosity.
1.3.2.2.4. Ageing and drying
Ageing is essential to increase the strength of the gel against cracking. This can
occur during the drying stage (Hench and West, 1990). At this stage, more bond
formation occurs and polymer or particles continue to attach themselves and this
increases the interparticle necks and decreases the porosity. Shrinkage of the gel
occurs while the liquid is removed from the pores that can affect the strength of the
network and also plays an important role in the gel structure.
Drying can be divided into three main stages (Hench and West, 1990): In the first
stage, the reduction of gel volume is equal to the volume of evaporated liquid and
generally changes of structure such as volume, weight, and density occurs. The
second stage starts when the critical point is reached with highest capillary
pressure and the gel resists further shrinkage. Consequently, cracking is likely to
occur at this stage and because of the decreased rate of evaporation, it is called the
first falling rate period. In the third stage, the liquid ceases to flow to the surface and

CHAPTER 1
38
is removed only by diffusion of its vapour and is named the second falling rate
period.
1.3.2.2.5. Preparation of bulk sol-gel derived glasses
In the final heat treatment stage, the remaining solvent evaporates and a bulk glass
can be obtained. A bulk glass is defined here as a glass piece, the smallest
dimention of which is in the order of several millimeters or larger. The preparation of
bulk glasses from bulk gels dated back to several decades ago. Dislich (Dislich,
1971) prepared small pieces of transparent borosilicate glass via the sol-gel
method. Later, Yamane et al. (Yamane et al., 1979) reported the preparation of
large-size pieces of silica glasses. However, the preparation of large pieces of bulk
glasses is not an easy task and according to the author’s knowledge, there has
been no study on the preparation of bulk phosphate-based glasses via the sol-gel
method. Cracks and fracture are often generated when wet gels consisting of pores
filled with solvent, start drying. The reason for cracking during the drying stage is
related to the generation of a capillary pressure gradient in the liquid phase of the
gel. The difference in pressure leads to differential shrinkage of the gel network,
since the exterior of the gel usually contracts faster than the interior and this causes
cracking (Hench and West, 1990). The capillary force is expressed in Equation 1.1.
by Zarzycki et al. (Zarzycki et al., 1982):
∆ܲ =ସఊ�ୡ୭ୱఏ
(1.1)

CHAPTER 1
39
Where ∆ܲ is the capillary force, ߛ is the surface tension of the solvent, ߠ is the
contact angle between the capillary wall and the solvent and ܦ is the diameter of
the capillaries. To suppress capillary pressure, solvents with low surface tension
can be chosen in order to obtain bulk sol-gel derived glasses (Sakka et al., 1993).
Table 1.1 shows the surface tension and boiling points of various solvents (Sakka
et al., 1993).
Table 1.1. Surface tension and boiling points of various solvents.
Solvent Surface tension at 25 °C
(dyne. cm-1)
Boiling point
(°C)
Diethylether 17.1 334.6
Acetone 23.7 56.2
Dimethylformamide 36.8 153
2-methoxy ethnaol 42.8 125.5
Ethylene glycol 46.5 244.3
Water 72.8 100
1.3.3. Solubility and degradation rate of phosphate-
based glasses
As mentioned previously, phosphate-based glasses have the potential to dissolve
completely in an aqueous medium and offer real advantages for various biomedical
applications. A significant amount of work has been focused on ternary phosphate-
based glasses in the P2O5-CaO-Na2O system and it was found that the solubility of
these glasses is very sensitive to the glass composition (Bunker et al., 1984, Franks
et al., 2000, Ahmed et al., 2004c). The results confirmed that increasing CaO
content decreases the solubility, meanwhile, increasing Na2O content increases the

CHAPTER 1
40
solubility. Franks et al. (Franks et al., 2002) investigated the solubility of quaternary
glasses in the P2O5-CaO-MgO-Na2O system. In these quaternary glasses,
substituting MgO for CaO, reduced the solubility and even pH changes at longer
periods of time because of the smaller ionic radius of magnesium. Knowles et al.
(Knowles et al., 2001) developed quaternary phosphate-based glasses in the P2O5-
CaO-K2O-Na2O system and K2O was used as Na2O substitutes with the
concentration of 0 to 25 mol%. Solubility results showed an increase in solubility
with increasing K2O content because of the larger ionic radius of potassium in
comparison to sodium that causes a larger disrupting effect on the structure and
weakens the network. Navarro et al. (Navarro et al., 2003a, Navarro et al., 2003b)
investigated quaternary glasses in the P2O5-CaO-Na2O-TiO2 system. Results
showed the solubility was greatly decreased as the titanium content increased,
even with the incorporation of only 3 mol% TiO2. Environmental scanning electron
microscopy (ESEM) experiments also revealed much higher surface degradation
occurred for the glasses with 0 mol% TiO2. In other studies, sodium oxide was
partially replaced by Fe2O3 that resulted in lower dissolution rates (Ahmed et al.,
2004a, Lin et al., 1994). The decrease in solubility was attributed to the strong
cross-linking effects of the titanium and iron ions and replacement of P-O-P bonds
in the glass by Ti-O-P and Fe-O-P bonds.
It should be noted that all the above solubility and degradation studies were done
on phosphate-based glasses obtained by the traditional melt-quench technique and
to date, there has been no study performed on the degradation of phosphate-based
glasses obtained by the sol-gel technique. The reasons can be related to the limited
research regarding synthesis and also the limitation in preparing bulk phosphate-
based glasses.

CHAPTER 1
41
1.4. Biomaterial applications
1.4.1. Orthopaedics
Biomaterials can be a good alternative for tissue replacement and nowadays almost
every part of the body can be assisted by synthetic implants. It has been calculated
that around 20 million people have an implanted medical device which costs more
than 8% of the total health care budget worldwide (Lysaght and O'Loughlin, 2000).
To take the case of bone, approximately 2.2 million bone graft procedures are
performed worldwide at a cost of around $2.5 billion each year (Giannoudis et al.,
2005). Implantable biomaterials were the main focus of attention in orthopaedics
that includes the anatomical replacement of parts of the body. For example the
diseased hip joint has been replaced with a simple ball and socket device (usually
metal-on-plastic) designed to reduce wear and inflammatory responses (Charnley,
1982 1976). The main attention for orthopaedic devices has been focused on
various calcium-phosphate bioceramics, such as hydroxyapatite and tricalcium
phosphate ceramics, because they show a degree of chemical similarity to the
apatite phase of bone itself. However, they have poor mechanical properties that
severely restrict their applications in orthopaedics. Meanwhile, these bioceramics
can be excellent candidates for coating medical implants, usually metallic
prosthesis, that result in a combination of both bioactivity of the bioceramics and
good mechanical properties of the metals. These bioceramics are osteoconductive
and bond directly to the bone. Also, they have been used to fill small bone defects,
guide the bone growth and bond firmly to the bone.
CHAPTER 1
42
1.4.2. Tissue engineering
The demand of patients who need to replace damaged hard or soft tissues is
continuously increasing and we know that natural tissue does not behave like, or
even look like a combination of ceramic, metal, and polymer. Although autograft (a
tissue graft transferred from one part of the patient’s body to another part) is
preferable, supply is limited and lacks mechanical integrity. Alternative sources of
tissue can be obtained from other humans (allograft) or animals (xenograft). These
resolve the difficulties of supply, however, there is an increased risk of
immunological rejection and disease transmission.
Development of a new and more efficient biomaterial to regenerate new tissue is a
human challenge as it can have a great effect on everyday life of people worldwide.
An effective approach can be growing specific cells from a patient on a three-
dimensional scaffold under controlled culture conditions (Langer and Vacanti,
1993). As an example, bone has a considerable ability to regenerate following injury
and highly porous-three dimensional scaffolds are needed to accommodate cells
and guide them to regenerate the bone that may be indistinguishable from the
normal healthy bone. A desirable strategy to repair bone tissue, is to induce
osteogenesis in situ. Stem cells can be utilised to differentiate to form bone tissue,
and seed those cells into an injectable scaffold, resulting in bone tissue formation
(Dvir et al., 2011). Alternatively the implant can be implanted in direct contact with
the cells with the purpose to stimulate and to direct tissue formation (Suchanek and
Yoshimura, 1998). The ideal scaffold should have appropriate mechanical
properties, controllable degradation, high bioactivity, and the ability to deliver cells
for tissue regeneration (Hench and Polak, 2002, Jones and Boccaccini, 2005). It
should also be conductive to supply oxygen, nutrient, and biomolecules to the
growing cells to regenerate new tissues (Williams, 2004). Figure 1.3 shows the

CHAPTER 1
43
general tissue engineering concept of using biodegradable scaffolds to promote the
reorganisation of the cells to form a functional tissue (Dvir et al., 2011).
Figure 1.3. Tissue engineering concept includes; (a) isolating patients’ cells, (b) in
vitro cultivation of cells on a two-dimensional surface, (c) seeding cells on a porous
scaffold and adding growth factors, small molecules and etc., (d) further cell
cultivation in bioreactor, and (e) transplantation of the engineered tissue (Dvir et al.,
2011).

CHAPTER 1
44
Bioceramics are one of the most promising scaffold materials in bone tissue
engineering. Hydroxyapatite (HA) exhibits excellent biocompatibility due to its close
chemical and crystal resemblance to the mineral phase of bone. However, the lack
of biodegradation of HA in the body is generally undesirable and limits its potential
tissue engineering applications (Marcacci et al., 2007).
Bioactive silicate-based glasses can be a good choice with a long history of
applications as biomedical implants (Hench, 1998). However, they should be
synthesised in a way to be resorbable, with high interconnected porous structure in
three-dimensions. It has been also found that 45S5 Bioglass® can partially
crystallise when heated up to high temperature (around 950 °C) during scaffold
fabrication which increases the mechanical property of the glass and the crystalline
phase can transform to a biodegradable, amorphous calcium phosphate in a
biological environment (Boccaccini et al., 2007, Chen et al., 2006). However, the
long term effect of silica in the body is still unknown and the degradation rate of
these bioglasses is very slow in comparison to biological tissues and often takes 1–
2 years to fully dissolve (Lenza et al., 2002, Tadjoedin et al., 2002, Hamadouche et
al., 2001). This may limit their potential application as scaffolds for tissue
regeneration, which benefit from having a similar degradation rate to the host
tissue.
Phosphate-based glasses seem to be an attractive choice with a more controllable
degradation rate for tissue engineering applications, in which the presence of a
scaffold is only required to support cells/tissue in the short term (Knowles, 2003,
Ahmed et al., 2004a). The degradation rate of phosphate glasses which is typically
relatively rapid, can be easily altered via addition of various modifier oxides, such
as calcium oxide (CaO) and sodium oxide (Na2O). This enables the design of
materials that release ions such as Ca2+and Na+, which can stimulate cellular

CHAPTER 1
45
behaviours such as cell proliferation and bone formation (Knowles, 2003, Navarro
et al., 2003b, Franks et al., 2000). The degradation rate of phosphate-based
glasses can also be prolonged by the addition of other oxide elements such as
titanium dioxide (TiO2), which forms stable Ti-O based cross-links in the phosphate
network (Kiani et al., 2012).
1.4.3. Drug delivery
Conventional drug delivery modes such as injection of a dose or taking a pill, exhibit
some drawbacks such as, when it is taken, the drug concentration in blood rises
dramatically up to a peak, which is generally at a toxic level and then rapidly
declines to below the minimum effective drug level. Also, specialised drugs to treat
specific diseases, can injure other tissues (Xue and Shi, 2004). Drug delivery is a
technique of designing a system to release a drug over a specific period of time in a
controlled manner. Controlled drug delivery has several advantages in comparison
with conventional dosage methods which includes; improving efficiency, continuous
action, targeting specific diseased cells, and reduce patient toxicity (Vallet-Regi et
al., 2007, Pickup et al., 2012). Designing a carrier system for drug delivery
applications is quite challenging in terms of targeting the drug to a specific site and
continuous release over a specific period of time. Several studies have been
focused on drug delivery systems to provide enhanced efficacy, higher stability,
solubility, and administer at much lower dosage of drugs (E-Sherbiny and Smyth,
2010, Xue and Shi, 2004).
Drug delivery carriers have the potential to deliver low-molecular-weight drugs, as
well as large bio macromolecules such as genes and proteins, either in a localised
or a targeted manner. Many newly designed drugs based on biomolecules such as
proteins, peptides, and DNA are chemically very unstable or sensitive and therefore

CHAPTER 1
46
encapsulating these biomolecules seems to be essential to deliver them to the
diseased tissue. The drug delivery carriers should be non-toxic, non-immunogenic,
and preferably biodegradable to deliver the therapeutic agent to the proper site of
action.
In recent years, several drug delivery systems such as micelles, dendrimers,
liposomes, emulsions, and porous materials have been developed to improve the
efficiency of drugs and minimize their toxic side effects (Benita and Lambert, 2004,
Manzano and Vallet-Regi, 2010, Torchilin, 2005). The size of the carrier is also an
important variable that determines how it can be applied to the body and
development of novel processing to prepare size-controllable carriers with high
encapsulation efficiency, is a major challenge in drug delivery systems (Vallet-Regi
and Ruiz-Hernandez, 2011).
1.4.3.1. Therapeutic nanoparticles
Nanotechnology has provided new avenues for engineering biomaterials that can
revolutionise health care in therapeutic technologies. Significant evidence exists
that highlights the promise nanotechnology has for biological applications,
particularly in drug delivery systems. Nanotechnology has accelerated the
development of novel drug delivery systems for strict control over the temporal
release of a drug (LaVan et al., 2002). It may also provide an ideal solution and
promote a new concept of chemotherapy; that may include sustained, controlled,
and targeted chemotherapy. The drug can be either physically dispersed in
nanoparticle matrices or surrounded by a vesicle like membrane.
The size of nanoparticles has an important effect on its interaction with its
environment. Nanoparticles can accumulate in the tumour tissue with the upper limit

CHAPTER 1
47
of approximately 400 nm to allow diffusion through the tumour (Alexis et al., 2008,
Yuan et al., 1995). They must also be larger than 10 nm in diameter to avoid
clearance by first renal filtration pass (Davis et al., 2008). Also, targeting is
especially relevant in the context of cancer therapies, since most of the commonly
used anticancer drugs have several side-effects due to nonspecific action on
healthy cells (Qian et al., 2012). Nanoparticles can be taken up by cells that mean
the potential for cell targeting is widely applicable.
Various types of nanocarriers for cancer chemotherapy to deliver concentrated drug
payloads to the diseased tissue have been developed and have the potential to
drastically improve the way cancer is treated (Strebhardt and Ullrich, 2008, Peer et
al., 2007). Commonly used nanocarriers include but are not limited to; polymeric
nanoparticles, carbon nanotubes, lipid-based nanocarriers, gold nanoparticles, and
silica-based nanoparticles. The primary goals in designing these nanoparticles are
to control the particle size, surface property, and release of drug at the
therapeutically optimal rate and dose regimen. Polymeric nanoparticles have been
used for drug delivery research to increase the therapeutic benefits, while
minimizing side effects. Polymeric nanoparticles such as poly lactic-acid (PLA) and
poly lactide co-glycolides have been used as drug delivery carriers, because of their
good biodegradability and low toxicity (Reddy, 2005). Solvent evaporation is a
common technique used to prepare biodegradable nanoparticles from poly lactic
acid (PLA), poly (D,L-glycolide) (PLG), and poly cyanoacrylate (PCA). The
electrospraying technique has been considered as promising technique for
nanoparticle synthesis because it is a simple and cost effective method to prepare
particles in a controlled way, with a specific size and narrow distribution and has
been used to encapsulate drug molecules into biodegradable polymers such as
poly (ε-caprolactone) PCL for controlled drug delivery devices (Ding et al., 2005).

CHAPTER 1
48
Bioceramics have been the subject of intense interest for drug delivery applications.
Kortesuo et al. (Kortesuo et al., 2000) reported a sustained release of toremifene
citrate from implanted silica glass discs with no tissue irritation at the site of the
implantation over 42 days. Grun et al. (Grun et al., 1997) developed mono-
dispersed mesoporous silica microspheres based on the Stöber reaction for drug
delivery applications. Following that mesoporous silica nanospheres (MSNs) with
narrow size distribution were successfully synthesised by fine-tuning the reaction
conditions and using surfactants (Unger et al., 2000, Kosuge and Singh, 2001).
MSNs have the ability to encapsulate different kinds of therapeutic agent within
their pore channels and protect them from enzymatic degradation. The drug
molecules are usually incorporated through adsorption and the uptake capacities of
MSNs are correlated to the specific surface area and the pore size of the material
(Andersson et al., 2004). In order to minimize premature release and control the
drug delivery at the targeted site, the pores can be mechanically blocked with
polymers and nanocrystals or chemical bonds directly over the opening pores (Mal
et al., 2003, Fu et al., 2003, Vivero-Escoto et al., 2010). Cancer cells could also be
targeted by surface functionalisation of MSNs with specific ligands (Wang et al.,
2010). However, it was confirmed that intravenous or intraperitoneal injection into
mice at high doses appear to be lethal and toxic that can be related to deformation
of the red blood cells and eventually hemolysis (Zhao et al., 2011). Another study
on intravenous injection of MSNs with different particle sizes into mice at lower
doses confirmed that the MSNs were mainly located in the liver and spleen and
could degrade gradually up to after 1 month of injection (He et al., 2011).
Phosphate-based glasses can be a useful alternative, since studies on these
glasses showed a linear dissolution rate in an aqueous medium with the
degradation products that can be easily metabolised in the body (Bitar et al., 2004,
Knowles, 2003). A few studies show these glasses can be synthesised at low

CHAPTER 1
49
temperature and have significant potential as a carrier in a drug delivery system
(Pickup et al., 2012, Lee et al., 2013). However, the slow synthesis reactions and
the difficulty to tailor the shape of these glasses may limit their potential drug
delivery applications.
1.4.4. Diagnostic contrast agents
Detection of a disease at an early stage is a critical issue in medicine and the
earlier it is diagnosed, the better is the chance for a successful treatment. Many
diagnostic imaging techniques are currently available such as X-ray, ultrasound
imaging, positron emission tomography, and magnetic resonance imaging.
Molecular imaging techniques have also proven to be of great value for cancer,
cardiovascular diseases, and neurological disorders (Weissleder and Mahmood,
2001). The resolution can be enhanced by using specific contrast agents for
different imaging techniques. However, to diagnose a disease successfully, a
combination of these techniques may be applied together and development of
multimodal probes that can be detected by different imaging techniques has been
considered to improve imaging instruments for diagnosis applications (Lim et al.,
2010).
1.4.4.1. Diagnostic nanoparticles
The current progress of nanotechnology has the potential to improve detection in
diagnostic imaging and targeting specific disease areas compared to conventional
contrast agents. Nano-size particles can carry more than two imaging agents to
provide more detailed information on the target site (Jennings and Long, 2009).

CHAPTER 1
50
Silica-based nanoparticles are the most commonly used materials for multimodal
imaging. For example, optical imaging probes like dye doped silica nanoparticles
can be coupled with MRI contrast agents that are ferromagnetic nanoparticles
(Malvindi et al., 2011, Jokerst et al., 2013). Silica nanoparticles also have good
accustic backscatter properties and can be used as a contrast agent for ultrasound
molecular imaging (Jokerst et al., 2013, Liberman et al., 2013).
In medical diagnostics, there is a great potential to monitor biological molecules of
interest, while, delivering therapeutic agents with nanoscale materials. These
nanomaterials called “theranostic” and have the potential to serve dual roles as
diagnostic and therapeutic agents (Janib et al., 2010). This concept moves us
closer to personalised medicine where therapies are directed towards an individual
patient and detected by the physician by an integrated imaging agent. Silica-based
nanoparticles can be promising candidates for theranostic applications. Studies on
MSNs showed the ability to encapsulate magnetic nanoparticles and drug
molecules within the silica matrices for imaging and targeting drug delivery
applications (Ruiz-Hernandez et al., 2007). Moreover, they have the potential to be
used as a contrast agent for molecular imaging and luminescent molecules such as
organic dyes can be encapsulated for biological assays (Sharma et al., 2006).
Recently, Lu et al. (Lu et al., 2010) synthesised MSN-based theranostic particles
containing luminescent molecules and an anticancer therapeutic agent that can
suppress tumour growth in mice. Phosphate-based glasses can also be a good
choice with a controllable degradation rate, however, according to the author’s
knowledge, there has been no study on the potential diagnostic applications of
these glasses, which might be related to the difficulty of tailoring their structure.

CHAPTER 1
51
1.5. Potential biomedical applications of phosphate-
based glass systems
1.5.1. Binary P2O5-TiO2 glasses
The addition of TiO2 to phosphate glasses can stabilise the phosphate network,
since Ti4+ ion has a small ionic radius and a large electrical charge that can
penetrate into the phosphate network (Kiani et al., 2012). Thus, the bonding
between different chains can become stronger and the vitreous network will be
fortified. When titanium with its high charge/diameter ratio (6.1) is incorporated into
the phosphate network, it can easily attract oxygen from the PO4 tetrahedron and
create Ti-O-P bonds (Brauer et al., 2010). Other studies confirmed that TiO2
improves the glass forming ability, chemical durability, modulus of elasticity and
raises the glass viscosity, which was shown by an increase in the glass transition
temperature (Tg), and consequently strengthens the glass network (Navarro et al.,
2003a, Lee and Hsu, 1999). In addition, the Ti4+ cation has been investigated
extensively for killing or growth inhibition of bacteria when it is combined with UV
light (Jacoby et al., 1998, Linkous et al., 2000, Sunada et al., 2003).
Binary P2O5-TiO2 (PT) glasses were produced by the conventional melt-quench
method at a relatively high melting temperature (range of 1300-1500 °C) and were
usually coloured deep purple because of the remaining Ti3+ ions in the glass
network (Hashimoto et al., 2012). Synthesis of binary P2O5-TiO2 glass systems via
a sol-gel route allowed the preparation of glassy thin films for a variety of
applications such as humidity sensors and proton conducting materials (Makita et
al., 1997b, Makita et al., 1997a). However, according to the previous studies on the
sol-gel preparation of these glasses, high heat treatment temperatures were applied

CHAPTER 1
52
in order to remove solvents and other organic molecules that may limit their
potential biomedical application (Pickup et al., 2008b).
1.5.2. Ternary P2O5-CaO-TiO2 glasses
The addition of CaO to binary P2O5-TiO2 glasses can make these glasses more
suitable for various biomedical applications with the release of Ca2+ ions that can
stimulate cell proliferation (Navarro et al., 2003b). Ternary glasses in the P2O5-
CaO-TiO2 (PCT) system are bioresorbable and can host human bone derived cells
and enzyme delivery devices. Titanium reduces the dissolution rate of these
glasses and can also cause significant gene up regulation (Abou Neel et al., 2007,
Knabe et al., 2004, Ribeiro et al., 2004). These glasses are defined as materials
that can react and dissolve over time in physiological fluid and can be replaced by
regeneration of hard or soft tissues. The replaced tissue may have a similar
properties to the original surrounding tissues.
Ternary PCT glasses have been prepared via melt-quench methods previously,
however, preparation of these glasses via the sol-gel method have some significant
advantages in comparison with the melt-quench method. The low-temperature
nature of the sol-gel method can offer the potential to use these glasses as a carrier
in drug delivery systems and also biocompatible glassy films can be prepared for
coating biomedical implants. Recently, Pickup et al. (Pickup et al., 2008a)
successfully synthesised sol-gel derived (P2O5)0.50-(TiO2)0.25-(CaO)0.25 glass
composition. However, according to the author’s knowledge, there are no other
studies on sol-gel preparation of glasses with related compositions to those
described above.
CHAPTER 1
53
1.5.3. Ternary P2O5-CaO-Na2O glasses
Ternary P2O5-CaO-Na2O (PCN) glasses have a near linear dissolution rate in
aqueous media and the degradation rate can be finely tuned through subtle
variations in composition (Franks et al., 2000, Knowles, 2003). These glasses have
a high degradation rate and can be used for biomedical applications such as
imaging contrast agents and drug delivery systems. Their biocompatibility may also
offer numerous advantages over the current polymer-based systems where their
degradation can result in polymer fragments with heterogeneous chain-lengths that
could lead to toxicity (Vemula et al., 2009). However, these ternary glasses are too
soluble for cell attachment and proliferation in tissue engineering applications
(Ahmed et al., 2004b).
For several years, these glasses have been used for the controlled release of ions
(Driver and Telfer, 1988), however, few studies have been carried out on the
synthesis of these glasses via the sol-gel route and even fewer on the potential
drug delivery applications of these glasses. The reasons can be related to the high
synthesis temperature and complicated morphological trait (Carta et al., 2009).
Recently, Pickup et al. (Pickup et al., 2012) showed these materials can be
synthesised at lower temperatures with the sustained release of the drug within a
week. The results suggested the potential drug delivery applications of these
materials and a focus on these materials would be of interest.
1.5.4. Quaternary P2O5-CaO-Na2O-TiO2 glasses
Quaternary phosphate-based glasses of the general formula P2O5-CaO-Na2O-TiO2
(PCNT) synthesised via the melt-quench route, have shown a variety of interesting
properties which make them suitable for various biomedical applications (Navarro et

CHAPTER 1
54
al., 2003b, Navarro et al., 2002, Ribeiro et al., 2004). Studies on these glasses
confirmed that the addition of titania to the P2O5-CaO-Na2O glass systems can
improve glass-forming ability and chemical durability of these glasses (Navarro et
al., 2003a, Kishioka et al., 1974). Moreover, it was shown that the incorporation of
TiO2 into phosphate-based glasses not only decreases the solubility of these
glasses, but also decreases the crystallisation tendency by the formation of cross
links between TiO4 and TiO6 structural groups and phosphate tetrahedra (Brauer et
al., 2007). In another study, quaternary phosphate-based glasses in the P2O5-CaO-
Na2O-TiO2 system with up to 15 mol% TiO2 were successfully produced via the
melt-quench route and have shown that TiO2 can increase the bulk density of the
glass (Abou Neel et al., 2008). The degradation rate of these quaternary glasses
can be increased by substituting Na2O for TiO2 (Navarro et al., 2005, Navarro et al.,
2003b, Kiani et al., 2012). Because of the controllable degradation rate of these
glasses, they have the potential to be used as a scaffold for tissue regeneration, or
as a host matrix for embedding pharmaceutical molecules that could be useful in
clinical practice (Kiani et al., 2012, Vallet-Regi et al., 2007). Recently, Lakhkar et al.
(Lakhkar et al., 2012) reported the application of the melt-derived titanium-stabilised
phosphate-based glass microspheres with the ability to provide a stable surface for
cell attachment, growth, and proliferation as a scaffold for tissue engineering.
However, high synthesis temperatures, low surface area, and very small porosity of
these glasses may limit their potential applications as a scaffold in tissue
engineering.
Sol-gel synthesis of these PCNT glasses can be a good alternative due to the low
synthesis temperature in comparison with the melt-quench method. The low
processing temperature of the sol-gel synthesis leads to the opportunity to
incorporate bioactive molecules for drug delivery application, along with the ease of

CHAPTER 1
55
releasing homogeneous mixing of the reactants that gives high quality amorphous
glassy-like materials (Makita et al., 1997a, Pickup et al., 2008b). For their potential
tissue regeneration applications high specific surface area and more porosity would
be expected for the synthesised glasses via the sol-gel method, that could lead to
increase their bioactivity compare to those obtained by the melt-quench method
with the same composition (Perez-Pariente et al., 2000, Vallet-Regi et al., 2000). In
addition, since the sol-gel process starts with the liquid form of precursors, there is
a possibility to produce nano/micrometer sized particles. However, there has been
no study on the sol-gel synthesis of the PCNT glasses for potential biomedical
applications.

CHAPTER 1
56
References
ABOU NEEL, E. A., CHRZANOWSKI, W. & KNOWLES, J. C. 2008. Effect of
increasing titanium dioxide content on bulk and surface properties of
phosphate-based glasses. Acta Biomaterialia, 4, 523-534.
ABOU NEEL, E. A., MIZOGUCHI, T., ITO, M., BITAR, M., SALIH, V. & KNOWLES,
J. C. 2007. In vitro bioactivity and gene expression by cells cultured on
titanium dioxide doped phosphate-based glasses. Biomaterials, 28, 2967-
2977.
ABOU NEEL, E. A., PICKUP, D. M., VALAPPIL, S. P., NEWPORT, R. J. &
KNOWLES, J. C. 2009. Bioactive functional materials: a perspective on
phosphate-based glasses. Journal of Materials Chemistry, 19, 690-701.
AHMED, I., COLLINS, C. A., LEWIS, M. P., OLSEN, I. & KNOWLES, J. C. 2004a.
Processing, characterisation and biocompatibility of iron-phosphate glass
fibres for tissue engineering. Biomaterials, 25, 3223-3232.
AHMED, I., LEWIS, M., OLSEN, I. & KNOWLES, J. C. 2004b. Phosphate glasses
for tissue engineering: Part 1. Processing and characterisation of a ternary-
based P(2)O(5)-CaO-Na(2)O glass system. Biomaterials, 25, 491-499.
AHMED, I., LEWIS, M., OLSEN, I. & KNOWLES, J. C. 2004c. Phosphate glasses
for tissue engineering: Part 2. Processing and characterisation of a ternary-
based P(2)O(5)-CaO-Na(2)O glass fibre system. Biomaterials, 25, 501-507.
ALEXIS, F., RHEE, J. W., RICHIE, J. P., RADOVIC-MORENO, A. F., LANGER, R.
& FAROKHZAD, O. C. 2008. New frontiers in nanotechnology for cancer
treatment. Urologic Oncology-Seminars and Original Investigations, 26, 74-
85.
ANDERSSON, J., ROSENHOLM, J., AREVA, S. & LINDEN, M. 2004. Influences of
material characteristics on ibuprofen drug loading and release profiles from
ordered micro- and mesoporous silica matrices. Chemistry of Materials, 16,
4160-4167.
ANDERSSON, O. H. & KARLSSON, K. H. 1991. On the Bioactivity of Silicate
Glass. Journal of Non-Crystalline Solids, 129, 145-151.
BEN-NISSAN, B. 2004. Nanocoated converted coral meets high structural strength
requirement for load-bearing bone graft applications. Mrs Bulletin, 29, 611-
611.

CHAPTER 1
57
BENITA, S. & LAMBERT, G. 2004. Ocular drug delivery by cationic emulsions.
Isopt: Proceedings of the 5th International Symposium on Ocular
Pharmacology and Therapeutics, Monte Carlo, Monaco, 7-13.
BITAR, M., SALIH, V., MUDERA, V., KNOWLES, J. C. & LEWIS, M. P. 2004.
Soluble phosphate glasses: in vitro studies using human cells of hard and
soft tissue origin. Biomaterials, 25, 2283-2292.
BOCCACCINI, A. R., CHEN, Q., LEFEBVRE, L., GREMILLARD, L. & CHEVALIER,
J. 2007. Sintering, crystallisation and biodegradation behaviour of Bioglass
(R)-derived glass-ceramics. Faraday Discussions, 136, 27-44.
BRAUER, D. S., KARPUKHINA, N., LAW, R. V. & HILL, R. G. 2010. Effect of TiO2
addition on structure, solubility and crystallisation of phosphate invert
glasses for biomedical applications. Journal of Non-Crystalline Solids, 356,
2626-2633.
BRAUER, D. S., RUSSEL, C. & KRAFT, J. 2007. Solubility of glasses in the system
P2O5-CaO-MgO-Na2O-TiO2: Experimental and modeling using artificial
neural networks. Journal of Non-Crystalline Solids, 353, 263-270.
BROW, R. K. 2000. Review: the structure of simple phosphate glasses. Journal of
Non-Crystalline Solids, 263, 1-28.
BROW, R. K., KIRKPATRICK, R. J. & TURNER, G. L. 1990. The Short-Range
Structure of Sodium-Phosphate Glasses .1. Mas Nmr-Studies. Journal of
Non-Crystalline Solids, 116, 39-45.
BUNKER, B. C., ARNOLD, G. W. & WILDER, J. A. 1984. Phosphate-Glass
Dissolution in Aqueous-Solutions. Journal of Non-Crystalline Solids, 64,
291-316.
CARLISLE, E. M. 1970. Silicon . A Possible Factor in Bone Calcification. Science,
167, 279-280.
CARTA, D., KNOWLES, J. C., GUERRY, P., SMITH, M. E. & NEWPORT, R. J.
2009. Sol-gel synthesis and structural characterisation of P2O5-B2O3-Na2O
glasses for biomedical applications. Journal of Materials Chemistry, 19, 150-
158.
CARTA, D., KNOWLES, J. C., GUERRY, P., SMITH, M. E. & NEWPORT, R. J.
2010. SOL-GEL AND MELT-QUENCHED BOROPHOSPHATE GLASSES
FOR BIOMEDICAL APPLICATIONS, Handbook of Borates: Chemistry,
Production and Applications, Nova Science Publishers, Inc.

CHAPTER 1
58
CARTA, D., KNOWLES, J. C., SMITH, M. E. & NEWPORT, R. J. 2007a. Synthesis
and structural characterization of P(2)O(5)-CaO-Na(2)O sol-gel materials.
Journal of Non-Crystalline Solids, 353, 1141-1149.
CARTA, D., PICKUP, D. M., KNOWLES, J. C., AHMED, I., SMITH, M. E. &
NEWPORT, R. J. 2007b. A structural study of sol-gel and melt-quenched
phosphate-based glasses. Journal of Non-Crystalline Solids, 353, 1759-
1765.
CARTA, D., PICKUP, D. M., KNOWLES, J. C., SMITH, M. E. & NEWPORT, R. J.
2005. Sol-gel synthesis of the P(2)O(5)-CaO-Na(2)O-SiO(2) system as a
novel bioresorbable glass. Journal of Materials Chemistry, 15, 2134-2140.
CHAI, F., RAOUL, G., WISS, A., FERRI, J. & HILDEBRAND, H. F. 2011.
Biomaterials as bone substitute: Classification and contribution. Revue De
Stomatologie Et De Chirurgie Maxillo-Faciale, 112, 212-221.
CHARNLEY, J. 1976. Long-Term Wear Studies of High-Density Polyethylene in
Total Hip-Replacement. Journal of Bone and Joint Surgery-British Volume,
58, 390-390.
CHARNLEY, J. 1982. Evolution of Total Hip-Replacement. Annales Chirurgiae Et
Gynaecologiae, 71, 103-107.
CHEN, Q. Z. Z., THOMPSON, I. D. & BOCCACCINI, A. R. 2006. 45S5 Bioglass
(R)-derived glass-ceramic scaffolds for bone tissue engineering.
Biomaterials, 27, 2414-2425.
CHO, S. B., MIYAJI, F., KOKUBO, T., NAKANISHI, K., SOGA, N. & NAKAMURA,
T. 1998. Apatite formation on silica gel in simulated body fluid: effects of
structural modification with solvent-exchange. Journal of Materials Science-
Materials in Medicine, 9, 279-284.
CHRISTENSEN, E., VONBARNER, J. H., ENGELL, J. & BJERRUM, N. J. 1990.
Preparation of Cuzr2p3o12 from Alkoxide-Derived Gels - Phase Formation
as a Function of Heat-Treatment. Journal of Materials Science, 25, 4060-
4065.
COOK, J. L., WILLIAMS, N., KREEGER, J. M., PEACOCK, J. T. & TOMLINSON, J.
L. 2003. Biocompatibility of three-dimensional chondrocyte grafts in large
tibial defects of rabbits. American Journal of Veterinary Research, 64, 12-
20.
CRUICKSHANK, D. 1961. Role of 3d-Orbitals in Pi-Bonds Between .A. Siicon,
Phosphorus, Sulphur, or Chlorine And .B. Oxygen or Nitrogen. Journal of
the Chemical Society, 5486-5504.

CHAPTER 1
59
DAMIEN, C. J. & PARSONS, J. R. 1991. Bone-Graft and Bone-Graft Substitutes - a
Review of Current Technology and Applications. Journal of Applied
Biomaterials, 2, 187-208.
DAVIS, M. E., CHEN, Z. & SHIN, D. M. 2008. Nanoparticle therapeutics: an
emerging treatment modality for cancer. Nature Reviews Drug Discovery, 7,
771-782.
DING, L., LEE, T. & WANG, C. H. 2005. Fabrication of monodispersed Taxol-
loaded particles using electrohydrodynamic atomization. Journal of
Controlled Release, 102, 395-413.
DISLICH, H. 1971. Preparation of Multicomponent Oxide Glasses by
Polycondensation. Angewandte Chemie-International Edition, 10, 825-&.
DRIVER, P. M. & TELFER, S. B. 1988. An Assessment of the Performance of a
New Formulation of Soluble Phosphate-Glass Bolus on the Copper and
Selenium Status of Scottish Blackface Ewes. Animal Production, 46, 491-
491.
DVIR, T., TIMKO, B. P., KOHANE, D. S. & LANGER, R. 2011. Nanotechnological
strategies for engineering complex tissues. Nature Nanotechnology, 6, 13-
22.
E-SHERBINY, I. M. & SMYTH, H. D. C. 2010. Biodegradable nano-micro carrier
systems for sustained pulmonary drug delivery: (I) Self-assembled
nanoparticles encapsulated in respirable/swellable semi-IPN microspheres.
International Journal of Pharmaceutics, 395, 132-141.
ENGELHAR.G 1972. Bond Properties of Silylphosphine, Germylphosphine and
Stannylphosphine on Basis of Their P-31 Nmr Shifts and Their Interpretation
Using Letcher-Van-Wazer Theory. Zeitschrift Fur Anorganische Und
Allgemeine Chemie, 387, 52-54.
FOROUTAN, F., JOKERST, J. V., GAMBHIR, S. S., VERMESH, O., KIM, H.-W. &
KNOWLES, J. C. 2015. Sol–Gel Synthesis and Electrospraying of
Biodegradable (P2O5)55–(CaO)30–(Na2O)15 Glass Nanospheres as a
Transient Contrast Agent for Ultrasound Stem Cell Imaging. Acs Nano, 9,
1868-1877.
FRANKS, K., ABRAHAMS, I., GEORGIOU, G. & KNOWLES, J. C. 2001.
Investigation of thermal parameters and crystallisation in a ternary CaO-
Na(2)O-P(2)O(5)-based glass system. Biomaterials, 22, 497-501.

CHAPTER 1
60
FRANKS, K., ABRAHAMS, I. & KNOWLES, J. C. 2000. Development of soluble
glasses for biomedical use Part I: In vitro solubility measurement. Journal of
Materials Science-Materials in Medicine, 11, 609-614.
FRANKS, K., SALIH, V., KNOWLES, J. C. & OLSEN, I. 2002. The effect of MgO on
the solubility behavior and cell proliferation in a quaternary soluble
phosphate based glass system. Journal of Materials Science-Materials in
Medicine, 13, 549-556.
FU, Q., RAO, G. V. R., ISTA, L. K., WU, Y., ANDRZEJEWSKI, B. P., SKLAR, L. A.,
WARD, T. L. & LOPEZ, G. P. 2003. Control of molecular transport through
stimuli-responsive ordered mesoporous materials. Advanced Materials, 15,
1262-1266.
GIANNOUDIS, P. V., DINOPOULOS, H. & TSIRIDIS, E. 2005. Bone substitutes: An
update. Injury-International Journal of the Care of the Injured, 36, 20-27.
GRUN, M., LAUER, I. & UNGER, K. K. 1997. The synthesis of micrometer- and
submicrometer-size spheres of ordered mesoporous oxide MCM-41.
Advanced Materials, 9, 254-261.
GUPTA, R. & KUMAR, A. 2008. Bioactive materials for biomedical applications
using sol-gel technology. Biomedical Materials, 3, 1-15.
HAMADOUCHE, M., MEUNIER, A., GREENSPAN, D. C., BLANCHAT, C.,
ZHONG, J. P. P., LA TORRE, G. P. & SEDEL, L. 2001. Long-term in vivo
bioactivity and degradability of bulk sol-gel bioactive glasses. Journal of
Biomedical Materials Research, 54, 560-566.
HASHIMOTO, T., WAGU, M., KIMURA, K., NASU, H., ISHIHARA, A., NISHIO, Y. &
IWAMOTO, Y. 2012. Titanophosphate glasses as lithium-free nonsilicate
pH-responsive glasses-Compatibility between pH responsivity and self-
cleaning properties. Materials Research Bulletin, 47, 1942-1949.
HE, Q. J., ZHANG, Z. W., GAO, F., LI, Y. P. & SHI, J. L. 2011. In vivo
Biodistribution and Urinary Excretion of Mesoporous Silica Nanoparticles:
Effects of Particle Size and PEGylation. Small, 7, 271-280.
HELLER, W. 1980. Polymer colloids. Plenum, New York.
HENCH, L. L. 1980. Biomaterials. Science, 208, 826-831.
HENCH, L. L. 1998. Bioceramics. Journal of the American Ceramic Society, 81,
1705-1728.
HENCH, L. L. & POLAK, J. M. 2002. Third-generation biomedical materials.
Science, 295, 1014-1017.

CHAPTER 1
61
HENCH, L. L. & WEST, J. K. 1990. The Sol-Gel Process. Chemical Reviews, 90,
33-72.
HENCH, L. L. & WILSON, J. 1984. Surface-Active Biomaterials. Science, 226, 630-
636.
HENCH, L. L. & WILSON, J. 1991. Bioceramics. Mrs Bulletin, 16, 62-74.
HENTRICH, R. L., STEIN, H. G., GRAVES, G. A. & BAJPAI, P. K. 1969. An
Evaluation of Inert and Resorbable Ceramics for Future Clinical Orthopedic
Applications. American Ceramic Society Bulletin, 48, 801-805.
HULBERT, S. F., HENCH, L. L., FORBERS, D. & BOWMAN, L. S. 1982. History of
bioceramics. Ceramics International, 8, 131-140.
JACOBY, W. A., MANESS, P. C., WOLFRUM, E. J., BLAKE, D. M. & FENNELL, J.
A. 1998. Mineralization of bacterial cell mass on a photocatalytic surface in
air. Environmental Science & Technology, 32, 2650-2653.
JAGER, C., HARTMANN, P., WITTER, R. & BRAUN, M. 2000. Neu 2D NMR
experiments for determining the structure of phosphate glasses: a review.
Journal of Non-Crystalline Solids, 263, 61-72.
JANIB, S. M., MOSES, A. S. & MACKAY, J. A. 2010. Imaging and drug delivery
using theranostic nanoparticles. Advanced Drug Delivery Reviews, 62,
1052-1063.
JENNINGS, L. E. & LONG, N. J. 2009. 'Two is better than one'-probes for dual-
modality molecular imaging. Chemical Communications, 3511-3524.
JOKERST, J. V., KHADEMI, C. & GAMBHIR, S. S. 2013. Intracellular Aggregation
of Multimodal Silica Nanoparticles for Ultrasound-Guided Stem Cell
Implantation. Science Translational Medicine, 5.
JONES, J. R. & BOCCACCINI, A. R. 2005. Biomedical Applications: Tissue
Engineering. Cellular Ceramics: Structure, Manufacturing, Properties and
Applications, 547-570.
JONES, J. R. & HENCH, L. L. 2003. Regeneration of trabecular bone using porous
ceramics. Current Opinion in Solid State & Materials Science, 7, 301-307.
KENDALL, K. & STAINTON, C. 2001. Adhesion and aggregation of fine particles.
Powder Technology, 121, 223-229.
KIANI, A., LAKHKAR, N. J., SALIH, V., SMITH, M. E., HANNA, J. V., NEWPORT,
R. J., PICKUP, D. M. & KNOWLES, J. C. 2012. Titanium-containing
bioactive phosphate glasses. Philosophical Transactions of the Royal
Society a-Mathematical Physical and Engineering Sciences, 370, 1352-
1375.

CHAPTER 1
62
KISHIOKA, A., HABA, M. & AMAGASA, M. 1974. Glass Formation in
Multicomponent Phosphate Systems Containing Tio2. Bulletin of the
Chemical Society of Japan, 47, 2493-2496.
KNABE, C., BERGER, G., GILDENHAAR, R., KLAR, F. & ZREIQAT, H. 2004. The
modulation of osteogenesis in vitro by calcium titanium phosphate coatings.
Biomaterials, 25, 4911-4919.
KNOWLES, J. C. 2003. Phosphate based glasses for biomedical applications.
Journal of Materials Chemistry, 13, 2395-2401.
KNOWLES, J. C., FRANKS, K. & ABRAHAMS, I. 2001. Investigation of the
solubility and ion release in the glass system K(2)O-Na(2)O-CaO-P(2)O(5).
Biomaterials, 22, 3091-3096.
KOKUBO, T., KIM, H. M. & KAWASHITA, M. 2003. Novel bioactive materials with
different mechanical properties. Biomaterials, 24, 2161-2175.
KOKUBO, T. & TAKADAMA, H. 2006. How useful is SBF in predicting in vivo bone
bioactivity? Biomaterials, 27, 2907-2915.
KORTESUO, P., AHOLA, M., KARLSSON, S., KANGASNIEMI, I., YLI-URPO, A. &
KIESVAARA, J. 2000. Silica xerogel as an implantable carrier for controlled
drug delivery - evaluation of drug distribution and tissue effects after
implantation. Biomaterials, 21, 193-198.
KOSUGE, K. & SINGH, P. S. 2001. Mesoporous silica spheres via l-alkylamine
templating route. Microporous and Mesoporous Materials, 44, 139-145.
KULKARNI, R. K., PANI, K. C., NEUMAN, C. & LEONARD, F. 1966. Polylactic Acid
for Surgical Implants. Archives of Surgery, 93, 839-&.
LAKHKAR, N., ABOU NEEL, E. A., SALIH, V. & KNOWLES, J. C. 2011. Titanium
and Strontium-doped Phosphate Glasses as Vehicles for Strontium Ion
Delivery to Cells. Journal of Biomaterials Applications, 25, 877-893.
LAKHKAR, N. J., PARK, J. H., MORDAN, N. J., SALIH, V., WALL, I. B., KIM, H. W.,
KING, S. P., HANNA, J. V., MARTIN, R. A., ADDISON, O., MOSSELMANS,
J. F. W. & KNOWLES, J. C. 2012. Titanium phosphate glass microspheres
for bone tissue engineering. Acta Biomaterialia, 8, 4181-4190.
LANGER, R. & VACANTI, J. P. 1993. Tissue Engineering. Science, 260, 920-926.
LAVAN, D. A., LYNN, D. M. & LANGER, R. 2002. Moving smaller in drug discovery
and delivery. Nature Reviews Drug Discovery, 1, 77-84.
LEE, I. H., FOROUTAN, F., LAKHKAR, N. J., GONG, M. S. & KNOWLES, J. C.
2013. Sol-gel synthesis and structural characterization of P2O5-CaO-Na2O

CHAPTER 1
63
glasses. Physics and Chemistry of Glasses-European Journal of Glass
Science and Technology Part B, 54, 115-120.
LEE, J. S. & HSU, C. K. 1999. The devitrification behavior of calcium phosphate
glass with TiO2 addition. Thermochimica Acta, 333, 115-119.
LEGEROS, R. Z. 2008. Calcium Phosphate-Based Osteoinductive Materials.
Chemical Reviews, 108, 4742-4753.
LENZA, R. F. S., VASCONCELOS, W. L., JONES, J. R. & HENCH, L. L. 2002.
Surface-modified 3D scaffolds for tissue engineering. Journal of Materials
Science-Materials in Medicine, 13, 837-842.
LI, P. J., OHTSUKI, C., KOKUBO, T., NAKANISHI, K., SOGA, N., NAKAMURA, T.
& YAMAMURO, T. 1992. Apatite Formation Induced by Silica-Gel in a
Simulated Body-Fluid. Journal of the American Ceramic Society, 75, 2094-
2097.
LIBERMAN, A., WU, Z., BARBACK, C. V., VIVEROS, R., BLAIR, S. L., ELLIES, L.
G., VERA, D. R., MATTREY, R. F., KUMMEL, A. C. & TROGLER, W. C.
2013. Color Doppler Ultrasound and Gamma Imaging of Intratumorally
Injected 500 nm Iron-Silica Nanoshells. Acs Nano, 7, 6367-6377.
LIM, E. K., YANG, J., DINNEY, C. P. N., SUH, J. S., HUH, Y. M. & HAAM, S. 2010.
Self-assembled fluorescent magnetic nanoprobes for multimode-biomedical
imaging. Biomaterials, 31, 9310-9319.
LIN, S. T., KREBS, S. L., KADIYALA, S., LEONG, K. W., LACOURSE, W. C. &
KUMAR, B. 1994. Development of Bioabsorbable Glass-Fibers.
Biomaterials, 15, 1057-1061.
LINKOUS, C. A., CARTER, G. J., LOCUSON, D. B., OUELLETTE, A. J.,
SLATTERY, D. K. & SMITHA, L. A. 2000. Photocatalytic inhibition of algae
growth using TiO2, WO3, and cocatalyst modifications. Environmental
Science & Technology, 34, 4754-4758.
LIPPMAA, E., MAGI, M., SAMOSON, A., ENGELHARDT, G. & GRIMMER, A. R.
1980. Structural Studies of Silicates by Solid-State High-Resolution Si-29
Nmr. Journal of the American Chemical Society, 102, 4889-4893.
LIVAGE, J., BARBOUX, P., VANDENBORRE, M. T., SCHMUTZ, C. & TAULELLE,
F. 1992. Sol-Gel Synthesis of Phosphates. Journal of Non-Crystalline
Solids, 147, 18-23.
LU, J., LIONG, M., LI, Z. X., ZINK, J. I. & TAMANOI, F. 2010. Biocompatibility,
Biodistribution, and Drug-Delivery Efficiency of Mesoporous Silica
Nanoparticles for Cancer Therapy in Animals. Small, 6, 1794-1805.

CHAPTER 1
64
LYSAGHT, M. J. & O'LOUGHLIN, J. A. 2000. Demographic scope and economic
magnitude of contemporary organ replacement therapies. Asaio Journal, 46,
515-521.
MAKITA, K., NOGAMI, M. & ABE, Y. 1997a. Sol-gel synthesis of amorphous P2O5-
TiO2 films and their electrical properties. Journal of the Ceramic Society of
Japan, 105, 595-599.
MAKITA, K., NOGAMI, M. & ABE, Y. 1997b. Sol-gel synthesis of high-humidity-
sensitive amorphous P2O5-TiO2 films. Journal of Materials Science Letters,
16, 550-552.
MAL, N. K., FUJIWARA, M., TANAKA, Y., TAGUCHI, T. & MATSUKATA, M. 2003.
Photo-switched storage and release of guest molecules in the pore void of
coumarin-modified MCM-41. Chemistry of Materials, 15, 3385-3394.
MALVINDI, M. A., GRECO, A., CONVERSANO, F., FIGUEROLA, A., CORTI, M.,
BONORA, M., LASCIALFARI, A., DOUMARI, H. A., MOSCARDINI, M.,
CINGOLANI, R., GIGLI, G., CASCIARO, S., PELLEGRINO, T. & RAGUSA,
A. 2011. Magnetic/Silica Nanocomposites as Dual-Mode Contrast Agents
for Combined Magnetic Resonance Imaging and Ultrasonography.
Advanced Functional Materials, 21, 2548-2555.
MANZANO, M. & VALLET-REGI, M. 2010. New developments in ordered
mesoporous materials for drug delivery. Journal of Materials Chemistry, 20,
5593-5604.
MARCACCI, M., KON, E., MOUKHACHEV, V., LAVROUKOV, A., KUTEPOV, S.,
QUARTO, R., MASTROGIACOMO, M. & CANCEDDA, R. 2007. Stem cells
associated with macroporous bioceramics for long bone repair: 6-to 7-year
outcome of a pilot clinical study. Tissue Engineering, 13, 947-955.
MARTIN, S. W. 1991. Review of the Structures of Phosphate-Glasses. European
Journal of Solid State and Inorganic Chemistry, 28, 163-205.
NAVARRO, M., CLEMENT, J., GINEBRA, M. P., MARTINEZ, S., AVILA, G. &
PLANELL, J. A. 2002. Improvement of the stability and mechanical
properties of resorbable phosphate glasses by the addition of TiO2.
Bioceramics 14, 218-2, 275-278.
NAVARRO, M., GINEBRA, M. P., CLEMENT, J., MARTINEZ, S., AVILA, G. &
PLANELL, J. A. 2003a. Physicochemical degradation of titania-stabilized
soluble phosphate glasses for medical applications. Journal of the American
Ceramic Society, 86, 1345-1352.

CHAPTER 1
65
NAVARRO, M., GINEBRA, M. P. & PLANELL, J. A. 2003b. Cellular response to
calcium phosphate glasses with controlled solubility. Journal of Biomedical
Materials Research Part A, 67A, 1009-1015.
NAVARRO, M., SANZANA, E. S., PLANELL, J. A., GINEBRA, M. P. & TORRES, P.
A. 2005. In vivo behavior of calcium phosphate glasses with controlled
solubility. Bioceramics 17, 284-286, 893-896.
NODA, K., SAKAMOTO, W., KIKUTA, K., YOGO, T. & HIRANO, S. 1997. Effect of
phosphorus sources on synthesis of KTiOPO4 thin films by sol-gel method.
Chemistry of Materials, 9, 2174-2178.
PARK, J. B., BRONZINO, J.D. AND KIM, Y.K. 2003. Biomaterials Principles and
Applications. CRC Press, Boca Raton, USA., 21-53.
PEER, D., KARP, J. M., HONG, S., FAROKHZAD, O. C., MARGALIT, R. &
LANGER, R. 2007. Nanocarriers as an emerging platform for cancer
therapy. Nature Nanotechnology, 2, 751-760.
PEPPAS, N. A. & LANGER, R. 1994. New Challenges in Biomaterials. Science,
263, 1715-1720.
PEREIRA, M. M., CLARK, A. E. & HENCH, L. L. 1995. Effect of Texture on the
Rate of Hydroxyapatite Formation on Gel-Silica Surface. Journal of the
American Ceramic Society, 78, 2463-2468.
PEREZ-PARIENTE, J., BALAS, F. & VALLET-REGI, M. 2000. Surface and
chemical study of SiO2 center dot P2O5 center dot CaO center dot(MgO)
bioactive glasses. Chemistry of Materials, 12, 750-755.
PICKUP, D. M., ABOU NEEL, E. A., MOSS, R. M., WETHERALL, K. M., GUERRY,
P., SMITH, M. E., KNOWLES, J. C. & NEWPORT, R. J. 2008a. TiK-edge
XANES study of the local environment of titanium in bioresorbable TiO(2)-
CaO-Na(2)O-P(2)O(5) glasses. Journal of Materials Science-Materials in
Medicine, 19, 1681-1685.
PICKUP, D. M., NEWPORT, R. J. & KNOWLES, J. C. 2012. Sol-Gel Phosphate-
based Glass for Drug Delivery Applications. Journal of Biomaterials
Applications, 26, 613-622.
PICKUP, D. M., SPEIGHT, R. J., KNOWLES, J. C., SMITH, M. E. & NEWPORT, R.
J. 2008b. Sol-gel synthesis and structural characterisation of binary TiO(2)-
P(2)O(5) glasses. Materials Research Bulletin, 43, 333-342.
PICKUP, D. M., VALAPPIL, S. P., MOSS, R. M., TWYMAN, H. L., GUERRY, P.,
SMITH, M. E., WILSON, M., KNOWLES, J. C. & NEWPORT, R. J. 2009.
Preparation, structural characterisation and antibacterial properties of Ga-

CHAPTER 1
66
doped sol-gel phosphate-based glass. Journal of Materials Science, 44,
1858-1867.
PIETAK, A. M., REID, J. W., STOTT, M. J. & SAYER, M. 2007. Silicon substitution
in the calcium phosphate bioceramics. Biomaterials, 28, 4023-4032.
QIAN, W. Y., SUN, D. M., ZHU, R. R., DU, X. L., LIU, H. & WANG, S. L. 2012. pH-
sensitive strontium carbonate nanoparticles as new anticancer vehicles for
controlled etoposide release. International Journal of Nanomedicine, 7,
5781-5792.
RAHAMAN, M. N., DAY, D. E., BAL, B. S., FU, Q., JUNG, S. B., BONEWALD, L. F.
& TOMSIA, A. P. 2011. Bioactive glass in tissue engineering. Acta
Biomaterialia, 7, 2355-2373.
REDDY, L. H. 2005. Drug delivery to tumours: recent strategies. Journal of
Pharmacy and Pharmacology, 57, 1231-1242.
RIBEIRO, C. C., BARRIAS, C. C. & BARBOSA, M. A. 2004. Calcium phosphate-
alginate microspheres as enzyme delivery matrices. Biomaterials, 25, 4363-
4373.
ROKKANEN, P. U., BOSTMAN, O., HIRVENSALO, E., MAKELA, E. A., PARTIO,
E. K., PATIALA, H., VAINIONPAA, S., VIHTONEN, K. & TORMALA, P.
2000. Bioabsorbable fixation in orthopaedic surgery and traumatology.
Biomaterials, 21, 2607-2613.
RUIZ-HERNANDEZ, E., LOPEZ-NORIEGA, A., ARCOS, D., IZQUIERDO-BARBA,
I., TERASAKI, O. & VALLET-REGI, M. 2007. Aerosol-assisted synthesis of
magnetic mesoporous silica spheres for drug targeting. Chemistry of
Materials, 19, 3455-3463.
RUST, K. R., SINGLETON, G. T., WILSON, J. & ANTONELLI, P. J. 1996. Bioglass
middle ear prosthesis: Long-term results. American Journal of Otology, 17,
371-374.
SAKKA, S., AOKI, K., KOZUKA, H. & YAMAGUCHI, J. 1993. Sol-Gel Synthesis of
Silica-Gel Disc as Applied to Supports of Organic-Molecules with Optical
Functions. Journal of Materials Science, 28, 4607-4614.
SHARMA, P., BROWN, S., WALTER, G., SANTRA, S. & MOUDGIL, B. 2006.
Nanoparticles for bioimaging. Advances in Colloid and Interface Science,
123, 471-485.
STREBHARDT, K. & ULLRICH, A. 2008. Paul Ehrlich's magic bullet concept: 100
years of progress. Nature Reviews Cancer, 8, 473-480.
CHAPTER 1
67
SUCHANEK, W. & YOSHIMURA, M. 1998. Processing and properties of
hydroxyapatite-based biomaterials for use as hard tissue replacement
implants. Journal of Materials Research, 13, 94-117.
SUNADA, K., WATANABE, T. & HASHIMOTO, K. 2003. Studies on photokilling of
bacteria on TiO(2) thin film. Journal of Photochemistry and Photobiology a-
Chemistry, 156, 227-233.
SUURONEN, R., KONTIO, R., ASHAMMAKHI, N., LINDQVIST, C. & LAINE, P.
2004. Bioabsorbable self-reinforced plates and screws in craniomaxillofacial
surgery. Bio-Medical Materials and Engineering, 14, 517-524.
SUZUKI, T., HUKKANEN, M., BUTTERY, L. D. K., POLAK, J. M., YOKOGAWA, Y.,
NISHIZAWA, T., NAGATA, F., KAWAMOTO, Y., KAMEYAMA, T. &
TORIYAMA, M. 1997. Effect of surface instability of calcium phosphate
ceramics on growth and adhesion of osteoblast-like cells derived from
neonatal rat calvaria. Bioceramics, Vol 10, 105-108.
TADJOEDIN, E. S., DE LANGE, G. L., LYARUU, D. M., KUIPER, L. & BURGER, E.
H. 2002. High concentrations of bioactive glass material (BioGran (R)) vs.
autogenous bone for sinus floor elevation - Histomorphometrical
observations on three split mouth clinical cases. Clinical Oral Implants
Research, 13, 428-436.
TANG, A. J., HASHIMOTO, T., NASU, H. & KAMIYA, K. 2005. Sol-gel preparation
and properties of TiO2-P2O5 bulk glasses. Materials Research Bulletin, 40,
55-66.
TORCHILIN, V. P. 2005. Recent advances with liposomes as pharmaceutical
carriers. Nature Reviews Drug Discovery, 4, 145-160.
UNGER, K. K., KUMAR, D., GRUN, M., BUCHEL, G., LUDTKE, S., ADAM, T.,
SCHUMACHER, K. & RENKER, S. 2000. Synthesis of spherical porous
silicas in the micron and submicron size range: challenges and opportunities
for miniaturized high-resolution chromatographic and electrokinetic
separations. Journal of Chromatography A, 892, 47-55.
URIST, M. R., OCONNOR, B. T. & BURWELL, R. G. 1994. Bone-Grafts,
Derivatives and Substitutes - Introduction. Bone Grafts, Derivatives and
Substitutes, 1-2.
VALLET-REGI, M. 2001. Ceramics for medical applications. Journal of the
Chemical Society-Dalton Transactions, 97-108.

CHAPTER 1
68
VALLET-REGI, M., ARCOS, D. & PEREZ-PARIENTE, J. 2000. Evolution of
porosity during in vitro hydroxycarbonate apatite growth in sol-gel glasses.
Journal of Biomedical Materials Research, 51, 23-28.
VALLET-REGI, M., BALAS, F., COLILLA, M. & MANZANO, M. 2007. Bioceramics
and pharmaceuticals: A remarkable synergy. Solid State Sciences, 9, 768-
776.
VALLET-REGI, M. & RUIZ-HERNANDEZ, E. 2011. Bioceramics: From Bone
Regeneration to Cancer Nanomedicine. Advanced Materials, 23, 5177-
5218.
VANWAZER, J. R. & GRIFFITH, E. J. 1955. Structure and Properties of the
Condensed Phosphates .10. General Structural Theory. Journal of the
American Chemical Society, 77, 6140-6144.
VANWAZER, J. R. & HOLST, K. A. 1950. Structure and Properties of the
Condensed Phosphates .1. Some General Considerations About
Phosphoric Acids. Journal of the American Chemical Society, 72, 639-644.
VEMULA, P. K., CRUIKSHANK, G. A., KARP, J. M. & JOHN, G. 2009. Self-
assembled prodrugs: An enzymatically triggered drug-delivery platform.
Biomaterials, 30, 383-393.
VIVERO-ESCOTO, J. L., SLOWING, I. I., TREWYN, B. G. & LIN, V. S. Y. 2010.
Mesoporous Silica Nanoparticles for Intracellular Controlled Drug Delivery.
Small, 6, 1952-1967.
WANG, L. S., WU, L. C., LU, S. Y., CHANG, L. L., TENG, I. T., YANG, C. M. & HO,
J. A. A. 2010. Biofunctionalized Phospholipid-Capped Mesoporous Silica
Nanoshuttles for Targeted Drug Delivery: Improved Water Suspensibility
and Decreased Nonspecific Protein Binding. Acs Nano, 4, 4371-4379.
WEISSLEDER, R. & MAHMOOD, U. 2001. Molecular imaging. Radiology, 219,
316-333.
WILLIAMS, D. 2004. Benefit and risk in tissue engineering. Materials Today, 7, 24-
29.
XUE, J. M. & SHI, M. 2004. PLGA/mesoporous silica hybrid structure for controlled
drug release. Journal of Controlled Release, 98, 209-217.
YAMANE, M., ASO, S., OKANO, S. & SAKAINO, T. 1979. Low-Temperature
Synthesis of a Monolithic Silica Glass by the Pyrolysis of a Silica-Gel.
Journal of Materials Science, 14, 607-611.
YUAN, F., DELLIAN, M., FUKUMURA, D., LEUNIG, M., BERK, D. A., TORCHILIN,
V. P. & JAIN, R. K. 1995. Vascular-Permeability in a Human Tumor

CHAPTER 1
69
Xenograft - Molecular-Size Dependence and Cutoff Size. Cancer Research,
55, 3752-3756.
ZARZYCKI, J., PRASSAS, M. & PHALIPPOU, J. 1982. Synthesis of Glasses from
Gels - the Problem of Monolithic Gels. Journal of Materials Science, 17,
3371-3379.
ZELINSKI, B. J. J. & UHLMANN, D. R. 1984. Gel Technology in Ceramics. Journal
of Physics and Chemistry of Solids, 45, 1069-1090.
ZHAO, Y. N., SUN, X. X., ZHANG, G. N., TREWYN, B. G., SLOWING, I. I. & LIN,
V. S. Y. 2011. Interaction of Mesoporous Silica Nanoparticles with Human
Red Blood Cell Membranes: Size and Surface Effects. Ac's Nano, 5, 1366-
1375.

CHAPTER 2
70
CHAPTER 2 Sol-Gel Synthesis and Characterisation of
Phosphate-Based Glasses Using Triethyl Phosphate as a Phosphorus Precursor

CHAPTER 2
70
2.1. Introduction
As previously mentioned, sol-gel synthesis of phosphate-based glasses is a non-
trivial task as P2O5 is a poor gel former and choosing a suitable phosphorus
precursor is essential. In this chapter, triethyl phosphate was used as a phosphorus
precursor to synthesise various phosphate-based glass systems with a new and
simplified sol-gel method at relatively low processing temperatures for potential use
in biomedical applications such as tissue engineering, drug delivery, and imaging
contrast agents.
To become familiar with the sol-gel reaction and to avoid complications of ternary
and quaternary systems, the synthesis process was commenced with a simple
binary titano-phosphate glasses with the general formula of (P2O5)(100-X)-(TiO2)(X),
where X=30, 35, 40, 45 or 50 mol%. This experiment also served as a pilot study to
explore the compositional limitations of such system.
The second investigated system was based on ternary phosphate-based glasses in
the P2O5-CaO-TiO2 system. The phosphorus pentoxide content was kept fixed at 55
mol% (ultraphosphate region) and titanium dioxide was substituted in place of
calcium oxide to prepare ternary phosphate-based sol-gel derived glasses with the
general formula of (P2O5)(55)-(CaO)(45-X)-(TiO2)(X), where X=20, 25, or 30 mol%.
The third system was based on ternary phosphate-based glasses in the P2O5-CaO-
Na2O system. Similar to the previously investigated system, P2O5 content was kept
fixed at 55 mol% and sodium oxide was substituted in place of calcium oxide to
prepare ternary sol-gel derived glasses with the general formula of (P2O5)(55)-
(CaO)(45-X)-(Na2O)(X), where X=10,15, or 20 mol%.
The final system investigated was a quaternary phosphate-based glass system with
the general formula of (P2O5)(40)-(CaO)(25)-(Na2O)(35-X)-(TiO2)(X) and (P2O5)(55)-
(CaO)(25)-(Na2O)(20-Y)-(TiO2)(Y), where X=20, 25, or 30 mol% and Y=5, 10, or 15

CHAPTER 2
71
mol%, with fixed phosphorus pentoxide at 40 or 55 mol%, calcium oxide content of
25 mol%, and substitution of titanium dioxide in place of sodium oxide. According to
the knowledge of the author, there is no study reported on the sol-gel synthesis of
these quaternary phosphate-based glasses.
Table 2.1 shows the compositions of starting solutions for binary, ternary, and
quaternary sol-gel derived glass systems. The structure of the prepared samples
was probed using X-ray diffraction (XRD), solid-state 31P magic angle spinning
nuclear magnetic resonance (31P MAS-NMR), and Fourier transform infrared (FTIR)
spectroscopy. The elemental proportions were also measured by energy dispersive
X-ray spectroscopy (EDX). Together, these methods provide detailed information
on sample structural variations from the phase level to the atomic level.

CHAPTER 2
72
Table 2.1. Theoretical compositions of sol-gel synthesised phosphate-based
glasses using triethyl phosphate as a phosphorus precursor.
Sample
Code
Theoretical composition Concentration (mol%)
P2O5 TiO2 CaO Na2O
EP70T30 (P2O5)70-(TiO2)30 70.0 30.0 0.0 0.0
EP65T35 (P2O5)65-(TiO2)35 65.0 35.0 0.0 0.0
EP60T40 (P2O5)60-(TiO2)40 60.0 40.0 0.0 0.0
EP55T45 (P2O5)55-(TiO2)45 55.0 45.0 0.0 0.0
EP50T50 (P2O5)50-(TiO2)50 50.0 50.0 0.0 0.0
EP55CT20 (P2O5)55-(CaO)25-(TiO2)20 55.0 20.0 25.0 0.0
EP55CT25 (P2O5)55-(CaO)20-(TiO2)25 55.0 25.0 20.0 0.0
EP55CT30 (P2O5)55-(CaO)15-(TiO2)30 55.0 30.0 15.0 0.0
EP55CN10 (P2O5)55-(CaO)35-(Na2O)10 55.0 0.0 35.0 10.0
EP55CN15 (P2O5)55-(CaO)30-(Na2O)15 55.0 0.0 30.0 15.0
EP55CN20 (P2O5)55-(CaO)25-(Na2O)20 55.0 0.0 25.0 20.0
EP40CNT20 (P2O5)40-(CaO)25-(Na2O)15-(TiO2)20 40.0 20.0 25.0 15.0
EP40CNT25 (P2O5)40-(CaO)25-(Na2O)10-(TiO2)25 40.0 25.0 25.0 10.0
EP40CNT30 (P2O5)40-(CaO)25-(Na2O)5-(TiO2)30 40.0 30.0 25.0 5.0
EP55CNT5 (P2O5)55-(CaO)25-(Na2O)15-(TiO2)5 55.0 5.0 25.0 15.0
EP55CNT10 (P2O5)55-(CaO)25-(Na2O)10-(TiO2)10 55.0 10.0 25.0 10.0
EP55CNT15 (P2O5)55-(CaO)25-(Na2O)5-(TiO2)15 55.0 15.0 25.0 5.0
2.2. Materials and methods
2.2.1. Materials
The following precursors were used without further purification to prepare
phosphate-based sol-gel derived glasses; triethyl phosphate (C6H15O4P, 99%,
Sigma-Aldrich, Gillingham, UK), titanium (IV) isopropoxide (97%, Sigma-Aldrich,
Gillingham, UK), calcium methoxyethoxide (20% in methoxyethanol, ABCR GmbH,

CHAPTER 2
73
Karlsruhe, Germany), 2-methoxyethanol (99.8%, Sigma-Aldrich, Gillingham, UK),
sodium methoxide solution (30 wt% in methanol, Sigma-Aldrich, Gillingham, UK),
and n-dimethyl formamide (n-DMF, ≥99.8%, Alfa Aesar, Heysham, UK). Figure 2.1
shows the structural formula of the used precursors.
Figure 2.1. Structure of; (a) triethyl phosphate, (b) titanium isopropoxide, (c) 2-
methoxyethanol, (d) n-dimethyl formamide, (e) calcium methoxyethoxide, and (f) sodium methoxide.

CHAPTER 2
74
2.2.2. Sol-gel synthesis methods
2.2.2.1. Binary P2O5-TiO2 glasses
The reaction was initiated by diluting triethyl phosphate in 2-methoxyethanol at a
molar ratio of 1:3 and magnetically stirred for about 10 minutes (the whole reaction
was carried out in a dried vessel). The reaction vessel was then cooled in an ice
bath before titanium isopropoxide was added dropwise into the vessel and mixed by
stirring for 1 hour. In the final stage, n-DMF (with a molar ratio of 0.25) was added
to the solution and a homogeneous solution was obtained after stirring for about 10
minutes. A schematic of the sol-gel synthesis of binary P2O5-TiO2 glasses is shown
in Figure 2.2.
Figure 2.2. Schematic of the sol-gel synthesis of binary P2O5-TiO2 glasses using
triethyl phosphate as a phosphorus precursor.

CHAPTER 2
75
2.2.2.2. Ternary P2O5-CaO-TiO2 glasses
A similar sol-gel preparation method that was described for binary P2O5-TiO2
glasses, was used to prepare ternary P2O5-CaO-TiO2 glasses. The only difference
between these two methods was in the final stage where before adding n-DMF,
calcium methoxyethoxide was added dropwise into the vessel and allowed to react
for about 1 hour. Finally, a homogeneous solution was obtained after 10 minutes of
stirring. The sol-gel preparation of ternary P2O5-CaO-TiO2 glasses is outlined
schematically in Figure 2.3.
Figure 2.3. Flow diagram of the sol-gel synthesis of ternary P2O5-TiO2-CaO glasses
using triethyl phosphate as a phosphorus precursor.
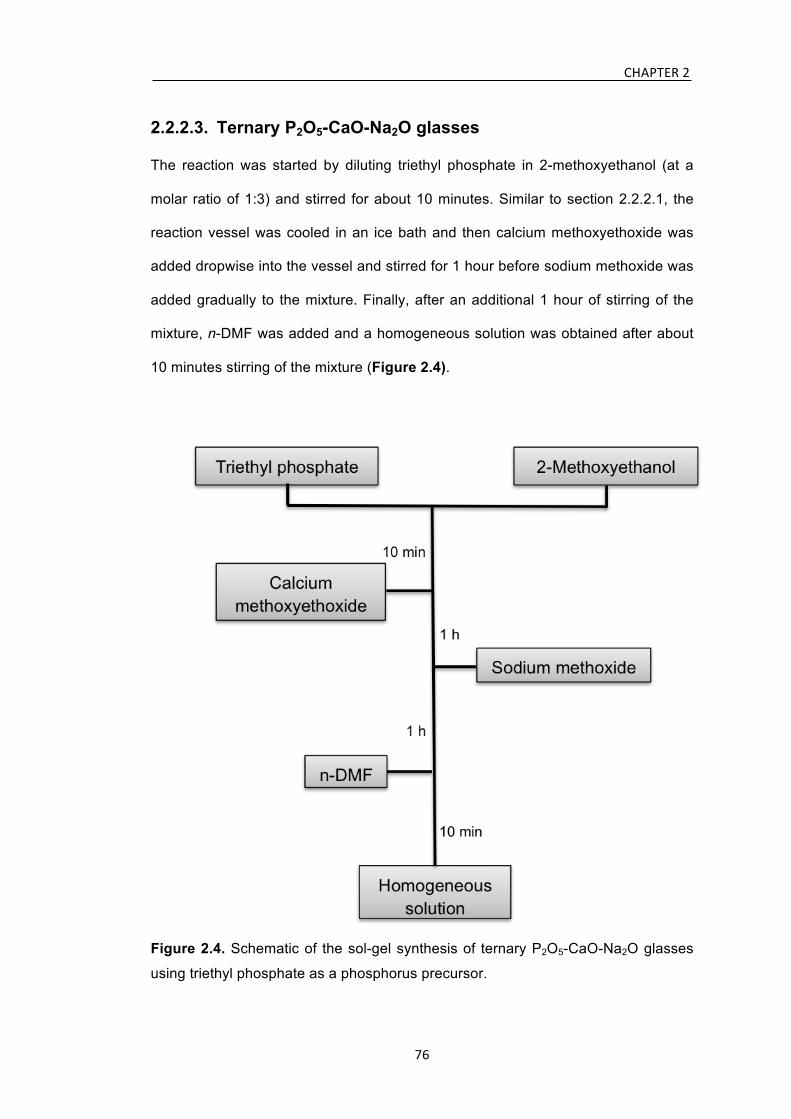
CHAPTER 2
76
2.2.2.3. Ternary P2O5-CaO-Na2O glasses
The reaction was started by diluting triethyl phosphate in 2-methoxyethanol (at a
molar ratio of 1:3) and stirred for about 10 minutes. Similar to section 2.2.2.1, the
reaction vessel was cooled in an ice bath and then calcium methoxyethoxide was
added dropwise into the vessel and stirred for 1 hour before sodium methoxide was
added gradually to the mixture. Finally, after an additional 1 hour of stirring of the
mixture, n-DMF was added and a homogeneous solution was obtained after about
10 minutes stirring of the mixture (Figure 2.4).
Figure 2.4. Schematic of the sol-gel synthesis of ternary P2O5-CaO-Na2O glasses
using triethyl phosphate as a phosphorus precursor.

CHAPTER 2
77
2.2.2.4. Quaternary P2O5-CaO-Na2O-TiO2 glasses
The reaction was initiated by diluting triethyl phosphate in 2-methoxyethanol (at a
molar ratio of 1:3). Using a magnetic stirrer, the components were mixed thoroughly
for 10 minutes. After 10 min of stirring the reaction vessel was cooled in an ice bath
before adding titanium isopropoxide dropwise into the mixture and stirring for 1
hour. Then calcium methoxyethoxide was poured slowly into the mixture and after 1
hour of stirring, sodium methoxide was added and the mixture stirred for another 1
hour. Finally, n-DMF (with a molar ratio of 0.25) was added to the mixture and a
homogeneous solution was obtained after 10 minutes of stirring. A schematic of the
sol-gel synthesis of quaternary P2O5-CaO-Na2O-TiO2 glasses is shown in Figure
2.5.
Figure 2.5. Schematic of the sol-gel synthesis of quaternary P2O5-CaO-Na2O-TiO2
glasses using triethyl phosphate as a phosphorus precursor.

CHAPTER 2
78
2.2.3. Drying procedure
The obtained homogeneous solutions of all four glass systems were aged at room
temperature for three days in sealed glass containers before drying in an oven
(EV014-Townson & Mercer, Cheshire, UK). The temperature was then increased
gradually (5 °C.h-1) to 60 ˚C and kept for a week. Following this, samples were
placed in contact with the air and the heating was continued at 120 ˚C for an
additional four days. Then the temperature was increased to 180 ˚C and kept for
two days before the heating cycle was finalised by heating the samples at 200 ˚C
for 2 hours to remove any remaining solvent and aiming to obtain bulk, glassy-like
samples. After the final heating stage the oven was turned off and samples left
overnight in the oven to cool down slowly. Figure 2.6 shows the heat-treatment
diagram for the sol-gel synthesised phosphate-based glasses.
Figure 2.6. Heat treatment diagram for the sol-gel synthesised phosphate-based
glasses.
Relative times /days

CHAPTER 2
79
2.2.4. Structural characterisation
2.2.4.1. X-ray diffraction
X-ray diffraction (XRD) has developed into one of the most powerful techniques for
determining the atomic structure of solids during the past 100 years. If the atoms of
a structure are arranged in a random way, such a structure is called amorphous.
Otherwise, the three dimensional structure of non-amorphous materials is defined
by regular, repeating planes of atoms that form a crystalline lattice. When a focused
X-ray beam interacts with such atomic planes, part of the beam is transmitted or
absorbed, but part of it would be scattered and diffracted back from the sample.
Based on the diffracted beam orientation, the distance between the planes of atoms
can be measured by applying Bragg’s Law (Equation 2.1) (Warren, 1969).
(2.1) Bragg’s Law Equation: 𝑛𝜆 = 2𝑑 𝑠𝑖𝑛𝜃
Where 𝑛 is the order of the diffracted beam, 𝜆 is the wavelength of the incident X-
ray beam, 𝑑 is the distance between the adjacent atomic planes, and the 𝜃 is the
angle of incidence of the X-ray beam. The characteristic set of 𝑑-spacings and their
intensity provide a unique fingerprint for the phases that are present in the sample.
Amorphous materials may be more desirable as a biodegradable material and
because they are isotropic, they do not produce crystalline fragments during the
degradation. The fragmented pieces can cause inflammation of the surrounding
tissues that may limit the potential biomedical applications (Bostman and
Pihlajamaki, 2000a, Bostman and Pihlajamaki, 2000b). In our work, XRD was
performed mainly to ensure that samples were amorphous and in some cases,
where crystallisation had occurred, to identify the crystalline phases.

CHAPTER 2
80
2.2.4.1.1. XRD analysis method
XRD patterns were obtained on a Bruker-D8 Advance Diffractometer (Coventry,
UK) from powder samples in a flat plate geometry using Ni-filtered Cu Kα radiation.
The obtained sol-gel derived samples were ground at 10 Hz to form a powder
(MM301 milling machine, Retsch GmbH, Hope, UK). Data were collected using a
Lynx Eye detector over an angular range of 2θ between 10 and 100° with a step
size of 0.02° and a count time of 12 second per step. Crystalline phases (if present)
were identified using the Crystallographica Search-Match software (Oxford
Cryosystems, Oxford, UK).
2.2.4.2. Energy dispersive X-ray
Energy dispersive X-ray spectroscopy (EDX) is an analytical technique used for the
elemental analysis or chemical characterisation. Each element has a unique atomic
structure which would be translated into a specific set of peaks on its X-ray
spectrum. EDX can determine the elemental composition of samples by identifying
specific X-ray peaks for each element. The number and energy of the X-rays
emitted from a specimen can be measured by an energy-dispersive spectrometer.
As the emitted X-rays energy is a function of energy difference between the two
electron shells and the atomic structure of the element, the elemental composition
of the specimen can be measured (Goldstein, 2003). There is debate over the
reproducibility of elemental data from EDX compared to methods such as X-ray
fluorescence, but if performed carefully, with flat samples, a large number of data
points or scan area and calibrated detector the obtained data can be reliable.

CHAPTER 2
81
2.2.4.2.1. EDX analysis method
EDX-Inca 300 (Oxford instrument, Abingdon, UK) was used to determine the exact
compositions of the prepared samples. Scanning electron microscopy XL30
(Philips, Eindhoven, Netherland) was operated at 20 kV, spot size 5 and a working
distance of 10 mm to identify the particular elements and their relative proportions
with EDX from the scanned area. The obtained data were converted to mol% of
oxides of the elements to allow a comparison to be made with the theoretical
compositions of the prepared samples.
2.2.4.3. Nuclear magnetic resonance
Solid-state nuclear magnetic resonance (NMR) offers significant opportunities to
probe structure and has been widely developed and used as both spectroscopic
and imaging techniques. Many atomic nuclei possess an intrinsic angular
momentum or spin and when the nuclei are placed in a strong magnetic field, the
nuclei align with the magnetic field. Quantum mechanics indicates that if a particle
is moving with periodic motion, it can absorb electromagnetic radiation if the
frequency of that motion exactly matches the frequency of the radiation. Such
nuclear magnetic resonances can be recorded by the NMR spectrometer as a peak
in the spectrum.
31P NMR is one of the more routine and relatively easily obtained and processed
type of NMR spectra due to the high sensitivity of the 31P isotope (which has 100%
natural abundance) and possesses a large magnetic moment and consequently a
high receptivity (Mackenzie and Smith, 2002). 31P is a spin 1/2 nucleus and can be
strongly influenced by the chemical shielding interaction. Chemical shielding
interaction is a result of the electron cloud density around the nucleus which
modifies the experienced magnetic field by the nucleus. This leads to a change in

CHAPTER 2
82
the resonance frequency of the nucleus and is termed as a chemical shift. The
common approach is to use magic angle spinning (MAS) at 54.7° between the axis
of rotation of the powder sample (many kHz) and the main static magnetic field
direction that removes the anisotropy and greatly improves the resolution. In such
spectra, the Qn species can be identified based on their differing isotropic chemical
shifts that is usually expressed in units of ppm to remove the magnetic field
dependence. The static line shapes break up into the isotropic line and a series of
spinning side bands that are separated from the isotropic line by multiples of the
spinning rate. The intensity contribution from the spinning side bands must be taken
into account in determining the relative abundance of each site.
With 31P MAS-NMR analysis, there is a possibility to measure the relative quantities
of the various Qn species that comprise the glass structure. The PO43- tetrahedron is
the base component of the phosphate-based glasses. Phosphate tetrahedra are
classified according to the number of oxygen atoms that they share with other
phosphate tetrahedra. An oxygen atom which is shared in such a way would be
referred to as bridging oxygen (BO) thereafter. According to Abou Neel et. al (Abou
Neel et al., 2009), the different type of phosphate tetrahedra are labelled according
to the number of BOs and they range from Q0 (an isolated PO43- tetrahedra) to Q3
(share three covalently bonded BOs with neighbouring PO43-) (Fig. 2.7).

CHAPTER 2
83
Figure 2.7. Representations of PO4 tetrahedra with various polymerisation (Abou
Neel et al., 2009).
2.2.4.3.1. 31P MAS-NMR analysis method
31P MAS-NMR spectra were acquired on a Varian VNMRS-400 Spectrometer
(Crawley, UK) and all spectra were referenced to the resonance of the secondary
reference ammonium dihyrogen phosphate (NH4H2PO4) at 0.9 ppm (relative to 85%
H3PO4 solution at 0 ppm). The spectra were recorded at 161.87 MHz for which
ground sample powders were loaded into a 4 mm (rotor o.d.) magic angle spinning
probe. The spectra were obtained using direct excitation with a 90° pulse, a 60
second recycle delay at ambient probe temperature (~ 25 °C), and at a sample spin
rate of 10 KHz and between 20 and 88 repetitions. In order to obtain the relative
abundances of each of the Qn species, the intensities of these peaks were fitted by
the DM-fit software (Massiot et al., 2002).
2.2.4.4. Fourier transform infrared spectroscopy
Fourier transform infrared (FTIR) spectroscopy is a technique to obtain an infrared
spectrum of transmission or absorption of a solid, liquid or gas. The absorption of
Q0 tetrahedron Q1 tetrahedron Q2 tetrahedron Q3 tetrahedron

CHAPTER 2
84
infrared radiation is related to the vibration of pairs or groups of atoms. The
frequency of the incident radiation is varied and the transmission or the absorption
of the radiation is measured and to be IR active a molecule must vary its electric
dipole moment. The importance of the IR technique in the study of the glass is due
to its ability to provide information on dynamic properties and changes in the rigidity
of the network against an external infrared excitation (Moustafa and El-Egili, 1998).
Peaks at various wavenumbers in an FTIR spectrum can be assigned to different
chemical groups since each bond or group of atoms has different vibrational
energies.
The FTIR spectroscopy is a commonly used technique for investigating the various
structural units that are present in phosphate-based glasses. The FTIR spectra of
phosphate-based glasses are generally obtained in a range between 600-1500 cm-1
(Le Saout et al., 2002, Carta et al., 2007). Peak intensities of the FTIR spectra are
also in agreement with the corresponding various Qn species observed in NMR
studies, thereby implying if the phosphate chains have undergone polymerisation or
depolymerisation.
2.2.4.4.1. FTIR analysis method
FTIR spectra were collected using a Perkin Elmer spectrometer 2000 (Perkin
Elmer, Seer Green, UK) with an attenuated total reflectance accessory (Golden
Gate, Specac, Orpington, UK). Powder samples were scanned at room temperature
in an absorbance mode in the range of 600-1500 cm-1 at a 4 cm-1 resolution and the
obtained data were analysed by the software supplied by Perkin Elmer Co.
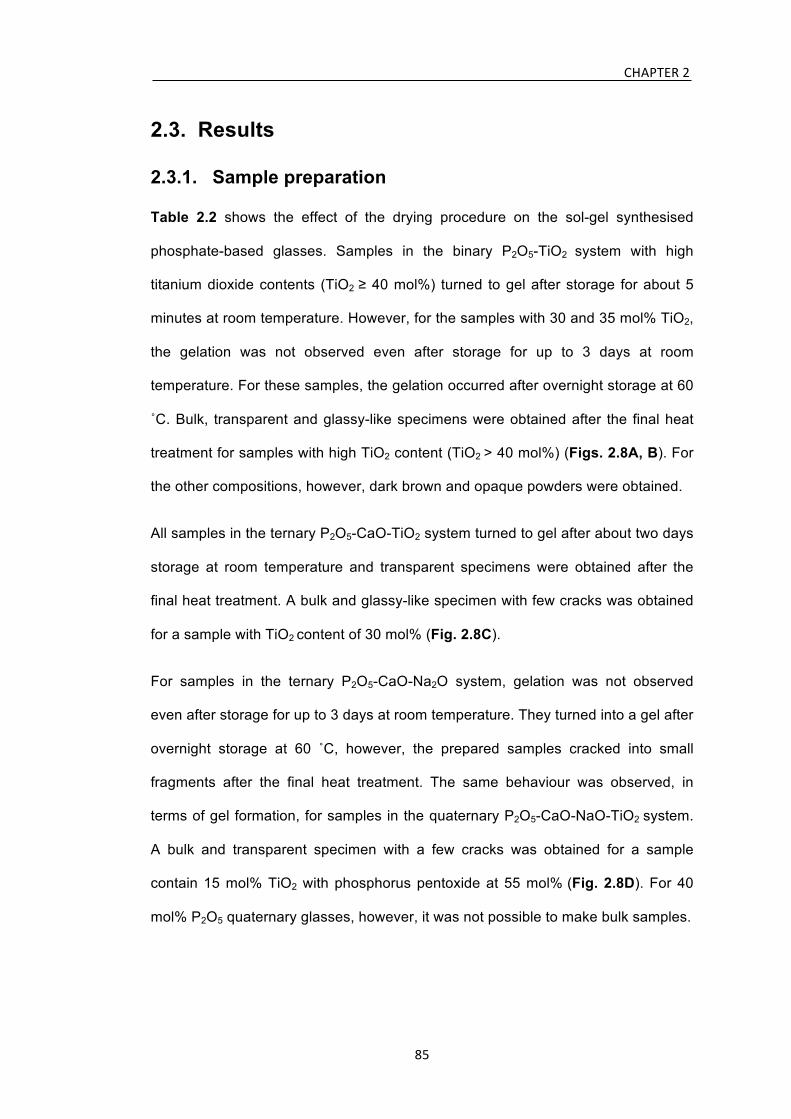
CHAPTER 2
85
2.3. Results
2.3.1. Sample preparation
Table 2.2 shows the effect of the drying procedure on the sol-gel synthesised
phosphate-based glasses. Samples in the binary P2O5-TiO2 system with high
titanium dioxide contents (TiO2 ≥ 40 mol%) turned to gel after storage for about 5
minutes at room temperature. However, for the samples with 30 and 35 mol% TiO2,
the gelation was not observed even after storage for up to 3 days at room
temperature. For these samples, the gelation occurred after overnight storage at 60
˚C. Bulk, transparent and glassy-like specimens were obtained after the final heat
treatment for samples with high TiO2 content (TiO2 > 40 mol%) (Figs. 2.8A, B). For
the other compositions, however, dark brown and opaque powders were obtained.
All samples in the ternary P2O5-CaO-TiO2 system turned to gel after about two days
storage at room temperature and transparent specimens were obtained after the
final heat treatment. A bulk and glassy-like specimen with few cracks was obtained
for a sample with TiO2 content of 30 mol% (Fig. 2.8C).
For samples in the ternary P2O5-CaO-Na2O system, gelation was not observed
even after storage for up to 3 days at room temperature. They turned into a gel after
overnight storage at 60 ˚C, however, the prepared samples cracked into small
fragments after the final heat treatment. The same behaviour was observed, in
terms of gel formation, for samples in the quaternary P2O5-CaO-NaO-TiO2 system.
A bulk and transparent specimen with a few cracks was obtained for a sample
contain 15 mol% TiO2 with phosphorus pentoxide at 55 mol% (Fig. 2.8D). For 40
mol% P2O5 quaternary glasses, however, it was not possible to make bulk samples.

CHAPTER 2
86
Figure 2.8. Photographs of heat treated; (A) EP55T45, (B) EP50T50, (C) EP55CT30,
and (D) EP55CNT15 sol-gel derived glasses using triethyl phosphate as a
phosphorus precursor.

CHAPTER 2
87
Table 2.2. Effect of heat treatment on phosphate-based sol-gel derived glasses
using triethyl phosphate as a phosphorus precursor. Sample
code
Gelation at room
temperature
Transparency Bulk and
crack-free sample
EP70T30 Χ Χ Χ
EP65T35 Χ Χ Χ
EP60T40 ! ! Heavily cracked
EP55T45 ! ! Few cracks
EP50T50 ! ! !
EP55CT20 ! ! Heavily cracked
EP55CT25 ! ! Heavily cracked
EP55CT30 ! ! Few cracks
EP55CN10 Χ ! Heavily cracked
EP55CN15 Χ ! Heavily cracked
EP55CN20 Χ ! Heavily cracked
EP40CNT20 Χ ! Heavily cracked
EP40CNT25 Χ ! Heavily cracked
EP40CNT30 Χ ! Heavily cracked
EP55CNT5 Χ ! Heavily cracked
EP55CNT10 Χ ! Heavily cracked
EP55CNT15 Χ ! Few cracks
2.3.2. XRD
2.3.2.1. Binary P2O5-TiO2 glasses
Figure 2.9 shows the XRD patterns of binary sol-gel derived samples in the P2O5-
TiO2 system. For samples containing TiO2 ≥ 40 mol%, a broad peak at 2θ values of
between 20 and 40° was observed and was free from any detectable crystalline
peaks which confirmed the amorphous and glassy nature of these samples. Also,

CHAPTER 2
88
as the TiO2 content was increased, the intensity of these peaks increased. For the
samples containing 30 and 35 mol% TiO2, however, crystalline patterns were
observed with three main sharp peaks at 22, 25, and 28°. Crystalline phases were
identified using the Crystallographica Search-Match software which corresponded
to titanium pyrophosphate (TiP2O7) (ICDD no. 38-1468) (Fig. 2.10a, b) (Wang et al.,
2007b). Since the aim of this study was to synthesise samples with an amorphous
structure for potential biomedical applications, these samples were excluded from
the rest of structural characterisation studies.
Figure 2.9. XRD patterns of binary sol-gel derived samples in the P2O5-TiO2 system
using triethyl phosphate as a phosphorus precursor.
2-‐Theta/Degrees

CHAPTER 2
89
b)
Lin
(Cou
nts)
0
100
200
300
400
500
600
700
800
900
1000
1100
1200
1300
1400
1500
1600
1700
1800
1900
2000
2100
2200
2300
2400
2500
2600
2700
2800
2900
3000
3100
3200
3300
3400
3500
3600
3700
2-Theta - Scale10 20 30 40 50 60 70 80 90
a) Li
n (C
ount
s)
0
100
200
300
400
500
600
700
800
900
1000
1100
1200
1300
1400
1500
1600
1700
1800
1900
2000
2100
2200
2300
2400
2500
2600
2700
2800
2900
3000
3100
3200
3300
3400
3500
3600
3700
2-Theta - Scale10 20 30 40 50 60 70 80 90
2-‐Theta/Degrees
2-‐Theta/Degrees
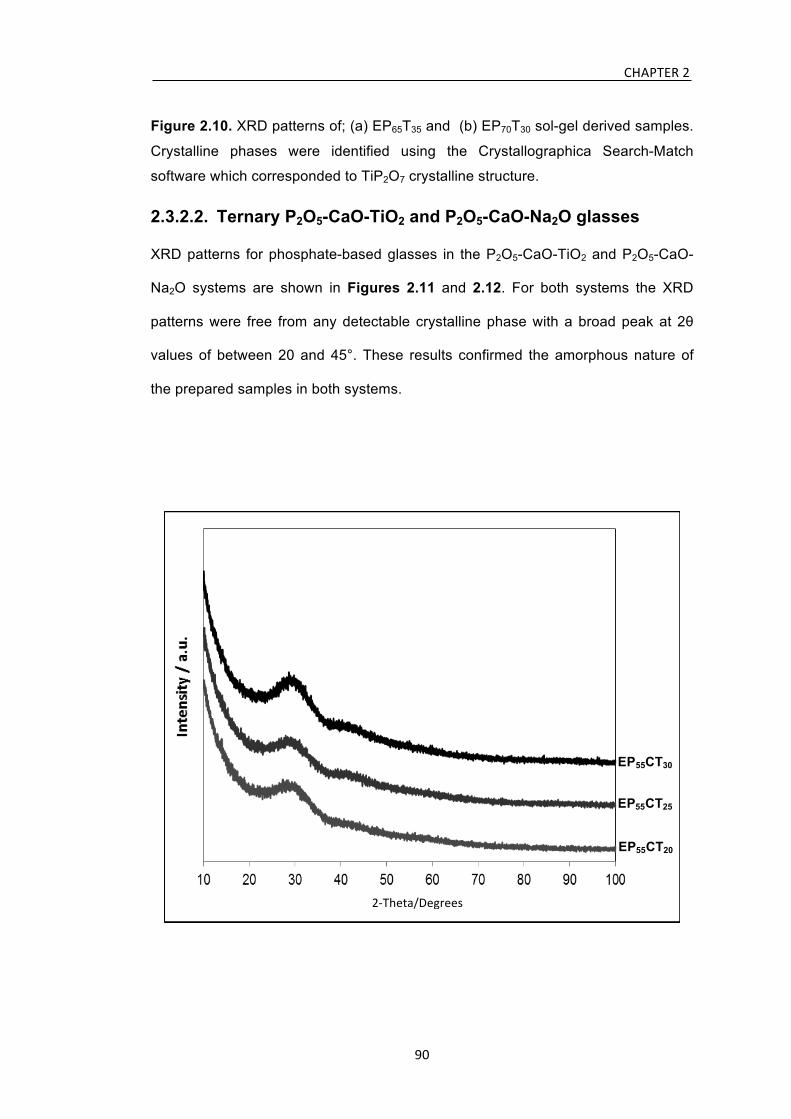
CHAPTER 2
90
Figure 2.10. XRD patterns of; (a) EP65T35 and (b) EP70T30 sol-gel derived samples.
Crystalline phases were identified using the Crystallographica Search-Match
software which corresponded to TiP2O7 crystalline structure.
2.3.2.2. Ternary P2O5-CaO-TiO2 and P2O5-CaO-Na2O glasses
XRD patterns for phosphate-based glasses in the P2O5-CaO-TiO2 and P2O5-CaO-
Na2O systems are shown in Figures 2.11 and 2.12. For both systems the XRD
patterns were free from any detectable crystalline phase with a broad peak at 2θ
values of between 20 and 45°. These results confirmed the amorphous nature of
the prepared samples in both systems.
EP55CT20
EP55CT25
EP55CT30
2-‐Theta/Degrees
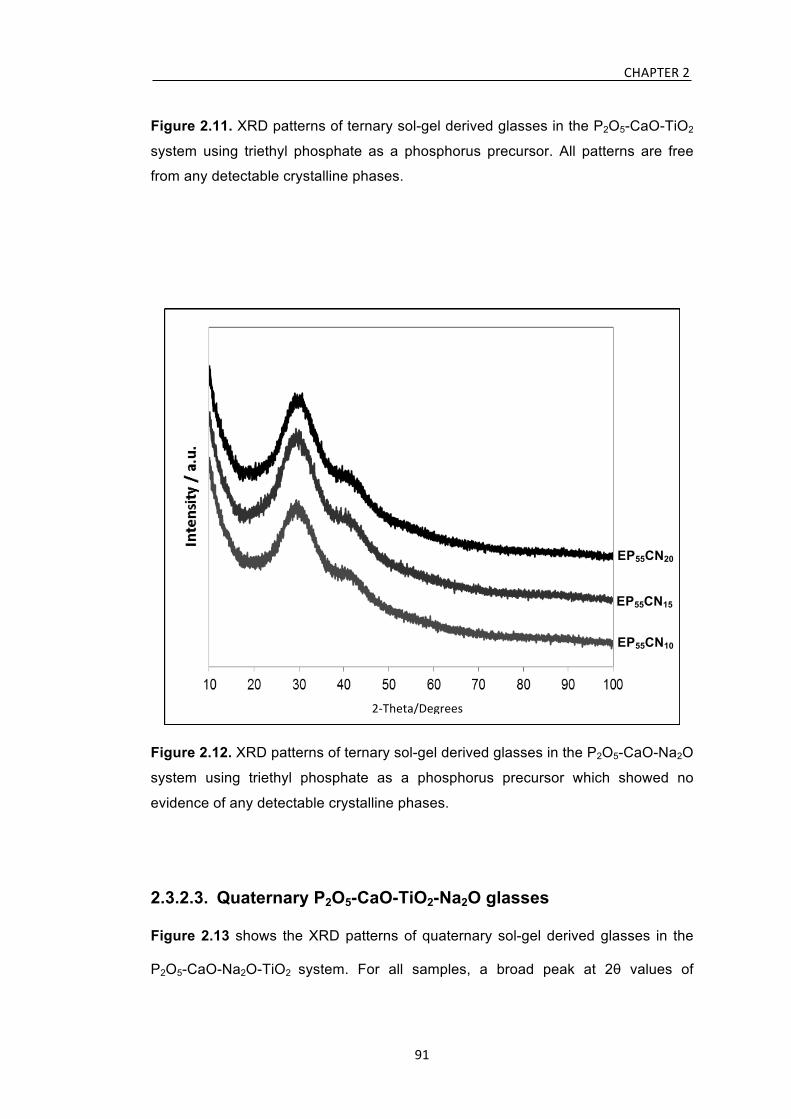
CHAPTER 2
91
Figure 2.11. XRD patterns of ternary sol-gel derived glasses in the P2O5-CaO-TiO2
system using triethyl phosphate as a phosphorus precursor. All patterns are free
from any detectable crystalline phases.
Figure 2.12. XRD patterns of ternary sol-gel derived glasses in the P2O5-CaO-Na2O
system using triethyl phosphate as a phosphorus precursor which showed no
evidence of any detectable crystalline phases.
2.3.2.3. Quaternary P2O5-CaO-TiO2-Na2O glasses
Figure 2.13 shows the XRD patterns of quaternary sol-gel derived glasses in the
P2O5-CaO-Na2O-TiO2 system. For all samples, a broad peak at 2θ values of
EP55CN20
EP55CN15
EP55CN10
2-‐Theta/Degrees

CHAPTER 2
92
between 20 and 40° was observed and was free from any detectable crystalline
phase, confirming the amorphous and glassy nature of the prepared samples.
Figure 2.13. XRD patterns of the quaternary sol-gel derived glasses in the P2O5-
CaO-Na2O-TiO2 system using triethyl phosphate as a phosphorus precursor that
are free from any detectable crystalline phases.
EP55CNT15
EP55CNT10
EP55CNT5
EP40CNT30
EP40CNT25
EP40CNT20
2-‐Theta/Degrees

CHAPTER 2
93
2.3.3. EDX
EDX results are reported in Table 2.3 that shows the highest deviation from the
theoretical values for P2O5 content occurred in P2O5-CaO-Na2O sol-gel derived
glasses which was 9.9-11.3 mol% lower than the theoretical values. This reduction
was accompanied by a concomitant increase in the percentage content of the other
oxides to compensate. While, glasses with a general formula of; P2O5-TiO2, P2O5-
CaO-TiO2, and P2O5-CaO-Na2O-TiO2 show 7.1-9.2, 7.4-8.7, and 7.7-9.7 mol% P2O5
reduction, respectively, from the theoretical values.
Table 2.3. Intended compositions and measured values of sol-gel derived glasses
using triethyl phosphate as a phosphorus precursor determined by EDX (in
parentheses).
Sample code
Concentration (mol%)
P2O5 TiO2 CaO Na2O EP60T40 60.0 (50.8±1.6) 40.0 (49.2±1.4) 0.0 0.0
EP55T45 55.0 (46.5±1.4) 45.0 (53.5±1.5) 0.0 0.0
EP50T50 50.0 (42.9±1.5) 50.0 (57.1±1.7) 0.0 0.0
EP55CT20 55.0 (46.3±1.9) 20.0 (24.9±1.8) 25.0 (28.8±1.3) 0.0
EP55CT25 55.0 (47.1±1.5) 25.0 (29.7±1.6) 20.0 (23.2±1.2) 0.0
EP55CT30 55.0 (47.6±1.4) 30.0 (34.4±1.5) 15.0 (18.0±1.3) 0.0
EP55CN10 55.0 (45.1±1.4) 0.0 35.0 (41.5±1.0) 10.0 (13.4±1.0)
EP55CN15 55.0 (44.6±1.0) 0.0 30.0 (36.8±0.9) 15.0 (18.6±0.8)
EP55CN20 55.0 (43.7±1.1) 0.0 25.0 (32.0±1.0) 20.0 (24.3±0.7)
EP40CNT20 40.0 (32.3±1.9) 20.0 (22.0±0.9) 25.0 (28.5±1.0) 15.0 (17.2±0.8)
EP40CNT25 40.0 (32.5±2.1) 25.0 (26.8±0.8) 25.0 (27.8±1.1) 10.0 (12.9±0.9)
EP40CNT30 40.0 (32.7±1.8) 30.0 (32.1±1.1) 25.0 (27.6±0.9) 5.0 (7.6±0.7)
EP55CNT5 55.0 (45.3±1.8) 5.0 (7.9±0.8) 25.0 (29.0±1.2) 15.0 (17.8±1.0)
EP55CNT10 55.0 (46.1±1.7) 10.0 (12.7±0.9) 25.0 (28.9±1.0) 10.0 (12.3±0.9)
EP55CNT15 55.0 (46.7±2.0) 15.0 (17.6±1.1) 25.0 (28.4±1.3) 5.0 (7.3±0.9)

CHAPTER 2
94
2.3.4. 31P MAS-NMR
2.3.4.1. Binary P2O5-TiO2 and ternary P2O5-CaO-TiO2 and P2O5-
CaO-Na2O glasses 31P MAS-NMR spectra of binary and ternary phosphate-based glasses are
presented in Figures 2.15 and 2.16 and peak parameters of each spectrum are
listed in Table 2.4. Peaks in the range of 0.8 to 1.7 ppm and -7.9 to -9.4 ppm are
attributed to Q0 and Q1 phosphate units, respectively (Lee et al., 2013, Brow, 2000).
Peaks in the range of -21.8 to -25.4 ppm are attributed to Q2 phosphate units (Lee
et al., 2013, Kirkpatrick and Brow, 1995). For titanium-containing glasses, additional
peaks in the range between -14.3 and -15.7 ppm correspond to Q1(Ti-O-P)
phosphate units (Abrahams et al., 2004, Brauer et al., 2010, Foroutan et al., 2015).
Figure 2.14. 31P MAS-NMR spectra of binary P2O5-TiO2 sol-gel derived glasses
using triethyl phosphate as a phosphorus precursor. The peaks correspond to
mainly Q1 and Q2 phosphate units. The asterisks denote spinning sidebands.
EP60T40
EP55T45
EP50T50 * *
* *
* *

CHAPTER 2
95
Figure 2.15. 31P MAS-NMR spectra of ternary sol-gel derived glasses using triethyl
phosphate as a phosphorus precursor in; (a) P2O5-CaO-TiO2 and (b) P2O5-CaO-
Na2O systems. The peaks correspond to mainly Q1 and Q2 phosphate units. The
asterisks denote spinning sidebands.
a)
b)
*
* *
*
*
*
*
* * *
* * *
* * *
*
*
EPCT20
EPCT25
EPCT30
EPCN10
EPCN15
EPCN20
Q1 Q2
* *
* * * *
* * * *
* *

CHAPTER 2
96
Table 2.4. 31P MAS-NMR peak parameters of binary and ternary phosphate-based sol-gel derived glasses using triethyl phosphate as a phosphorus precursor.
Sample code
Position (ppm, ±0.2)
Qi species
Line width (ppm, ±0.2)
Abundance (%, ±1.0)
EP60T40 1.3 0 3.9 8.4
-8.8 1 6.4 24.3
-15.2 1 9.7 46.5
-24.3 2 12.3 20.8
EP55T45 1.2 0 4.2 6.7
-9.3 1 6.7 20.1
-15.4 1 10.1 50.2
-25.1 2 12.5 23.0
EP50T50 0.9 0 4.6 5.8
-9.4 1 6.8 17.4
-15.7 1 10.4 52.7
-25.4 2 12.6 24.1
EP55CT20
-8.2 1 5.8 46.4
-14.3 1 9.4 26.1
-22.3 2 11.7 27.5
EP55CT25
-8.3 1 6.4 39.1
-14.5 1 9.5 29.8
-22.8 2 12.1 32.0
EP55CT30
-8.3 1 6.5 35.7
-14.6 1 9.7 32.3
-23.0 2 12.1 32.0
EP55CN10 0.8 0 3.9 0.4
-9.3 1 9.8 58.5
-22.3 2 11.6 41.1
EP55CN15 1.2 0 4.9 0.9
-8.5 1 10.2 55.4
-22.1 2 11.8 43.7
EP55CN20 1.7 0 5.3 3.1
-7.9 1 10.3 52.6
-21.8 2 12.3 44.3

CHAPTER 2
97
2.3.4.2. Quaternary P2O5-CaO-Na2O-TiO2 glasses
Figure 2.16 shows 31P MAS-NMR spectra of quaternary P2O5-CaO-Na2O-TiO2 sol-
gel derived glasses and peak parameters are given in Table 2.5. Peaks in the
range of -0.4 to -1.1 ppm and -8.4 to -10.6 ppm are associated with Q0 and Q1
phosphate units, respectively. While, peaks in the range of -22.2 to -24.4 ppm are
attributed to the Q2 species (Lee et al., 2013, Montagne et al., 2003). Similarly,
additional peaks in the range between -13.8 and -14.4 ppm can be related to the
Q1(Ti-O-P) phosphate units (Abrahams et al., 2004, Foroutan et al., 2015).
Figure 2.16. 31P MAS-NMR spectra of quaternary P2O5-CaO-Na2O-TiO2 sol-gel
derived glasses using triethyl phosphate as a phosphorus precursor. The peaks
correspond to mainly Q1 and Q2 phosphate units. The asterisks denote spinning
sidebands.
EP55CNT15
EP55CNT10
EP55CNT5
EP40CNT30
EP40CNT25
EP40CNT20
* * *
* *
* *
* * *
*
* * *
* *
* *
* *
* * * * *
*
*
* * *
*
*
*
* *
Q1 Q2
*

CHAPTER 2
98
2.3.5. FTIR spectroscopy
Figures 2.17, 2.18, and 2.19 present FTIR data for P2O5-TiO2, P2O5-CaO-TiO2,
P2O5-CaO-Na2O, P2O5-CaO-Na2O-TiO2 sol-gel derived glass systems. Each
spectrum was the result of summing 10 scans. Peaks assignments were acquired
Table 2.5. 31P MAS-NMR peak parameters of quaternary P2O5-CaO-Na2O-TiO2
sol-gel derived glasses using triethyl phosphate as a phosphorus precursor.
Sample
code
Position
(ppm, ±0.2)
Qi
species
Line width
(ppm, ±0.2)
Abundance
(%, ±1.0)
P40CNT20 -0.4 0 5.3 4.6
-8.4 1 6.2 54.5
-13.9 1 9.1 29.2
-22.3 2 10.5 11.7
P40CNT25 -0.7 0 6.2 3.8
-8.6 1 6.1 50.2
-14.1 1 9.3 32.6
-22.4 2 11.1 13.4
P40CNT30 -1.1 0 6.7 3.6
-8.9 1 5.9 46.2
-14.4 1 9.4 33.9
-22.7 2 11.4 16.3
P55CNT5 -9.2 1 5.8 41.4
-13.8 1 10.6 7.1
-22.2 2 12.1 51.5
P55CNT10 -10.4 1 6.2 37.1
-14.0 1 10.7 9.5
-23.7 2 12.5 53.4
P55CNT15 -10.6 1 6.5 31.6
-14.1 1 11.0 12.3
-24.4 2 12.7 56.1

CHAPTER 2
99
according to the previous FTIR spectroscopy studies on phosphate-based glasses
(Baia et al., 2007, Byun et al., 1995, Ilieva et al., 2001, Moustafa and El-Egili, 1998,
Sene et al., 2004, Pickup et al., 2007). Peaks in the range of 730 to 740 cm-1 can
be assigned to symmetrical stretching ʋs (P-O-P) mode, while peaks between 890
and 920 cm-1 can be assigned to asymmetrical stretching ʋas (P-O-P) mode that can
be related to Q2 phosphate species. Peaks between 1000 and 1120 cm-1 are
associated with symmetrical stretching mode of ʋs (PO3)2- (Q1 phosphate units).
Peaks in the range of 1100 to 1120 cm-1 and 1235 to 1250 cm-1 are assigned to
asymmetrical ʋas (PO3)2- and ʋas (PO2) - modes which can be related to Q1 and Q2
phosphate units, respectively. For titanium-containing glasses, a small shift in the
P-O-P band to higher wave numbers with an increase of TiO2 content can be
related to either smaller metallic cation size or shorter phosphate chain length
(Shih, 2003). Infrared band assignment for phosphate-based sol-gel derived
glasses are summarised in Table 2.6.
Figure 2.17. FTIR spectra of binary P2O5-TiO2 sol-gel derived glasses using triethyl
phosphate as a phosphorus precursor.
EP60T40
EP55T45
EP50T50

CHAPTER 2
100
Figure 2.18. FTIR spectra of ternary sol-gel derived glasses using triethyl
phosphate as a phosphorus precursor in; (a) P2O5-CaO-TiO2 and (b) P2O5-CaO-
Na2O systems.
EP55CN10
EP55CN15
EP55CN20
EP55CT20
EP55CT25
EP55CT30
a)
b)

CHAPTER 2
101
Figure 2.19. FTIR spectra of quaternary P2O5-CaO-Na2O-TiO2 sol-gel derived
glasses using triethyl phosphate as a phosphorus precursor.
Table 2.6. Infrared band assignment of phosphate-based sol-gel derived
glasses using triethyl phosphate as a phosphorus precursor (ʋ, stretching;
s, symmetric; as, asymmetric).
Wavenumber
(cm-1)
Assignments Associated Qn
730-740 ʋs (P-O-P) N/A
890-920 ʋas (P-O-P) Q2
985-1000 ʋs (PO3)2- Q1
1100-1120 ʋas (PO3)2- Q1
1235-1250 ʋas (PO2)- Q2
EP55CNT15
EP55CNT10
EP55CNT5
EP40CNT30
EP40CNT25
EP40CNT20

CHAPTER 2
102
2.4. Discussion
The main objective of this chapter was to demonstrate the successful production of
sol-gel derived phosphate-based glasses in the P2O5-TiO2, P2O5-TiO2-CaO, P2O5-
CaO-Na2O, and P2O5-CaO-Na2O-TiO2 systems. The sol-gel synthesis of
phosphate-based glasses has been proven to be a challenging task since choosing
the right precursors and also solvents with the capability of dissolving precursors
and subsequent removal after the final heat treatment are essential. In this chapter,
and in line with the previous study by Tang et al. (Tang et al., 2005) who reported
successful sol-gel synthesis of bulk titano-phosphate glasses, we used triethyl
phosphate as a phosphorus precursor to sol-gel synthesise binary, ternary and
quaternary phosphate-based glasses with a wide range of compositions. The
maximum heat treatment temperature was set at 200 °C in order to not limit the
potential use of these glasses for biomedical applications such as drug delivery
systems. The chosen temperature was higher than the boiling point of the solvents
used and it was selected to make sure there is no or minimal residual solvents (that
can be very toxic for biomedical application purposes) exist in prepared samples
after the final heat treatment.
Sample preparation results confirmed that the upper limit for the gel formation at
room temperature for binary P2O5-TiO2 glasses is 60 mol% P2O5. Bulk, transparent,
and glassy-like specimens were successfully synthesised for samples contain 50
and 55 mol% P2O5 and XRD patterns for these samples were free from any
detectable crystalline phase confirming the amorphous and glassy nature of these
samples. For samples with P2O5 > 60 mol%, however, crystalline patterns were
observed which corresponded to TiP2O7 structure. It should be noted that TiP2O7
ceramics have a great potential to be used in a variety of applications such as
rechargeable batteries to replace with the current generation of rechargeable

CHAPTER 2
103
lithium-ion-batteries (Rai et al., 2012, Wang et al., 2007a) and the sol-gel technique
mentioned herein, may be a new, simplified and low temperature synthesis method
to prepare these ceramics. However, this area was not in the scope of this study
and were excluded from further investigation.
Ternary phosphate-based glasses in P2O5-CaO-Na2O and P2O5-CaO-TiO2 systems
with fixed P2O5 content of 55 mol% were successfully synthesised via the sol-gel
method. Bulk and transparent specimen was obtained for ternary titanium-
containing glasses with high titanium dioxide content of 30 mol%. The same
behaviour was observed for quaternary P2O5-CaO-Na2O-TiO2 glasses at P2O5
content of 55 mol% when high titanium dioxide (15 mol% TiO2) incorporated at the
expense of sodium oxide that clearly indicates, incorporation of titanium into the
phosphate-based glasses can make the phosphate network more interconnected
due to the cross-linking effect of titanium (Abrahams et al., 2004, Brauer et al.,
2010). However, it was not possible to make bulk glasses for quaternary P2O5-CaO-
Na2O-TiO2 sol-gel derived glasses at P2O5 content of 40 mol%, which might be
related to the insufficient levels of P2O5 for these glasses to form a network. The
XRD patterns for ternary and quaternary sol-gel derived glasses also confirmed the
amorphous and glassy nature of these samples.
EDX results revealed a reduction of between 7 to 11 mol% P2O5 from the theoretical
values with a concomitant increase in the percentage content of other oxides to
compensate. This reduction was expected to be due to the slow reaction of triethyl
phosphate and thus not all the P2O5 was incorporated into the glass network and
could be lost by evaporation during the heat treatment cycle of the sol-gel process.
To confirm this, the evaporated gas from ternary EP55CN20 sol-gel derived sample
that was heat treated up to 100 °C was analysed via FTIR spectroscopy during the
heat treatment. This composition was chosen because of the high phosphorus loss
of around 11 mol%, which was previously confirmed by EDX. For the heat

CHAPTER 2
104
treatment cycle, differential thermal analysis (DTA) (Labsys, Setaram, Caluire,
France) was used. Pure N2 gas was used for the DTA inlet and the outlet connected
to the FTIR spectroscopy chamber (2000, Perkin Elmer, Seer Green, UK) via PTFE
tube to analyse the evaporated gas from the sample during the heat treatment cycle
(Figure 2.20). The study was carried out on 50 mg of the powder sample and the
heat treatment cycle was set at a heating rate of 20 °C.min-1 from 100 to 220 °C,
while the FTIR spectroscopy chamber was scanned in an absorbance mode in the
range of 700-1500 cm-1 at various time-points with the Timebase software supplied
by Perkin Elmer Co. Each spectrum was baseline corrected prior to data analysis.
Figure 2.21 shows the FTIR spectroscopy data of the ternary EP55CN20 sol-gel
derived sample that was confirmed an appearance of a broad peak at 1040 cm-1
during the heat treatment cycle from 140 to 200 °C that can be attributed to the
evaporation of unreacted phosphorus (PO43-) (Mobasherpour et al., 2007).
Figure 2.20. Schematic setup to analyse the evaporated gas from ternary EP55CN20
sol-gel derived sample via FTIR spectroscopy during the heat treatment cycle.

CHAPTER 2
105
Figure 2.21. FTIR spectra of ternary EP55CN20 sol-gel derived sample during the
heat treatment cycle from 100 to 220 °C.
Interestingly, substitution of titanium for calcium or sodium, reduced the phosphorus
loss. This can be related to the cross-linking effect of titanium that makes the
phosphate network more interconnected. 31P MAS-NMR results confirmed, the
structure of the prepared phosphate-based glasses consists of mainly Q1 and Q2
phosphate units, indicating the structure has undergone polymerisation. In addition,
substituting titanium for calcium or sodium improves the polymerisation of the
phosphate network with a higher formation of Q2 species. The FTIR measurements
on the titanium-containing glasses were also in correlation with 31P MAS-NMR
results that showed an increase in the intensity of the peaks in the range between
890 and 920 cm-1 as titanium substituted in place of calcium or sodium.
These results suggested that titanium was acting as an ionic cross-linker and may
increase the rigidity and durability of the phosphate network (Foroutan et al., 2015).
Likewise, calcium can provide cross-links between the phosphate chains (but not as

CHAPTER 2
106
strong as titanium, which has been shown to be), whereas, sodium can link to just
one chain and therefore leads to depolymerisation of the phosphate network (Lee et
al., 2013). The FTIR spectra of ternary glasses in the P2O5-CaO-Na2O system (Fig.
2.17b) were also in good correlation with the 31P MAS-NMR data that revealed an
increase in the intensity of the peaks at 900 and 1240 cm-1 as calcium substituted in
place of sodium which is attributed to the Q2 phosphate units.
In summary, to date, there have been no reports on sol-gel preparation of TiO2-
P2O5, P2O5-CaO-TiO2, and P2O5-CaO-Na2O glasses with a wide range of
compositions at relatively low processing temperatures as investigated here. We
successfully synthesised these glass systems via a new and simplified sol-gel
method. In this study for the first time, according to the knowledge of the author, the
sol-gel preparation of quaternary P2O5-CaO-Na2O-TiO2 glasses with high titanium
dioxide content of up to 30 mol% was reported. While, incorporating a high amount
of titanium into the phosphate network via melt-quench method is non-trivial and
according to the literature the maximum percentage in quaternary phosphate-based
glasses may only reach as high as 15 mol% TiO2 since incorporation of higher
amount of titanium either is not melt into the glass due to its sedimenting out or can
causing immediate crystallisation of the glass upon removal from the furnace (Kiani
et al., 2012). However, in this study, a relatively high amount of phosphorus was
lost which might be related to the slow reaction of the phosphorus precursor used.
In the next chapter, we investigated the use of a more reactive phosphorus
precursor to increase the reaction rate and also reduce the amount of phosphorus
lost during the sol-gel synthesis of these glasses.

CHAPTER 2
107
References
ABOU NEEL, E. A., PICKUP, D. M., VALAPPIL, S. P., NEWPORT, R. J. &
KNOWLES, J. C. 2009. Bioactive functional materials: a perspective on
phosphate-based glasses. Journal of Materials Chemistry, 19, 690-701.
ABRAHAMS, I., HADZIFEJZOVIC, E. & DYGAS, J. R. 2004. Structural and
electrical characterisation of Li2O : TiO2 : SnO2 : P2O5 electrolyte glass.
Dalton Transactions, 3129-3136.
BAIA, L., MURESAN, D., BAIA, M., POPP, J. & SIMON, S. 2007. Structural
properties of silver nanoclusters-phosphate glass composites. Vibrational
Spectroscopy, 43, 313-318.
BOSTMAN, O. & PIHLAJAMAKI, H. 2000a. Clinical biocompatibility of
biodegradable orthopaedic implants for internal fixation: a review.
Biomaterials, 21, 2615-2621.
BOSTMAN, O. M. & PIHLAJAMAKI, H. K. 2000b. Adverse tissue reactions to
bioabsorbable fixation devices. Clinical Orthopaedics and Related
Research, 216-227.
BRAUER, D. S., KARPUKHINA, N., LAW, R. V. & HILL, R. G. 2010. Effect of TiO2
addition on structure, solubility and crystallisation of phosphate invert
glasses for biomedical applications. Journal of Non-Crystalline Solids, 356,
2626-2633.
BROW, R. K. 2000. Review: the structure of simple phosphate glasses. Journal of
Non-Crystalline Solids, 263, 1-28.
BYUN, J. O., KIM, B. H., HONG, K. S., JUNG, H. J., LEE, S. W. & IZYNEEV, A. A.
1995. Properties and Structure of Ro-Na2O-Al2O3-P2O5 (R=Mg, Ca, Sr,
Ba) Glasses. Journal of Non-Crystalline Solids, 190, 288-295.
CARTA, D., PICKUP, D. M., KNOWLES, J. C., AHMED, I., SMITH, M. E. &
NEWPORT, R. J. 2007. A structural study of sol-gel and melt-quenched
phosphate-based glasses. Journal of Non-Crystalline Solids, 353, 1759-
1765.
FOROUTAN, F., DE LEEUW, N., MARTIN, R., PALMER, G., OWENS, G., KIM, H.-
W. & KNOWLES, J. 2015. Novel sol–gel preparation of (P2O5)0.4–
(CaO)0.25–(Na2O)X–(TiO2)(0.35−X) bioresorbable glasses (X = 0.05, 0.1,
and 0.15). Journal of Sol-Gel Science and Technology, 73, 434-442.
GOLDSTEIN, J. 2003. Scanning Electron Microscopy and X-ray Microanalysis.
Springer US, 1.

CHAPTER 2
108
ILIEVA, D., JIVOV, B., KOVACHEVA, D., TSACHEVA, T., DIMITRIEV, Y.,
BOGACHEV, G. & PETKOV, C. 2001. FT-IR and Raman spectra of Gd
phosphate crystals and glasses. Journal of Non-Crystalline Solids, 293, 562-
568.
KIANI, A., LAKHKAR, N. J., SALIH, V., SMITH, M. E., HANNA, J. V., NEWPORT,
R. J., PICKUP, D. M. & KNOWLES, J. C. 2012. Titanium-containing
bioactive phosphate glasses. Philosophical Transactions of the Royal
Society a-Mathematical Physical and Engineering Sciences, 370, 1352-
1375.
KIRKPATRICK, R. J. & BROW, R. K. 1995. Nuclear-Magnetic-Resonance
Investigation of the Structures of Phosphate and Phosphate-Containing
Glasses - a Review. Solid State Nuclear Magnetic Resonance, 5, 9-21.
LE SAOUT, G., SIMON, P., FAYON, F., BLIN, A. & VAILLS, Y. 2002. Raman and
infrared study of (PbO)(x)(P2O5)((1-x)) glasses. Journal of Raman
Spectroscopy, 33, 740-746.
LEE, I. H., FOROUTAN, F., LAKHKAR, N. J., GONG, M. S. & KNOWLES, J. C.
2013. Sol-gel synthesis and structural characterization of P2O5-CaO-Na2O
glasses. Physics and Chemistry of Glasses-European Journal of Glass
Science and Technology Part B, 54, 115-120.
MACKENZIE, K. J. D. & SMITH, M. E. 2002. Multinuclear Solid State NMR of
Inorganic Materials. Oxford, Pergamon.
MASSIOT, D., FAYON, F., CAPRON, M., KING, I., LE CALVE, S., ALONSO, B.,
DURAND, J. O., BUJOLI, B., GAN, Z. H. & HOATSON, G. 2002. Modelling
one- and two-dimensional solid-state NMR spectra. Magnetic Resonance in
Chemistry, 40, 70-76.
MOBASHERPOUR, I., HESHAJIN, M. S., KAZEMZADEH, A. & ZAKERI, M. 2007.
Synthesis of nanocrystalline hydroxyapatite by using precipitation method.
Journal of Alloys and Compounds, 430, 330-333.
MONTAGNE, L., DAVIERO, S. & PALAVIT, G. 2003. Glass network evolution with
Bi3+/Ti4+ substitution in phosphate glasses formulated with a constant
oxygen/phosphorus ratio. EXAFS, XANES, and P-31 double quantum MAS
NMR. Chemistry of Materials, 15, 4709-4716.
MOUSTAFA, Y. M. & EL-EGILI, K. 1998. Infrared spectra of sodium phosphate
glasses. Journal of Non-Crystalline Solids, 240, 144-153.
PICKUP, D. M., GUERRY, P., MOSS, R. M., KNOWLES, J. C., SMITH, M. E. &
NEWPORT, R. J. 2007. New sol-gel synthesis of a (CaO)(0.3)(

CHAPTER 2
109
Na2O)(0.2)(P2O5)(0.5) bioresorbable glass and its structural
characterisation. Journal of Materials Chemistry, 17, 4777-4784.
RAI, A. K., GIM, J., SONG, J., MATHEW, V., ANH, L. T. & KIM, J. 2012.
Electrochemical and safety characteristics of TiP2O7-graphene
nanocomposite anode for rechargeable lithium-ion batteries. Electrochimica
Acta, 75, 247-253.
SENE, F. F., MARTINELLI, J. R. & GOMES, L. 2004. Synthesis and
characterization of niobium phosphate glasses containing barium and
potassium. Journal of Non-Crystalline Solids, 348, 30-37.
SHIH, P. Y. 2003. Properties and FTIR spectra of lead phosphate glasses for
nuclear waste immobilization. Materials Chemistry and Physics, 80, 299-
304.
TANG, A. J., HASHIMOTO, T., NASU, H. & KAMIYA, K. 2005. Sol-gel preparation
and properties of TiO2-P2O5 bulk glasses. Materials Research Bulletin, 40,
55-66.
WANG, H., HUANG, K., ZENG, Y., YANG, S. & CHEN, L. 2007a. Electrochemical
properties of TiP2O7 and LiTi2(PO4)3 as anode material for lithium ion
battery with aqueous solution electrolyte. Electrochimica Acta, 52, 3280-
3285.
WANG, H. B., HUANG, K. L., ZENG, Y. Q., YANG, S. & CHEN, L. Q. 2007b.
Electrochemical properties of TiP2O7 and LiTi2(PO4)(3) as anode material
for lithium ion battery with aqueous solution electrolyte. Electrochimica Acta,
52, 3280-3285.
WARREN, B. E. 1969. X-Ray Studies of Glass Structure. American Ceramic
Society Bulletin, 48, 872-&.

CHAPTER 3
110
CHAPTER 3 Sol-Gel Synthesis and Characterisation of
Phosphate-Based Glasses Using n-butyl Phosphate as a Phosphorus Precursor

CHAPTER 3
111
3.1. Introduction
In the previous chapter, EDX results revealed a relatively high phosphorus
reduction from the theoretical values (~7-11 mol%) that was due to the evaporation
of unreacted phosphorus during the heat treatment cycle of sol-gel process. A
range of more reactive phosphorus precursors have been investigated to increase
the reaction rate and also reduce the amount of phosphorus loss during the sol-gel
process such as phosphoric acid (H3PO4), phosphoryl chloride (POCl3), and alkyl
phosphates like n-butyl phosphate (Livage et al., 1992). The results showed that
H3PO4 is too reactive and usually leads to precipitation, while POCl3 and n-butyl
phosphate seem to be better alternatives for the sol-gel synthesis of phosphate-
based glasses (Pickup et al., 2007, Clayden et al., 2001). It was also confirmed that
the phosphorus loss from POCl3 during the sol-gel reaction is relatively higher than
n-butyl phosphate (Carta et al., 2005, Lee et al., 1996).
In this chapter, n-butyl phosphate was used as a phosphorus precursor to
synthesise ternary P2O5-CaO-Na2O and quaternary P2O5-CaO-NaO-TiO2 glass
systems via the sol-gel method. A similar preparation method that was explained in
chapter 2, was used to make these glass systems with a wide range of
compositions. The structure of the prepared samples was characterised using XRD,
31P MAS-NMR, FTIR spectroscopy, and the elemental proportions were measured
by EDX. The compositions of the starting solutions are shown in Table 3.1.
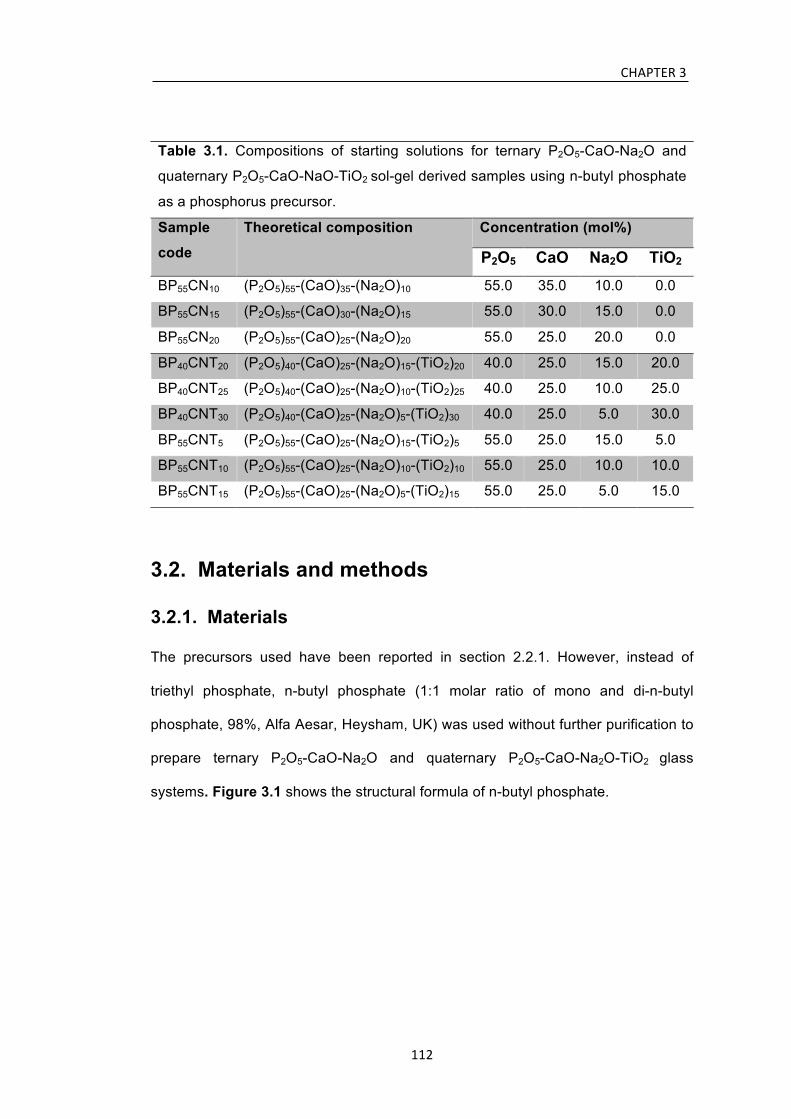
CHAPTER 3
112
Table 3.1. Compositions of starting solutions for ternary P2O5-CaO-Na2O and
quaternary P2O5-CaO-NaO-TiO2 sol-gel derived samples using n-butyl phosphate
as a phosphorus precursor.
Sample
code
Theoretical composition
Concentration (mol%)
P2O5 CaO Na2O TiO2 BP55CN10 (P2O5)55-(CaO)35-(Na2O)10 55.0 35.0 10.0 0.0
BP55CN15 (P2O5)55-(CaO)30-(Na2O)15 55.0 30.0 15.0 0.0
BP55CN20 (P2O5)55-(CaO)25-(Na2O)20 55.0 25.0 20.0 0.0
BP40CNT20 (P2O5)40-(CaO)25-(Na2O)15-(TiO2)20 40.0 25.0 15.0 20.0
BP40CNT25 (P2O5)40-(CaO)25-(Na2O)10-(TiO2)25 40.0 25.0 10.0 25.0
BP40CNT30 (P2O5)40-(CaO)25-(Na2O)5-(TiO2)30 40.0 25.0 5.0 30.0
BP55CNT5 (P2O5)55-(CaO)25-(Na2O)15-(TiO2)5 55.0 25.0 15.0 5.0
BP55CNT10 (P2O5)55-(CaO)25-(Na2O)10-(TiO2)10 55.0 25.0 10.0 10.0
BP55CNT15 (P2O5)55-(CaO)25-(Na2O)5-(TiO2)15 55.0 25.0 5.0 15.0
3.2. Materials and methods
3.2.1. Materials
The precursors used have been reported in section 2.2.1. However, instead of
triethyl phosphate, n-butyl phosphate (1:1 molar ratio of mono and di-n-butyl
phosphate, 98%, Alfa Aesar, Heysham, UK) was used without further purification to
prepare ternary P2O5-CaO-Na2O and quaternary P2O5-CaO-Na2O-TiO2 glass
systems. Figure 3.1 shows the structural formula of n-butyl phosphate.

CHAPTER 3
113
Figure 3.1. Structural formula of n-butyl phosphate; a mixture of (a) mono butyl
phosphate (C4H11O4P) and (b) di-butyl phosphate (C8H19O4P).
3.2.2. Sol-gel synthesis methods
Similar sol-gel synthesis methods that were described previously in sections 2.2.2.3
and 2.2.2.4, were used to prepare ternary and quaternary phosphate-based
glasses. The sol-gel preparation of ternary P2O5-CaO-Na2O and quaternary P2O5-
CaO-Na2O-TiO2 glass systems is outlined schematically in Figure 3.2.
(a) (b)
PO
OOH
OH
CH3PO
OO
OH
CH3CH3

CHAPTER 3
114
Figure 3.2. Schematic sol-gel synthesis of; (A) ternary P2O5-CaO-Na2O and (B)
quaternary P2O5-CaO-Na2O-TiO2 samples using n-butyl phosphate as a
phosphorus precursor.
3.2.3. Drying procedure
The obtained homogeneous solutions were transferred into glass containers and
heat treated similar to the previously explained method in section 2.2.3.

CHAPTER 3
115
3.2.4. Structural characterisation methods
3.2.4.1. XRD and EDX
XRD and EDX characterisation methods were carried out on glass powders as
previously reported in sections 2.2.4.1.1 and 2.2.4.2.1.
3.2.4.2. 31P MAS-NMR and FTIR spectroscopy
31P MAS-NMR and FTIR spectroscopy characterisation methods were carried out
on glass powders as explained in sections 2.2.4.3.1 and 2.2.4.4.1
3.3. Results
3.3.1. Sample preparation
All samples in both ternary and quaternary systems turned to gel within the first 5
minutes at room temperature. Bulk, transparent and glassy-like specimens with few
cracks were obtained for glasses with TiO2 content of 15 mol% for glasses with 55
mol% P2O5, and 25 or 30 mol% TiO2 for glasses with P2O5 content at 40 mol% (Fig.
3.3). However, for ternary sol-gel synthesised glasses in the P2O5-CaO-Na2O
system, it was not possible to make bulk specimens. A summary of the effect of the
drying procedure in ternary and quaternary glasses is shown in Table 3.2.

CHAPTER 3
116
Figure 3.3. Photographs of; A) BP40CNT25, B) BP40CNT30, and C) BP55CNT15 sol-
gel derived samples. The scale bar for A, B, and C is 1 cm.
Table 3.2. The effect of drying procedure in ternary P2O5-CaO-Na2O and
quaternary P2O5-CaO-Na2O-TiO2 sol-gel derived samples using n-butyl phosphate
as a phosphorus precursor.
Sample
code
Gelation at room
temperature
Transparency Bulk and
crack-free sample
BP55CN10 ! ! Heavily cracked
BP55CN15 ! ! Heavily cracked
BP55CN20 ! ! Heavily cracked
BP40CNT20 ! ! Heavily cracked
BP40CNT25 ! ! Few cracks
BP40CNT30 ! ! Few cracks
BP55CNT5 ! ! Heavily cracked
BP55CNT10 ! ! Heavily cracked
BP55CNT15 ! ! Few cracks
A
C
B

CHAPTER 3
117
3.3.2. XRD
Figures 3.4 and 3.5 show the XRD patterns of ternary P2O5-CaO-Na2O and
quaternary P2O5-CaO-Na2O-TiO2 sol-gel derived samples, respectively. For both
systems the XRD patterns were free from any detectable crystalline phases with a
broad peak at 2θ values of between 20 and 40° that confirmed the amorphous and
glassy nature of the prepared samples.
Figure 3.4. XRD patterns of ternary P2O5-CaO-Na2O sol-gel derived samples using
n-butyl phosphate as a phosphorus precursor which are free from any detectable
crystalline phases.
BP55CN10
BP55CN15
BP55CN20
2-‐Theta/Degrees

CHAPTER 3
118
Figure 3.5. XRD patterns of quaternary P2O5-CaO-Na2O-TiO2 sol-gel derived
samples using n-butyl phosphate as a phosphorus precursor which showed no
evidence of any detectable crystalline phases.
3.3.3. EDX
The EDX results were converted to mol% of oxides of the elements to allow a
comparison to be made with the theoretical compositions and were reported in
Table 3.3. A reduction of 5.7-8.0 mol% P2O5 from the theoretical values was
observed for ternary glasses in the P2O5-CaO-Na2O system, with a concomitant
increase in the percentage content of the other oxides to compensate. While, for
quaternary glasses in the P2O5-CaO-Na2O-TiO2 system, as titanium was substituted
BP55CNT15
BP55CNT10
BP55CNT5
BP40CNT30
BP40CNT25
BP40CNT20
2-‐Theta/Degrees

CHAPTER 3
119
in place of sodium, the amount of P2O5 loss decreased to 3.8-5.4 mol% from the
theoretical values.
Table 3.3. Intended compositions and measured values of sol-gel derived glasses
using n-butyl phosphate as a phosphorus precursor determined by EDX (in
parentheses).
Sample
code
P2O5
(mol%)
CaO
(mol%)
Na2O
(mol%)
TiO2
(mol%)
BP55CN10 55.0 (49.3±1.1) 35.0 (38.6±1.2) 10.0 (12.1±0.7) 0.0
BP55CN15 55.0 (48.1±1.3) 30.0 (34.6±1.4) 15.0 (17.3±0.8) 0.0
BP55CN20 55.0 (47.0±1.0) 25.0 (30.8±0.9) 20.0 (22.2±0.6) 0.0
BP40CNT20 40.0 (35.6±1.2) 25.0 (26.9±0.8) 15.0 (16.4±0.8) 20.0 (21.1±0.7)
BP40CNT25 40.0 (35.9±1.3) 25.0 (26.9±1.0) 10.0 (11.2±0.9) 25.0 (26.0±0.8)
BP40CNT30 40.0 (36.2±1.1) 25.0 (26.7±0.9) 5.0 (5.9±0.7) 30.0 (31.2±0.8)
BP55CNT5 55.0 (49.6±1.0) 25.0 (27.2±0.7) 15.0 (16.7±0.8) 5.0 (6.5±0.9)
BP55CNT10 55.0 (50.2±1.2) 25.0 (27.0±0.8) 10.0 (11.5±0.7) 10.0 (11.3±0.7)
BP55CNT15 55.0 (50.9±1.1) 25.0 (26.5±0.6) 5.0 (6.1±0.6) 15.0 (16.5±1.0)
3.3.4. 31P MAS-NMR 31P MAS-NMR spectra of ternary P2O5-CaO-Na2O and quaternary P2O5-CaO-Na2O-
TiO2 sol-gel derived glasses are shown in Figure 3.6 and peak parameters are
summarised in Table 3.4. Peaks in the range of -9.9 to -10.8 ppm are attributed to
Q1 phosphate units, while peaks in the range of -21.9 to -23.9 ppm correspond to
Q2 species (Lee et al., 2013, Foroutan et al., 2015). Additional peaks in quaternary
glasses in the range of -0.2 to -1.2 ppm and -13.6 to -14.8 ppm are attributed to Q0
and Q1(Ti-O-P) phosphate units, respectively (Foroutan et al., 2015).

CHAPTER 3
120
Figure 3.6. 31P MAS-NMR spectra of; (a) ternary P2O5-CaO-Na2O and (b)
quaternary P2O5-CaO-Na2O-TiO2 sol-gel derived glasses using n-butyl phosphate
as a phosphorus precursor. The peaks correspond to mainly Q1 and Q2 phosphate
units. The asterisks denote spinning sidebands.
BP55CN10
BP55CN15
BP55CN20
BP55CNT15
BP55CNT10
BP55CNT5
BP40CNT30
BP40CNT25
BP40CNT20
a)
b)
Q1 Q2
Q1 Q2
* * *
* * *
*
*
* * * *
* * * * *
*
* * *
*
*
* *
* * * * *
*
*
*
*
* * * * *
*
*
*
* *
*
*
*
* * *
* *
*

CHAPTER 3
121
Table 3.4. 31P MAS-NMR peak parameters of ternary P2O5-CaO-Na2O and
quaternary P2O5-CaO-Na2O-TiO2 sol-gel derived glasses using n-butyl
phosphate as a phosphorus precursor.
Sample
code
Position
(ppm, ±0.2)
Qi
species
Line width
(ppm, ±0.2)
Abundance
(%, ±1.0)
BP55CN10 -10.2 1 8.0 32.9
-22.8 2 9.2 67.1
BP55CN15 -10.1 1 8.1 32.1
-22.5 2 9.4 67.9
BP55CN20 -9.9 1 8.3 30.4
-22.3 2 9.4 69.6
BP40CNT20 -0.2 0 6.8 4.1
-10.0 1 9.5 41.3
-14.1 1 9.6 33.2
-21.9 2 11.2 21.4
BP40CNT25 -0.8 0 7.4 3.4
-10.1 1 9.7 37.4
-14.4 1 9.9 35.7
-22.5 2 11.7 23.5
BP40CNT30 -1.2 0 7.7 2.0
-10.3 1 9.8 29.1
-14.8 1 9.9 40.8
-22.8 2 11.8 28.1
BP55CNT5 -9.9 1 8.5 21.3
-13.6 1 8.3 4.3
-23.2 2 12.4 74.4
BP55CNT10 -10.1 1 8.9 12.5
-14.0 1 8.4 7.9
-23.2 2 13.1 79.6
BP55CNT15 -10.3 1 9.4 6.1
-14.1 1 9.6 9.7
-23.8 2 13.6 84.2

CHAPTER 3
122
3.3.5. FTIR spectroscopy
FTIR spectra of ternary P2O5-CaO-Na2O and quaternary P2O5-CaO-Na2O-TiO2 sol-
gel derived glasses are shown in Figure 3.7. Peak assignments were acquired and
listed in Table 3.5 according to the previous FTIR spectroscopy studies on
phosphate-based glasses (Baia et al., 2007, Byun et al., 1995, Ilieva et al., 2001,
Moustafa and El-Egili, 1998, Sene et al., 2004, Pickup et al., 2007). Peaks in the
range between 720 and 730 cm-1 are assigned to symmetrical stretching ʋs (P-O-P)
mode, while, peaks between 890 and 900 cm-1 are assigned to asymmetrical
stretching ʋas (P-O-P) mode (Q2 phosphate units). Peaks in the range between 980
to 990 cm-1 are assigned to symmetrical stretching ʋs (PO3)2- mode (Q1 phosphate
units). In addition, peaks in the range of 1090 to 1100 and 1230 to 1240 cm-1 are
assigned to asymmetrical ʋas (PO3) 2- and ʋas (PO2)- modes that can be related to Q1
and Q2 phosphate units, respectively.
Table 3.5. Infrared band assignment of phosphate-based sol-gel derived
glasses using n-butyl phosphate as a phosphorus precursor.
Wavenumber
(cm-1)
Assignments Associated
Qi
720-730 ʋs (P-O-P) N/A
890-900 ʋas (P-O-P) Q2
980-990 ʋs (PO3)2- Q1
1090-1100 ʋas (PO3)2- Q1
1230-1240 ʋas (PO2)- Q2
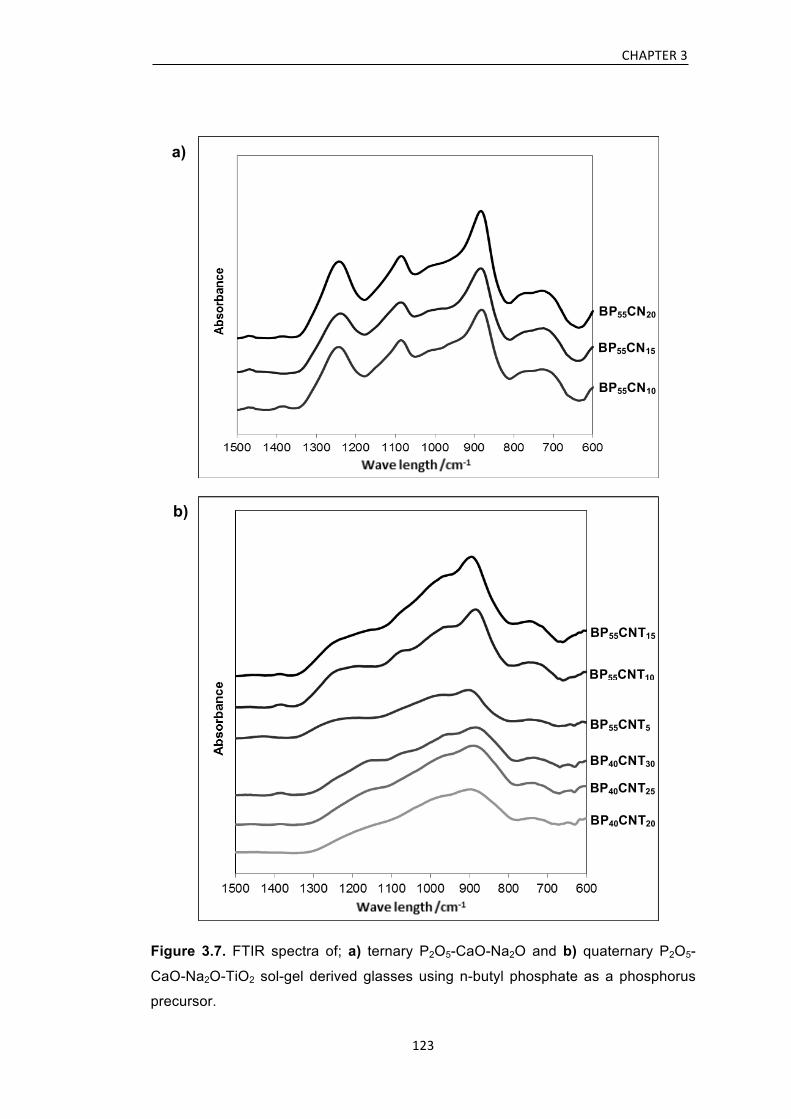
CHAPTER 3
123
Figure 3.7. FTIR spectra of; a) ternary P2O5-CaO-Na2O and b) quaternary P2O5-
CaO-Na2O-TiO2 sol-gel derived glasses using n-butyl phosphate as a phosphorus
precursor.
BP55CN10
BP55CN15
BP55CN20
BP55CNT15
BP55CNT10
BP55CNT5
BP40CNT30
BP40CNT25
BP40CNT20
a)
b)

CHAPTER 3
124
3.4. Discussion
In this chapter, phosphate-based sol-gel derived glasses in the P2O5-CaO-Na2O and
P2O5-CaO-Na2O-TiO2 systems were successfully synthesised by using n-butyl
phosphate as a phosphorus precursor. The gelation time in the sol-gel reaction was
much reduced compared to the sol-gel synthesised glasses with similar
compositions in chapter 2. The high reactivity of n-butyl phosphate can be related to
the –OH group which provided enough water for the sol-gel reaction. The XRD
patterns for both systems were free from any detectable crystalline phase, which
confirmed the amorphous and glassy nature of the prepared samples. This finding
indicates a successful glass production by using n-butyl phosphate as a phosphorus
precursor.
EDX results revealed a relatively lower phosphorus loss during the sol-gel synthesis
compared to the previously synthesised glasses in chapter 2 with similar
compositions. This can be related to the higher molecular weight and reactivity of n-
butyl phosphate in comparison with triethyl phosphate as a phosphorus precursor.
Substituting titanium in place of sodium also reduced the amount of phosphorus
reduction that was due to the cross-linking effect of titanium in the phosphate
network. The 31P MAS-NMR study confirmed that the sol-gel synthesised glasses
consist of mainly Q1 and Q2 phosphate units and as sodium was replaced with
titanium, the glass network became more interconnected with higher levels of Q2
species. Data for the chemical shifts also showed a change to more negative values
as the Ti content increased. This is due to the formation of several cross-links
between Ti4+ and oxygen sites, unlike Na+ ions. As more cross-links are formed, the
charge on the oxygen is displaced away from P_O bonds that leading to more
shielded nuclei and producing a change in chemical shift. Analysis of the Q2 species
line width revealed an increase as titanium substituted in place of sodium indicating
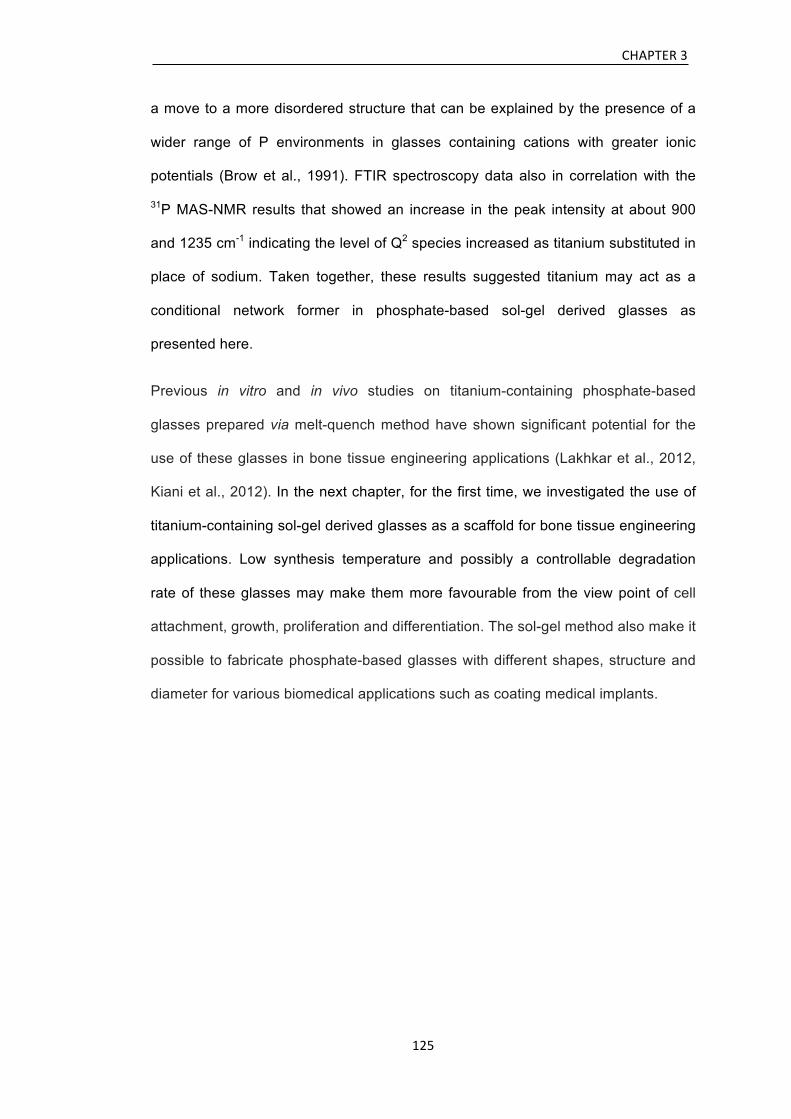
CHAPTER 3
125
a move to a more disordered structure that can be explained by the presence of a
wider range of P environments in glasses containing cations with greater ionic
potentials (Brow et al., 1991). FTIR spectroscopy data also in correlation with the
31P MAS-NMR results that showed an increase in the peak intensity at about 900
and 1235 cm-1 indicating the level of Q2 species increased as titanium substituted in
place of sodium. Taken together, these results suggested titanium may act as a
conditional network former in phosphate-based sol-gel derived glasses as
presented here.
Previous in vitro and in vivo studies on titanium-containing phosphate-based
glasses prepared via melt-quench method have shown significant potential for the
use of these glasses in bone tissue engineering applications (Lakhkar et al., 2012,
Kiani et al., 2012). In the next chapter, for the first time, we investigated the use of
titanium-containing sol-gel derived glasses as a scaffold for bone tissue engineering
applications. Low synthesis temperature and possibly a controllable degradation
rate of these glasses may make them more favourable from the view point of cell
attachment, growth, proliferation and differentiation. The sol-gel method also make it
possible to fabricate phosphate-based glasses with different shapes, structure and
diameter for various biomedical applications such as coating medical implants.

CHAPTER 3
126
References
BAIA, L., MURESAN, D., BAIA, M., POPP, J. & SIMON, S. 2007. Structural
properties of silver nanoclusters-phosphate glass composites. Vibrational
Spectroscopy, 43, 313-318.
BROW, R. K., PHIFER, C. C., TURNER, G. L. & KIRKPATRICK, R. J. 1991. Cation
Effects on P-31 Mas Nmr Chemical-Shifts of Metaphosphate Glasses.
Journal of the American Ceramic Society, 74, 1287-1290.
BYUN, J. O., KIM, B. H., HONG, K. S., JUNG, H. J., LEE, S. W. & IZYNEEV, A. A.
1995. Properties and Structure of Ro-Na2o-Al2o3-P2o5 (R=Mg, Ca, Sr, Ba)
Glasses. Journal of Non-Crystalline Solids, 190, 288-295.
CARTA, D., PICKUP, D. M., KNOWLES, J. C., SMITH, M. E. & NEWPORT, R. J.
2005. Sol-gel synthesis of the P(2)O(5)-CaO-Na(2)O-SiO(2) system as a
novel bioresorbable glass. Journal of Materials Chemistry, 15, 2134-2140.
CLAYDEN, N. J., ESPOSITO, S., PERNICE, P. & ARONNE, A. 2001. Solid state Si-
29 and P-31 NMR study of gel derived phosphosilicate glasses. Journal of
Materials Chemistry, 11, 936-943.
FOROUTAN, F., DE LEEUW, N., MARTIN, R., PALMER, G., OWENS, G., KIM, H.-
W. & KNOWLES, J. 2015. Novel sol–gel preparation of (P2O5)0.4–
(CaO)0.25–(Na2O)X–(TiO2)(0.35−X) bioresorbable glasses (X = 0.05, 0.1,
and 0.15). Journal of Sol-Gel Science and Technology, 73, 434-442.
ILIEVA, D., JIVOV, B., KOVACHEVA, D., TSACHEVA, T., DIMITRIEV, Y.,
BOGACHEV, G. & PETKOV, C. 2001. FT-IR and Raman spectra of Gd
phosphate crystals and glasses. Journal of Non-Crystalline Solids, 293, 562-
568.
KIANI, A., LAKHKAR, N. J., SALIH, V., SMITH, M. E., HANNA, J. V., NEWPORT,
R. J., PICKUP, D. M. & KNOWLES, J. C. 2012. Titanium-containing
bioactive phosphate glasses. Philosophical Transactions of the Royal
Society a-Mathematical Physical and Engineering Sciences, 370, 1352-
1375.
LAKHKAR, N. J., PARK, J. H., MORDAN, N. J., SALIH, V., WALL, I. B., KIM, H. W.,
KING, S. P., HANNA, J. V., MARTIN, R. A., ADDISON, O., MOSSELMANS,
J. F. W. & KNOWLES, J. C. 2012. Titanium phosphate glass microspheres
for bone tissue engineering. Acta Biomaterialia, 8, 4181-4190.
LEE, B. I., SAMUELS, W. D., WANG, L. Q. & EXARHOS, G. J. 1996. Sol-gel
synthesis of phosphate ceramic composites .1. Journal of Materials
Research, 11, 134-143.

CHAPTER 3
127
LEE, I. H., FOROUTAN, F., LAKHKAR, N. J., GONG, M. S. & KNOWLES, J. C.
2013. Sol-gel synthesis and structural characterization of P2O5-CaO-Na2O
glasses. Physics and Chemistry of Glasses-European Journal of Glass
Science and Technology Part B, 54, 115-120.
LIVAGE, J., BARBOUX, P., VANDENBORRE, M. T., SCHMUTZ, C. & TAULELLE,
F. 1992. Sol-Gel Synthesis of Phosphates. Journal of Non-Crystalline Solids,
147, 18-23.
MOUSTAFA, Y. M. & EL-EGILI, K. 1998. Infrared spectra of sodium phosphate
glasses. Journal of Non-Crystalline Solids, 240, 144-153.
PICKUP, D. M., GUERRY, P., MOSS, R. M., KNOWLES, J. C., SMITH, M. E. &
NEWPORT, R. J. 2007. New sol-gel synthesis of a (CaO)(0.3)(
Na2O)(0.2)(P2O5)(0.5) bioresorbable glass and its structural
characterisation. Journal of Materials Chemistry, 17, 4777-4784.
SENE, F. F., MARTINELLI, J. R. & GOMES, L. 2004. Synthesis and
characterization of niobium phosphate glasses containing barium and
potassium. Journal of Non-Crystalline Solids, 348, 30-37.

CHAPTER 4
128
CHAPTER 4
Titanium-Stabilised Sol-Gel Derived Glasses for Bone
Tissue Engineering Applications

CHAPTER 4
129
4.1. Introduction
Providing cells with an environment that they can continue their normal functionality
is one of the most important issues in tissue regeneration. Bioactive and
biodegradable materials are favourable due to their ability to break down and
stimulate formation of novel extracellular matrix, and eventually tissue (Langer and
Vacanti, 1993, Hench and Polak, 2002). Phosphate-based glasses, as explained
previously, are bioresorbable materials with a controllable degradation rate that
makes them an excellent choice for various biomedical applications (Knowles,
2003). These glasses offer an advantageous alternative to silica-based sol-gel
derived glasses, with a more controllable degradation rate and easily metabolised
dissolution products (Navarro et al., 2003, Hamadouche et al., 2001).
The biocompatibility and degradation rate of phosphate-based melt-derived glasses
with the general formula of P2O5–CaO–Na2O and P2O5–CaO–Na2O–TiO2 have
been extensively studied for a variety of biomedical applications (Navarro et al.,
2002, Kiani et al., 2012, Franks et al., 2000). These studies confirmed that the
addition of TiO2 can significantly reduce the dissolution rate because of the
formation of (Ti-O-P) bonds and the release of titanium may also enhance the
biological response and make them a good choice in tissue engineering
applications from the viewpoint of cell attachment, growth, proliferation and
differentiation (Kiani et al., 2012, Lakhkar et al., 2012). The release of other ions
such as Ca2+ can also stimulate cellular behaviour such as proliferation and bone
formation (Knowles, 2003, Navarro et al., 2003, Franks et al., 2000). However, few
studies exist concerning the preparation of titanium stabilised sol-gel derived
phosphate glasses (Pickup et al., 2008b, Foroutan et al., 2015).
The sol-gel method allows more control over glass morphology in comparison with
the melt-derived glasses, which is of fundamental importance in tissue regeneration

CHAPTER 4
130
(Hench, 1997). In addition, the low processing temperature (200 °C) of the sol-gel
synthesis enables incorporation of bioactive molecules for drug delivery
applications, which is not possible with phosphate-based glasses formed by the
melt-quench technique, as this requires higher processing temperatures (~1,000
°C) and therefore results in degradation of the organic components (Pickup et al.,
2012, Lee et al., 2013, Kiani et al., 2012). However, to date, no studies have been
published regarding the potential use of phosphate-based sol-gel derived glasses in
tissue regeneration applications.
Phosphate-based sol-gel derived glasses with the general formula (P2O5)55–
(CaO)25–(Na2O)(20-x)–(TiO2)x, where X = 0, 5, 10 or 15 were synthesised and the
XRD, EDX, 31P MAS-NMR, and FTIR spectroscopy results were reported in
Chapter 3. Here, the pH change and ion release were quantified during the storage
of samples in deionised water at 37 °C. Cytocompatibility was also assessed and
cellular interaction with the surface of the glass particles was imaged using
scanning electron microscopy (SEM) and confocal laser scanning microscopy
(CLSM).
4.2. Aims
In this chapter, we investigated the potential use of titanium containing phosphate-
based glasses for tissue regeneration applications. Since incorporation of titanium
into the phosphate-based sol-gel derived glasses serves to stabilise the phosphate-
network due to the cross-linking effect of titanium, greater control over the
dissolution rate of these glasses would be expected, which could match with the
bone tissue regeneration. In addition, the sol-gel method allows more control over
glass morphology, which is of fundamental importance in tissue regeneration.

CHAPTER 4
131
4.3. Materials and methods
4.3.1. Sol-gel synthesis
A total of four glass compositions (Table 4.1) were successfully synthesised as
previously described in section 3.2. The obtained sol-gel derived glasses were
ground to form microparticles (MM301 milling machine, Retsch GmbH, Hope, UK).
Microparticles in the size range of 106–150 µm were obtained using test sieves
(Endecotts Ltd, London, UK) and a sieve shaker (Spartan, Fritsch GmbH, Brackley,
UK).
Table 4.1. The theoretical compositions of phosphate-based sol-gel derived
glasses using n-butyl phosphate as a phosphorus precursor.
Sample
code
Theoretical composition Concentration (mol%)
P2O5 CaO Na2O TiO2
Ti0 (P2O5)55-(CaO)25-(Na2O)20 55.0 25.0 20.0 0.0
Ti5 (P2O5)55-(CaO)25-(Na2O)15-(TiO2)5 55.0 25.0 15.0 5.0
Ti10 (P2O5)55-(CaO)25-(Na2O)10-(TiO2)10 55.0 25.0 10.0 10.0
Ti15 (P2O5)55-(CaO)25-(Na2O)5-(TiO2)15 55.0 25.0 5.0 15.0
4.3.2. pH change measurement
Specimens of each glass composition (25 mg, n = 3) were immersed in 5.5 mL
deionised water (the pH adjusted to 7.0 ± 0.1 using NH4OH or HCl) and stored at 37
°C (Compact Incubator, LEEC, Nottingham, UK) for up to 7 days. The pH of the
solution was measured after 0, 1, 3 and 7 days (Orion pH Meter, Thermo scientific-
Orion star, UK) fitted with a pH glass electrode. The pH meter was calibrated using
standard solutions of pH 4, 7, and 10 before use. At each time-point, the particles
were centrifuged at 4,000 rpm for 10 minutes, in order to separate them from the

CHAPTER 4
132
solution. The supernatant was aspirated and the particles dried in an oven (IP100-
LTE Scientific, Oldham, UK) at 60 °C for 3 hours, before they were resuspended in
fresh deionised water.
4.3.3. Ion release measurement
Specimens of each glass composition (50 mg, n = 3) were immersed in 11 mL
deionised water (pH 7.0 ± 0.1) and stored at 37 °C (Compact Incubator, LEEC,
Nottingham, UK) for up to 7 days. At each time-point, glass suspensions were
centrifuged at 4,000 rpm for 20 minutes, in order to separate them from the
solution. The supernatant was collected and the particles dried in an oven (IP100-
LTE Scientific, Oldham, UK) at 60 °C for 3 hours, before replenishment with fresh
deionised water.
4.3.3.1. Cation release
The release of cations (Na+ and Ca2+) from glass microparticles was quantified after
0, 1, 3 and 7 days using an ICS-1000 ion chromatography system (Dionex, Surrey,
UK) equipped with a 4 x 250 mm Ion Pac® CS12A column operating under
suppressed conductivity, with 20 mM methanesulfonic acid (Fluka, Dorset, UK)
eluent to separate cations based on their affinity to the ion exchanging resin. The
sample solutions were passed through a Dionex OnGuard IIA filter (Dionex, Thermo
Scientific, Hemel Hempstead, UK) prior injection through the column to eliminate
anions that bind to the cation column. Also, before performing the analysis, the
system was calibrated against a four-point calibration curve with a predefined
calibration program from standard solutions provided by the manufacturer (Dionex,

CHAPTER 4
133
Surrey, UK). Data analyses were performed in relation to standard solutions using
the Chromeleon® software package (Dionex Surrey, UK).
4.3.3.2. Anion release
The release of anions (PO43-, P2O7
4-, P3O93-, and P3O10
5-) from glass microparticles
was quantified after 0, 1, 3 and 7 days using an ICS-2500 system (Dionex, Surrey,
UK) equipped with a 4 x 250 mm Ion Pac® AS16 column which separating them
based on their interaction with anion exchange resin. Isocratic separation was
applied with a linear potassium hydroxide (KOH) gradient of between 30–50 mM
over a 35 minute period provided by an EG50 eluent generator. Similar to the cation
release measurement, the system was calibrated against a four-point calibration
curve before carrying out the sample run for each time points from standard
solutions. Standard solutions were prepared using sodium phosphate, trisodium
trimetaphosphate, pentasodium tripolyphosphate (Sigma-Aldrich, Dorset, UK) and
tetrasodium pyrophosphate (BDH, Poole, UK) as the reagents. Similar to the cation
release measurements, the Chromeleon® software package was used for data
analysis.
4.3.4. Cell studies
4.3.4.1. Cell culture
Human osteoblast-like osteosarcoma cell line (MG-63, European Collection of Cell
Cultures, Porton Down, UK) was cultured under standard conditions (37 °C, 95 %
air, 5 % CO2, 95 % relative humidity) in Dulbecco’s modified Eagle medium that
contains 4 mM L-glutamine, 4500 mg/L glucose, 1 mM sodium pyruvate, and 1500
mg/L sodium bicarbonate (DMEM, Gibco, Life Technologies, Paisley, UK)

CHAPTER 4
134
supplemented with 10 % foetal bovine serum (Gibco Life Technologies, Paisley,
UK). The growth process was carried out until the cells reached at 80-90 %
confluency.
4.3.4.2. Cytocompatibility assay
In order to assess the effect of TiO2 content of the sol-gel derived glasses on
cytocompatibility, MG-63 cells were cultured on the microparticles. The materials
were sterilised using dry heat at a temperature of 180 °C for 2 hours in a sealed
glass vial with aluminium foil and left to cool overnight. The sol-gel glass particles (5
mg per specimen) were evenly distributed across permeable cell culture supports in
48 well plates (Transwell, Corning B.V. Lifesciences, Amsterdam, Netherlands), in
order to enable facile processing of the specimens for SEM and confocal
microscopy after the final time-point. Cells were seeded on the particles at a density
of 30,000 cells/cm2 (10,000 cells/well) and cell culture medium was added to the
cell culture support and the bulk of the well (1.1 mL total). Controls consisted of
cells seeded directly on cell culture supports. Each sample type was analysed in
triplicate. Cytocompatibility was assessed after 1, 3 and 7 days. At each time-point,
cells were seeded at various densities, 2 hours prior to the assay, for the
preparation of standard curves. The medium was then aspirated from the samples
and standards and replaced with 1 mL medium containing 10 vol% water soluble
tetrazolium salt-8 (WST-8, Cell Counting Kit-8, Sigma Aldrich, Gillingham, UK).
WST-8 is a pink substrate, which is metabolised in the mitochondria to form an
orange formazan product. After 80 min incubation at 37 °C, absorbance at 460 nm
(with a reference wavelength of 650 nm) was measured (Infinite M200, Tecan,
Männedorf, Switzerland). The apparent cell density of the samples was
extrapolated from the standard curves. The WST-8 containing medium was then

CHAPTER 4
135
aspirated and replaced with fresh cell culture medium until the next time-point.
Following the final time-point, cells residing on the microparticles were imaged by
SLCM and SEM.
4.3.4.3. Cell and particle imaging
Specimens consisting of MG-63 cells cultured on the glass microparticles for 7 days
were fixed by replacing the medium with a 3% glutaraldehyde (Sigma-Aldrich, UK)
in 0.14 M sodium cacodylate buffer solution (pH 7.3, Sigma-Aldrich, UK) and kept at
4 °C overnight before dehydration through a graded series of ethanol solutions
according to the following regimen: 50% ethanol for 10 minutes, 70% ethanol for 10
minutes, 90% ethanol for 10 minutes and 100% ethanol for 10 minutes (2 times).
The final drying was done by hexamethyldisilazane (Sigma-Aldrich, UK) for 1-2
minutes and then the plate was left to dry overnight in a desiccator. It should be
noted that all of the above mentioned steps were performed very carefully to
minimise the detachment of cells from the glass micoparticles. The membranes
were carefully excised using a scalpel and mounted onto carbon adhesive discs
attached to aluminium stubs. The specimens were then sputter-coated with gold-
palladium alloy by a Polaron E5100 coating device (Polaron CVT, Milton Keynes,
UK) and imaged using a scanning electron microscope (Philips-XL30 instrument,
Netherland) with an accelerating voltage of 5 kV and working distance of 10 mm at
various magnifications.
Cells residing on the glass microparticles were imaged using confocal laser
scanning microscopy (CLSM) after 7 days culture. The cytoskeleton (actin
filaments) and nuclei of the cells were fluorescently stained using Alexa Fluor 488
phalloidin (Invitrogen, UK) and propidium iodide (BD Biosciences, UK), respectively.

CHAPTER 4
136
Specimens were prepared by fixation in 4% paraformaldehyde, followed by two
washes using Dulbecco’s phosphate buffered saline (D-PBS, Lonza, Slough, UK).
Cells were then permeabilised using a 0.1 vol% solution of Triton X-100 (Sigma-
Aldrich) in D-PBS for 5–10 minutes at room temperature. A 2.5 vol% solution of
phalloidin methanolic stock solution in D-PBS was then added to each specimen
and incubated for 20 minutes at room temperature in a dark environment, in order
to minimise evaporation and photo-bleaching. After a further two washes with D-
PBS, specimens were counter-stained using 1 µg.mL-1 propidium iodide (BD
Biosciences, Oxford, UK) for 10 minutes, before visualisation by CLSM (Biorad,
Hemel Hempstead, UK).
4.4. Results
4.4.1. pH change measurement
The pH of the dissolution products of all glass compositions reduced significantly
over the first 24 hours, as shown in Figure 4.1. A more gradual decrease in pH
progressed during the remainder of the immersion period. Increasing TiO2 content
reduced the extent and rate of pH decrease, although there was little difference
between Ti5, Ti10 and Ti15.

CHAPTER 4
137
Figure 4.1. pH measurement after 0, 1, 3 and 7 days immersion of sol-gel derived
glass microparticles in deionised water that shows significant decrease in pH after
24 hours. Error bars represent the standard deviation of three samples.
4.4.2. Ion release measurement
Figure 4.2 illustrates the release of cations (Ca2+ and Na+) and anions (P2O74-,
P3O105-, P3O9
3- and PO43-) from the sol-gel derived glass microparticles. As
expected, higher concentrations of Ca2+ were detected in samples collected from
Ti0 glass microparticles. There was a significant decrease in the Ca2+ release rate
with an increase in the TiO2 content from 0 to 15 mol%. Likewise, Na+ release
showed a clear distinction between each glass composition. Glasses with lower Na+
content released less Na+ into solution. The release of Ti4+ was also investigated
but was below the detectable range. Similarly, the release of P2O74- and P3O10
5-
anions correlated directly with TiO2 content, with increasing Ti resulting in
decreasing release. P3O93- and PO4
3- release, however, followed trends that were
distinct from a direct relationship with Ti content. Ti5 and Ti10 demonstrated higher
P3O93- release than Ti0 and Ti15. Conversely, the release of PO4
3- from Ti0 and Ti5
was markedly lower than from Ti10 and Ti15.

CHAPTER 4
138
Figure 4.2. Cumulative release of (a) Ca2+and (b) Na+ cations and (c) P2O74-, (d)
P3O105-, (e) P3O9
3- and (f) PO43- anions from sol-gel derived glass microparticles
after 1, 3 and 7 days storage in deionised water. Error bars represent the standard
deviation of three samples.

CHAPTER 4
139
4.4.3. Cytocompatibility
The cytocompatibility of the sol-gel derived glasses is presented in Figure 4.3. The
control (MG-63 on cell culture supports) approximately doubled in apparent cell
density at each time-point, reaching 217,000 cells/cm2 by day 7. The apparent
density of cells cultured on glass particles remained low after 1 and 3 days. Ti0
caused cells to approximately halve in number within the first day, with little
subsequent recovery. Cells cultured on Ti5 and Ti10 had a low apparent cell
density after 1 and 3 days, but this recovered to 135,000 and 212,000 cells/cm2 by
day 7, respectively. Ti15, however, had poor cytocompatibility, with cells failing to
recover even after 7 days.
Figure 4.3. Cytocompatibility of glass microparticles containing 0, 5, 10 or 15 mol%
Ti with MG-63 cells at 1, 3 and 7 days. Dotted line represents an initial seeding
density. Error bars represent the standard deviation of three samples.

CHAPTER 4
140
4.4.4. Cell and particle imaging
The morphology and size of the glass microparticles were identified by SEM
(Figure 4.4) after 7 days in cell culture. All compositions had a similar morphology,
with particles assuming a jagged but generally spherical form with diameters in the
range of ~0.5–2 µm and a rough surface topography. The control (A, B) shows a
monolayer of cells spread on the cell culture support (dark circular features are
pores). After 7 days in culture, Ti0 particles (C, D) had almost fully degraded and
therefore cells could not be visualised on the remaining small particles. Some cells
were visible on the surface of Ti5 particles (E, F), though this was much more
apparent on the surface of Ti10 (G–I). At high magnification, it was confirmed that
cells were proliferating and forming a very flattened morphology on the surface of a
Ti10 glass microparticles (I). Ti10 and Ti15 glass microparticles remained large,
having degraded little, though no cells were visible on Ti15 (J, K). Figure 4.5 shows
cells attached to Ti5 and Ti10 microparticles. Cells were not observed on Ti0 or
Ti15.

CHAPTER 4
141

CHAPTER 4
142
Figure 4.4. Scanning electron micrographs showing glass particles morphology and
cell attachment. (A, B) Control (cells on cell culture support), (C, D) Ti0, (E, F) Ti5,
(G-I) Ti10, and (J, K) Ti15.

CHAPTER 4
143
Figure 4.5. Confocal micrographs showing cells attached to glass microparticles
containing (A, B) 5 or (C, D) 10 mol% TiO2. The green fluorescent stain (phalloidin)
shows filamentous actin and red (propidium iodide) shows nuclei.
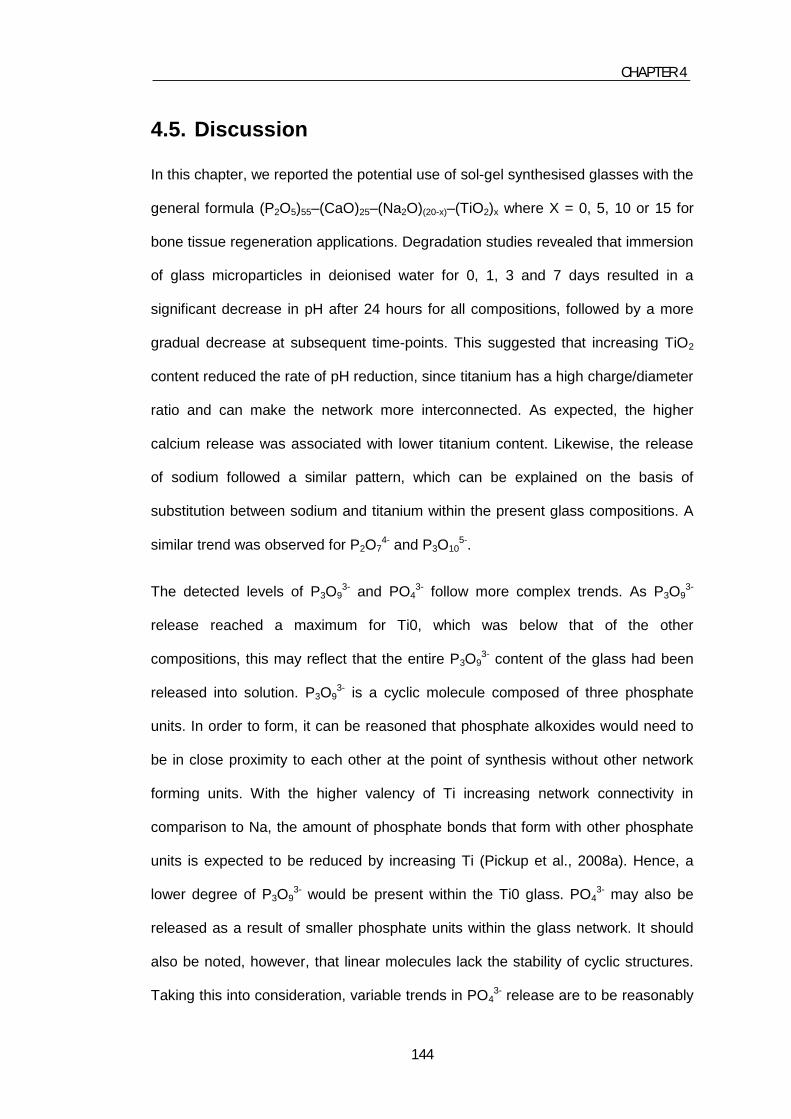
CHAPTER 4
144
4.5. Discussion
In this chapter, we reported the potential use of sol-gel synthesised glasses with the
general formula (P2O5)55–(CaO)25–(Na2O)(20-x)–(TiO2)x where X = 0, 5, 10 or 15 for
bone tissue regeneration applications. Degradation studies revealed that immersion
of glass microparticles in deionised water for 0, 1, 3 and 7 days resulted in a
significant decrease in pH after 24 hours for all compositions, followed by a more
gradual decrease at subsequent time-points. This suggested that increasing TiO2
content reduced the rate of pH reduction, since titanium has a high charge/diameter
ratio and can make the network more interconnected. As expected, the higher
calcium release was associated with lower titanium content. Likewise, the release
of sodium followed a similar pattern, which can be explained on the basis of
substitution between sodium and titanium within the present glass compositions. A
similar trend was observed for P2O74- and P3O10
5-.
The detected levels of P3O93- and PO4
3- follow more complex trends. As P3O93-
release reached a maximum for Ti0, which was below that of the other
compositions, this may reflect that the entire P3O93- content of the glass had been
released into solution. P3O93- is a cyclic molecule composed of three phosphate
units. In order to form, it can be reasoned that phosphate alkoxides would need to
be in close proximity to each other at the point of synthesis without other network
forming units. With the higher valency of Ti increasing network connectivity in
comparison to Na, the amount of phosphate bonds that form with other phosphate
units is expected to be reduced by increasing Ti (Pickup et al., 2008a). Hence, a
lower degree of P3O93- would be present within the Ti0 glass. PO4
3- may also be
released as a result of smaller phosphate units within the glass network. It should
also be noted, however, that linear molecules lack the stability of cyclic structures.
Taking this into consideration, variable trends in PO43- release are to be reasonably

CHAPTER 4
145
expected, as the PO43- detected in solution thus represents the accumulation of
PO43- released directly from the glass and PO4
3- formed by degradation of longer
chain polyphosphates in solution. These results are also corroborated by the initial
pH data collected. For example, highly acidic species such as P2O74- and P3O10
5-
were released in the greatest amount from the Ti0 glass and this particular
composition also induced the greatest pH reduction in solution (Montchamp, 2015).
Likewise, less acidic PO43- and P3O9
3- species were released in proportionally
greater amounts from those glasses which reduced the pH of the solution to a
lesser extent (Fluck, 1978).
The apparent cell density of MG-63 cells cultured on a layer of glass microparticles
was reduced in comparison to the cell culture support control after 1 and 3 days in
the case of all compositions. This was likely caused by the rapid decrease in pH
that occurred upon glass degradation. Although the pH change would have been
partially buffered by the cell culture medium, the more extreme drop in pH in Ti0
explains why the cells failed to recover and reach an initial seeding density. As Ti
content was increased from 0 to 5 or 10 mol%, the density of surviving cells
increased in parallel, due to the decrease in glass degradation and lower drop in
pH. The apparent density of cells residing on Ti5 after 7 days in culture had
recovered to ~60% that of the control, whereas cells cultured on Ti10 had
recovered to the same level as the control. Cells cultured on Ti15, however, failed
to recover. No cells were visible in the SEM or CLSM images and only low cell
densities were detected by WST-8.
Furthermore, of the anions investigated, only PO43- contributes to apatite formation,
whereas longer chain polyphosphates are known to inhibit crystal growth
(Driessens, 1982). As apatite formation is believed to promote cellular attachment
(Hu et al., 2013), the deposition of a mineral layer at the interface of the glass and it

CHAPTER 4
146
environment is a plausible explanation of the high cytocompatibility of Ti10. The
reduced survival of cells cultured on Ti15, however, requires further explanation.
Titanium has been shown to inhibit hydroxyapatite mineralization (Blumenthal and
Cosma, 1989). Higher release of Ti4+ from the Ti15 glass may have therefore
exceeded the biocompatibility threshold, preventing the formation of a
hydroxyapatite surface layer amenable to cellular growth. Alternatively, oxolation
and subsequent olation of Ti4+ could serve to induce microtemporal pH shifts in the
immediate vicinity of the glass surface. Again, higher release of Ti4+ from the Ti15
glass would exacerbate this effect. The other possibility can be related to the
greater retention of toxic residual solvents by the more highly cross-linked
composition. This possible explanation is beyond the scope of this study and would
require further investigation.
It is also worth noting that water-soluble cell proliferation assays such as WST-8
measure mitochondrial metabolic activity and only give an indication of cell density.
It is possible that the lower readings after 1 and 3 days may have been due to lower
metabolic activity as the cells attached to the unfamiliar particles and spread across
their surface. This would explain the large difference in apparent cell densities
between days 3 and 7. It is also possible that the layer of glass microparticles on
the cell culture support somewhat inhibited diffusion of nutrients across the
membrane, compared to the control.
These results were also supported by SEM and CLSM images, which showed cells
residing on Ti5 and Ti10 but not Ti0 or Ti15. Furthermore, scanning electron
micrographs showed significant mineral formation on the surface of Ti5 and Ti10.
Since bone cells strongly favour rough surface topographies for adhesion and
proliferation (Walters and Gentleman, 2015), the mineral content and morphology of
these compositions are likely to be the causes of their improved cytocompatibility.

CHAPTER 4
147
References
BLUMENTHAL, N. C. & COSMA, V. 1989. Inhibition of Apatite Formation by
Titanium and Vanadium Ions. Journal of Biomedical Materials Research-
Applied Biomaterials, 23, 13-22.
DRIESSENS, F. C. M. 1982. Mineral Aspects of Dentistry. Monographs in Oral
Science, Basel, Karger, 10.
FLUCK, E. 1978. Phosphor: Phosphorus. An Outline of its Chemistry, Biochemistry
and Technology. Von D. E. C. Corbridge. Elsevier Scientific Publ. Comp.,
Amsterdam-Oxford-New York 1978. VIII, 456 S., geb. Dfl. 146,—.
Nachrichten aus Chemie, Technik und Laboratorium, 26, 386-386.
FOROUTAN, F., DE LEEUW, N., MARTIN, R., PALMER, G., OWENS, G., KIM, H.-
W. & KNOWLES, J. 2015. Novel sol–gel preparation of (P2O5)0.4–
(CaO)0.25–(Na2O)X–(TiO2)(0.35−X) bioresorbable glasses (X = 0.05, 0.1,
and 0.15). Journal of Sol-Gel Science and Technology, 73, 434-442.
FRANKS, K., ABRAHAMS, I. & KNOWLES, J. C. 2000. Development of soluble
glasses for biomedical use Part I: In vitro solubility measurement. Journal of
Materials Science-Materials in Medicine, 11, 609-614.
HAMADOUCHE, M., MEUNIER, A., GREENSPAN, D. C., BLANCHAT, C.,
ZHONG, J. P. P., LA TORRE, G. P. & SEDEL, L. 2001. Long-term in vivo
bioactivity and degradability of bulk sol-gel bioactive glasses. Journal of
Biomedical Materials Research, 54, 560-566.
HENCH, L. L. 1997. Sol-gel materials for bioceramic applications. Current Opinion
in Solid State & Materials Science, 2, 604-610.
HENCH, L. L. & POLAK, J. M. 2002. Third-generation biomedical materials.
Science, 295, 1014-+.
HU, H. J., QIAO, Y. Q., MENG, F. H., LIU, X. Y. & DING, C. X. 2013. Enhanced
apatite-forming ability and cytocompatibility of porous and nanostructured
TiO2/CaSiO3 coating on titanium. Colloids and Surfaces B-Biointerfaces,
101, 83-90.
KIANI, A., LAKHKAR, N. J., SALIH, V., SMITH, M. E., HANNA, J. V., NEWPORT,
R. J., PICKUP, D. M. & KNOWLES, J. C. 2012. Titanium-containing
bioactive phosphate glasses. Philosophical Transactions of the Royal
Society a-Mathematical Physical and Engineering Sciences, 370, 1352-
1375.

CHAPTER 4
148
KNOWLES, J. C. 2003. Phosphate based glasses for biomedical applications.
Journal of Materials Chemistry, 13, 2395-2401.
LAKHKAR, N. J., PARK, J. H., MORDAN, N. J., SALIH, V., WALL, I. B., KIM, H. W.,
KING, S. P., HANNA, J. V., MARTIN, R. A., ADDISON, O., MOSSELMANS,
J. F. W. & KNOWLES, J. C. 2012. Titanium phosphate glass microspheres
for bone tissue engineering. Acta Biomaterialia, 8, 4181-4190.
LANGER, R. & VACANTI, J. P. 1993. Tissue Engineering. Science, 260, 920-926.
LEE, I. H., FOROUTAN, F., LAKHKAR, N. J., GONG, M. S. & KNOWLES, J. C.
2013. Sol-gel synthesis and structural characterization of P2O5-CaO-Na2O
glasses. Physics and Chemistry of Glasses-European Journal of Glass
Science and Technology Part B, 54, 115-120.
MONTCHAMP, J. L. 2015. Phosphorus Chemistry I: Asymmetric Synthesis and
Bioactive Compounds, Springer International Publishing.
NAVARRO, M., CLEMENT, J., GINEBRA, M. P., MARTINEZ, S., AVILA, G. &
PLANELL, J. A. 2002. Improvement of the stability and mechanical
properties of resorbable phosphate glasses by the addition of TiO2.
Bioceramics 14, 218-2, 275-278.
NAVARRO, M., GINEBRA, M. P. & PLANELL, J. A. 2003. Cellular response to
calcium phosphate glasses with controlled solubility. Journal of Biomedical
Materials Research Part A, 67A, 1009-1015.
PICKUP, D. M., ABOU NEEL, E. A., MOSS, R. M., WETHERALL, K. M., GUERRY,
P., SMITH, M. E., KNOWLES, J. C. & NEWPORT, R. J. 2008a. TiK-edge
XANES study of the local environment of titanium in bioresorbable TiO(2)-
CaO-Na(2)O-P(2)O(5) glasses. Journal of Materials Science-Materials in
Medicine, 19, 1681-1685.
PICKUP, D. M., NEWPORT, R. J. & KNOWLES, J. C. 2012. Sol-Gel Phosphate-
based Glass for Drug Delivery Applications. Journal of Biomaterials
Applications, 26, 613-622.
PICKUP, D. M., WETHERALL, K. M., KNOWLES, J. C., SMITH, M. E. &
NEWPORT, R. J. 2008b. Sol-gel preparation and high-energy XRD study of
(CaO)(x)(TiO(2))(0.5-x)(P(2)O(5))(0.5) glasses (x=0 and 0.25). Journal of
Materials Science-Materials in Medicine, 19, 1661-1668.
WALTERS, N. J. & GENTLEMAN, E. 2015. Evolving insights in cell–matrix
interactions: Elucidating how non-soluble properties of the extracellular
niche direct stem cell fate. Acta Biomaterialia, 11, 3-16.

CHAPTER 5
149
CHAPTER 5 Sol-Gel Synthesis and Electrospraying of Ternary
(P2O5)0.55-(CaO)0.30-(Na2O)0.15 Glass Nanospheres for Diagnostic and Therapeutic Applications

CHAPTER 5
150
5.1. Introduction
Ultrasound imaging is a real time, non-ionising, effective, and low cost imaging tool.
Yet it remains primarily an anatomic imaging tool versus positron emission
tomography or bioluminescence. Ultrasound contrast agents can increase the
signal specificity for molecular imaging by increasing backscattered echoes from
the target site, however, the current generation of microbubbles is too large to be
used outside of the vasculature or inside specific cells of interest (Goldberg and Liu,
1997, Benchimol et al., 2013, Nakatsuka et al., 2011, Willmann et al., 2008). The
use of microbubbles as a contrast agent were first introduced in 1968 by injecting
agitated saline into the ascending aorta and cardiac chambers during
echocardiographic examination (Gramiak R and Shah PM, 1968). Strong echoes
were produced within the heart due to the acoustic mismatch between free air
microbubbles in the saline and the surrounding blood. However, microbubbles
produced by agitation were both large and unstable and diffused into solution in a
short period of time.
To overcome these limitations encapsulated gas bubbles were developed,
however, these microbubbles were unstable in circulation even with polyethylene
glycol surface treatment (Klibanov, 1999, Schutt et al., 2003, Kono et al., 2008).
Furthermore, microbubbles require a careful choice of ultrasound frequency
because they burst at low frequencies that can result in local microvasculature
rupture and haemolysis (Klibanov, 2005). While nanotechnology and production of
nanobubbles have made important improvements in this area, however, a complete
solution has remained elusive (Xing et al., 2010, Shapiro et al., 2014, Krupka et al.,
2010).
One alternative is the use of solid nanoparticles as backscatter contrast agents for
ultrasound molecular imaging (Casciaro et al., 2010, Jokerst et al., 2013, Liberman

CHAPTER 5
151
et al., 2013). These solid particles have been used to image cell surface proteins in
cancer cells, visualising stem cells in cardiac regenerative medicine, and also for
encapsulating drug molecules to transport them to specific cells (Jokerst et al.,
2013, Casciaro et al., 2010). These particles are particularly attractive for cancer
treatment due to their small size and potential for functionalising their surface which
provide immense opportunity in drug delivery and cell imaging.
However, in order to be effective, the material properties of these agents are very
critical. They must have acoustic impedance, be capable of strongly and stably
backscattering incident acoustic energy, possess the ability to encapsulate drug
molecules, and be able to be metabolised and removed safely from the body shortly
after administration. In addition the particles must be small enough to extravasate
through tumour vasculature due to the enhanced permeation and retention (EPR)
effect or be phagocytosed by cells when growing in culture. While silica-based
nanoparticles have shown some promises (Ta et al., 2012, Martinez et al., 2010,
Malvindi et al., 2011), their degradation rate is very slow which may limit their
applications (He et al., 2011a, Hudson et al., 2008).
Phosphate-based glasses are an attractive alternative since they offer a
controllable degradation rate by varying their chemical compositions which gives
rise to easily metabolised degradation components in the body (Knowles, 2003,
Hench and Polak, 2002, Franks et al., 2001). In addition, phosphate-based glasses
can be a good choice to encapsulate drug molecules as they could be a way to
reduce the drug dose needed and the side effects associated with particular drugs
(Pickup et al., 2012).
In our previous approach to prepare ternary phosphate-based glasses via the sol-
gel method in the P2O5-CaO-Na2O system (section 2.2.2.3), we focused on
preparing bulk glasses and for that reason, the drying procedure had to be done
very carefully over three weeks (section 2.2.3). However, the long synthesis time
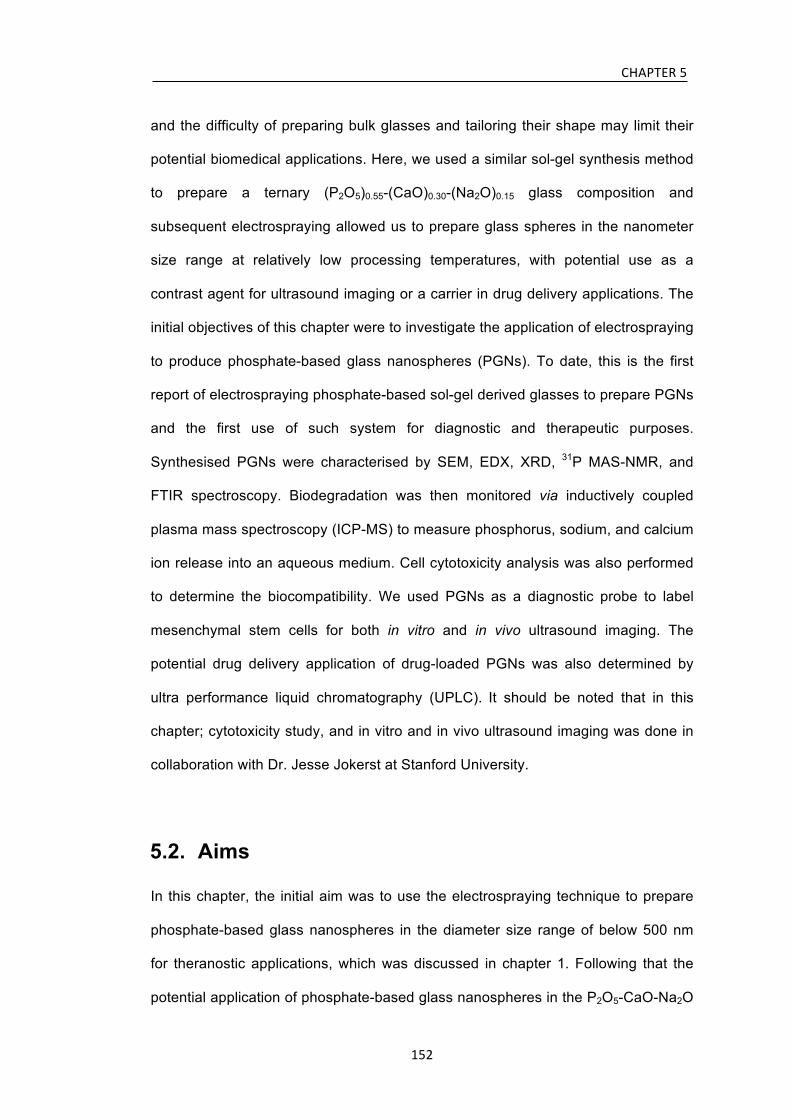
CHAPTER 5
152
and the difficulty of preparing bulk glasses and tailoring their shape may limit their
potential biomedical applications. Here, we used a similar sol-gel synthesis method
to prepare a ternary (P2O5)0.55-(CaO)0.30-(Na2O)0.15 glass composition and
subsequent electrospraying allowed us to prepare glass spheres in the nanometer
size range at relatively low processing temperatures, with potential use as a
contrast agent for ultrasound imaging or a carrier in drug delivery applications. The
initial objectives of this chapter were to investigate the application of electrospraying
to produce phosphate-based glass nanospheres (PGNs). To date, this is the first
report of electrospraying phosphate-based sol-gel derived glasses to prepare PGNs
and the first use of such system for diagnostic and therapeutic purposes.
Synthesised PGNs were characterised by SEM, EDX, XRD, 31P MAS-NMR, and
FTIR spectroscopy. Biodegradation was then monitored via inductively coupled
plasma mass spectroscopy (ICP-MS) to measure phosphorus, sodium, and calcium
ion release into an aqueous medium. Cell cytotoxicity analysis was also performed
to determine the biocompatibility. We used PGNs as a diagnostic probe to label
mesenchymal stem cells for both in vitro and in vivo ultrasound imaging. The
potential drug delivery application of drug-loaded PGNs was also determined by
ultra performance liquid chromatography (UPLC). It should be noted that in this
chapter; cytotoxicity study, and in vitro and in vivo ultrasound imaging was done in
collaboration with Dr. Jesse Jokerst at Stanford University.
5.2. Aims
In this chapter, the initial aim was to use the electrospraying technique to prepare
phosphate-based glass nanospheres in the diameter size range of below 500 nm
for theranostic applications, which was discussed in chapter 1. Following that the
potential application of phosphate-based glass nanospheres in the P2O5-CaO-Na2O

CHAPTER 5
153
system as a transient contrast agent for ultrasound imaging and as a carrier in drug
delivery systems were investigated.
5.3. Materials and methods
5.3.1. Design of electorspraying
The experimental setup of the electrospraying system is shown in Figure 5.1. It
consists of high voltage source, syringe pump, stainless steel hypodermic needle,
and a counter electrode. Silicone oil (Sigma-Aldrich, Gillingham, UK) was used as a
substrate and the temperature of the substrate was controlled via a hot plate
located underneath. An electric field was generated by applying the voltage
between the needle and the counter electrode while the syringe pump provided a
constant flow rate. Surface charges, which are proportional to the resulting electric
field, were formed on the surface of the sol-gel solution droplet at the tip of the
needle. These charges exert an outward electrostatic pressure which is in
opposition to the pressure developed by surface tension resulting in the formation
of a Taylor cone at the tip of the needle. Above a critical value of the electric field,
the electrostatic forces overcome the surface tension of the solution resulting in the
extraction of a liquid jet. The extruded sol-gel solution was separated into small
droplets and propelled into the heated silicone oil.

CHAPTER 5
154
Figure 5.1. Schematic of the electrospraying setup including; syringe pump,
stainless steel needle, high voltage supply, collection substrate, and a hot plate.
The high voltage between the needle and the ground creates nanospheres from the
needle tip and these are propelled toward the heated silicone oil as a substrate to
obtain dried gel nanospheres.
5.3.2. Synthesis of the sol for subsequent electrospraying
The sol-gel preparation method of ternary (P2O5)0.55-(CaO)0.30-(Na2O)0.15 glass
composition has been described previously in Section 2.2.2.3. To evaluate the
potential diagnostic and therapeutic applications of PGNs, during the final stage of
the sol-gel process 1 wt% fluorescein dye (Sigma-Aldrich, Gillingham, UK) or 1 wt%
tetracycline hydrochloride (Sigma-Aldrich, Gillingham, UK) was added to a subset
of the mixture and homogeneous solutions were obtained after mixing for about 10

CHAPTER 5
155
minutes. The mixtures were aged overnight at 60 °C before being electrosprayed
over the heated silicone oil.
A stainless steel hypodermic needle (18 gauge) with 10 cm distance from the
substrate was used. The electrospraying setup was operated at room temperature
and atmospheric pressure. The temperature of the substrate was controlled and
kept at 150 °C using a hot plate. The flow rate of the syringe pump was set at 0.20
mL.h-1 and a voltage of 20 kV was applied between the needle and the ground to
provide a continuous and stable Taylor cone output. The sprayed particles were
separated from silicone oil via centrifugation at 4600 rpm for 30 minutes and
washed three times with acetone (99.5%, Alfa-Aesar, Heysham, UK) before drying
at 180 °C for 2 hours in an oven (EV014-Townson & Mercer, Cheshire, UK) to
evaporate the acetone and other remaining solvents.
5.4. Structural characterisation methods
5.4.1. SEM
The shape and morphology of the obtained particles were probed using scanning
electron microscopy (SEM). SEM images were acquired using a Philips-XL30
instrument (Philips, Netherland) at a working distance of 10 mm and an
accelerating voltage of 5 kV. The particles were mounted onto a stub using araldite
and sputter-coated with gold/palladium alloy by a Polaron E5100 coating device
(Polaron CVT, Milton Keynes, UK) and imaged at various magnifications. Particle
size distribution was determined from the measurement of at least 100 particles
using Image Pro Plus software (Medium Cybernetics, USA).

CHAPTER 5
156
5.4.2. XRD and EDX
XRD and EDX analysis were carried out on PGNs as previously described in
sections 2.2.4.1.1 and 2.2.4.2.1.
5.4.3. 31P MAS-NMR and FTIR spectroscopy 31P MAS-NMR and FTIR spectroscopy characterisation methods have been
previously reported in sections 2.2.4.3.1 and 2.2.4.4.1.
5.4.4. Cell culture, labelling, and cytotoxicity
Human mesenchymal stem cells (MSCs) and culture medium were purchased from
Lonza (p/n 2501 and 3001, respectively). Cells were seeded at a cell seeding
density of 5000 cells/cm2, and the medium was changed every 2-3 days. Cell
labeling was carried out using MSCs plated at a cell seeding density of 5000
cells/cm2 in a 225 cm2 flask after reaching 80% confluence. For labeling
optimisation studies, 12 well plates at the same cell seeding density were used. In
order to investigate the application of PGNs as a contrast agent, they were
incubated in PBS at 25 mg.mL-1. To obtain an optimised concentration value for the
labelling process using PGNs, the cells were exposed to a range of PGNs
concentrations from 30 to 1000 µg.mL-1. The PGNs were then incubated with the
cells for 2 hours and then washed three times with PBS. To study the effect of time,
500 µg.mL-1 of PGNs from 1 – 360 minutes was used. For labelling experiments, we
used fluorescently-tagged PGNs. Cell fluorescence was measured with a plate
reader (Bio-TEK), and EVOS-FI fluorescence microscopy (Invitrogen). Leica
confocal microscope (TCS-SP5) was used for confocal microscopy with a 20x APO

CHAPTER 5
157
objective (p/n 506147) seated on a Virbraplane air table. For z-stacking
experiments, 20 slices were collected over ~ 50 µm.
For the cell counting experiments, we used the optimised protocol of 2 hours and
250 µg.mL-1. After labelling, the cells were washed three times with saline. We
monitored the washes with absorbance spectroscopy to confirm that the third wash
contained no more nanoparticles. The cells were then removed from the flask with
TrypLE Express (Invitrogen), washed with complete medium to deactivate the
trypsin, centrifuged at 1000 rpm at 4 °C for 5 minutes and resuspended in saline.
The cells were counted with an automated hemocytometer before being placed in a
phantom and imaged.
For cell viability, cells were plated in a 96 well plate and allowed to adhere
overnight. The next day, cells were incubated in contact with a range of PGNs
concentration for 4 hours. For a positive control, we added 10 µL of 1 mg.mL-1 cetyl
trimethylammonium bromide (CTAB) in phosphate buffered saline. Cell viability was
assessed using the tetrazolium-based metabolic reagent compound 3-(4,5-
dimethylthiazol-2-yl)-5-(3-carboxymethoxyphenyl)-(4-sulfophenyl)-2H-tetrazolium
(MTS; Promega). The solution was used as received and 20 µL of MTS solution
was added to each well in a 96 well plate containing cells and allowed to incubate
for 3 hours. Absorbance at 490 nm was measured to estimate cell viability. Each
condition was tested with at least four replicates.
To determine whether the particles generated any reactive oxygen species, we
utilized 2’,7’ –dichlorofluorescin diacetate (DCFDA; Biotium). We first made a 1
mg.mL-1 stock solution of DCFDA in dimethyl sulfoxide (DMSO) and then 125 µL of
the DMSO solution was diluted to 10 mL using Hanks Buffered Saline Solution
(HBSS). Cells were washed with fresh HBSS and then 100 µL of the DCFDA
solution in HBSS was added; the plate was incubated at 37 °C for 1 hour. Next, the

CHAPTER 5
158
labelling solution was aspirated and the cells again washed with fresh HBSS.
Increasing concentrations of PGNs in 100 µL HBSS were then added. Controls
include 10 %H2O2 and wells with no cells. The fluorescence emission of each well
was measured 1 hour later.
5.4.5. Biodegradation monitoring
Biodegradation was monitored via inductively coupled plasma mass spectroscopy
(ICP-MS). The experiment used 0.1 mg.mL-1 PGNs in deionised water at 37 °C with
three replicates at the following time points: 0, 0.2, 0.5, 1, 3, 6, 12, 24, and 48
hours. The tubes were secured to a tube rotation device set to 5 rotations per
minute. This device was in a 37 °C incubator (Compact Incubator, LEEC,
Nottingham, UK) under ambient humidity. After each time point, the resulting
suspension was centrifuged at 4600 rpm for 30 minutes to separate the PGNs from
the solution. The liquid phase was then extracted and the PGNs were dried at 60 °C
in an oven (IP100-LTE Scientific, Oldham, UK) before replenishing with fresh
deionised water. The release of phosphorus, calcium, and sodium in solution was
measured by using a Spectro Mass 2000 Analytical System (Kleve, Germany)
calibrated across the predicted concentrations range of 0 - 4000 ppb by dilution of
100 ppm elemental standards. Calcium standard was obtained as part of a pre-
made standard solution (Fluka, Gillingham, UK) whereas phosphorus and sodium
standards were prepared from analytical grade K2HPO4 (Sigma-Aldrich, Gillingham,
UK) and NaNO3 (Sigma-Aldrich, Gillingham, UK) salts, respectively. Standards
were first diluted in deionised water to the desired concentration range. Both
samples and standards were diluted in 1:1 in 4% HNO3 (Fluka, Gillingham, UK) and
analysed against a blank (2% HNO3) solution under standard operating conditions

CHAPTER 5
159
(Power: 1350 W; Coolant Flow: 15 L.min-1: Auxiliary Flow: 1 L.min-1). Results were
reported as a cumulative ion release over the full period of the degradation study.
5.4.6. In vitro ultrasound imaging
To measure the echogenicity of the nanoparticles, increasing concentrations of
PGNs were placed in a 1% agarose phantom. Ultrasound backscatter mode (B-
mode) images were collected with a Visualsonics 2100 scanner with a MS-550
transducer (Fuji, Ontario, Canada) for 40 MHz centre frequency imaging or a MS-
250 transducer for 16 MHz. Other imaging parameters included 100% power, 35 dB
gain and a 60 dB dynamic range. At least three frames were collected for each
sample and were quantified with ImageJ software using region of interest analysis
and 8-bit depth as the dependant variable (0-255) (Schneider et al., 2012).
5.4.7. In vivo ultrasound imaging
All animal studies were approved by the Administrative Panel for Laboratory Animal
Care (APLAC) at Stanford University. Nude mice aged 10-14 weeks were
anaesthetized with 2% isofluorane in oxygen at 2 L.min-1. The PGNs were dissolved
in 50:50 matrigel:PBS at 2.0, 0.25, and 0.1 mg.mL-1. The injection volume was 100
µL that was subcutaneously implanted on the rear flank of the mice. The animals
were imaged 10 minutes after implantation after the matrigel had solidified using 40
MHz centre frequency, 100% power, 35 dB gain, and a 60 dB dynamic range. At
least three frames were collected for each sample and images were quantified with
ImageJ. For longitudinal imaging the injection site was marked and the animal
returned to the same position the next day for identical imaging conditions.

CHAPTER 5
160
5.4.8. Drug release measurement
To measure the tetracycline hydrochloride (TCH) release from the drug-loaded
PGNs, 1 mg.mL-1 sample suspended in deionised water at 37 °C (Compact
Incubator, LEEC, Nottingham, UK) with three replicates at the following intervals: 0,
0.2, 0.5, 1, 2, 4, 8, 16, and 24 hours. After each interval, the mixture was
centrifuged at 4600 rpm for 30 minutes to separate the PGNs from the solution. The
liquid phase was then extracted and the PGNs were dried at 60 °C in an oven
(IP100-LTE Scientific, Oldham, UK) before they were resuspended in fresh
deionised water. 6µL of the extracted solution diluted with 4 µL of methanol solution
containing 0.1% formic acid and injected into the Hypersil Gold C18 column (Thermo
Scientific, Leicestershire, UK) using the Acquity Capillary UPLC system (Waters,
Manchester, UK) and was monitored at 345 nm. The mobile phases were: A) 0.1%
formic acid in 100% water, and B) 0.1% formic acid in 100% acetonitrile. The
gradient program was started at 5% B and was gradually increased to 95% B over
4 minutes. The mobile phase composition was maintained at 95% B for a further
0.5 minutes before returning to 5% B in 6 seconds. The flow-rate was 600 µL.min-1
and the column was then re-equilibrated for a further 24 seconds giving a total run
time of 5 minutes. Before performing the analysis, the system was calibrated
against a five point calibration curve from prepared TCH standard solutions.
5.5. Results
5.5.1. SEM and EDX
Nanoparticles were successfully synthesised with the electrospraying technique
and the shape and size of the particles were characterised using SEM analysis.
Figure 5.2 shows nanospherical particles and measurement of the particle size for

CHAPTER 5
161
more than 100 particles confirmed more than 80% of the particles had a diameter
distribution of 200-500 nm with a mean diameter size of 320 nm. The EDX results
are reported in Table 5.1. The P2O5 content was 12.5 mol% less than the
theoretical value with a concomitant increase in the percentage content of the other
oxides to compensate.
Figure 5.2. SEM images of (A, B) washed and heat-treated PGNs (the scale bars
represent 5 and 2µm) and (C, D) dispersed PGNs in anhydrous ethanol solution
after heat-treatment (the scale bars represent 2 µm). The PGNs have an
approximate size distribution of 200 - 500 nm with mean diameter of 320 nm based
on measurement of more than100 particles.
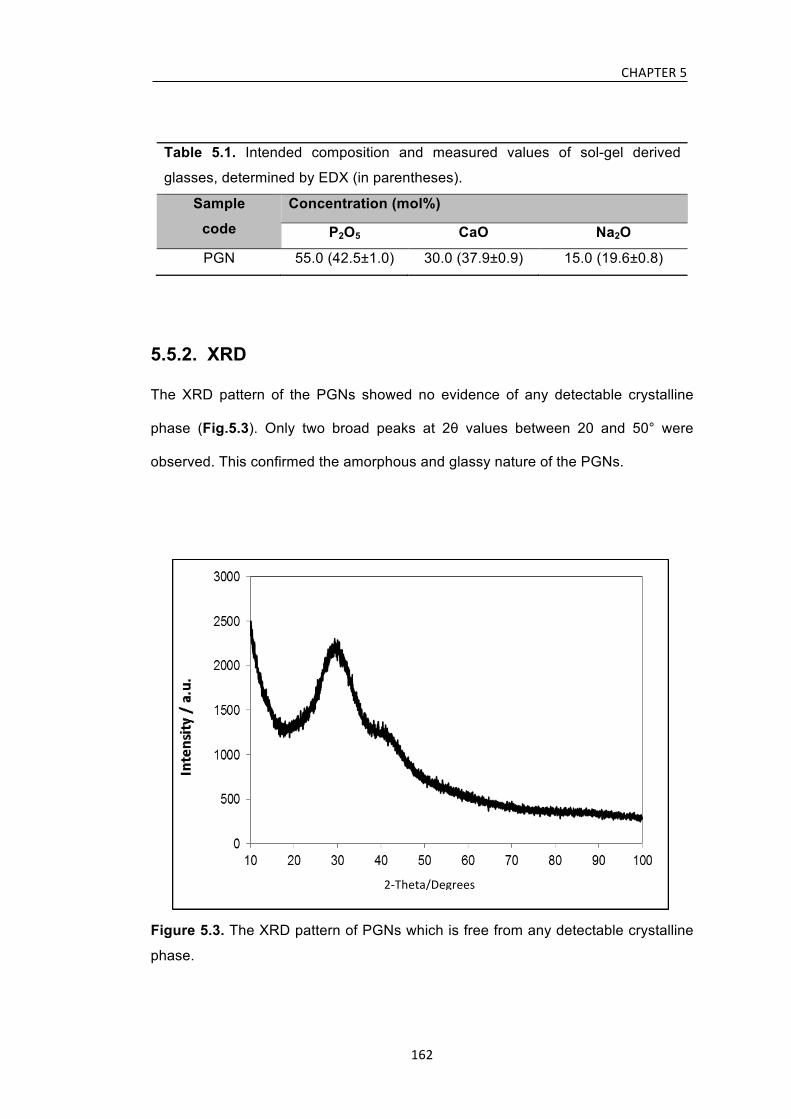
CHAPTER 5
162
Table 5.1. Intended composition and measured values of sol-gel derived
glasses, determined by EDX (in parentheses).
Sample
code
Concentration (mol%)
P2O5 CaO Na2O
PGN 55.0 (42.5±1.0) 30.0 (37.9±0.9) 15.0 (19.6±0.8)
5.5.2. XRD
The XRD pattern of the PGNs showed no evidence of any detectable crystalline
phase (Fig.5.3). Only two broad peaks at 2θ values between 20 and 50° were
observed. This confirmed the amorphous and glassy nature of the PGNs.
Figure 5.3. The XRD pattern of PGNs which is free from any detectable crystalline
phase.
2-‐Theta/Degrees

CHAPTER 5
163
5.5.3. 31P MAS-NMR
Figure 5.4 shows the 31P MAS-NMR spectrum from PGNs. The peak at 1.7 ppm
corresponds to Q0 phosphate units, while the peaks with the chemical shifts at -8.3
and -21.9 ppm are assigned to Q1 and Q2 units, respectively (Lee et al., 2013, Carta
et al., 2007). The peak parameters of the PGNs spectrum are listed in Table 5.2.
Figure 5.4. 31P MAS-NMR spectrum of PGNs that correspond to mainly Q1 and Q2
phosphate units. The asterisks denote spinning sidebands.
Table 5.2. 31P MAS-NMR peak parameters of phosphate-based glass
nanospheres.
Sample
code
Position
(ppm, ±0.2)
Qi
species
Line width
(ppm, ±0.2)
Abundance
(%, ±1.0)
PGN
1.7 0 6.7 1.9
-8.3 1 10.1 59.5
-21.9 2 12.5 38.6
*
*
*
* *
* *
*
Q1 Q2

CHAPTER 5
164
5.5.4. FTIR spectroscopy
Figure 5.5 presents FTIR spectroscopy data for PGNs that allow assignment of
peaks according to the previous FTIR spectroscopy studies on phosphate-based
glasses (Baia et al., 2007, Byun et al., 1995, Ilieva et al., 2001, Moustafa and El-
Egili, 1998, Sene et al., 2004, Pickup et al., 2007). The peak at 730 cm-1 can be
assigned to symmetrical stretching ʋs (P-O-P) mode, while the peak at 900 cm-1 can
be assigned to asymmetrical stretching ʋas (P- O-P) mode (Q2 phosphate units).
Peaks at 1100 and 1235 cm-1 are also assigned to asymmetrical ʋas (PO3)-2 and ʋas
(PO2)- modes that can be related to Q1 and Q2 phosphate units, respectively.
Figure 5.5. FTIR spectrum and band assignment for PGNs (ʋ, stretching; s,
symmetric; as, asymmetric).

CHAPTER 5
165
5.5.5. Ion release study
The concentration of phosphorus, sodium, and calcium that released into solution at
different time points are presented in Figure 5.6. It can be seen that the highest
rate of ion release occurs within the first 4 hours over the entire length of the study
for all the elements. It should be noted that there is a small difference between the
obtained data from EDX and ICP that can be related to the dissolution behaviour of
phosphorus that requires the hydrolysis of P-O-P bonds prior to release, whereas
other elements may be released via diffusion (Bunker et al., 1984).
Figure 5.6. Cumulative release of phosphorus, calcium, and sodium in deionised
water as a function of time for the investigated PGNs. Error bars represent the
standard deviation of three samples.

CHAPTER 5
166
5.5.6. Cytotoxicity study
MTS and DCFDA assays were used to measure the cell viability and to study
whether reactive oxygen species (ROS) were generated (Fig. 5.7). MSCs were
used for both applications because of the utility of ultrasound in cardiac stem cell
therapy (Hare et al., 2012b, Jokerst et al., 2013). The cells were positive for CD105,
CD166, CD29, CD44, CD14, CD34, and CD45 and were below passage number 5.
The DCFDA assay was first validated with both positive and negative controls. The
negative control was used well with no cells plated, and the positive control was a
well with MSCs stimulated by 10% hydrogen peroxide. The negative control had a
fluorescence value of 297 ± 76 which is attributed to auto-fluorescence from the
plastic well plate. The MSCs in medium with neither PGNs nor H2O2 had a value of
869 ± 118. The H2O2 positive control validated the assay and was 2.2-fold higher
than the control cells. The experiments with PGNs added to the MSCs showed no
increase in DCFDA signal except at 1000 µg.mL-1. Here, the signal increased 1.6-
fold to 1372 ± 41—a value that was significant at p<0.0001 versus the 0 µg.mL-1
control. All other PGNs concentrations had p values greater than 0.05 indicating no
generation of ROS (Fig. 5.7A).
We also used the MTS assay to measure any effects on cell viability. Two fractions
of PGNs were analysed; freshly dissolved PGNs in PBS (Fig. 5.7B, Fresh) and
PGNs that had been in PBS overnight (Fig. 5.7B, Degraded). In both cases, cells
were treated with increasing concentrations of PGNs. The positive control was the
known cytotoxic agent CTAB. Cells without stimulation had an optical density at 490
nm of 0.85 ± 0.06 for the fresh sample and 0.90 ± 0.05 for the degraded sample. No
concentrations had a statistically significant change to baseline except the positive
control, which suppressed the signal 4.3-fold and 4.1-fold for the fresh and
degraded samples, respectively.

CHAPTER 5
167
Figure 5.7. Increasing concentrations of PGNs were used to label MSCs for 4
hours followed by treatment with different markers of cytotoxicity. All experiments
were validated with a positive control (POS). A) Cells were plated, tagged with
DCFDA, and then perturbed with PGNs. Any ROS generation resulted in
fluorescence from the DCFDA probe. Only the 1000 µg.mL-1 sample significantly
upregulated ROS. A hydrogen peroxide positive control validated the assay. The
negative control was wells with no cells. B) The MTS reagent measures cell
metabolism and showed no decrease at any concentration studied. Here, we used
both freshly dissolved PGNs (fresh) and PGNs that had been in solution for 24
hours (degraded). No concentration decreased metabolism. Error bars represent
the standard deviation of 6 wells.
A
B

CHAPTER 5
168
5.5.7. In vitro ultrasound imaging
The ability of the PGNs to backscatter acoustic energy was tested with phantoms.
Inclusions contained increasing concentrations of PGNs were added to the agarose
support and imaged at 40 MHz (Fig. 5.8). In Figure 5.8A, the echogenicity of a 0
mg.mL-1 PGNs is seen. The outline of the well can be seen clearly due to the
presence of air bubbles that became trapped on the side of the well (dashed lines).
A much more intense signal is seen when a specific well was loaded with 1 mg.mL-1
PGNs (Fig. 5.8B). The mean intensity of this image and at least three replicate
images was measured to be 81.5 ± 1.3 a.u. This value and the value determined for
the other concentrations of PGNs is plotted in Figure 5.8C. Using the best fit line
(R2>0.99) and the background value of 5.3 ± 0.4, we estimated the limit of detection
to be 5 µg.mL-1 at three standard deviations above the mean of the background.
To understand how biodegradation affects the ultrasound signal was also measured
using 0.25 mg.mL-1 PGNs after different periods of dissolution in standard PBS
(Fig. 5.8D). It was found that the signal has a maximum near 10 minutes, but
remains elevated at least 4 hours after wetting. Interestingly, the increase from 2
minutes to 10 minutes was significant (p<0.05) and suggests that the wetting of the
PGNs may induce hydration that increases backscatter.

CHAPTER 5
169
Figure 5.8. Ultrasound images in the z-axis for inclusions with 0 mg.mL-1 PGNs (A)
and 1 mg.mL-1 PGNs at 40 MHz (B). The increased backscatter results from the
increasing number of particles that was further quantified for multiple fields of view
in (C). PGNs (0.25 mg.mL-1) at various time points were imaged with ultrasound to
understand how signal changes as a function of time (D). These data indicate that
ultrasound signal decreases as the PGNs degrades because of decreased acoustic
impedance. The imaging window is within the first four hours of dissolution.

CHAPTER 5
170
The frequency of imaging is also an important parameter. Higher frequencies have
better resolution, but lower depth of penetration and the echogenicity of the material
may change as a function of frequency. To understand how the PGNs behave in
both clinical and pre-clinical frequencies, we also imaged nanoparticles at 16 MHz
(Fig. 5.9A). The signal of a 1 mg.mL-1 PGNs solution was measured as well as the
background signal of agar. Both the signal and signal-to-background (S/B) are
plotted and are shown in Figure 5.9B. While the signal was 36% higher at 40 MHz,
the signal-to-background at 16 MHz was 4.6-fold higher than 40 MHz, because of a
lower background signal. These data indicate that the PGNs are suitable for
imaging at both clinical and pre-clinical frequencies.
Figure 5.9. Panel A is an ultrasound image in the z-axis for 1 mg.mL-1 PGNs at 16
MHz, and B is signal and signal-to-background for both 16 and 40 MHz. Here, the
signal was defined as echogenicity of the sample and background was adjacent
agar. While the signal was higher at 40 MHz, the signal-to-background at 16 MHz
was 4.6-fold higher than 40 MHz because of a lower background signal. These data
indicate that the PGNs are suitable for imaging in both clinical and pre-clinical
frequencies.

CHAPTER 5
171
5.5.8. In vivo ultrasound imaging
To understand the capability of PGNs for in vivo imaging and biodegradation, 100
µL boluses of increasing concentrations of PGNs were implanted into the rear flank
of nude mice (Fig. 5.10A). These samples were in a 50% matrigel carrier and this
vehicle served as the negative control (0 mg.mL-1 PGNs). Each implant was imaged
at 40 MHz and the backscatter was quantified for various concentrations in Figure
5.11A. The calculated limit of detection in vivo is 9 µg.mL-1 of PGNs with a value
nearly 2-fold higher than in vitro analysis. This is because of the increased
background signal in in vivo imaging.
We also studied the capability for in vivo biodegradation. Mice implanted with 2
mg.mL-1 PGNs were imaged immediately after implantation (Fig. 5.10A) and one
day later (Fig. 5.10B). As expected, the matrigel and saline carriers were largely
resorbed into circulation and extracellular matrix. Concurrently, the PGNs implanted
began to degrade as we observed a 3.5-fold decrease in signal-to-background after
one day (Fig. 5.11B).

CHAPTER 5
172
Figure 5.10. Nude mice received 100 µL boluses of 2 mg.mL-1 PGNs in 1:1
matrigel:PBS and imaged at 40 MHz immediately after implantation (A) and 1 day
after (B). Red outlines in A and B indicate the region of implantation.

CHAPTER 5
173
Figure 5.11. Decreasing concentrations of PGNs were also implanted to calculate
the limit of detection and variance between animals (A). Error bars represent the
standard error of measurement. Changes in ultrasound backscatter for PGNs
indicates a 3.5-fold decrease in signal-to-background ratio (SBR) (B). Error bars
represent the standard deviation.
5.5.9. Ultrasound cellular imaging
A final imaging study was carried out on labelled MSCs with the PGNs. We first
optimised the labelling protocol using the cell fluorescence to monitor labelling.
There was a linear relationship (R2=0.98) between the starting concentration and
the resulting cell fluorescence from 30 to 1000 µg.mL-1 of PGNs at 2 hours of
incubation (Fig. 5.12A). When the incubation time was changed from 1 to 360
minutes at 500 µg.mL-1, a marked plateau effect was noted after 1 hour of
incubation (Fig. 5.12B). Further incubation with cells did not significantly increase
the signal from the cells (p>0.05). Even 30 minutes of incubation gave a signal from
the cells that was 70% of maximum. These conditions were used to label MSCs
and then imaged them with ultrasound (Fig. 5.12C) and fluorescence microscopy
(Fig. 5.13A).

CHAPTER 5
174
Next microscopy was used to understand the interaction between the PGNs and
the MSC’s. Epifluorescence microscopy indicated low non-specific binding of PGNs
to the culture flasks. Less than 5% of the fluorescent pixels did not correspond to a
cell in Figure 5.13B with many regions of increased signal seen throughout the
MSC’s.
Different numbers of cells were placed in a 100 µL inclusion in an agar phantom
and imaged at 40 MHz. This cell volume was used because it is similar to the
injection volume used in trials of non-human primates and would likely be used in
human. A linear relationship was noted between the number of cells and the
ultrasound backscatter (R2>0.99; Fig. 5.12C), which is important for studies in
which unknown numbers of cells may need to be quantified. The calculated limit of
detection for ultrasound imaging was 4000 MSCs at three standard deviations
above the mean of the background.
Finally, confocal microscopy was used to study the distribution of the PGNs. Our
goal was to determine whether the nanoparticles were on the cells or inside the
cells. This is important because nanoparticles that were only on the surface could
become detached after implantation and incorrectly be considered as a cell. The
confocal data in Figure 5.13F showed that the nanoparticles are located throughout
the cell in the cytoplasm and are not simply on the cell surface.

CHAPTER 5
175
Figure 5.12. The optimal labeling conditions were tested empirically including
starting concentration of PGNs (A) and incubation time (B). We found a nearly
linear relationship between starting concentration and cell fluorescence (A). These
concentrations used 2 hours of labeling. In B, we studied the effect of time and
found that incubation times beyond 2 hours offered no additional signal. (C) MSCs
labelled with these conditions (500 µg.mL-1 and 2 hours) were imaged with 40 MHz
ultrasound—the limit of detection is 4000 MSCs.
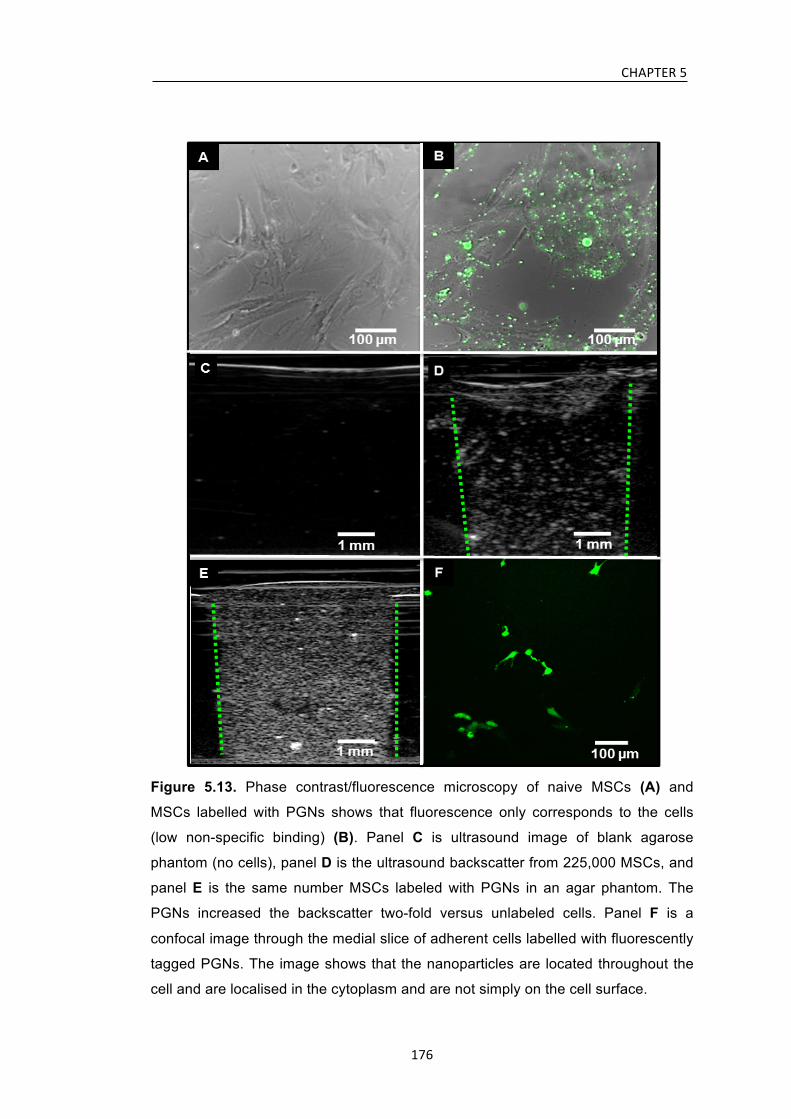
CHAPTER 5
176
Figure 5.13. Phase contrast/fluorescence microscopy of naive MSCs (A) and
MSCs labelled with PGNs shows that fluorescence only corresponds to the cells
(low non-specific binding) (B). Panel C is ultrasound image of blank agarose
phantom (no cells), panel D is the ultrasound backscatter from 225,000 MSCs, and
panel E is the same number MSCs labeled with PGNs in an agar phantom. The
PGNs increased the backscatter two-fold versus unlabeled cells. Panel F is a
confocal image through the medial slice of adherent cells labelled with fluorescently
tagged PGNs. The image shows that the nanoparticles are located throughout the
cell and are localised in the cytoplasm and are not simply on the cell surface.

CHAPTER 5
177
5.5.10. Drug release measurement
Figure 5.14 shows the cumulative TCH release profile measured via UPLC from
the drug-loaded PGNs. It can be seen that the highest TCH release occurs within
the first 4 hours of study period (~ 55% TCH). These results matching with the data
that was obtained from the ICP and ultrasound imaging analysis. The release
reached to around 60% TCH theoretical total after 12 hours and appeared to have
been saturated. This can be related to the existence of the TCH molecules on the
surface of the PGNs that washed out during the preparation of PGNs.
Figure 5.14. Cumulative release measurement of TCH from the drug-loaded PGNs
determined via UPLC. Highest release occurred within the first 4 hours of the entire
study. Error bars represent the standard deviation of three samples.

CHAPTER 5
178
5.6. Discussion
In this chapter, the sol-gel preparation method and the subsequent application of
electrospraying was utilised to prepare ternary phosphate-based glass
nanospheres in the diameter size range of 200-500 nm at relatively low
temperature. Previous approaches to prepare these glasses have been focused on
preparing bulk sol-gel glasses. However, the difficulties in manufacturing bulk
glasses have led to their limited biomedical applications. In this study, the
electrospraying technique was used to tailor the shape of these sol-gel derived
glasses in the range of nanometers.
The amorphous and glassy nature of the PGNs was confirmed by XRD data
analysis. The 31P NMR and FTIR spectroscopy results also showed the structure of
these PGNs consists of mainly Q1 and Q2 phosphate units. The Q0 and Q1
percentages for the PGNs are slightly higher than the previously synthesised glass
with the same composition in section 2.2.2.3 that can be related to the shorter
ageing time period and also evaporation of unreacted phosphorus precursors
during the heating stage that was confirmed by EDX measurement which showed
an approximately 12.5 mol% P2O5 loss, post processing.
The PGNs have strong ultrasound backscattering capabilities both in vivo and in
vitro. Phantom experiments indicated a limit of detection of 5 µg.mL-1 with linear
behaviour below 1000 µg.mL-1 (Fig. 5.8A). The imaging window of this material is
below 4 hours. The ICP data show the highest rate of dissolution within the first 4
hours of immersion in distilled water (Fig. 5.6), and our time course study shows
that by 4 hours the signal has decreased more than 2-fold with even further
reduction the next day (Fig. 5.8D). This is particularly important because it bridges
a gap between the minutes of stability of microbubbles and the months of stability of
Stober silica particles (Hudson et al., 2008, He et al., 2011b).

CHAPTER 5
179
One potential concern is that the high local ionic concentrations could perturb
cellular function. For 0.1 mg.mL-1 of PGNs, over the 48 hours of dissolution study
and assuming no diffusion, cells would be exposed to 41 ppm (PO4)3-, 32 ppm Ca2+,
and 16 ppm Na+ (Fig. 5.6). These values are well within the standard physiological
range of serum chemistries (Bishop, 2010). For example, the reference range of
Ca2+ is 8.5 - 10 mg.dL-1 or 85 - 100 ppm. The additional calcium due to the contrast
agents is within the reference range and should not unduly perturb cell metabolism.
Furthermore, diffusion and normal circulation may contribute to equilibration of any
locally disturbed ionic concentrations.
To further confirm the cytocompatibility, we performed a series of cell toxicity
assays. While we did find that very high doses (1000 µg.mL-1) increased ROS
(hydroxyl, peroxyl, etc.) activity within the cell, this is much higher than the
concentrations needed for imaging, which are usually 250 µg.mL-1 for MSC imaging
and >9 µg.mL-1 for subcutaneous imaging (Fig. 5.7A). All materials—even water—
are toxic over certain concentration ranges, our goal here was to discover above
which concentration PGNs began to dysregulate metabolism. After PGNs
implantation into animals, we noticed no changes in posture, behaviour, gait, or
feeding pattern according to observation up to two weeks.
We also used the MTS assay to study cell metabolism and viability via
mitochondrial reductase activity (Fig. 5.7). MTS is a colorimetric, water-soluble
tetrazolium dye that indicates the activity of oxidoreductase enzymes. One concern
was that the degradation products may increase the sodium, calcium, and
phosphorus concentration to levels inconsistent with cell survival. Thus, it was
important to study both fresh and degraded PGNs in this assay. Fortunately, we
noticed no cytotoxicity in either sample group at concentrations below 500 µg.mL-1
(Fig. 5.7).

CHAPTER 5
180
Although we did not investigate tumour imaging here, the PGNs implantation
experiments (Fig. 5.11) indicated that concentrations as low as 9 µg.mL-1 could be
imaged in vivo. This is important because nanoparticle contrast agents must
overcome significant competition from the reticuloendothelial system to reach the
target tissue. Values near 4 %ID.g-1 are common for nanoparticle contrast agents.
Thus, a 1 g tumour would need at least 225 µg of material injected into the 2.5 mL
murine blood pool to achieve 4 %ID.g-1 accumulation. Importantly, this
concentration is well below the concentration that increases ROS generation.
Our primary goal was cell imaging, which is critical to understand the location of
implanted stem cells in regenerative medicine. We achieved cell counting below
5000 cells in 100 µL volumes (Fig. 5.12). While we did not achieve the single cell
counts which is possible with some MRI techniques (Shapiro et al., 2006), the cell
counts described here is more than sufficient for clinical trials that will likely use
millions of cells (Chong et al., 2014, Hare et al., 2012a, Makkar et al., 2012). These
low detection limits would be useful because it would allow analysis without
requiring all cells in a given population be labelled. The 4 hour imaging window
would be useful for imaging the immediate implantation events in cells. Long term
imaging could utilize a reporter gene (Yaghoubi et al., 2006).
The detection limits reported here are higher than that achieved with
perfluorocarbon microbubbles. Indeed, these can be detected even at the single
microbubble level (Klibanov et al., 2004). The PGNs could not be detected at the
single particle level, but did have detection levels down to 50 µg.mL-1, which is on
par with the 20 µg.mL-1 detection limits that have been reported previously with
silica nanoparticles (Jokerst et al., 2013). These materials also have lower overall
signal intensity than perfluorocarbon microbubbles. However, perfluorocarbon
microbubbles are approximately the same size as cells and their application for
ultrasound cell imaging can be difficult. Importantly, the PGNs are approximately

CHAPTER 5
181
10-fold smaller in diameter (and 1000-fold smaller in volume) and thus have a
significant advantage for ultrasound cell imaging. Also, the time stability of the
PGNs (~4 hours), is much longer than in vivo stability of perfluorocarbon
microbubbles which is reported to be in the range of a few minutes.
The low processing temperature allowed us to incorporate organic dye (fluorescein)
or drug molecules (TCH) during PGNs processing which cannot be achieved for
phosphate-based glasses synthesised via the melt-quench technique (Franks et al.,
2000). The UPLC results from the drug-loaded PGNs showed a linear release of
drug molecules during the first 4 hours of the study period (Fig. 5.14). This shows
the potential of these nanoparticles for applications as an efficient vehicle for the
local delivery of antibiotics with lower active doses which can reduce systemic
cytotoxicity and side effects.

CHAPTER 5
182
References BAIA, L., MURESAN, D., BAIA, M., POPP, J. & SIMON, S. 2007. Structural
properties of silver nanoclusters-phosphate glass composites. Vibrational
Spectroscopy, 43, 313-318.
BENCHIMOL, M. J., HSU, M. J., SCHUTT, C. E., HALL, D. J., MATTREY, R. F. &
ESENER, S. C. 2013. Phospholipid/carbocyanine dye-shelled microbubbles
as ultrasound-modulated fluorescent contrast agents. Soft Matter, 9, 2384-
2388.
BISHOP, M. L. 2010. Clinical Chemistry.
BUNKER, B. C., ARNOLD, G. W. & WILDER, J. A. 1984. Phosphate-Glass
Dissolution in Aqueous-Solutions. Journal of Non-Crystalline Solids, 64,
291-316.
BYUN, J. O., KIM, B. H., HONG, K. S., JUNG, H. J., LEE, S. W. & IZYNEEV, A. A.
1995. Properties and Structure of Ro-Na2o-Al2o3-P2o5 (R=Mg, Ca, Sr, Ba)
Glasses. Journal of Non-Crystalline Solids, 190, 288-295.
CARTA, D., KNOWLES, J. C., SMITH, M. E. & NEWPORT, R. J. 2007. Synthesis
and structural characterization of P(2)O(5)-CaO-Na(2)O sol-gel materials.
Journal of Non-Crystalline Solids, 353, 1141-1149.
CASCIARO, S., CONVERSANO, F., RAGUSA, A., MALVINDI, M. A., FRANCHINI,
R., GRECO, A., PELLEGRINO, T. & GIGLI, G. 2010. Optimal Enhancement
Configuration of Silica Nanoparticles for Ultrasound Imaging and Automatic
Detection at Conventional Diagnostic Frequencies. Investigative Radiology,
45, 715-724.
CHONG, J. J. H., YANG, X. L., DON, C. W., MINAMI, E., LIU, Y. W., WEYERS, J.
J., MAHONEY, W. M., VAN BIBER, B., COOK, S. M., PALPANT, N. J.,
GANTZ, J. A., FUGATE, J. A., MUSKHELI, V., GOUGH, G. M., VOGEL, K.
W., ASTLEY, C. A., HOTCHKISS, C. E., BALDESSARI, A., PABON, L.,
REINECKE, H., GILL, E. A., NELSON, V., KIEM, H. P., LAFLAMME, M. A.
& MURRY, C. E. 2014. Human embryonic-stem-cell-derived
cardiomyocytesregenerate non-humanprimate hearts. Nature, 510, 273-+.
FOROUTAN, F., DE LEEUW, N., MARTIN, R., PALMER, G., OWENS, G., KIM, H.-
W. & KNOWLES, J. 2015. Novel sol–gel preparation of (P2O5)0.4–
(CaO)0.25–(Na2O)X–(TiO2)(0.35−X) bioresorbable glasses (X = 0.05, 0.1,
and 0.15). Journal of Sol-Gel Science and Technology, 73, 434-442.

CHAPTER 5
183
FRANKS, K., ABRAHAMS, I., GEORGIOU, G. & KNOWLES, J. C. 2001.
Investigation of thermal parameters and crystallisation in a ternary CaO-
Na(2)O-P(2)O(5)-based glass system. Biomaterials, 22, 497-501.
FRANKS, K., ABRAHAMS, I. & KNOWLES, J. C. 2000. Development of soluble
glasses for biomedical use Part I: In vitro solubility measurement. Journal of
Materials Science-Materials in Medicine, 11, 609-614.
GOLDBERG, B. B. & LIU, J. B. 1997. Contrast agents in abdominal ultrasound.
Current Trends in Digestive Ultrasonography, 24, 323-341.
GRAMIAK R & SHAH PM 1968. Echocardiography of the aortic root. Investigative
Radiology, 3, 356-366.
HARE, J., FISHMAN, J. & GERSTENBLITH, G. 2012a. The POSEIDON
Randomized Trial. JAMA, 308, 2369-2379.
HARE, J. M., FISHMAN, J. E., GERSTENBLITH, G., VELAZQUEZ, D. L. D.,
ZAMBRANO, J. P., SUNCION, V. Y., TRACY, M., GHERSIN, E.,
JOHNSTON, P. V., BRINKER, J. A., BRETON, E., DAVIS-SPROUL, J.,
SCHULMAN, I. H., BYRNES, J., MENDIZABAL, A. M., LOWERY, M. H.,
ROUY, D., ALTMAN, P., FOO, C. W. P., RUIZ, P., AMADOR, A., DA SILVA,
J., MCNIECE, I. K. & HELDMAN, A. W. 2012b. Comparison of Allogeneic vs
Autologous Bone Marrow-Derived Mesenchymal Stem Cells Delivered by
Transendocardial Injection in Patients With Ischemic Cardiomyopathy The
POSEIDON Randomized Trial. Jama-Journal of the American Medical
Association, 308, 2369-2379.
HE, Q. J., GAO, Y., ZHANG, L. X., ZHANG, Z. W., GAO, F., JI, X. F., LI, Y. P. &
SHI, J. L. 2011a. A pH-responsive mesoporous silica nanoparticles-based
multi-drug delivery system for overcoming multi-drug resistance.
Biomaterials, 32, 7711-7720.
HE, Q. J., ZHANG, Z. W., GAO, F., LI, Y. P. & SHI, J. L. 2011b. In vivo
Biodistribution and Urinary Excretion of Mesoporous Silica Nanoparticles:
Effects of Particle Size and PEGylation. Small, 7, 271-280.
HENCH, L. L. & POLAK, J. M. 2002. Third-generation biomedical materials.
Science, 295, 1014-+.
HUDSON, S. P., PADERA, R. F., LANGER, R. & KOHANE, D. S. 2008. The
biocompatibility of mesoporous silicates. Biomaterials, 29, 4045-4055.
ILIEVA, D., JIVOV, B., KOVACHEVA, D., TSACHEVA, T., DIMITRIEV, Y.,
BOGACHEV, G. & PETKOV, C. 2001. FT-IR and Raman spectra of Gd

CHAPTER 5
184
phosphate crystals and glasses. Journal of Non-Crystalline Solids, 293, 562-
568.
JOKERST, J. V., KHADEMI, C. & GAMBHIR, S. S. 2013. Intracellular Aggregation
of Multimodal Silica Nanoparticles for Ultrasound-Guided Stem Cell
Implantation. Science Translational Medicine, 5.
KLIBANOV, A. L. 1999. Targeted delivery of gas-filled microspheres, contrast
agents for ultrasound imaging. Advanced Drug Delivery Reviews, 37, 139-
157.
KLIBANOV, A. L. 2005. Ligand-carrying gas-filled microbubbles: Ultrasound
contrast agents for targeted molecular imaging. Bioconjugate Chemistry, 16,
9-17.
KLIBANOV, A. L., RASCHE, P. T., HUGHES, M. S., WOJDYLA, J. K., GALEN, K.
P., WIBLE, J. H. & BRANDENBURGER, G. H. 2004. Detection of individual
microbubbles of ultrasound contrast agents - Imaging of free-floating and
targeted bubbles. Investigative Radiology, 39, 187-195.
KNOWLES, J. C. 2003. Phosphate based glasses for biomedical applications.
Journal of Materials Chemistry, 13, 2395-2401.
KONO, Y., HOLSCHER, T. & MATTREY, R. F. 2008. Use of Ultrasound
Microbubbles for Vascular Imaging. Nanoparticles in Biomedical Imaging:
Emerging Technologies and Applications, 311-325.
KRUPKA, T. M., SOLORIO, L., WILSON, R. E., WU, H. P., AZAR, N. & EXNER, A.
A. 2010. Formulation and Characterization of Echogenic Lipid-Pluronic
Nanobubbles. Molecular Pharmaceutics, 7, 49-59.
LEE, I. H., FOROUTAN, F., LAKHKAR, N. J., GONG, M. S. & KNOWLES, J. C.
2013. Sol-gel synthesis and structural characterization of P2O5-CaO-Na2O
glasses. Physics and Chemistry of Glasses-European Journal of Glass
Science and Technology Part B, 54, 115-120.
LIBERMAN, A., WU, Z., BARBACK, C. V., VIVEROS, R., BLAIR, S. L., ELLIES, L.
G., VERA, D. R., MATTREY, R. F., KUMMEL, A. C. & TROGLER, W. C.
2013. Color Doppler Ultrasound and Gamma Imaging of Intratumorally
Injected 500 nm Iron-Silica Nanoshells. Acs Nano, 7, 6367-6377.
MAKKAR, R. R., SMITH, R. R., CHENG, K., MALLIARAS, K., THOMSON, L. E.,
BERMAN, D., CZER, L. S., MARBÁN, L., MENDIZABAL, A. & JOHNSTON,
P. V. 2012. Intracoronary cardiosphere-derived cells for heart regeneration
after myocardial infarction (CADUCEUS): a prospective, randomised phase
1 trial. The Lancet, 379, 895-904.

CHAPTER 5
185
MALVINDI, M. A., GRECO, A., CONVERSANO, F., FIGUEROLA, A., CORTI, M.,
BONORA, M., LASCIALFARI, A., DOUMARI, H. A., MOSCARDINI, M.,
CINGOLANI, R., GIGLI, G., CASCIARO, S., PELLEGRINO, T. & RAGUSA,
A. 2011. Magnetic/Silica Nanocomposites as Dual-Mode Contrast Agents
for Combined Magnetic Resonance Imaging and Ultrasonography.
Advanced Functional Materials, 21, 2548-2555.
MARTINEZ, H. P., KONO, Y., BLAIR, S. L., SANDOVAL, S., WANG-RODRIGUEZ,
J., MATTREY, R. F., KUMMEL, A. C. & TROGLER, W. C. 2010. Hard shell
gas-filled contrast enhancement particles for colour Doppler ultrasound
imaging of tumors. Medchemcomm, 1, 266-270.
MOUSTAFA, Y. M. & EL-EGILI, K. 1998. Infrared spectra of sodium phosphate
glasses. Journal of Non-Crystalline Solids, 240, 144-153.
NAKATSUKA, M. A., HSU, M. J., ESENER, S. C., CHA, J. N. & GOODWIN, A. P.
2011. DNA-Coated Microbubbles with Biochemically Tunable Ultrasound
Contrast Activity. Advanced Materials, 23, 4908-4912.
PICKUP, D. M., GUERRY, P., MOSS, R. M., KNOWLES, J. C., SMITH, M. E. &
NEWPORT, R. J. 2007. New sol-gel synthesis of a (CaO)(0.3)(
Na2O)(0.2)(P2O5)(0.5) bioresorbable glass and its structural
characterisation. Journal of Materials Chemistry, 17, 4777-4784.
PICKUP, D. M., NEWPORT, R. J. & KNOWLES, J. C. 2012. Sol-Gel Phosphate-
based Glass for Drug Delivery Applications. Journal of Biomaterials
Applications, 26, 613-622.
SCHNEIDER, C. A., RASBAND, W. S. & ELICEIRI, K. W. 2012. NIH Image to
ImageJ: 25 years of image analysis. Nature Methods, 9, 671-675.
SCHUTT, E. G., KLEIN, D. H., MATTREY, R. M. & RIESS, J. G. 2003. Injectable
microbubbles as contrast agents for diagnostic ultrasound imaging: The key
role of perfluorochemicals. Angewandte Chemie-International Edition, 42,
3218-3235.
SENE, F. F., MARTINELLI, J. R. & GOMES, L. 2004. Synthesis and
characterization of niobium phosphate glasses containing barium and
potassium. Journal of Non-Crystalline Solids, 348, 30-37.
SHAPIRO, E. M., SHARER, K., SKRTIC, S. & KORETSKY, A. P. 2006. In vivo
detection of single cells by MRI. Magnetic Resonance in Medicine, 55, 242-
249.

CHAPTER 5
186
SHAPIRO, M. G., GOODWILL, P. W., NEOGY, A., YIN, M., FOSTER, F. S.,
SCHAFFER, D. V. & CONOLLY, S. M. 2014. Biogenic gas nanostructures
as ultrasonic molecular reporters. Nature Nanotechnology, 9, 311-316.
TA, C. N., LIBERMAN, A., MARTINEZ, H. P., BARBACK, C. V., MATTREY, R. F.,
BLAIR, S. L., TROGLER, W. C., KUMMEL, A. C. & WU, Z. 2012. Integrated
processing of contrast pulse sequencing ultrasound imaging for enhanced
active contrast of hollow gas filled silica nanoshells and microshells. Journal
of Vacuum Science & Technology B, 30.
WILLMANN, J. K., PAULMURUGAN, R., CHEN, K., GHEYSENS, O.,
RODRIGUEZ-PORCEL, M., LUTZ, A. M., CHEN, I. Y., CHEN, X. &
GAMBHIR, S. S. 2008. US imaging of tumor angiogenesis with
microbubbles targeted to vascular endothelial growth factor receptor type 2
in mice. Radiology, 246, 508-518.
XING, Z. W., WANG, J. R., KE, H. T., ZHAO, B., YUE, X. L., DAI, Z. F. & LIU, J. B.
2010. The fabrication of novel nanobubble ultrasound contrast agent for
potential tumor imaging. Nanotechnology, 21.
YAGHOUBI, S. S., COUTO, M. A., CHEN, C.-C., POLAVARAM, L., CUI, G., SEN,
L. & GAMBHIR, S. S. 2006. Preclinical safety evaluation of 18F-FHBG: a
PET reporter probe for imaging herpes simplex virus type 1 thymidine
kinase (HSV1-tk) or mutant HSV1-sr39tk's expression. Journal of Nuclear
Medicine, 47, 706-715.

CHAPTER 6
187
CHAPTER 6
General Discussion and Future Directions

CHAPTER 6
188
In the presented study, the successful sol-gel synthesis of phosphate-based
glasses at a relatively low processing temperature using triethyl phosphate as a
phosphorus precursor in the P2O5-TiO2, P2O5-CaO-TiO2, P2O5-CaO-Na2O and
P2O5-CaO-Na2O-TiO2 systems was reported. The synthesised glasses, were
characterised in terms of structural properties including XRD, 31P MAS-NMR, EDX,
and FTIR spectroscopy that indicated the successful production of phosphate-
based glasses. However, there were some limitations such as synthesis
compositional ranges with an upper limit of about 60 mol% P2O5 for binary P2O5-
TiO2 glasses and also phosphorus loss of up to 11 mol% during the sol-gel reaction
was seen. To overcome the high phosphorus loss, triethyl phosphate was replaced
with n-butyl phosphate to sol-gel synthesise ternary P2O5-CaO-Na2O and
quaternary P2O5-CaO-Na2O-TiO2 glass systems. The EDX results of these glasses
revealed relatively lower phosphorus loss during the sol-gel synthesis of these
glasses. In addition, substituting titanium in place of sodium or calcium reduced the
amount of phosphorus loss during the sol-gel reaction and bulk, transparent and
glassy-like specimens were obtained for the glasses with high titanium contents.
These results indicated, incorporation of titanium into the phosphate-based glasses
serves to stabilise the phosphate-network due to the cross-linking effect of titanium.
This effect was confirmed by 31P MAS-NMR results that showed the formation of
Q1(Ti-O-P) species with a slight increase in the amount of Q2 phosphate units. FTIR
spectroscopy data also correlated with the NMR results that suggesting Ti may act
as a conditional network former in phosphate-based sol-gel derived glasses.
We used sol-gel derived glasses with the general formula of (P2O5)55–(CaO)25–
(Na2O)(20-x)–(TiO2)x, where X = 0, 5, 10 or 15 as a scaffold for bone tissue
engineering applications. The degradation studies revealed that the dissolution rate
of these glasses significantly reduced as titanium substituted in place of sodium

CHAPTER 6
189
because of the cross-linking effect of titanium and gave an indication of how the
solubility of phosphate-based glasses can be controlled for various biomedical
applications. Cell culture studies were carried out on these glasses that showed the
degradation rate has a significant effect on the activity of the cells. The substitution
of Na2O with 5 or 10 mol% TiO2 improved cytocompatibility that was also supported
by SEM and CLSM images that showed significant mineral formation and cells
residing on the glass microparticles surface. However, cells cultured on Ti15 failed
to recover and higher heat treatment temperature might be needed to evaporate the
remaining toxic solvents in the glass structure.
The electrospraying technique was applied, for the first time to these sol-gel derived
glasses, according to the author’s knowledge, and was designed and developed to
prepare ternary P2O5-CaO-Na2O glass nanospheres in the diameter size range of
200-500 nm. The amorphous and glassy nature of these nanosphere particles was
confirmed via XRD, 31P NMR, and FTIR analysis. This probe was used to label
mesenchymal stem cells with an in vitro and in vivo detection limit of 5 and 9 µg.mL-
1, respectively. Cell counts down to 4000 were measured by ultrasound imaging
with no cytotoxicity at doses needed for imaging. Also, due to the relatively low
synthesis temperature, these phosphate-based glass nanospheres (PGNs) offered
the potential to incorporate therapeutic molecules for drug delivery application. The
UPLC results from the drug-loaded PGNs in an aqueous medium revealed a
constant and linear release of TCH molecules within the first 4 hours of the study
period with easily metabolised degradation components in the body that make them
an attractive choice in drug delivery applications. Together, these results
suggested, PGNs are useful for both in vivo and in vitro ultrasound imaging and
have the utility for cell tracking and as a drug delivery system that can make them a

CHAPTER 6
190
promising candidate for theranostic applications (serve dual roles as diagnostic and
therapeutic agents) especially in cancer treatment.
From the synthesis point of view, further work could be focused on alternative
solvents and precursors to be able to synthesise phosphate-based glasses at even
lower temperatures. There is also a possibility to incorporate other metal oxides
such as iron, copper or silver into the phosphate-based glasses for various
biomedical applications. For example, iron-containing phosphate-based glasses
have been prepared via melt-quench method and showed high durability and
controllable degradation rate that can make them a good choice for tissue
engineering applications (Abou Neel et al., 2005). However, to date, no study has
been published regarding the possibility to synthesise these glasses via a sol-gel
method that might be related to the limitation in access to the right Fe precursor.
Our preliminary work on iron-containing sol-gel derived glasses confirmed iron (III)
isopropoxide (2.55% in isopropanol, Alfa Aesar, Heysham, UK) can be used as a
Fe precursor to synthesise quaternary glasses with the general formula of (P2O5)50–
(CaO)30–(Na2O)(15-x)–(Fe2O3)x, where X = 0, 2.5 or 5. Initial XRD results confirmed
the amorphous and glassy nature of the prepared samples. Further works could be
focused on evaluation of their structural property and potential biomedical
applications.
Cell culture studies on titanium-containing glasses offer several avenues for the
future research on biomedical applications of these glasses, such as a coating for
medical implants to provide a high degree of biocompatibility and promote the
healing response without side effects. Initial studies showed that there is a
possibility to deposit titanium-containing sol-gel derived glasses on metallic
implants via the electrospraying technique. Low processing temperatures of the sol-
gel synthesis also enables incorporation of bioactive molecules that can promote

CHAPTER 6
191
bone formation or antimicrobial compounds that can subsequently be released in a
localised and controlled manner to reduce the risk of bacterial infection of medical
implants.
The electrospraying technique has allowed us to prepare nano-size glass spheres
for both therapeutic and diagnostic applications. Future work may focus on reducing
the degradation rate of the glass nanospheres by introducing Ti into the glass
structure to increase the imaging window and therapeutic release of a drug
molecule for longer periods (Lakhkar et al., 2012, Kiani et al., 2012, Foroutan et al.,
2015). The surface of these glass nanospheres may also functionalised with
specific ligands for tasks beyond regenerative medicine, including targeted drug
delivery and tumour imaging after i.v injection that can make them an attractive
candidate for simultaneous diagnostic and therapeutic applications especially in
cancer treatment (Cheng et al., 2010).
The other limitation in drug delivery applications of the prepared glass nanospheres
is related to the heat treatment temperature that was applied during the sol-gel
synthesis and subsequent electrospraying. While the processing temperature is
significantly lower than the previous studies on the sol-gel preparation of
phosphate-based glasses (Carta et al., 2005, Pickup et al., 2007, Carta et al.,
2007), however, still just a few numbers of drug molecules show stability at the
chosen synthesis temperature (200 °C). The idea of spraying the sol over the liquid
nitrogen instead of heated silicone oil can be an alternative. Following that the
obtained particles are transferred into a freeze dryer to evaporate the solvents. Our
preliminary work showed the possibility of using this novel technique and future
work may be focused on the development of this technique to prepare a wide range
of drug-loaded nanoparticles for drug delivery purposes.

CHAPTER 6
192
References
ABOU NEEL, E. A., AHMED, I., BLAKER, J. J., BISMARCK, A., BOCCACCINI, A.
R., LEWIS, M. P., NAZHAT, S. N. & KNOWLES, J. C. 2005. Effect of iron on the
surface, degradation and ion release properties of phosphate-based glass fibres.
Acta Biomaterialia, 1, 553-563.
CARTA, D., PICKUP, D. M., KNOWLES, J. C., AHMED, I., SMITH, M. E. &
NEWPORT, R. J. 2007. A structural study of sol-gel and melt-quenched phosphate-
based glasses. Journal of Non-Crystalline Solids, 353, 1759-1765.
CARTA, D., PICKUP, D. M., KNOWLES, J. C., SMITH, M. E. & NEWPORT, R. J.
2005. Sol-gel synthesis of the P(2)O(5)-CaO-Na(2)O-SiO(2) system as a novel
bioresorbable glass. Journal of Materials Chemistry, 15, 2134-2140.
CHENG, S. H., LEE, C. H., CHEN, M. C., SOURIS, J. S., TSENG, F. G., YANG, C.
S., MOU, C. Y., CHEN, C. T. & LO, L. W. 2010. Tri-functionalization of mesoporous
silica nanoparticles for comprehensive cancer theranostics-the trio of imaging,
targeting and therapy. Journal of Materials Chemistry, 20, 6149-6157.
FOROUTAN, F., DE LEEUW, N., MARTIN, R., PALMER, G., OWENS, G., KIM, H.-
W. & KNOWLES, J. 2015. Novel sol–gel preparation of (P2O5)0.4–(CaO)0.25–
(Na2O)X–(TiO2)(0.35−X) bioresorbable glasses (X = 0.05, 0.1, and 0.15). Journal
of Sol-Gel Science and Technology, 73, 434-442.
KIANI, A., LAKHKAR, N. J., SALIH, V., SMITH, M. E., HANNA, J. V., NEWPORT,
R. J., PICKUP, D. M. & KNOWLES, J. C. 2012. Titanium-containing bioactive
phosphate glasses. Philosophical Transactions of the Royal Society a-Mathematical
Physical and Engineering Sciences, 370, 1352-1375.
LAKHKAR, N. J., PARK, J. H., MORDAN, N. J., SALIH, V., WALL, I. B., KIM, H. W.,
KING, S. P., HANNA, J. V., MARTIN, R. A., ADDISON, O., MOSSELMANS, J. F.
W. & KNOWLES, J. C. 2012. Titanium phosphate glass microspheres for bone
tissue engineering. Acta Biomaterialia, 8, 4181-4190.
PICKUP, D. M., GUERRY, P., MOSS, R. M., KNOWLES, J. C., SMITH, M. E. &
NEWPORT, R. J. 2007. New sol-gel synthesis of a
(CaO)(0.3)(Na2O)(0.2)(P2O5)(0.5) bioresorbable glass and its structural
characterisation. Journal of Materials Chemistry, 17, 4777-4784.

APPENDICES
193
APPENDICES

APPENDICES
194
Appendix I:
A1. Indirect calculation of phosphate units
Instead of using 31P MAS-NMR data, the amount of phosphate units can be
obtained indirectly by assumption of exclusively network modifying roles for CaO
and Na2O. For example, in chapter 5, (P2O5)55 - (CaO)30 - (Na2O)15 sol-gel derived
glasses may be written as Na39.2Ca37.9P85O270 according to the EDX results. The O/P
ratio is 3.18 that suggests the phosphate species will be predominantly Q1 and Q2.
The average formula for Q1 and Q2 phosphate species are (PO3.5)2- and (PO3)- and
in order to maintain electroneutrality the total cation charge of +115 must be
balanced by a combination of these species:
115 = 2Q1 + Q2
And since there are a total of 85 phosphorus atoms per formula unit:
85 = Q1 + Q2
By using these two equations it can be found the Q1 and Q2 amount of 35 and 65 %
respectively. These results show higher polymerisation in comparison with the
obtained data from the 31P MAS-NMR spectrum. These results suggested that may
be higher synthesis temperature is needed to evaporate the remaining solvents and
to make the phosphate network more interconnected. However, it would limit the
potential biomedical applications of the phosphate-based sol-gel derived glasses
that was the main aim of this project. Future work may focus on the effect of various
heat treatment temperature on the polymerisation rate of the phosphate-based
glasses.
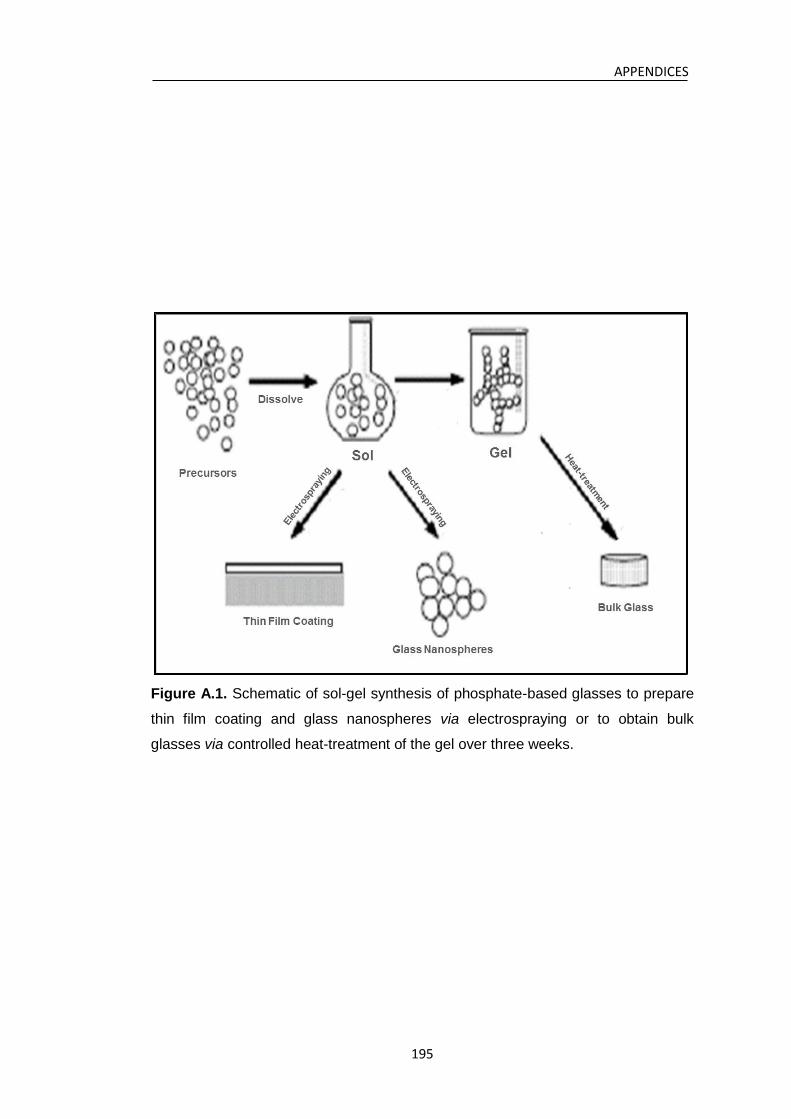
APPENDICES
195
Figure A.1. Schematic of sol-gel synthesis of phosphate-based glasses to prepare
thin film coating and glass nanospheres via electrospraying or to obtain bulk
glasses via controlled heat-treatment of the gel over three weeks.

APPENDICES
196
Figure A.2. Various electrospraying modes (A) and steps of nanospheres
production via electrospraying (B) (Jaworek and Sobczyk, 2008).
A
B

APPENDICES
197
Figure A.3. SEM images of sol-gel derived glasses (after heat-treatment) created
by electrospraying at; A) voltage of 12 kV and flow rate of 1 mL.h-1, B) voltage of 15
kV and flow rate of 0.5 mL.h-1, C) voltage of 18 kV and flow rate of 0.5 mL.h-1, D)
voltage of 20 kV and flow rate of 0.4 mL.h-1, and voltage of 20 kV and flow rate of
0.2 mL.h-1 (E and F).

APPENDICES
198
Figure A.4. Photographs of; electrospray deposition of quaternary (P2O5)55-(CaO)25-
(Na2O)10-(TiO2)10 glass on (A) aluminium foil and (B) titanium disc. Panel C is SEM
image of coated titanium disc after heat-treatment at 200 °C. Initial cell proliferation
study (MG-63 cells) results on Ti coated discs (n=3) is shown in panel D. Error bars
represent the standard deviation.
B
C
A
D

APPENDICES
199
Appendix II: List of publications
1. LEE, I. H., FOROUTAN, F., LAKHKAR, N. J., GONG, M. S. & KNOWLES, J. C.
2013. Sol-gel synthesis and structural characterization of P2O5-CaO-Na2O
glasses. Physics and Chemistry of Glasses-European Journal of Glass Science
and Technology Part B, 54, 115-120.
2. LEE, I. H., SHIN, S. H., FOROUTAN, F., LAKHKAR, N. J., GONG, M. S. &
KNOWLES, J. C. 2013. Effects of magnesium content on the physical, chemical
and degradation properties in a Mgo-CaO-Na2O-P2O5 glass system. Journal of
Non-Crystalline Solids, 363, 57-63.
3. FOROUTAN, F., DE LEEUW, N., MARTIN, R., PALMER, G., OWENS, G. J.,
KIM, H.-W. & KNOWLES, J. C. 2015. Novel sol–gel preparation of (P2O5)0.4–
(CaO)0.25–(Na2O)X–(TiO2)(0.35−X) bioresorbable glasses (X = 0.05, 0.1, and
0.15). Journal of Sol-Gel Science and Technology, 73, 434-442.
4. FOROUTAN, F., JOKERST, J. V., GAMBHIR, S. S., VERMESH, O., KIM, H.-W.
& KNOWLES, J. C. 2015. Sol–Gel Synthesis and Electrospraying of
Biodegradable (P2O5)55–(CaO)30–(Na2O)15 Glass Nanospheres as a
Transient Contrast Agent for Ultrasound Stem Cell Imaging. ACS Nano, 9, 1868-
1877.
5. FOROUTAN, F., WALTER, N. J., OWENS, G. J., MORDAN, N. J., KIM, H.-W.
DE LEEUW, & KNOWLES, J. C. 2015. Sol-gel synthesis of quaternary (P2O5)55–
(CaO)25–(Na2O)(20-X)–(TiO2)X bioresorbable glasses for bone tissue engineering
applications (X = 0, 5, 10, or 15). Biomedical Materials Journal, accepted.
6. AL QAYSI, M., WALTER, N. J., FOROUTAN, F., OWENS, G. J., & KNOWLES, J.
C. 2015. Strontium- and titanium-containing phosphate-based glasses with
prolonged degradation for bone tissue engineering. Journal of Biomaterials
Applications, DOI: 10.1177/0885328215588898, (MQ, NW & FF contributed
equally).
7. KNOWLES, J. C., OWENS, G. J., RAJENDRA, S., FOROUTAN, F., AL QAYSI,
M., LEE, E. J., HAN, M. N., MAHAPATRA, C., & KIM, H. W. Sol-gel Based
Materials for Biomedical Applications: A Review. Progress in Materials Science,
submitted.

APPENDICES
200
Appendix III: List of conferences
1. FOROUTAN, F., DE LEEUW, N., & KNOWLES, J. Novel sol-gel preparation of
binary (TiO2)(x)-(P2O5)(100-X) nanospheres via electrospraying for biomedical
applications (x=40, 45, 50). 4th International Conference on Nanotek, December
1-3, 2014, San Francisco, USA.
2. FOROUTAN, F., DE LEEUW, N., & KNOWLES, J. C. Sol-gel synthesis of
(P2O5)0.4-(CaO)0.25-(Na2O)10-(TiO2)25 for drug delivery applications. 25st European
Conference on Biomaterials, September 8-12, 2013, Madrid, Spain.
3. FOROUTAN, F., DE LEEUW, N. & KNOWLES, J. C. Novel sol-gel synthesis of
(P2O5)50-(CaO)30-(Na2O)15-(Fe2O3)5 glasses for biomedical applications. 26st
European Conference on Biomaterials, September 1-4, 2014, Liverpool, UK.


![CHAPTER DIELECTRIC CONSTANT kc. - Shodhgangashodhganga.inflibnet.ac.in/bitstream/10603/389/10/10_chapter 4.pdf · Sayer[32] for vanadium phosphate glasses. Dielectric properties and](https://static.fdocuments.net/doc/165x107/6060646a39ee0b235b229fda/chapter-dielectric-constant-kc-4pdf-sayer32-for-vanadium-phosphate-glasses.jpg)


