SOILS AND FOUNDATIONS Lesson 06 667 Geotech Design/Lesson 06-Chapt… · After Slide C SR 42...
114
SOILS AND FOUNDATIONS SOILS AND FOUNDATIONS Testing Experience Theory Lesson 06 Lesson 06 Chapter 6 Chapter 6 – – Slope Stability Slope Stability
Transcript of SOILS AND FOUNDATIONS Lesson 06 667 Geotech Design/Lesson 06-Chapt… · After Slide C SR 42...
SOILS AND FOUNDATIONSSOILS AND FOUNDATIONS
Testing
Experience
Theory
Lesson 06Lesson 06Chapter 6 Chapter 6 –– Slope StabilitySlope Stability
TopicsTopics
ggTopic 1 (Section 6.0 Topic 1 (Section 6.0 –– 6.8)6.8)-- Stability analysis of slopesStability analysis of slopes
ggTopic 2 (Section 6.9)Topic 2 (Section 6.9)-- Improving the stability of embankmentsImproving the stability of embankments

SLOPE STABILITYSLOPE STABILITY
Lesson 06 Lesson 06 -- Topic 1Topic 1Stability analysis of slopesStability analysis of slopes
Section 6.0 Section 6.0 –– 6.86.8
Learning OutcomesLearning Outcomes
ggAt the end of this session, the participant will At the end of this session, the participant will be able to:be able to:-- Recall modes of slope failureRecall modes of slope failure-- Explain effects of water on slope stabilityExplain effects of water on slope stability-- Discuss slope stability circular and block Discuss slope stability circular and block
analysesanalyses-- Compute safety factor by chart solutionCompute safety factor by chart solution
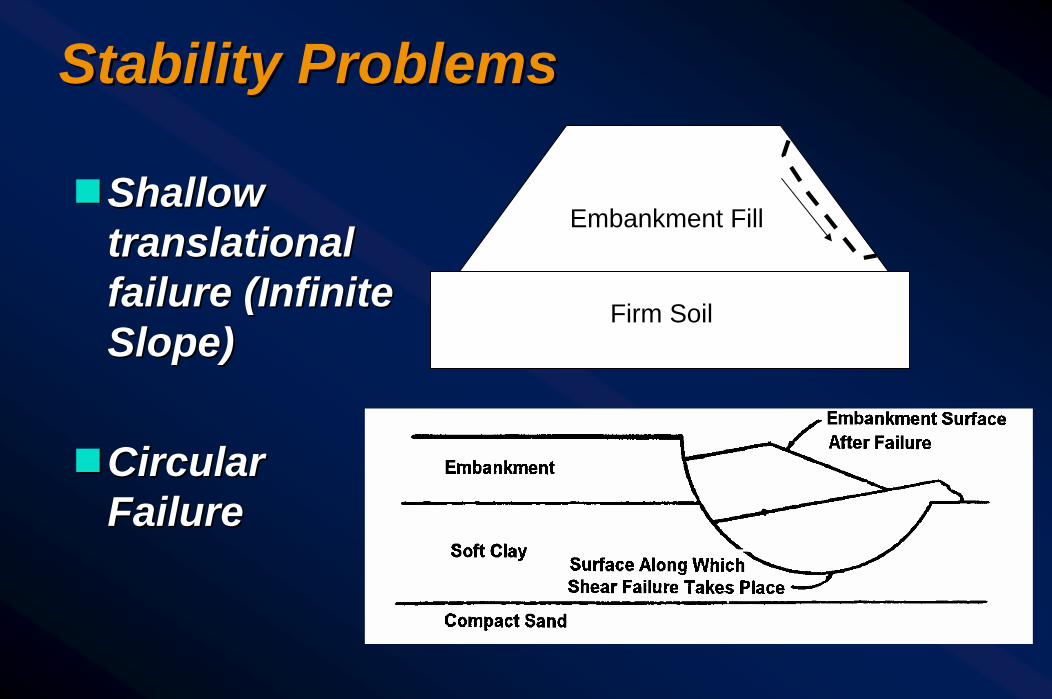
Stability ProblemsStability Problems
Embankment Fill
Firm Soil
ggShallow Shallow translational translational failure (Infinite failure (Infinite Slope)Slope)
ggCircular Circular FailureFailure
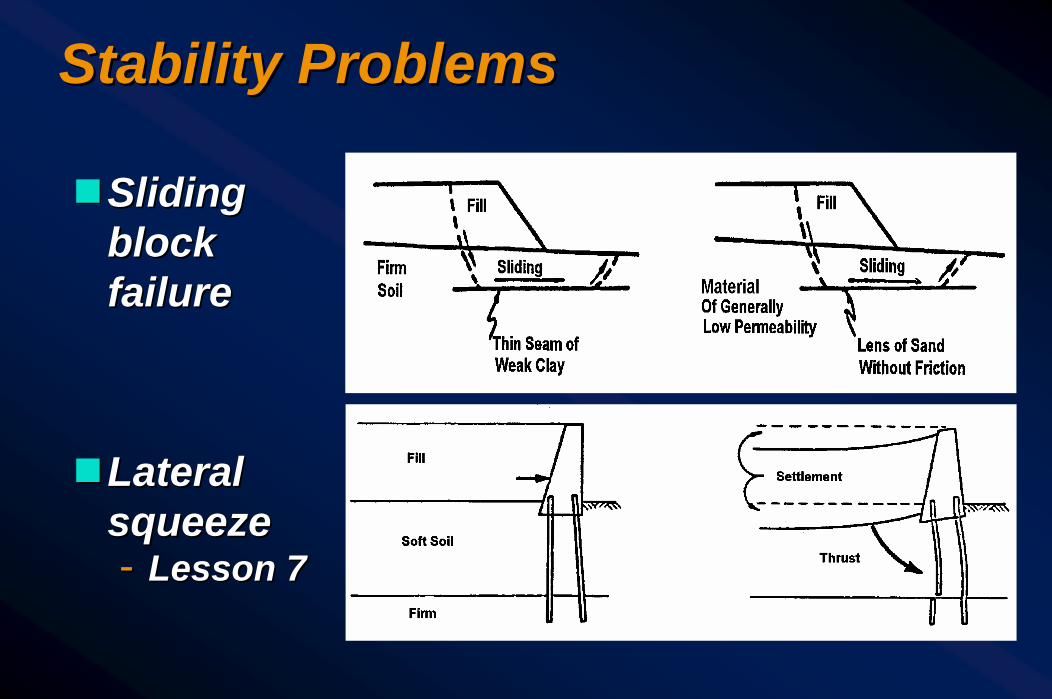
Stability ProblemsStability Problems
ggSliding Sliding block block failurefailure
ggLateral Lateral squeezesqueeze-- Lesson 7Lesson 7
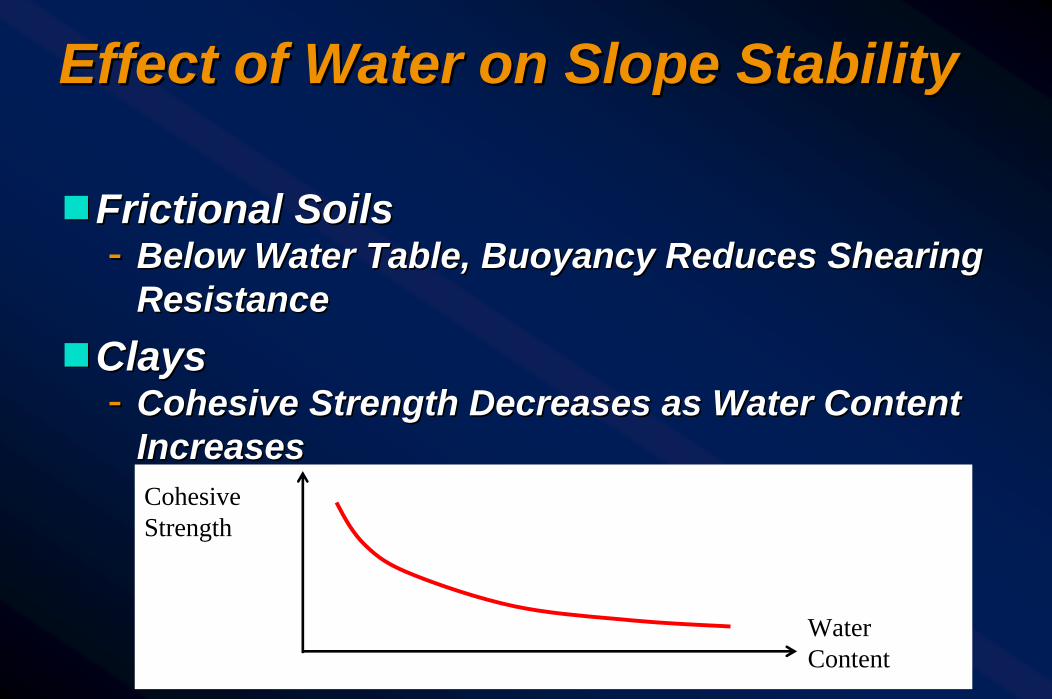
Effect of Water on Slope StabilityEffect of Water on Slope Stability
ggFrictional SoilsFrictional Soils-- Below Water Table, Buoyancy Reduces Shearing Below Water Table, Buoyancy Reduces Shearing
ResistanceResistanceggClaysClays
-- Cohesive Strength Decreases as Water Content Cohesive Strength Decreases as Water Content IncreasesIncreasesCohesive Strength
Water Content
Effect of Water on Slope Stability Effect of Water on Slope Stability (Cont’d)(Cont’d)ggFills on Clays and SiltsFills on Clays and Silts
-- Soil Consolidates as Water is Squeezed Out Soil Consolidates as Water is Squeezed Out --Factor of Safety Increases With TimeFactor of Safety Increases With Time
ggCuts in ClayCuts in Clay-- Soil Absorbs Water When Overburden Pressure Soil Absorbs Water When Overburden Pressure
Removed Removed -- Factor of Safety Decreases With TimeFactor of Safety Decreases With Time

Effect of Water on Slope Stability Effect of Water on Slope Stability (Cont’d)(Cont’d)ggShalesShales, , ClaystonesClaystones, Siltstones, Etc., Siltstones, Etc.
-- Weak Rock Materials “Slake” When Exposed to Weak Rock Materials “Slake” When Exposed to Water Water -- Embankments Undergo Internal Embankments Undergo Internal Settlement or FailureSettlement or Failure

Design Factor of SafetyDesign Factor of Safety
ggMinimum FS = 1.25 for highway side slopesMinimum FS = 1.25 for highway side slopes
ggUse FS = 1.3 to 1.5 for critical slopes such as Use FS = 1.3 to 1.5 for critical slopes such as end slopes under abutments, slopes end slopes under abutments, slopes containing footings, major retaining containing footings, major retaining structuresstructures
Design Factor of SafetyDesign Factor of Safety
ggSelection of FS depends on:Selection of FS depends on:
-- Method of stability analysisMethod of stability analysis
-- Method used to determine shear strengthMethod used to determine shear strength
-- Degree of confidence in reliability of subsurface Degree of confidence in reliability of subsurface datadata
-- Consequences of failureConsequences of failure
-- Criticality of the applicationCriticality of the application
Infinite Slope AnalysisInfinite Slope Analysis
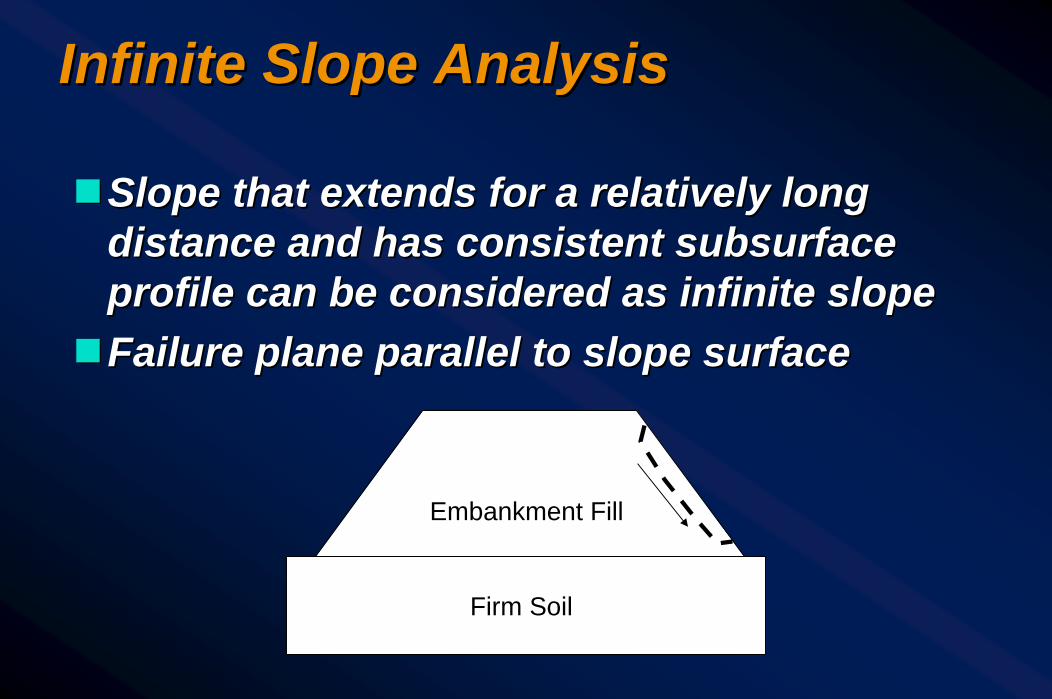
ggSlope that extends for a relatively long Slope that extends for a relatively long distance and has consistent subsurface distance and has consistent subsurface profile can be considered as infinite slopeprofile can be considered as infinite slope
ggFailure plane parallel to slope surfaceFailure plane parallel to slope surface
Embankment Fill
Firm Soil
Infinite Slope Analysis in Dry SandsInfinite Slope Analysis in Dry Sands
T
W
b
h
SlopeSurface
FailureSurface
S
N
β
W
S
N β
Force Polygon
N
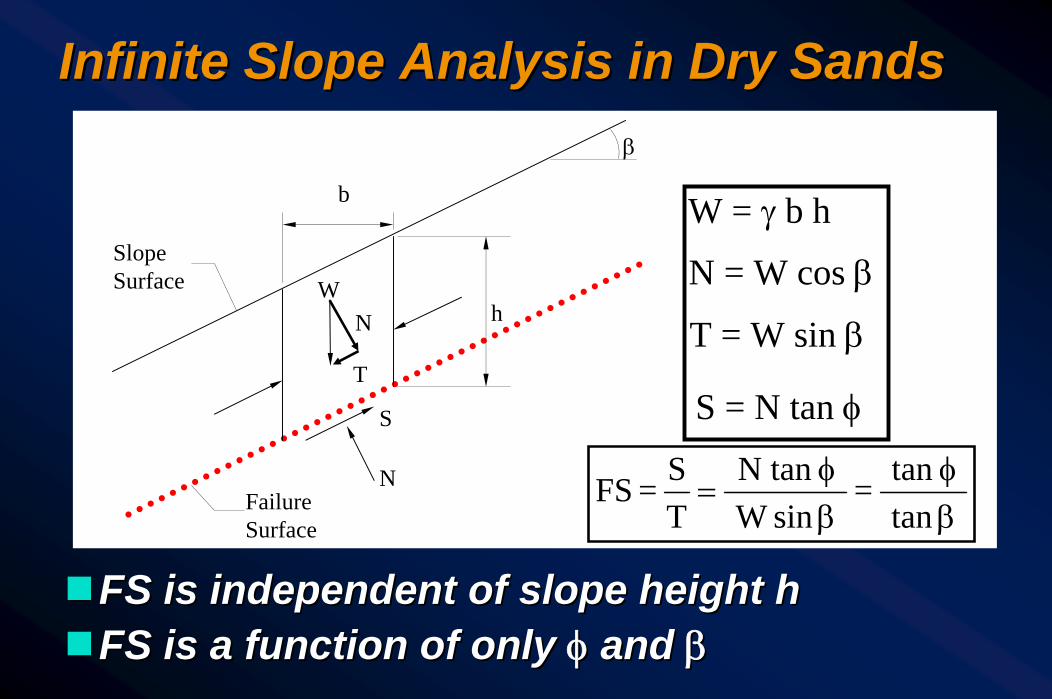
W = γ b h
N = W cos β
T = W sin β
S = N tan φ
βφ
βφ
= tan
tan = sinW
N tanTS = FS
ggFS is independent of slope height hFS is independent of slope height hggFS is a function of only FS is a function of only φφ and and ββ
cc--φφ soils with Watersoils with Water
h cos2β
Seepage Flow
Failure Surface
Slope Surface
h
β
h W
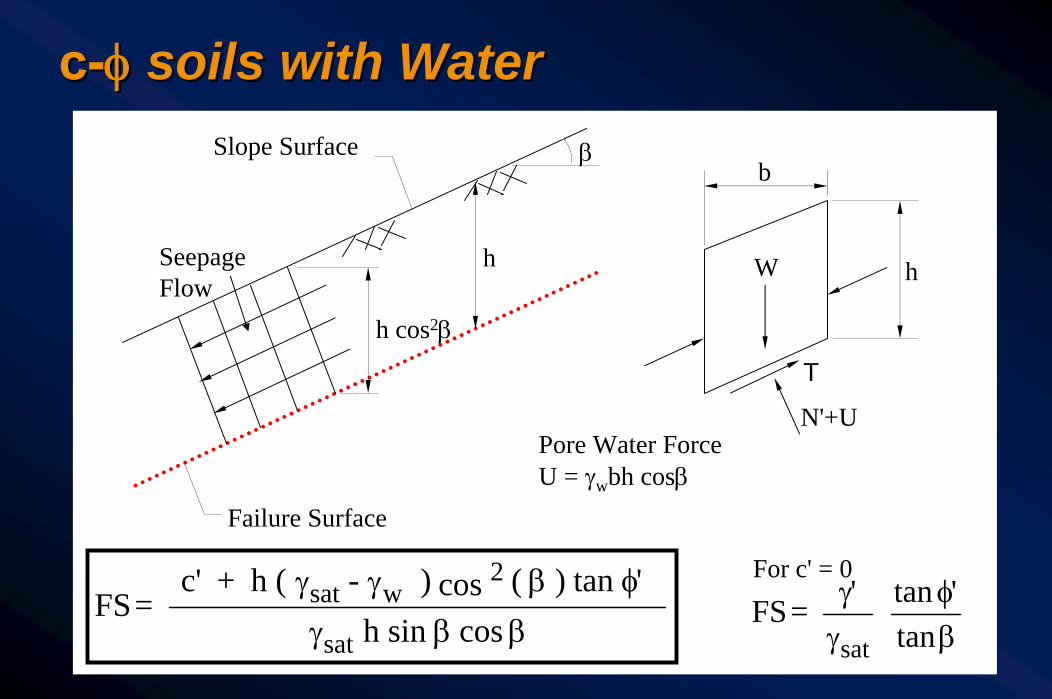
N'+U Pore Water Force U = γwbh cosβ
b
T
ββγ
φβγγ cos sin h
'tan ) ( cos ) - (h + c' = FS
sat
2 wsat
βφ
γγ
tan'tan ' = FS
sat
For c' = 0
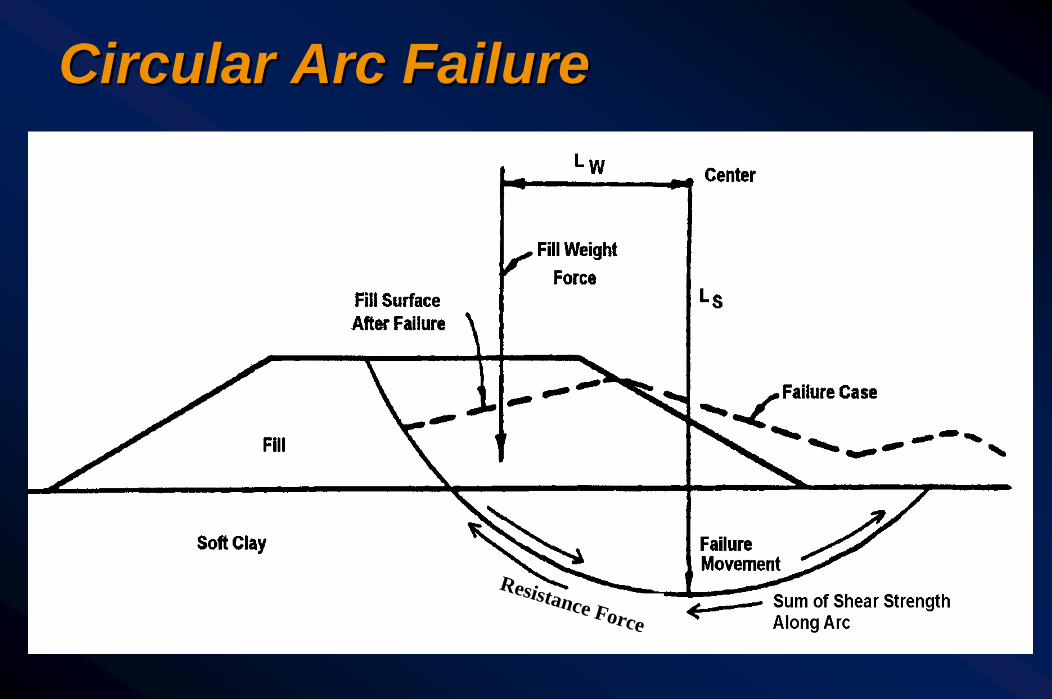
Circular Arc FailureCircular Arc Failure
Resistance Force
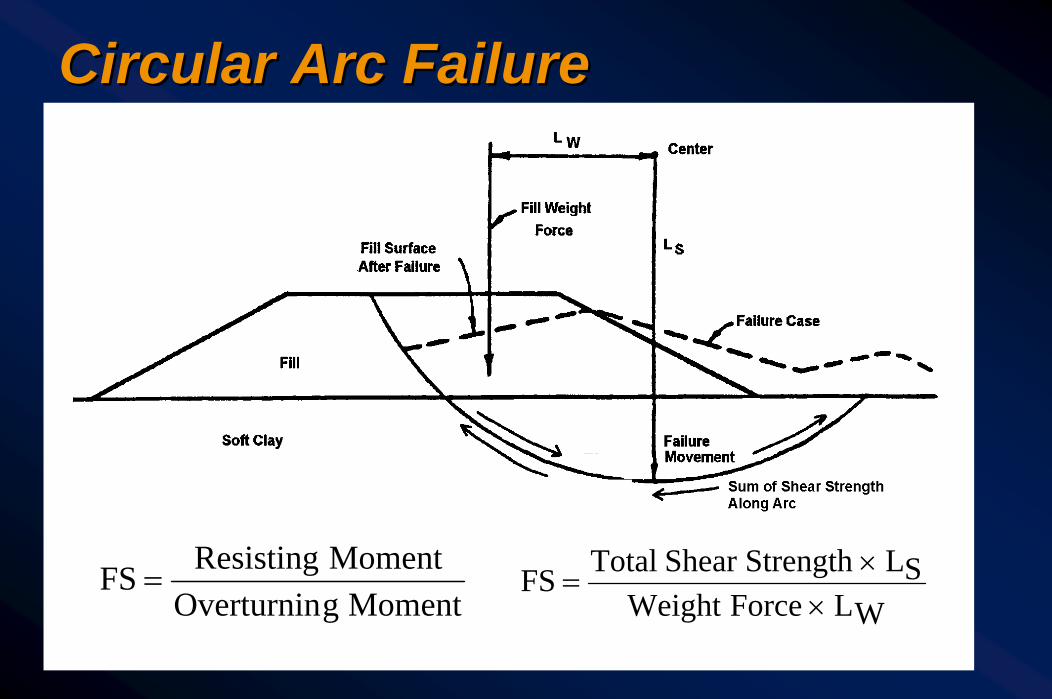
Circular Arc FailureCircular Arc Failure
WLForceWeightSLStrengthShearTotalFS
××
=MomentgOverturnin
MomentResistingFS =
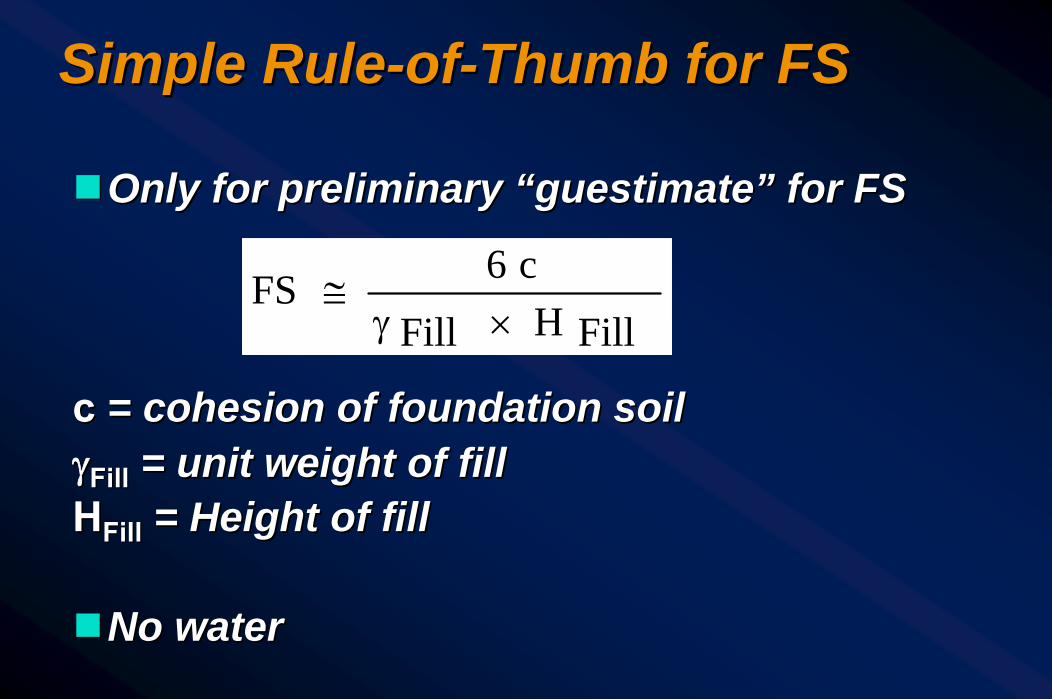
Simple RuleSimple Rule--ofof--Thumb for FSThumb for FS
ggOnly for preliminary “Only for preliminary “guestimateguestimate” for FS” for FS
c c = cohesion of foundation soil= cohesion of foundation soilγγFillFill = unit weight of fill= unit weight of fillHHFillFill = Height of fill= Height of fill
ggNo waterNo water
FillHFill
c6FS×γ
≅

What is the FS for following case?What is the FS for following case?
1.69ft)pcf)(30(130
psf)(6)(1100FS ==
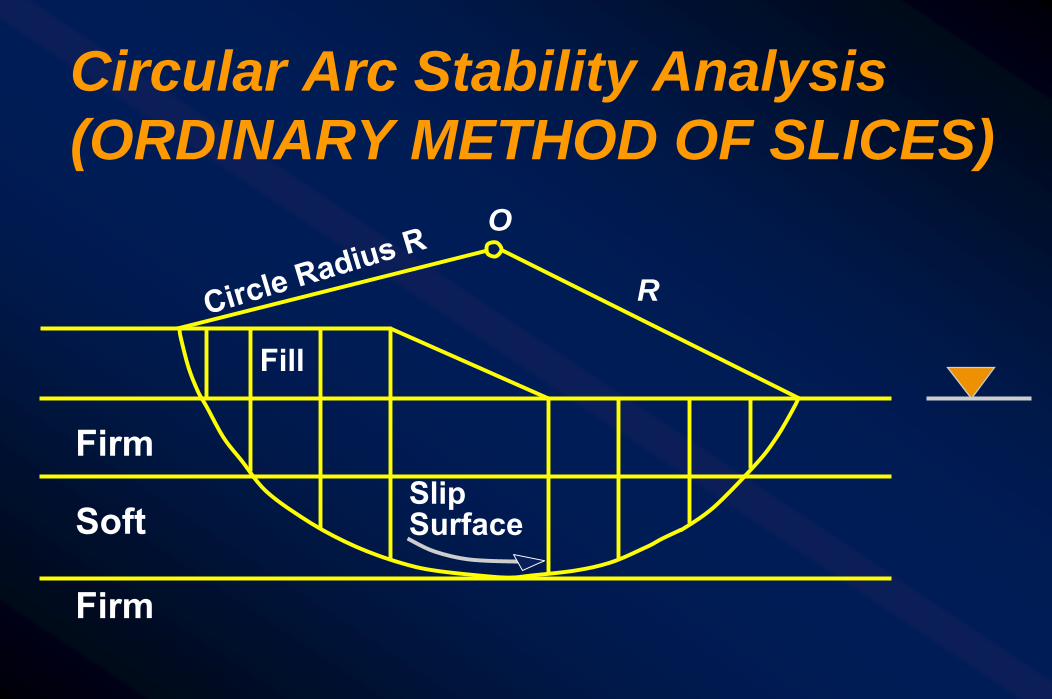
Circular Arc Stability Analysis(ORDINARY METHOD OF SLICES)
O
Firm
Soft
FirmSlipSurface
Fill
RCircle Radius R

Step by Step ProcedureStep by Step Procedure
1.1. Draw crossDraw cross--section to natural scalesection to natural scale2.2. Select failure surfaceSelect failure surface3.3. Divide the failure mass into 10Divide the failure mass into 10--15 slices 15 slices
using suggestions on Page 6using suggestions on Page 6--1414

Forces on a SliceForces on a SliceWithout WaterWithout Water With WaterWith Water
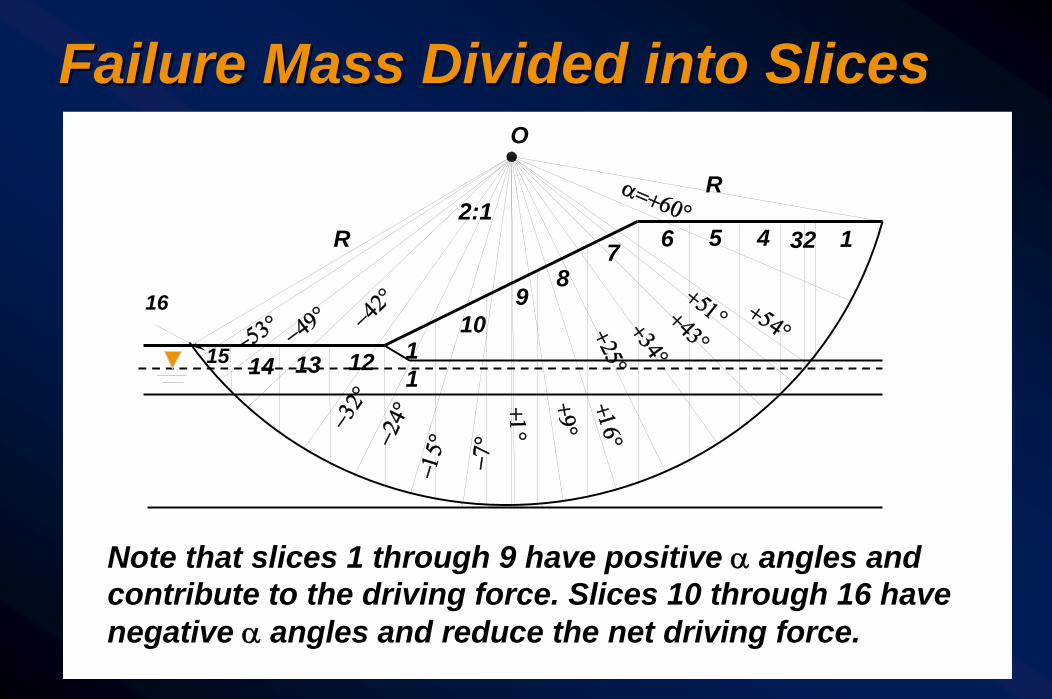
Failure Mass Divided into SlicesFailure Mass Divided into Slices
16
O
R
R
12345678
9
11
12131415
2:1
10
α=+60°
+54°
+51°+43°
+34°
+25°+16°
+9°
+1°
−7°
−15°−2
4°−32°
−42°
−49°−53°
Note that slices 1 through 9 have positive α angles and contribute to the driving force. Slices 10 through 16 have negative α angles and reduce the net driving force.

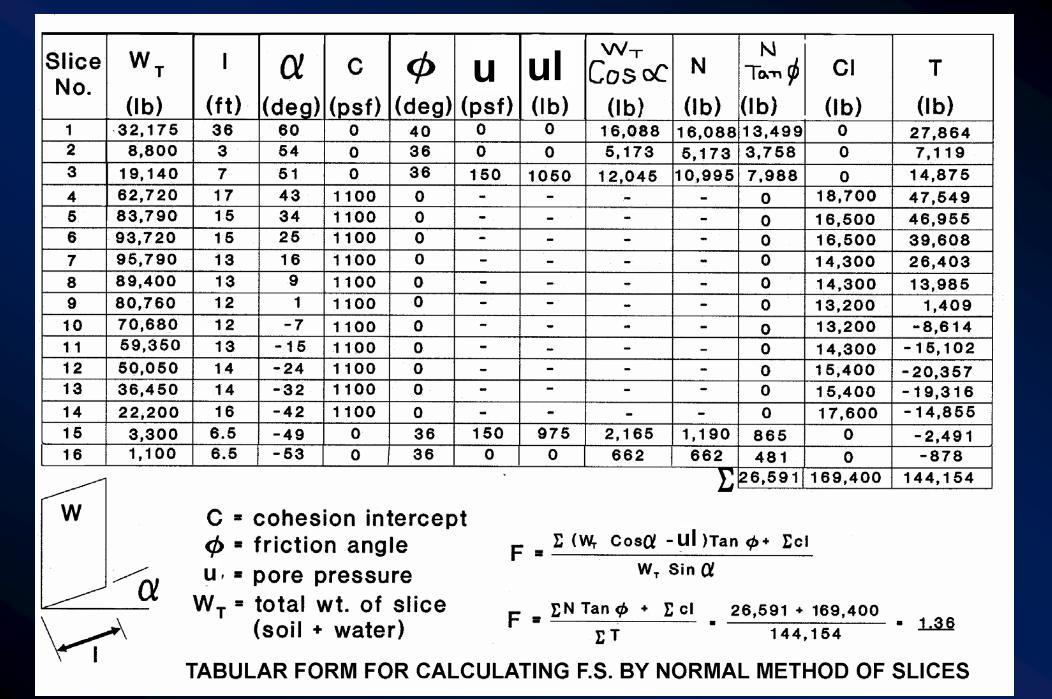
Step by Step ProcedureStep by Step Procedure4.4. Compute total weight ( WCompute total weight ( WTT ) of each slice) of each slice5.5. Compute frictional resisting force for each slice Compute frictional resisting force for each slice
N TanN Tanφφ -- ulul6.6. Compute cohesive resisting force for each sliceCompute cohesive resisting force for each slice
ClCl7.7. Compute tangential driving force (T) for each Compute tangential driving force (T) for each
sliceslice8.8. Sum resisting and driving forces for ALL slices Sum resisting and driving forces for ALL slices
and compute FSand compute FS
T1ctanN
ForcesDrivingForcesResistingFS
∑∑+φ∑
=∑
∑=
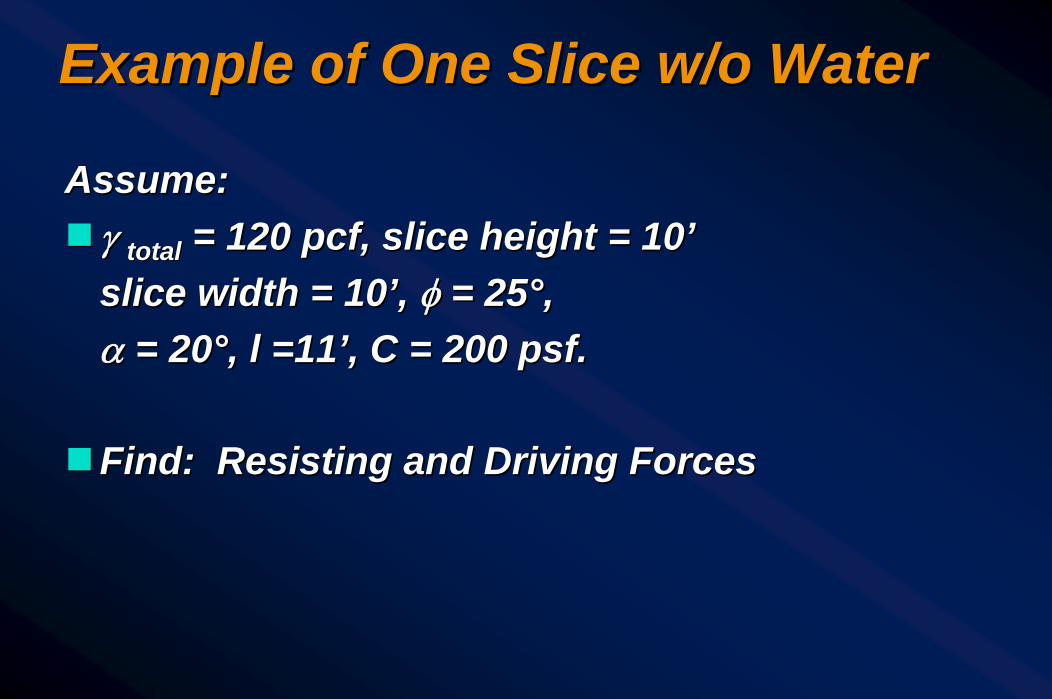
Example of One Slice w/o WaterExample of One Slice w/o Water
Assume: Assume: gg γγ totaltotal = 120 = 120 pcfpcf, slice height = 10, slice height = 10’’
slice width = 10slice width = 10’’, , φφ = 25= 25°°, , αα = 20= 20°°, l =11, l =11’’, C = 200 , C = 200 psfpsf. .
ggFind: Resisting and Driving Forces Find: Resisting and Driving Forces

Compute Slice Weight and Normal Compute Slice Weight and Normal ForceForce
W W TT = = γγ totaltotal x slice area (x 1x slice area (x 1’’ thick)thick)= 120 = 120 pcfpcf x 10x 10’’ x 10x 10’’= 12,000 lbs= 12,000 lbs
N N = W= WTT coscos αα -- ulul= 12,000 lbs x = 12,000 lbs x coscos 2020°°= 11,276 lbs= 11,276 lbs
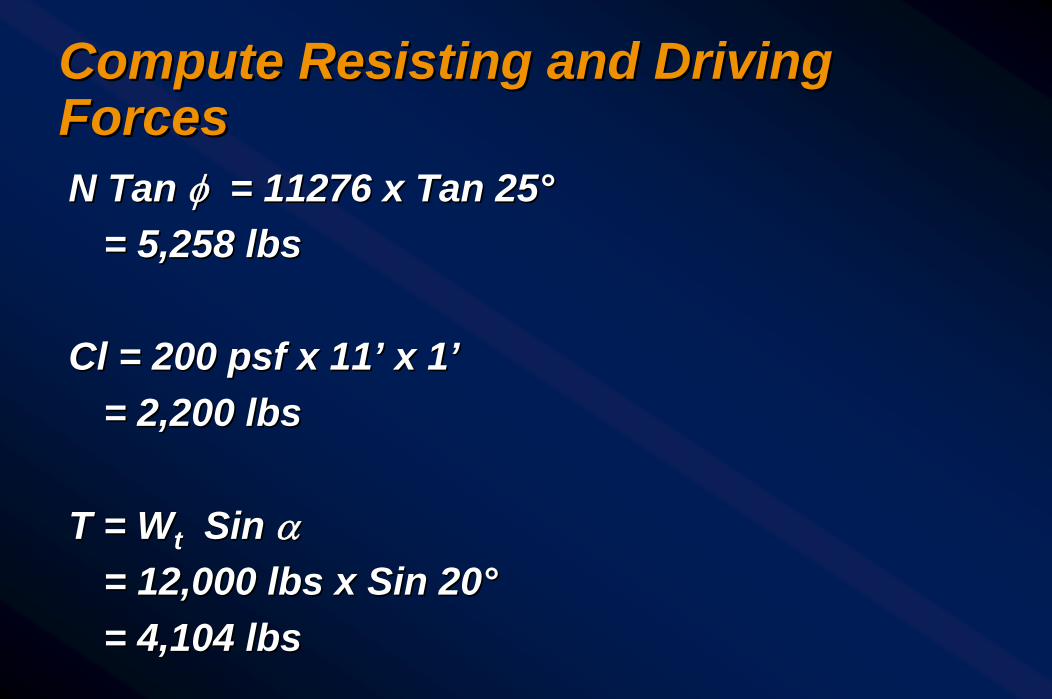
Compute Resisting and Driving Compute Resisting and Driving ForcesForcesN Tan N Tan φφ = 11276 x Tan 25= 11276 x Tan 25°°
= 5,258 lbs = 5,258 lbs
ClCl = 200 = 200 psfpsf x 11x 11’’ x 1x 1’’= 2,200 lbs= 2,200 lbs
T = T = WWtt Sin Sin αα= 12,000 lbs x Sin 20° = 12,000 lbs x Sin 20° = 4,104 lbs= 4,104 lbs
Group ExerciseGroup Exercise
ggAssuming the water is 5’ above the slice Assuming the water is 5’ above the slice base, which of the force components change base, which of the force components change in this exercise?in this exercise?

SolutionSolution
ggThe water will affect the normal force, NThe water will affect the normal force, N
N = WN = WTT Cos Cos αα -- ulul= 12,000 lbs x Cos 20= 12,000 lbs x Cos 20°° -- 5 x 62.4 x 115 x 62.4 x 11= 11,276 lbs = 11,276 lbs –– 3,432 lbs3,432 lbs= 7,844 lbs= 7,844 lbs
(N=11,276 lbs for original water level)(N=11,276 lbs for original water level)

Tabular Form for CalculationsTabular Form for Calculations
ggFigure 6Figure 6--1111ggFigure 6Figure 6--1212
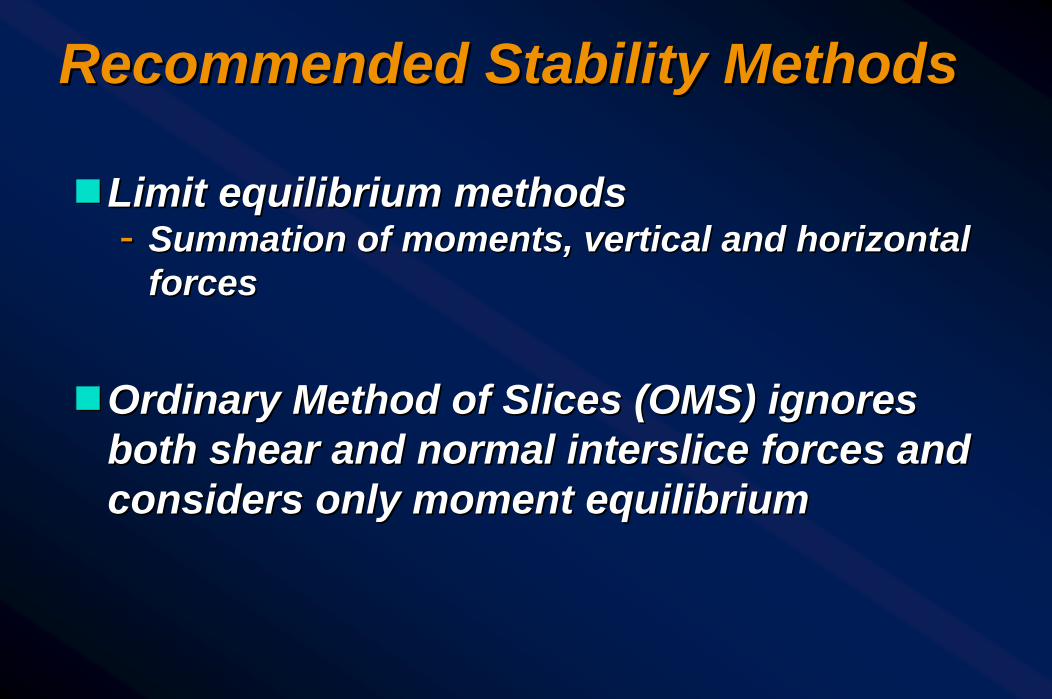
Recommended Stability MethodsRecommended Stability Methods
ggLimit equilibrium methodsLimit equilibrium methods-- Summation of moments, vertical and horizontal Summation of moments, vertical and horizontal
forcesforces
ggOrdinary Method of Slices (OMS) ignores Ordinary Method of Slices (OMS) ignores both shear and normal both shear and normal intersliceinterslice forces and forces and considers only moment equilibriumconsiders only moment equilibrium

Recommended Stability MethodsRecommended Stability Methods
ggVariations of OMS are Bishop method, Variations of OMS are Bishop method, Simplified Simplified JanbuJanbu method, Spencer method, method, Spencer method, etc.etc.
ggBishop methodBishop method-- Also known as Simplified Bishop methodAlso known as Simplified Bishop method-- Includes Includes intersliceinterslice normal forcesnormal forces-- Neglects Neglects intersliceinterslice shear forcesshear forces-- Satisfies only moment equilibriumSatisfies only moment equilibrium
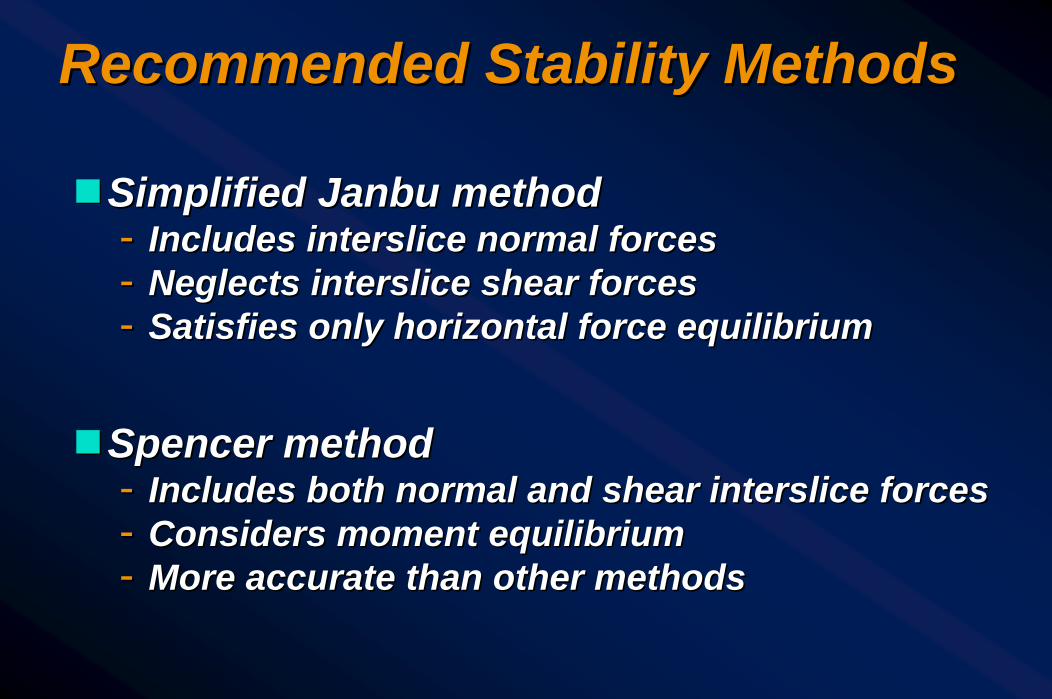
Recommended Stability MethodsRecommended Stability Methods
ggSimplified Simplified JanbuJanbu methodmethod-- Includes Includes intersliceinterslice normal forcesnormal forces-- Neglects Neglects intersliceinterslice shear forcesshear forces-- Satisfies only horizontal force equilibriumSatisfies only horizontal force equilibrium
ggSpencer methodSpencer method-- Includes both normal and shear Includes both normal and shear intersliceinterslice forcesforces-- Considers moment equilibriumConsiders moment equilibrium-- More accurate than other methodsMore accurate than other methods
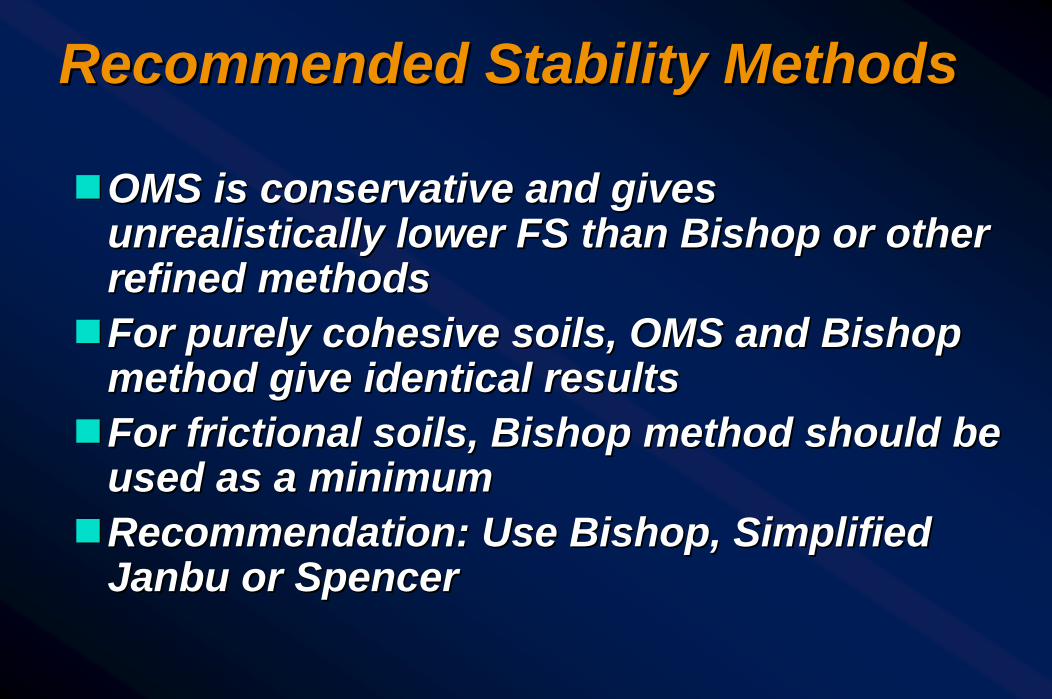
Recommended Stability MethodsRecommended Stability Methods
ggOMS is conservative and gives OMS is conservative and gives unrealistically lower FS than Bishop or other unrealistically lower FS than Bishop or other refined methodsrefined methods
ggFor purely cohesive soils, OMS and Bishop For purely cohesive soils, OMS and Bishop method give identical resultsmethod give identical results
ggFor frictional soils, Bishop method should be For frictional soils, Bishop method should be used as a minimumused as a minimum
ggRecommendation: Use Bishop, Simplified Recommendation: Use Bishop, Simplified JanbuJanbu or Spenceror Spencer

Slope Stability Guidelines for DesignSlope Stability Guidelines for Design
ggTable 6Table 6--11
ggComputer analysis is nowComputer analysis is now--aa--days commonly days commonly performed by use of slope stability softwareperformed by use of slope stability software-- XSTABL, UTEXAS, XSTABL, UTEXAS, ReSSAReSSA, SLOPE/W, etc, SLOPE/W, etc
Remarks on Safety FactorRemarks on Safety Factor
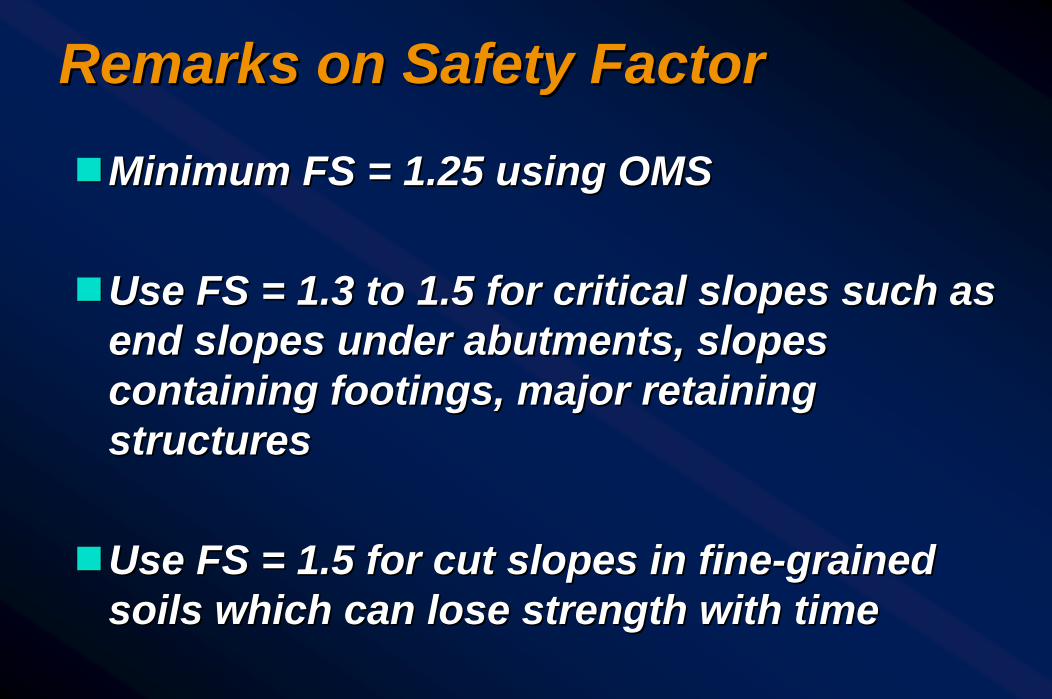
ggMinimum FS = 1.25 using OMSMinimum FS = 1.25 using OMS
ggUse FS = 1.3 to 1.5 for critical slopes such as Use FS = 1.3 to 1.5 for critical slopes such as end slopes under abutments, slopes end slopes under abutments, slopes containing footings, major retaining containing footings, major retaining structuresstructures
ggUse FS = 1.5 for cut slopes in fineUse FS = 1.5 for cut slopes in fine--grained grained soils which can lose strength with timesoils which can lose strength with time
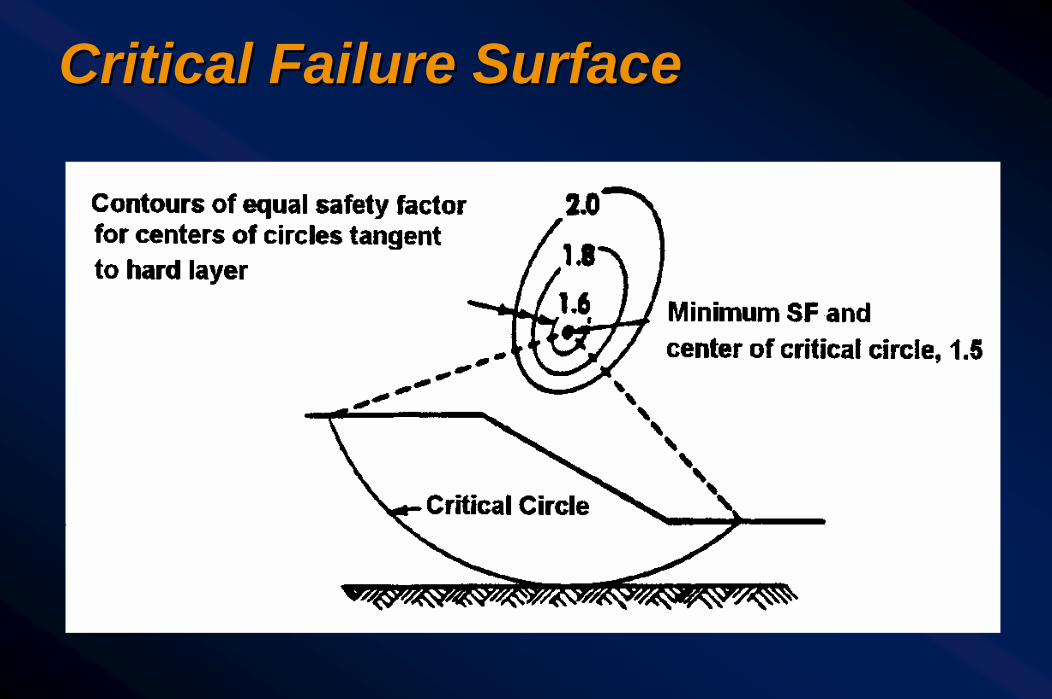
Critical Failure SurfaceCritical Failure Surface

Critical Failure SurfaceCritical Failure Surface
ggCheck multiple failure surfaces and compare Check multiple failure surfaces and compare the lowest safety factorsthe lowest safety factors
ggSearch all areas of slope to find the lowest Search all areas of slope to find the lowest safety factorsafety factor
ggBe careful of “secondary” features such as Be careful of “secondary” features such as thin weak layersthin weak layers
ggEvaluate all loading and unloading Evaluate all loading and unloading conditions, e.g., rapid drawdownconditions, e.g., rapid drawdown
ggUse stability charts to develop a “feel” for Use stability charts to develop a “feel” for the safety factorthe safety factor
Stability ChartsStability Charts
ggAssumptionsAssumptions-- TwoTwo--dimensional limit equilibrium analysisdimensional limit equilibrium analysis-- Simple homogeneous slopesSimple homogeneous slopes-- Circular slip surfaces onlyCircular slip surfaces only
ggUseful for preliminary analysis prior to Useful for preliminary analysis prior to computer analysis to develop a “feel” for computer analysis to develop a “feel” for safety factorsafety factor
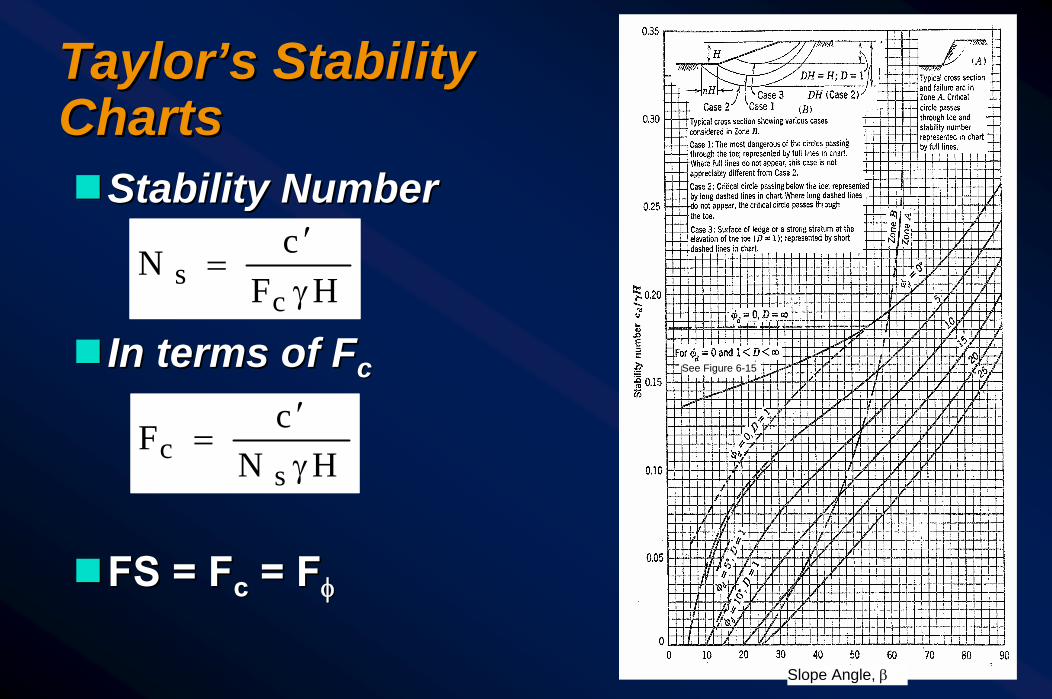
Taylor’s Stability Taylor’s Stability ChartsChartsggStability NumberStability Number
gg In terms of In terms of FFcc
ggFS = FS = FFcc = F= Fφφ
See Figure 6-15
Slope Angle, β
HFcN
cs γ
′=
HNcFs
c γ′
=

Taylor’s Stability Taylor’s Stability ChartsChartsggChart for Chart for φφ′′=0=0
conditions and conditions and ββ<54<54ºº
β = 53ºFor β > 53º, use Figure 6-14
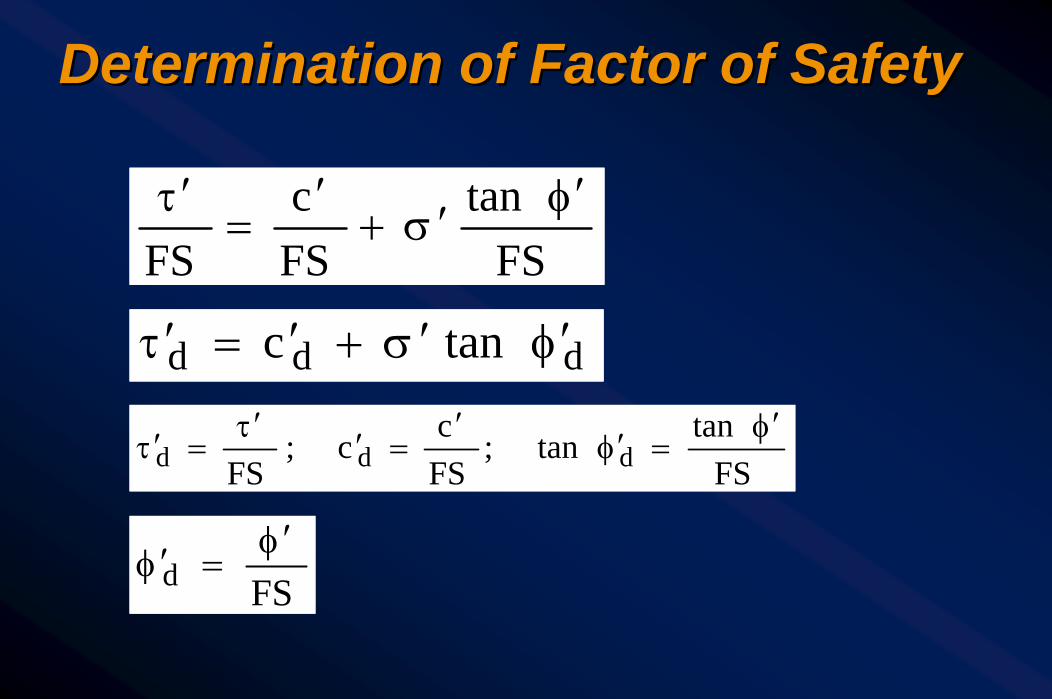
Determination of Factor of SafetyDetermination of Factor of Safety
FStan
FSc
FSφ′
σ ′+′
=τ ′
ddd tanc φ′σ ′+′=τ ′
FStantan;
FScc;
FS dddφ′
=φ′′
=′τ ′=τ ′
FSdφ ′
=φ ′

Example 6Example 6--11
gg3030--ft high slope ft high slope ggSlope angle, Slope angle, ββ = 30= 30ººggTotal unit weight, Total unit weight, γγ = 120 = 120 pcfpcfggEffective cohesion, cEffective cohesion, c′′ = 500 = 500 psfpsfggEffective friction angle, Effective friction angle, φφ′′=20=20ºº
ggDetermine the Factor of Safety, FSDetermine the Factor of Safety, FS
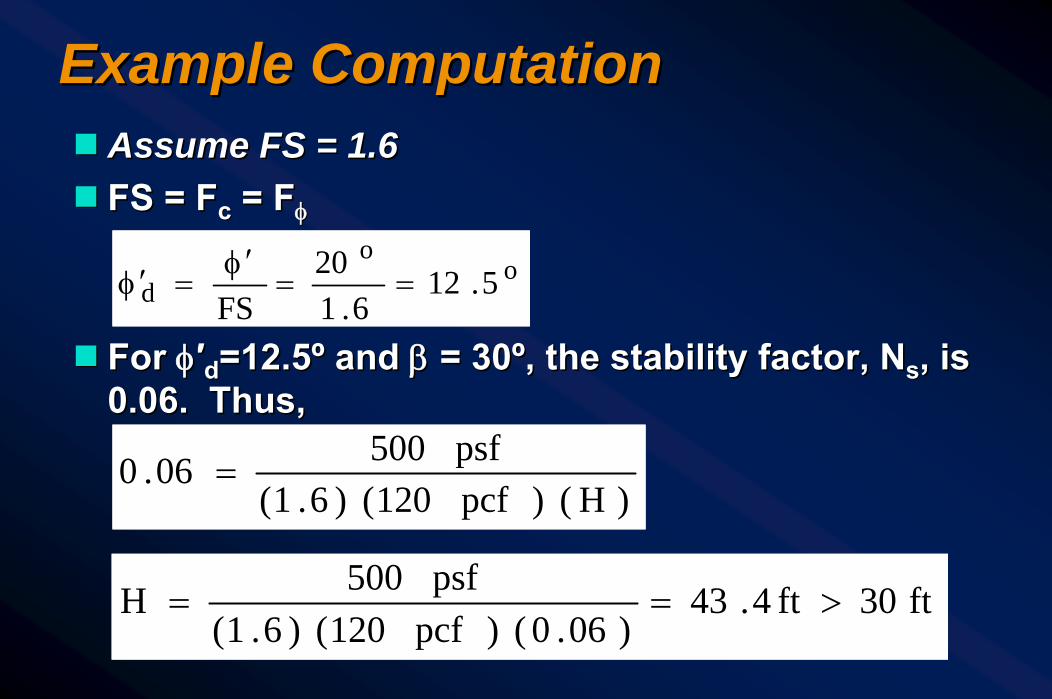
Example ComputationExample Computationgg Assume FS = 1.6Assume FS = 1.6gg FS = FS = FFcc = F= Fφφ
gg For For φφ′′dd=12.5=12.5ºº and and ββ = 30= 30ºº, the stability factor, N, the stability factor, Nss, is , is 0.06. Thus,0.06. Thus,
oo
d 5.126.1
20FS
==φ ′
=φ ′
)H()pcf120()6.1(psf50006.0 =
ft30ft4.43)06.0()pcf120()6.1(
psf500H >==

Taylor’s Stability ChartsTaylor’s Stability Charts
Slope Angle, β
0.06
0.075
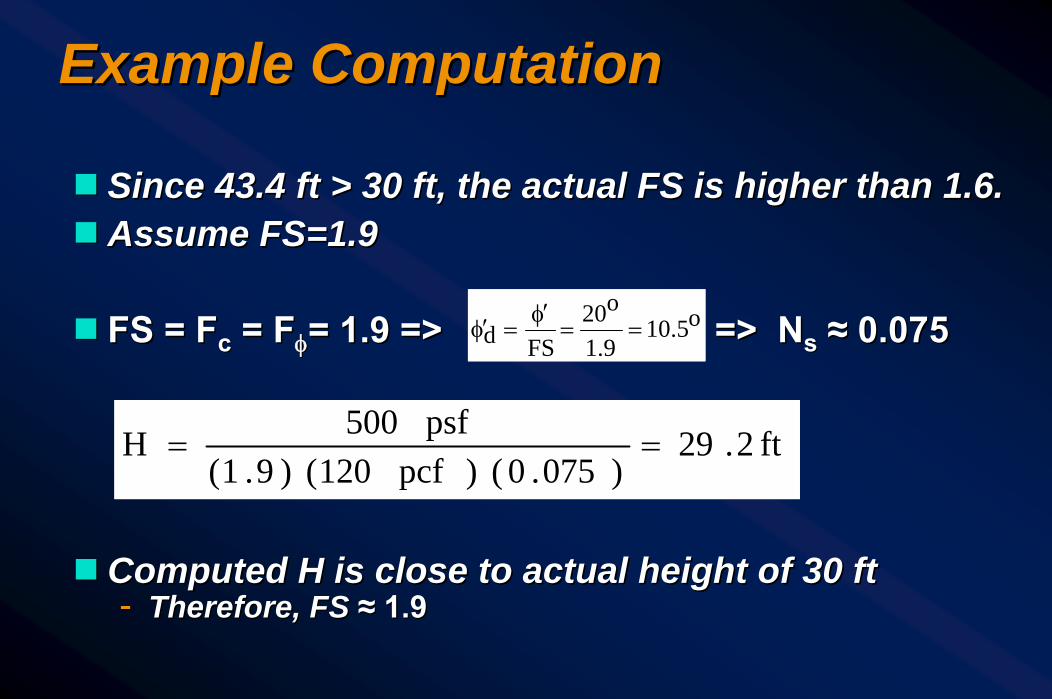
Example ComputationExample Computation
gg Since 43.4 ft > 30 ft, the actual FS is higher than 1.6.Since 43.4 ft > 30 ft, the actual FS is higher than 1.6.gg Assume FS=1.9Assume FS=1.9
gg FS = FS = FFcc = F= Fφφ= 1.9 => => N= 1.9 => => Nss ≈≈ 0.0750.075
gg Computed H is close to actual height of 30 ft Computed H is close to actual height of 30 ft -- Therefore, FS Therefore, FS ≈≈ 1.91.9
o5.109.1
o20FSd ==φ′
=φ′
ft2.29)075.0()pcf120()9.1(
psf500H ==

Janbu’sJanbu’s Stability ChartsStability Charts
ggAccount for:Account for:-- Surcharge loading at top of slopeSurcharge loading at top of slope-- SubmergenceSubmergence-- Tension cracksTension cracks-- SeepageSeepage
ggSection 6.6.3Section 6.6.3

Sliding Block Failure TypesSliding Block Failure Types
Shallow Weak Soil Layer
Firm Soil
Fill
Fill
Firm Soil
Thin Seam Weak Clay
Firm Soil
Clay
Lens of Silt or SandFill
Impermeable Clay
w/o Frictional Resistance
Clay
1
2
3


After SlideAfter Slide
C SR 42 OregonC SR 42 OregonL
SandstoneSandstone
FillFill 18’18’12’12’
Silty ClaySilty Clay24’24’
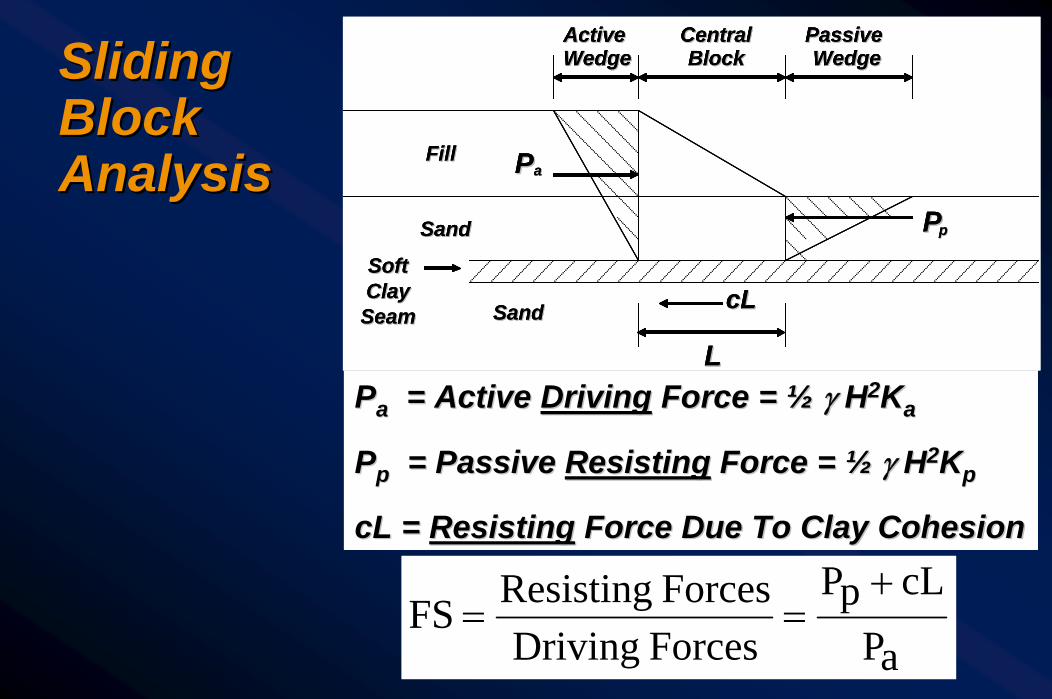
SlidingSlidingBlockBlockAnalysisAnalysis
ActiveActiveWedgeWedge
CentralCentralBlockBlock
PassivePassiveWedgeWedge
PP
PP
LL
aa
pp
cLcL
FillFill
SandSand
SoftSoftClayClaySeamSeam SandSand
ActiveActiveWedgeWedge
CentralCentralBlockBlock
PassivePassiveWedgeWedge
ActiveActiveWedgeWedge
CentralCentralBlockBlock
PassivePassiveWedgeWedge
ActiveActiveWedgeWedge
CentralCentralBlockBlock
PassivePassiveWedgeWedge
PP
PP
LL
aa
pp
cLcL
FillFill
SandSand
SoftSoftClayClaySeamSeam SandSand
PP
PP
LL
aa
pp
cLcL
FillFill
SandSand
SoftSoftClayClaySeamSeam SandSand
PPaa = Active = Active DrivingDriving Force = Force = ½½ γγ HH22KKaa
PPpp = Passive = Passive ResistingResisting Force = Force = ½½ γγ HH22KKpp
cLcL = = ResistingResisting Force Due To Clay CohesionForce Due To Clay Cohesion
aPcLpP
ForcesDriving ForcesResistingFS
+==
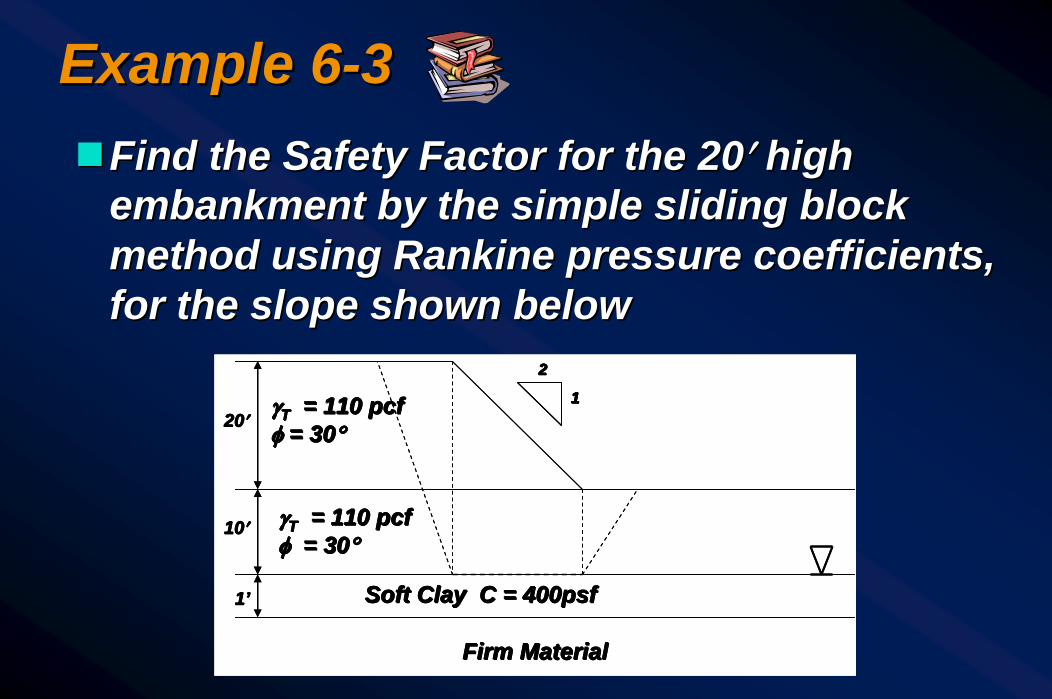
Example 6Example 6--33ggFind the Safety Factor for the 20Find the Safety Factor for the 20′′ high high
embankment by the simple sliding block embankment by the simple sliding block method using method using RankineRankine pressure coefficients, pressure coefficients, for the slope shown belowfor the slope shown below
11’’
1010′′
Firm Material Firm Material
Soft Clay C = 400psfSoft Clay C = 400psf
2020′′
22
11
γγT T = 110 = 110 pcfpcfφφ = 30= 30°°
γγTT = 110 = 110 pcfpcfφφ = 30= 30°°
11’’
1010′′
Firm Material Firm Material
Soft Clay C = 400psfSoft Clay C = 400psf
2020′′
22
11
22
11
γγT T = 110 = 110 pcfpcfφφ = 30= 30°°
γγTT = 110 = 110 pcfpcfφφ = 30= 30°°

Example 6Example 6--33
ggAdd solutionAdd solution
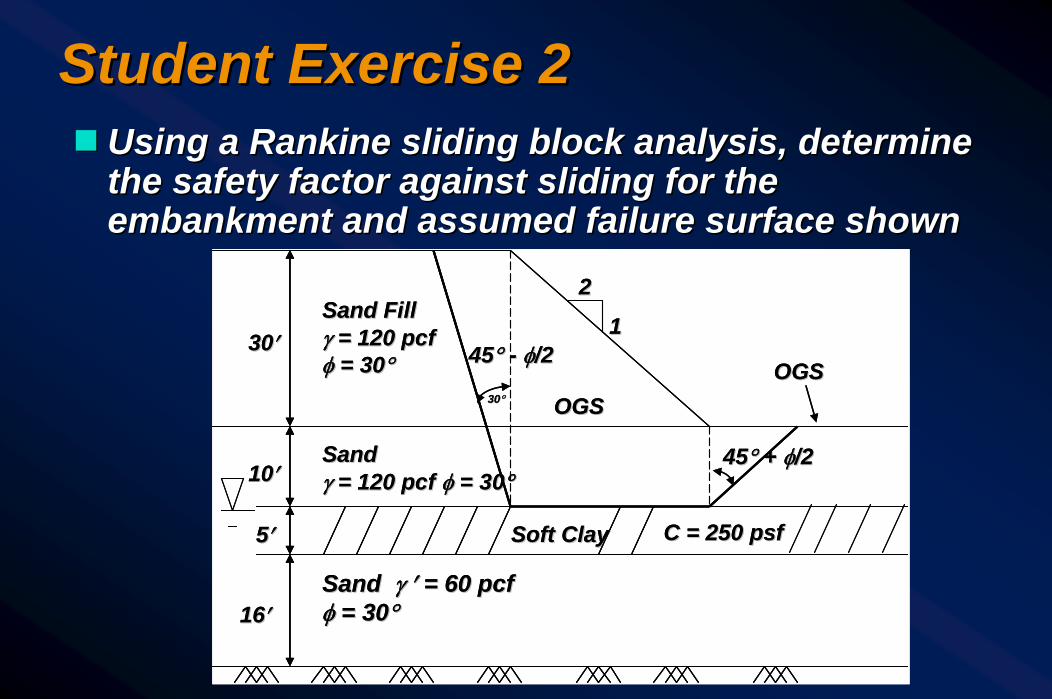
Student Exercise 2Student Exercise 2gg Using a Using a RankineRankine sliding block analysis, determine sliding block analysis, determine
the safety factor against sliding for the the safety factor against sliding for the embankment and assumed failure surface shownembankment and assumed failure surface shown
4545°° + + φφ/2/2
4545°° -- φφ/2/2
3030°°
1122
OGSOGS
C = 250 C = 250 psfpsfSoft Clay Soft Clay
1616′′
55′′
1010′′
3030′′
Sand Sand γγ ′′ = 60 = 60 pcfpcfφφ = 30= 30°°
Sand Sand γγ = 120 = 120 pcfpcf φφ = 30= 30°°
Sand Fill Sand Fill γγ = 120 = 120 pcfpcfφφ = 30= 30°° OGSOGS
4545°° + + φφ/2/2
4545°° -- φφ/2/2
3030°°
1122
OGSOGS
C = 250 C = 250 psfpsfSoft Clay Soft Clay
1616′′
55′′
1010′′
3030′′
Sand Sand γγ ′′ = 60 = 60 pcfpcfφφ = 30= 30°°
Sand Sand γγ = 120 = 120 pcfpcf φφ = 30= 30°°
Sand Fill Sand Fill γγ = 120 = 120 pcfpcfφφ = 30= 30°° OGSOGS
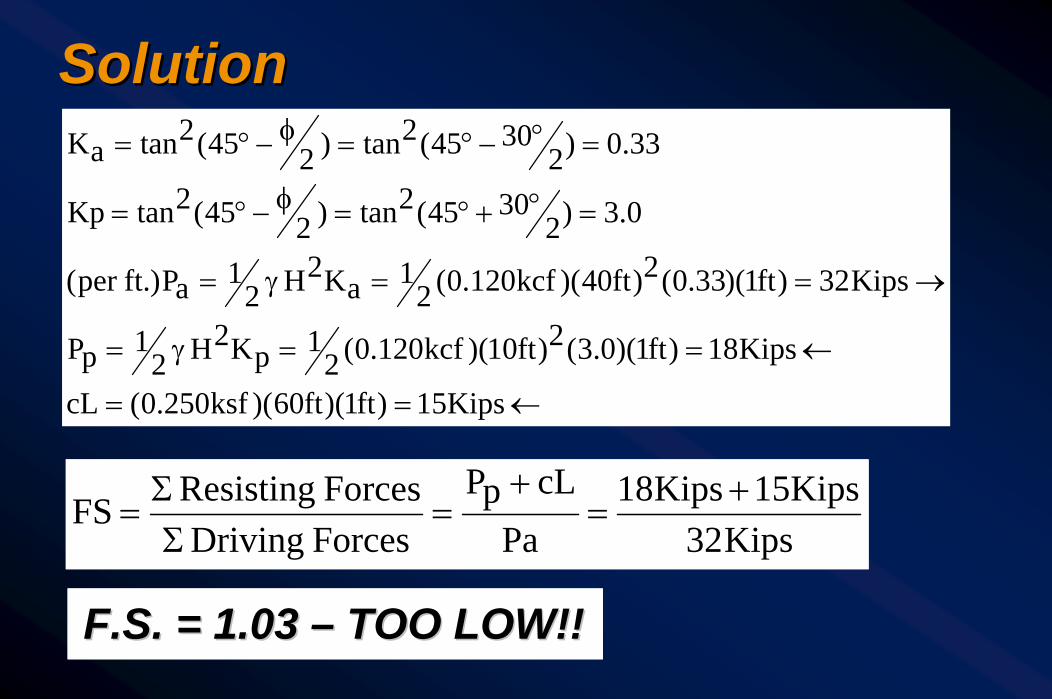
SolutionSolution
←==
←==γ=
→==γ=
=°+°=φ−°=
=°−°=φ−°=
Kips15)ft1)(ft60)(ksf250.0(cL
Kips18)ft1)(0.3(2)ft10)(kcf120.0(21pK2H2
1pP
Kips32)ft1)(33.0(2)ft40)(kcf120.0(21aK2H2
1aP)ft.per (
0.3)23045(2tan)245(2tanKp
33.0)23045(2tan)245(2tanaK
Kips32Kips15Kips18
PacLpP
ForcesDriving ForcesResistingFS +
=+
=Σ
Σ=
F.S. = 1.03 F.S. = 1.03 –– TOO LOW!!TOO LOW!!

Student ExerciseStudent ExerciseggSame as previous exercise except that water Same as previous exercise except that water
table rises of 10 ft to OGStable rises of 10 ft to OGS
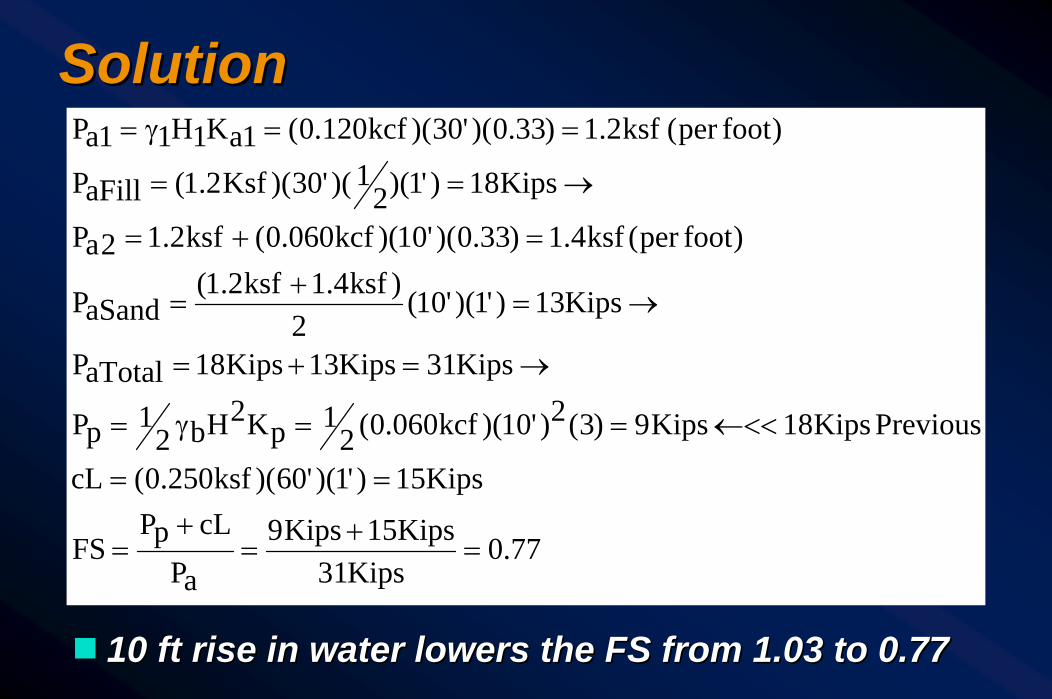
SolutionSolution
gg 10 ft rise in water lowers the FS from 1.03 to 0.7710 ft rise in water lowers the FS from 1.03 to 0.77
77.0Kips31
Kips15Kips9
aPcLpP
FS
Kips15)'1)('60)(ksf250.0(cL
PreviousKips18Kips9)3(2)'10)(kcf060.0(21pK2Hb2
1pP
Kips31Kips13Kips18aTotalP
Kips13)'1)('10(2
)ksf4.1ksf2.1(aSandP
)footper(ksf4.1)33.0)('10)(kcf060.0(ksf2.12aP
Kips18)'1)(21)('30)(Ksf2.1(aFillP
)footper(ksf2.1)33.0)('30)(kcf120.0(1aK1H11aP
=+
=+
=
==
←<<==γ=
→=+=
→=+
=
=+=
→==
==γ=

Use of Computer ProgramsUse of Computer Programs
ggSeveral methods for stability analysisSeveral methods for stability analysis-- Consideration of Consideration of intersliceinterslice forces, irregular forces, irregular
failure surfaces, seismic forces, external forces, failure surfaces, seismic forces, external forces, tieback forces, tieback forces, piezometricpiezometric level, heterogeneous level, heterogeneous soil systems, etc.soil systems, etc.
ggUser friendly input and outputUser friendly input and outputggUser documented and verified programUser documented and verified programggXSTABL, UTEXAS, SLOPE/W, XSTABL, UTEXAS, SLOPE/W, ReSSAReSSA
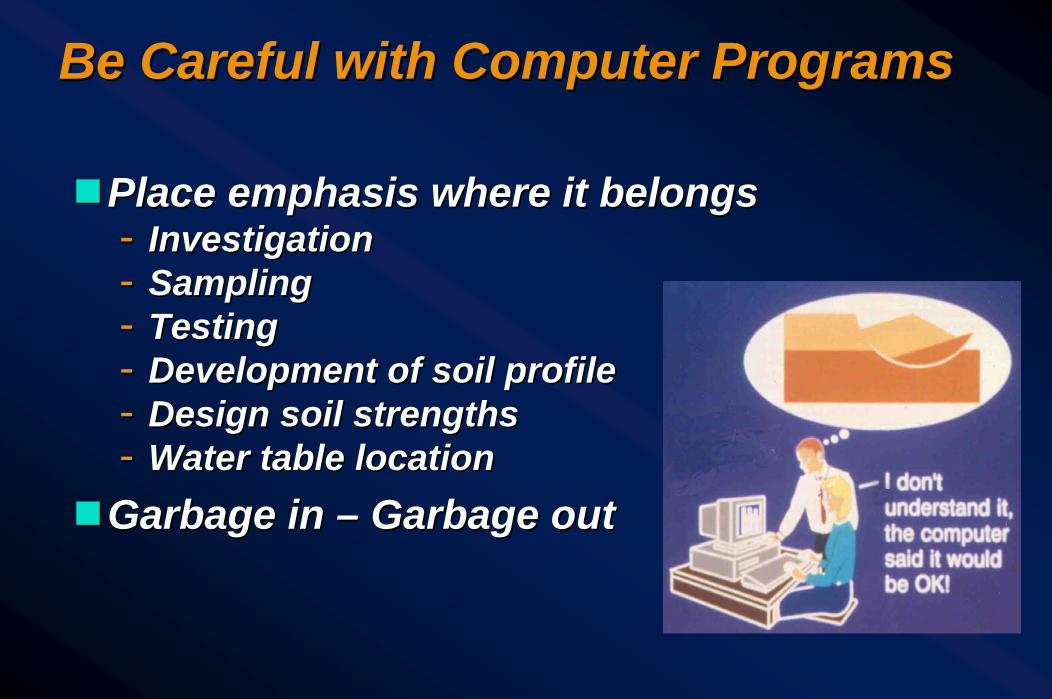
Be Careful with Computer ProgramsBe Careful with Computer Programs
ggPlace emphasis where it belongsPlace emphasis where it belongs-- InvestigationInvestigation-- SamplingSampling-- TestingTesting-- Development of soil profileDevelopment of soil profile-- Design soil strengthsDesign soil strengths-- Water table locationWater table location
ggGarbage in Garbage in –– Garbage outGarbage out

Learning OutcomesLearning Outcomes
ggAt the end of this session, the participant will At the end of this session, the participant will be able to:be able to:-- Recall modes of slope failureRecall modes of slope failure-- Explain effects of water on slope stabilityExplain effects of water on slope stability-- Discuss slope stability circular and block Discuss slope stability circular and block
analysesanalyses-- Compute safety factor by chart solutionCompute safety factor by chart solution

Any Questions?Any Questions?
THE ROAD TOUNDERSTANDING
SOILSAND
FOUNDATIONS

SLOPE STABILITYSLOPE STABILITY
Lesson 06 Lesson 06 -- Topic 2Topic 2Improving the stability of embankmentsImproving the stability of embankments
Section 6.9Section 6.9
Learning OutcomesLearning Outcomes
ggAt the end of this session, the participant will At the end of this session, the participant will be able to:be able to:-- Recall methods for stabilizing fill slopesRecall methods for stabilizing fill slopes-- Describe reinforced soil slopesDescribe reinforced soil slopes-- List techniques to improve cut slopesList techniques to improve cut slopes
Mitigating Slope Stability ProblemsMitigating Slope Stability Problems
ggTable 6Table 6--2 2
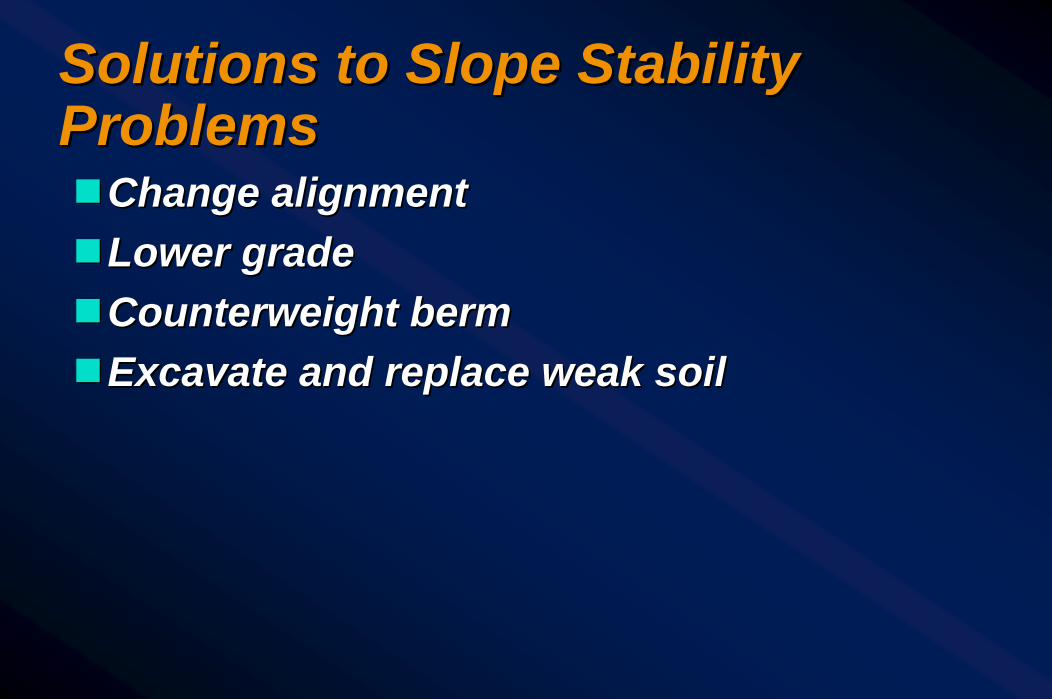
Solutions to Slope Stability Solutions to Slope Stability ProblemsProblemsggChange alignmentChange alignmentggLower gradeLower gradeggCounterweight Counterweight bermbermggExcavate and replace weak soilExcavate and replace weak soil
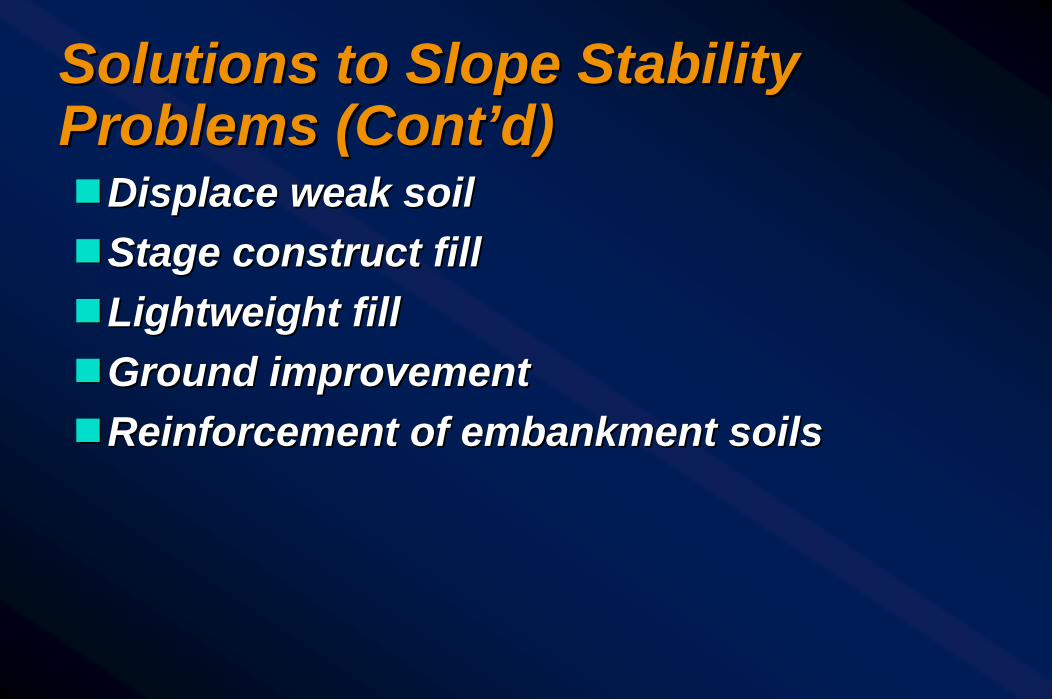
Solutions to Slope Stability Solutions to Slope Stability Problems (Cont’d)Problems (Cont’d)ggDisplace weak soilDisplace weak soilggStage construct fillStage construct fillggLightweight fillLightweight fillggGround improvementGround improvementggReinforcement of embankment soilsReinforcement of embankment soils
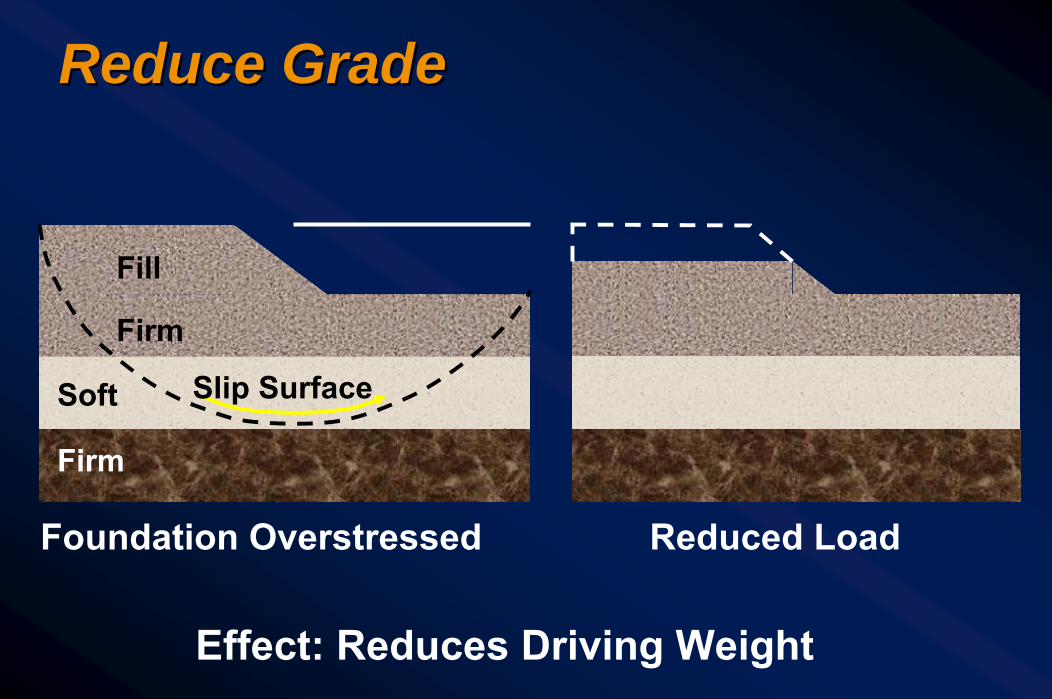
Reduce Grade Reduce Grade
Firm
Fill
Effect: Reduces Driving Weight
Slip Surface
Firm
Soft
Foundation Overstressed Reduced Load

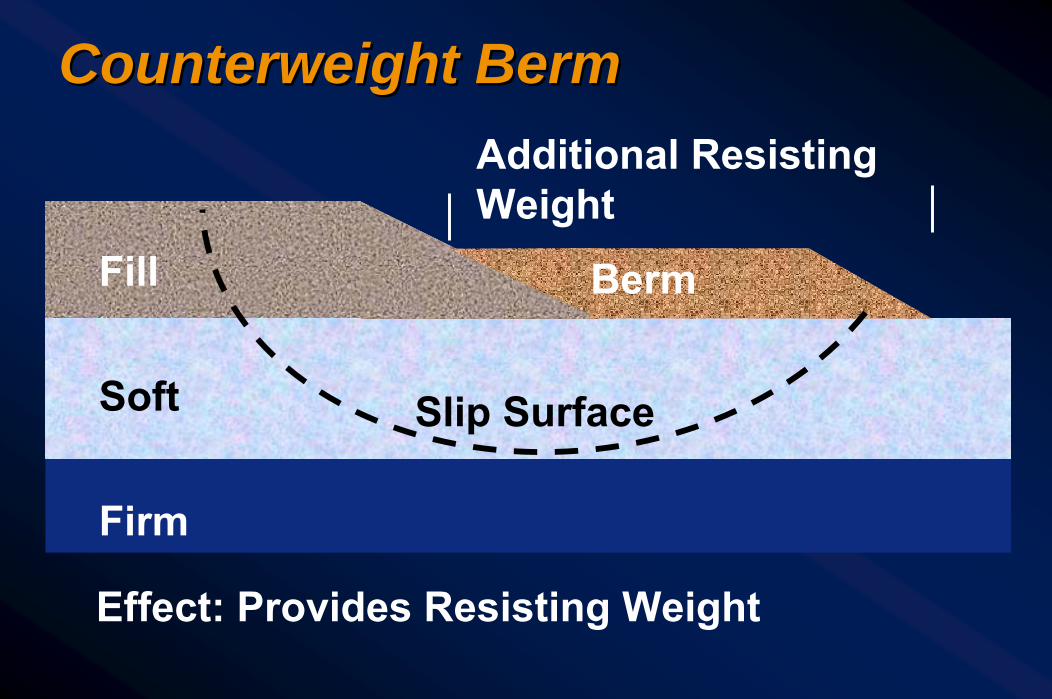
Counterweight Berm Counterweight Berm
Effect: Provides Resisting Weight
Fill
Soft
Firm
Berm
Additional Resisting Weight
Slip Surface
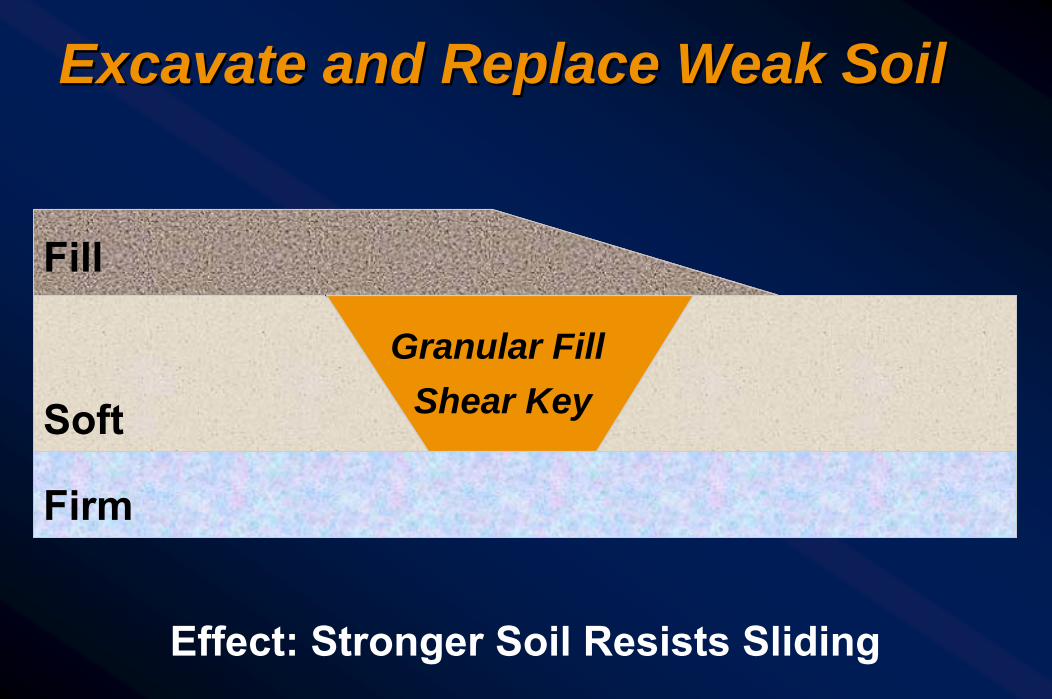
Excavate and Replace Weak Soil Excavate and Replace Weak Soil
Firm
Effect: Stronger Soil Resists Sliding
Soft
FillFill
Shear KeyGranular Fill

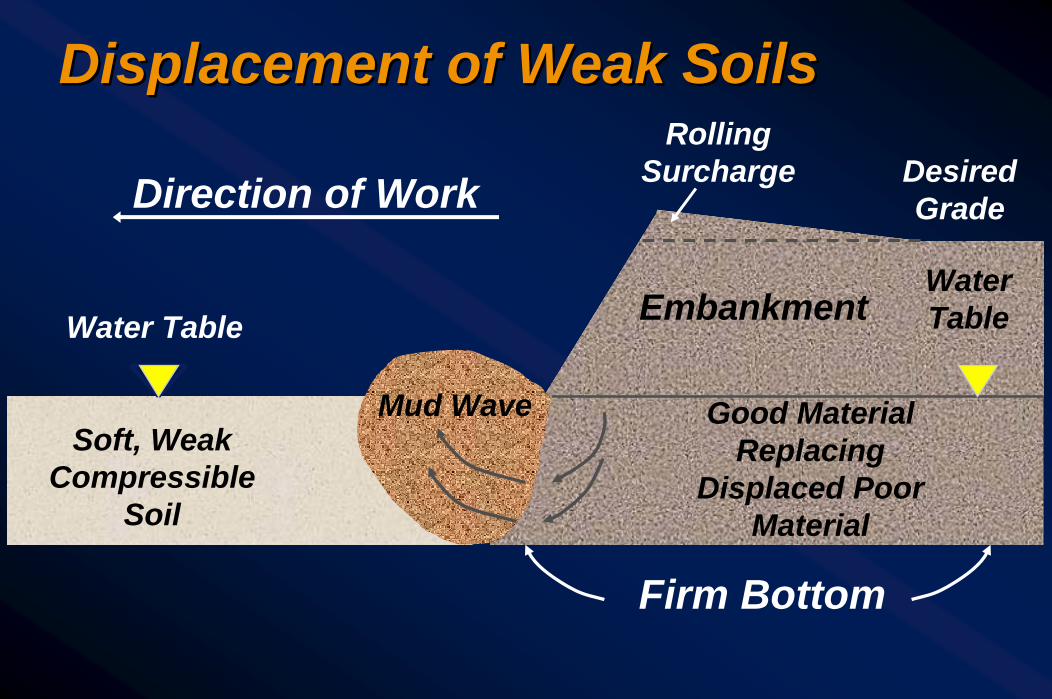
Direction of Work
Water Table Water Table Embankment
Soft, Weak Compressible
Soil
Mud Wave
Firm Bottom
Good Material Replacing
Displaced Poor Material
Rolling Surcharge Desired
Grade
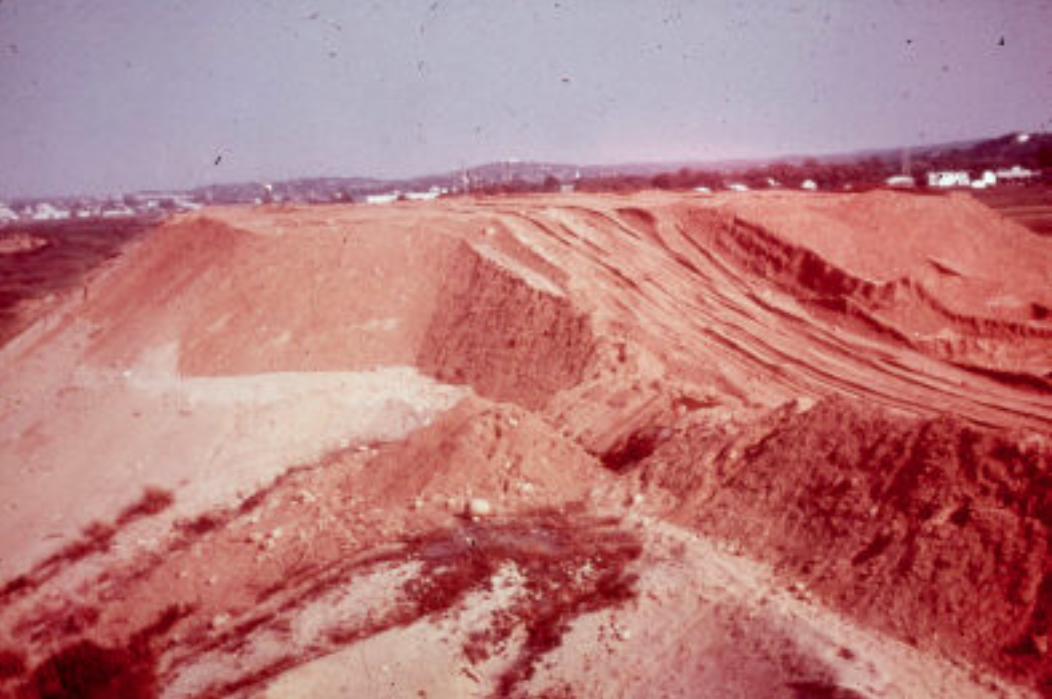
Displacement of Weak SoilsDisplacement of Weak Soils
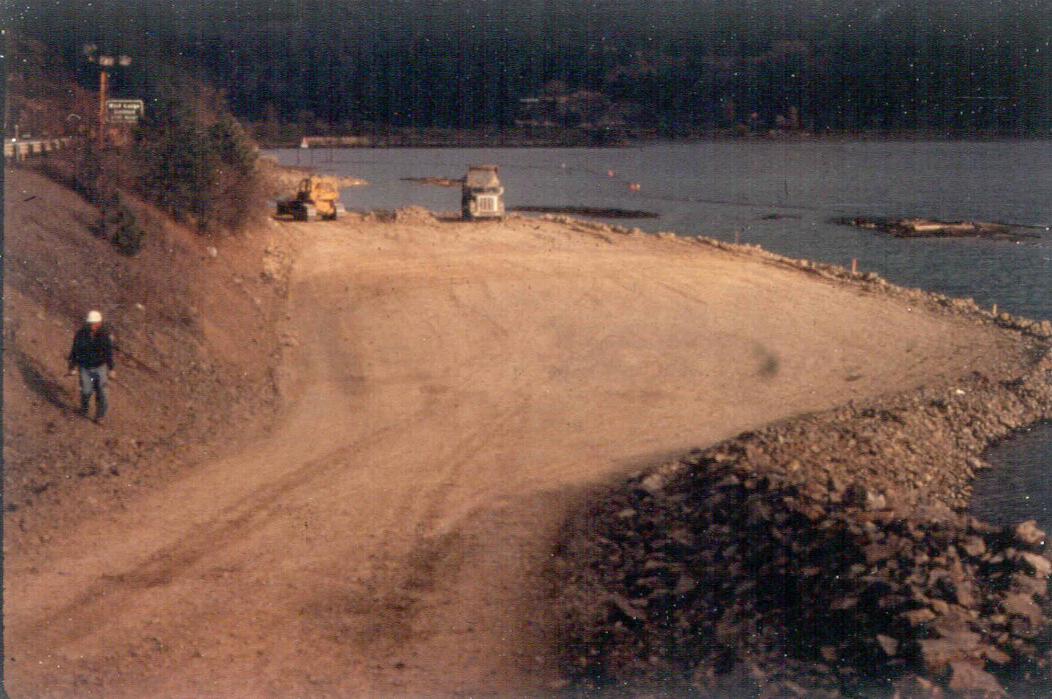
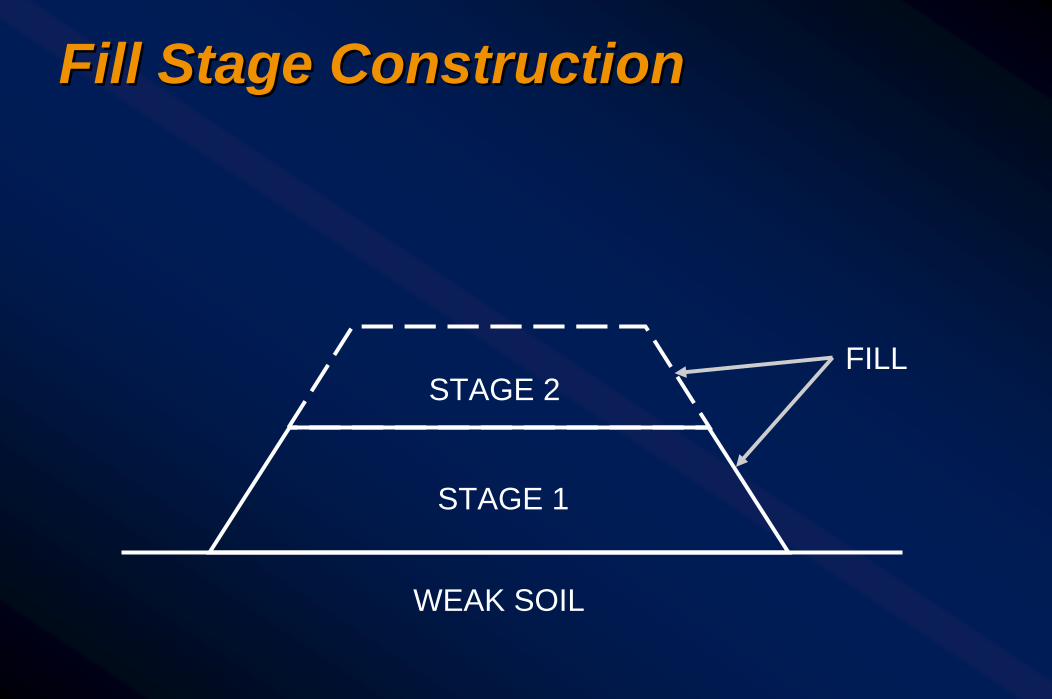
STAGE 2
STAGE 1
WEAK SOIL
FILL
Fill Stage Construction Fill Stage Construction

Slip Surface
Firm
Soft
Effect: Reduce Driving Weight
Granular Fill
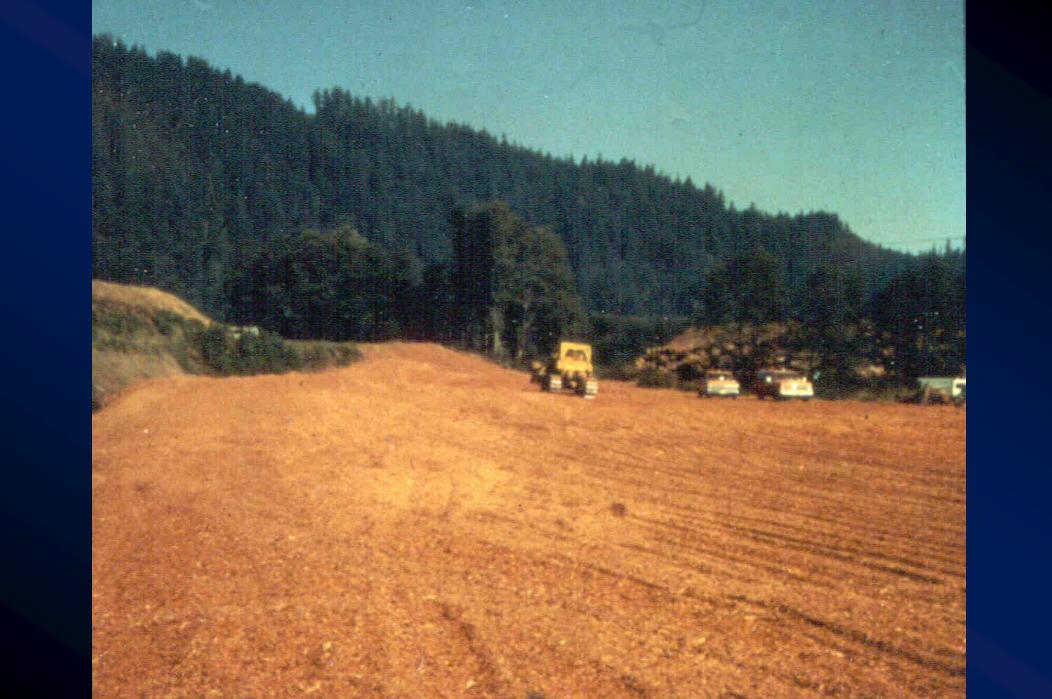
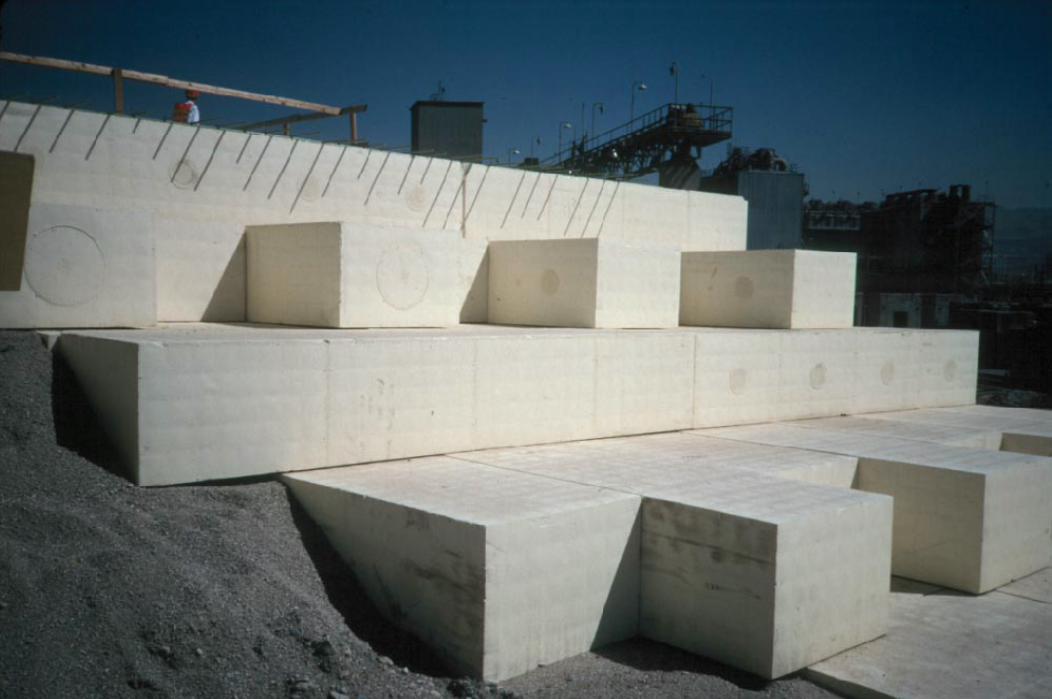
Lightweight Fill Lightweight Fill Lightweight Fill

Examples of Lightweight Fill Examples of Lightweight Fill MaterialsMaterialsggWood FiberWood FiberggShredded TiresShredded TiresggEPSEPS

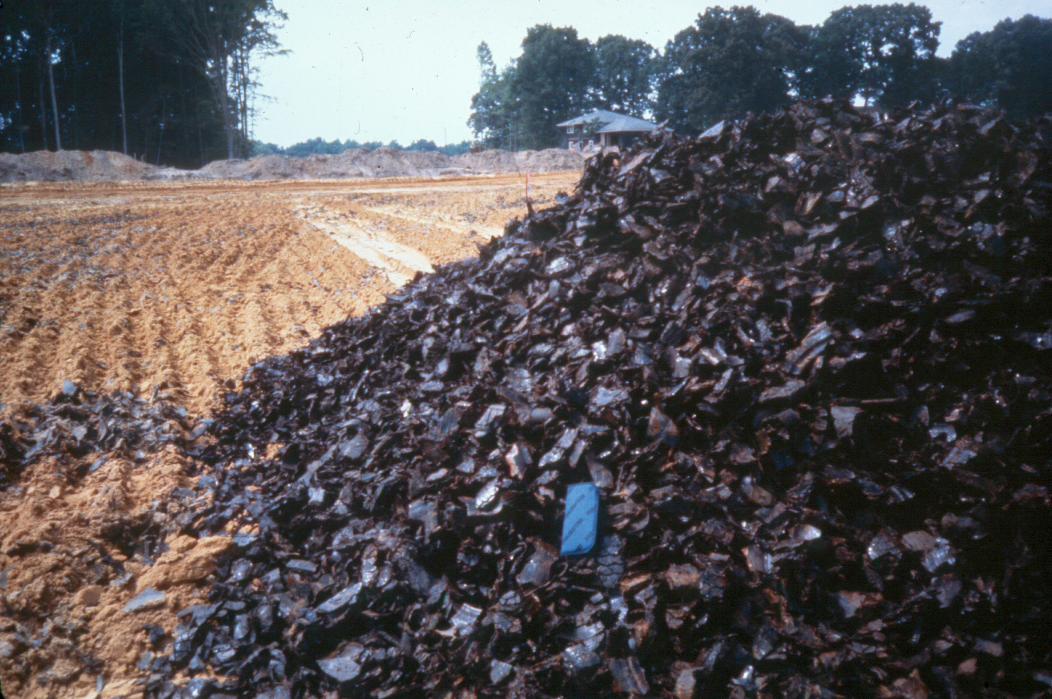


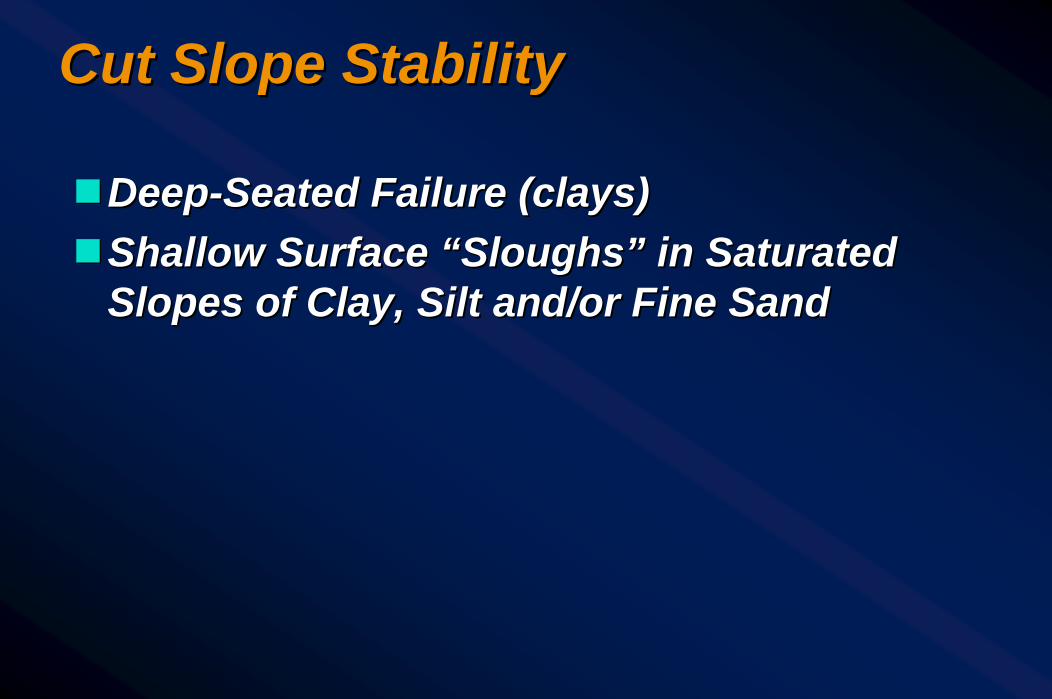
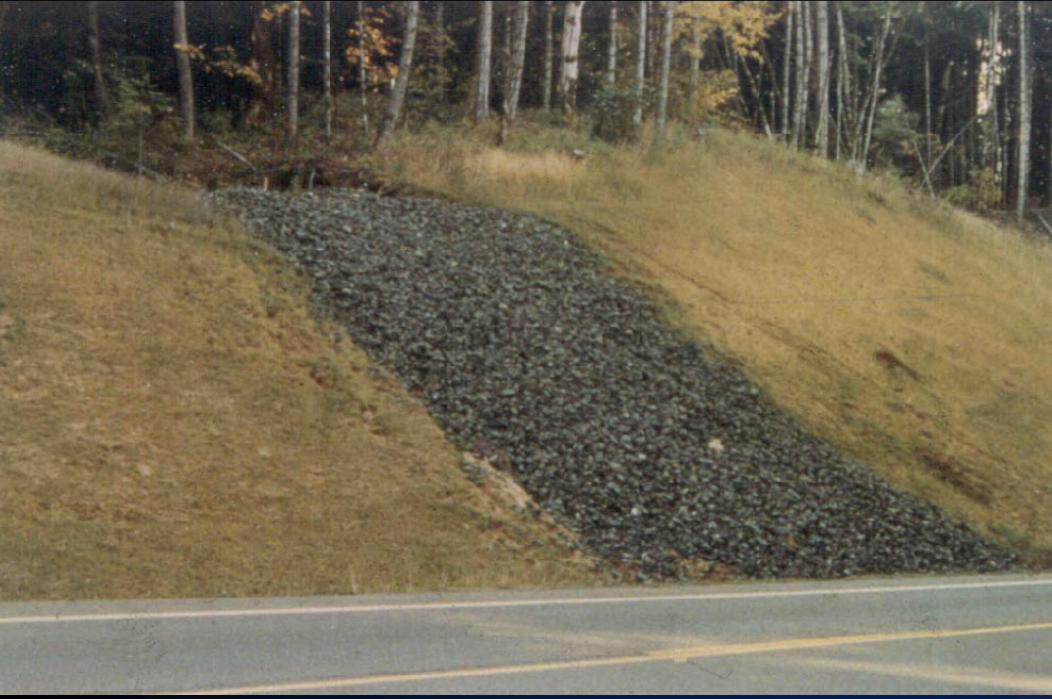
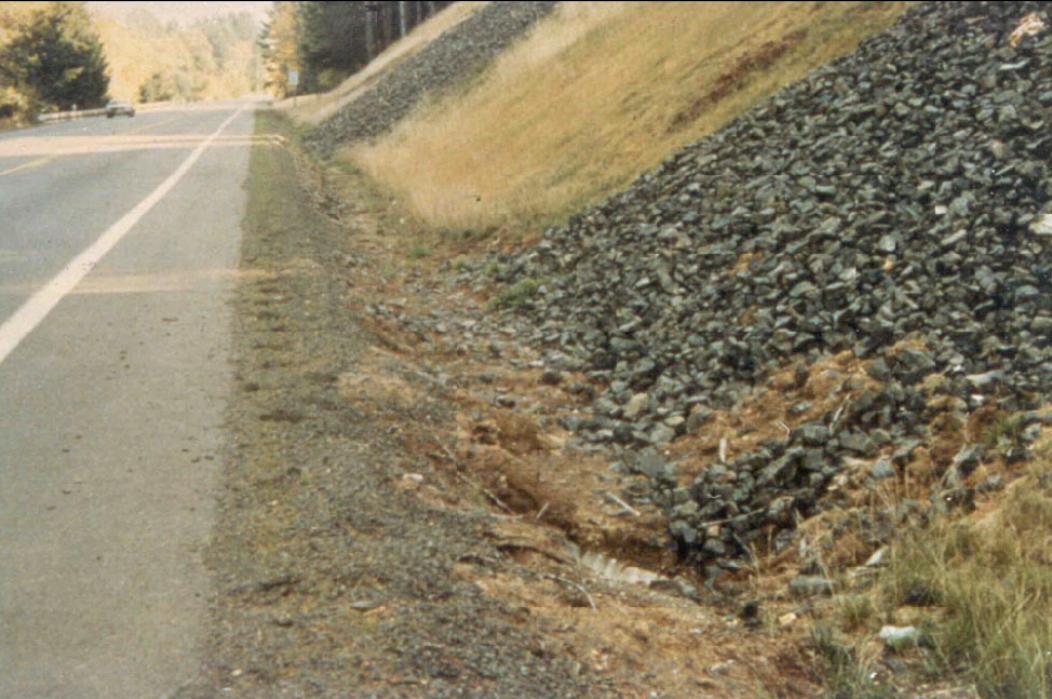
Cut Slope StabilityCut Slope Stability
ggDeepDeep--Seated Failure (clays)Seated Failure (clays)ggShallow Surface “Sloughs” in Saturated Shallow Surface “Sloughs” in Saturated
Slopes of Clay, Silt and/or Fine SandSlopes of Clay, Silt and/or Fine Sand

Ground ImprovementGround Improvement
gg GroutingGroutinggg Vertical Wick DrainsVertical Wick Drainsgg Stone ColumnsStone Columnsgg Vibro CompactionVibro Compactiongg Dynamic CompactionDynamic Compaction
gg Soil Mixing Soil Mixing gg Soil NailingSoil Nailinggg Reinforced Soil SlopesReinforced Soil Slopesgg MicropilesMicropiles
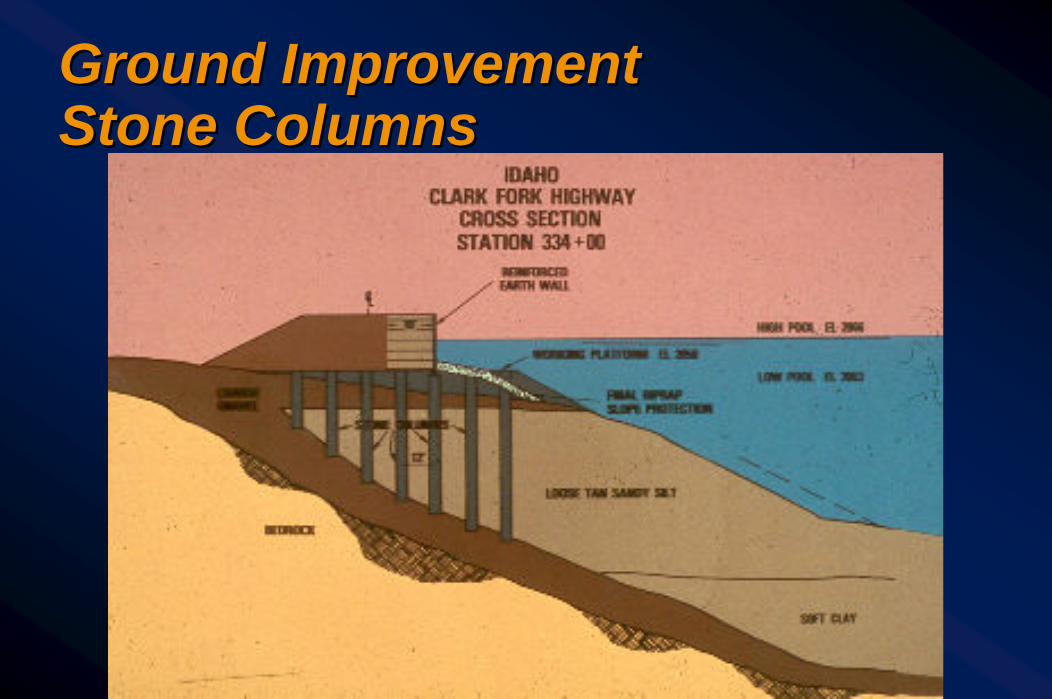
Ground ImprovementGround ImprovementStone ColumnsStone Columns
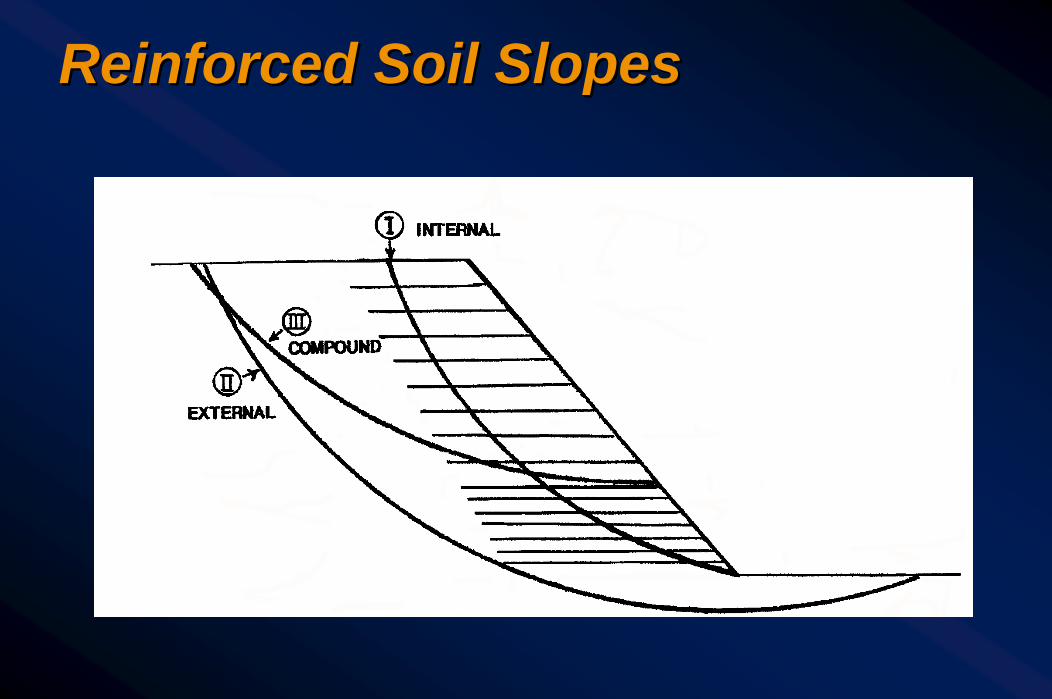
Reinforced Soil SlopesReinforced Soil Slopes
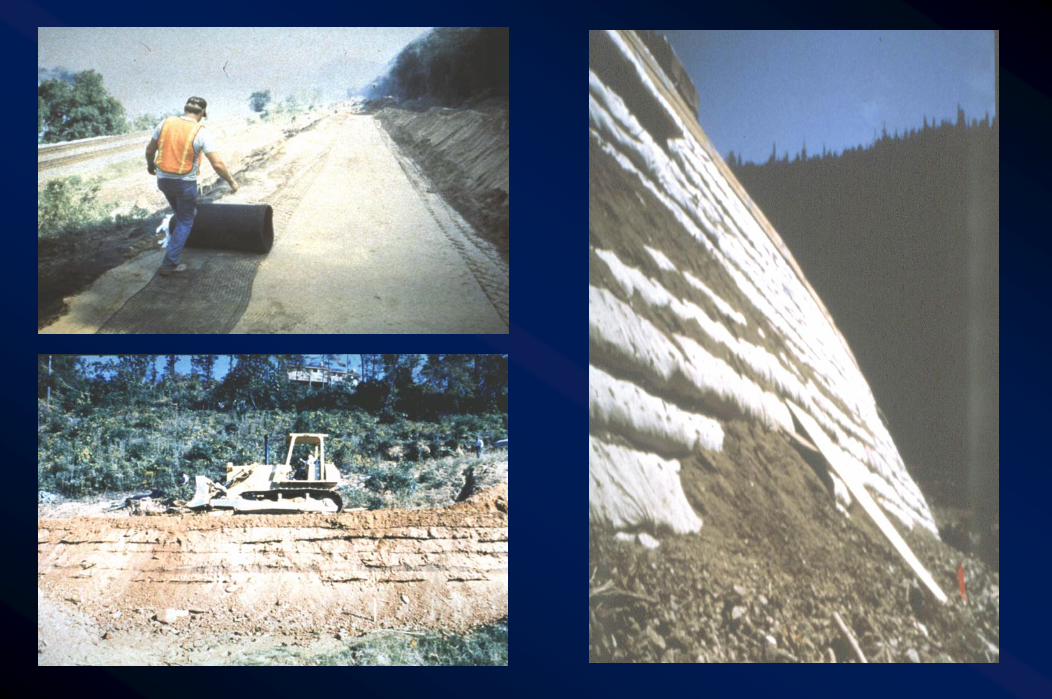

Preliminary Design of RSSPreliminary Design of RSS
ggFigure 6Figure 6--2828
Solutions to Cut Slope Stability Solutions to Cut Slope Stability ProblemsProblemsTable 6Table 6--33ggFlatten or Bench SlopeFlatten or Bench SlopeggBench slopeBench slopeggButtress ToeButtress ToeggLower Water TableLower Water TableggReinforcement (e.g., soil nail, biotechnical)Reinforcement (e.g., soil nail, biotechnical)

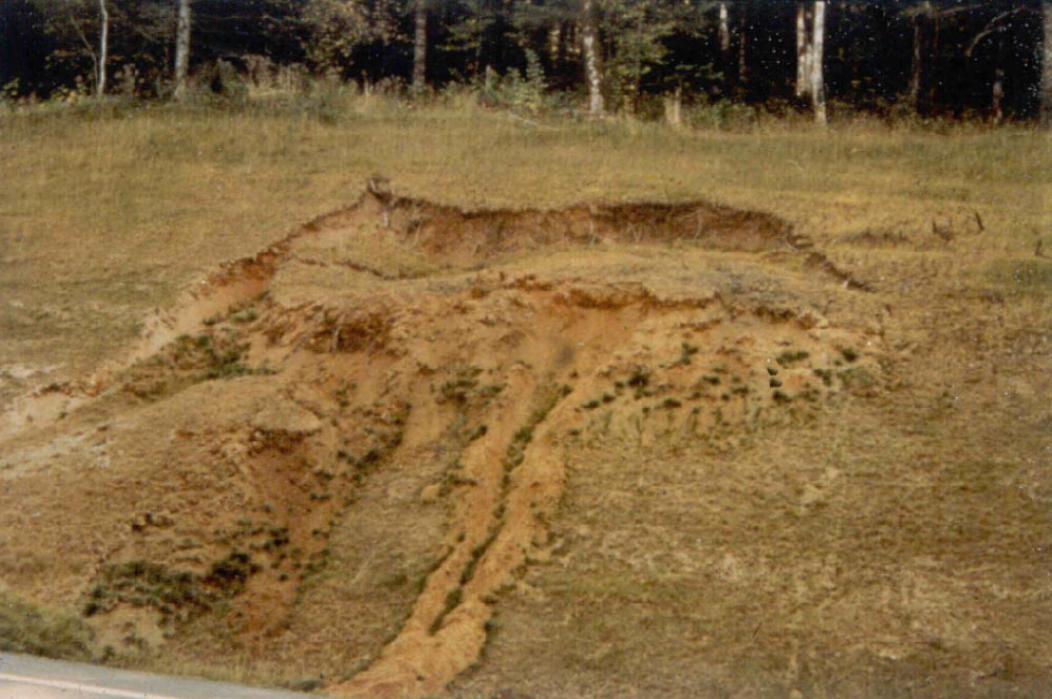
Cut Slope StabilityCut Slope Stability
Undrained Clay in Cut Gradually WeakensAnd May Fail Long After Construction
Undrained Clay in Cut Gradually WeakensAnd May Fail Long After Construction
Before CutBefore Cut After CutAfter Cut FailureFailure
SeepageSeepage
ToeToeToeToe
Slip Surface
Slip SurfaceSwellingSwellingClay SoilClay Soil
Water Table
Water Table
Water Table
Water Table
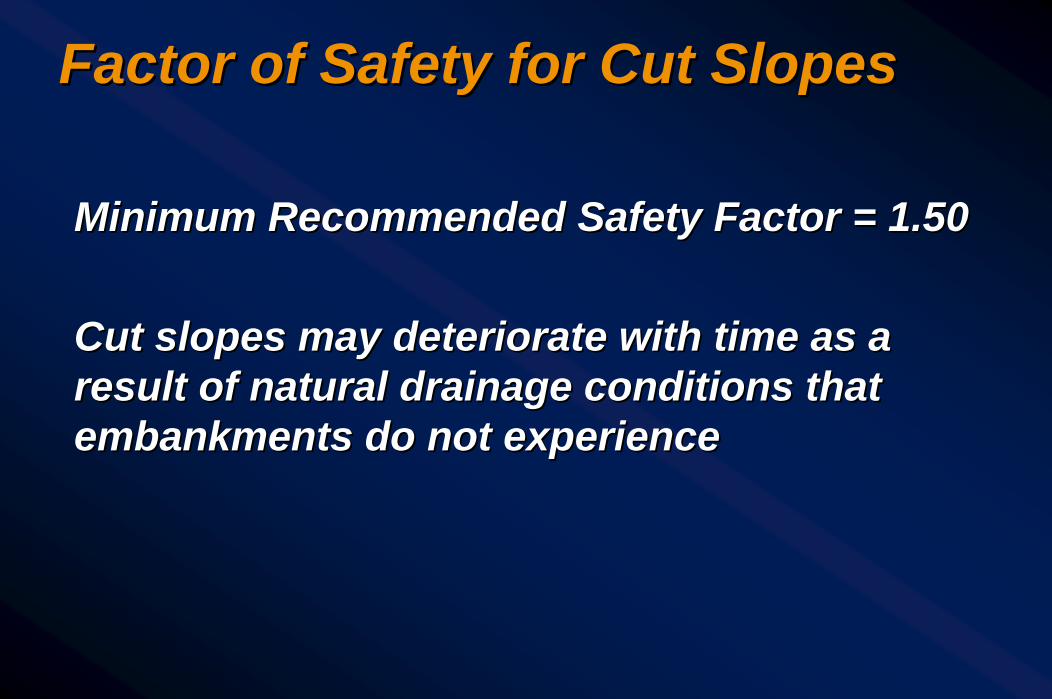
Minimum Recommended Safety Factor = 1.50Minimum Recommended Safety Factor = 1.50
Cut slopes may deteriorate with time as a Cut slopes may deteriorate with time as a result of natural drainage conditions that result of natural drainage conditions that embankments do not experienceembankments do not experience
Factor of Safety for Cut SlopesFactor of Safety for Cut Slopes

Learning OutcomesLearning Outcomes
ggAt the end of this session, the participant will At the end of this session, the participant will be able to:be able to:-- Recall methods for stabilizing fill slopesRecall methods for stabilizing fill slopes-- Describe reinforced soil slopesDescribe reinforced soil slopes-- List techniques to improve cut slopesList techniques to improve cut slopes

Any Questions?Any Questions?
THE ROAD TOUNDERSTANDING
SOILSAND
FOUNDATIONS
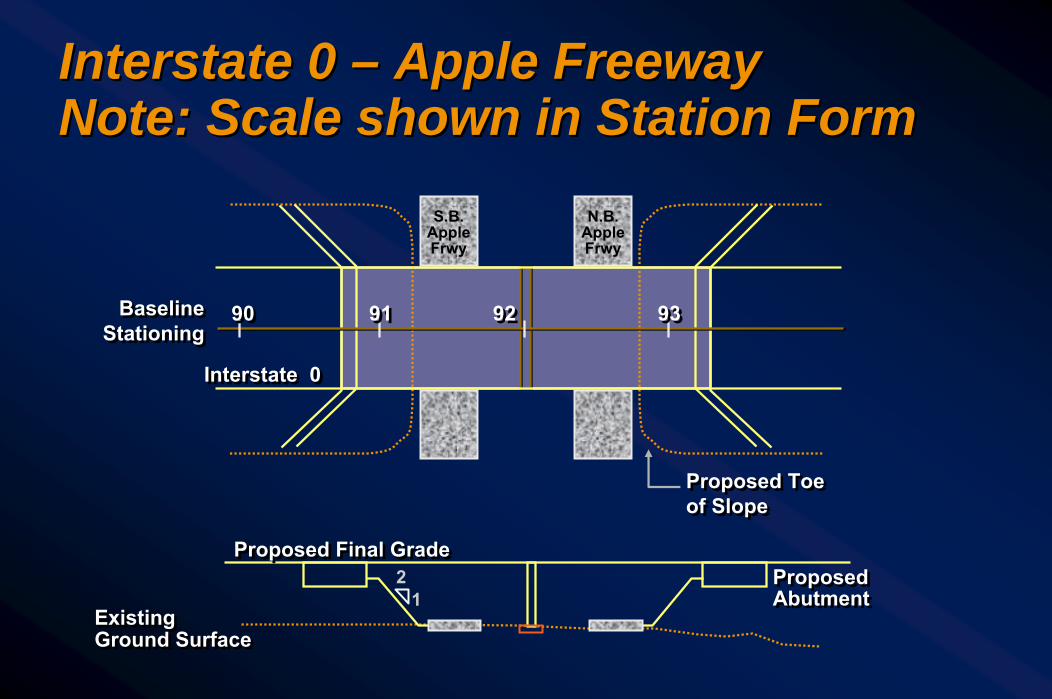
Interstate 0 Interstate 0 –– Apple FreewayApple FreewayNote: Scale shown in Station FormNote: Scale shown in Station Form
Baseline Stationing
Baseline Stationing
S.B. Apple Frwy
N.B. Apple Frwy
Proposed Toe of SlopeProposed Toe of Slope
Existing Ground SurfaceExisting Ground Surface
12
Proposed Final GradeProposed Final GradeProposed AbutmentProposed Abutment
Interstate 0Interstate 0
9090 9191 9292 9393

Apple Freeway Apple Freeway ExerciseExerciseggAppendix AAppendix A
-- Section A.5Section A.5
Subsurface Explorations
Terrain reconnaissance Site inspection Subsurface borings
Basic Soil Properties Visual description
Classification tests Soil Profile
Laboratory Testing Po diagram
Test request Consolidation results Strength results
Slope
Stability
Design soil profile Circular arc analysis Sliding block analysis Lateral squeeze analysis
Approach Roadway Settlement
Design soil profile Magnitude of settlement Rate of settlement Surcharge Vertical drains
Spread Footing Design
Design soil profile Pier bearing capacity Pier settlement Abutment settlement Surcharge Vertical drains
Driven Pile Design Design soil profile
Static analysis – pier Pipe pile H – pile Static analysis – abutment Pipe pile H – pile Driving resistance Lateral movement - abutment
Construction Monitoring
Wave equation Hammer approval Embankment instrumentation

Design Soil Profile (East Approach Design Soil Profile (East Approach Embankment)Embankment)
Fill
7' Sand
35' Clay
DenseGravel
10'
25'
2:1
= 110 pcf = 36°
= 130 pcf= 40°
= 125 pcf= 0
C = 0
C = 1100 psf
C = 0
30'30'
5'5'
= 130 = 130 pcfpcf= 43= 43°°
C = 0C = 0
33′′ OrganicOrganic
γγ = 90 = 90 pcfpcf
w = 120%w = 120% Fill
7' Sand
35' Clay
DenseGravel
10'
25'
2:1
= 110 pcf = 36°
= 130 pcf= 40°
= 125 pcf= 0
C = 0
C = 1100 psf
C = 0
30'30'
5'5'
= 130 = 130 pcfpcf= 43= 43°°
C = 0C = 0
33′′ OrganicOrganic
γγ = 90 = 90 pcfpcf
w = 120%w = 120% 30'30'
5'5'
= 130 = 130 pcfpcf= 43= 43°°
C = 0C = 0
33′′ OrganicOrganic
γγ = 90 = 90 pcfpcf
w = 120%w = 120%

Compute FS Against Circular Arc Compute FS Against Circular Arc Failure Failure –– Rule of Thumb AnalysisRule of Thumb Analysis
FillFill HC6.)S.F(SafetyofFactor
×=
γ
Soft Clay Soft Clay
γγFillFill = 130 = 130 pcfpcf
Bedrock Bedrock
3030’’
C = 1100 C = 1100 psfpsf
69.1)30)(130()1100)(6(.S.F ==
FillFill HC6.)S.F(SafetyofFactor
×=
γ
Soft Clay Soft Clay
γγFillFill = 130 = 130 pcfpcf
Bedrock Bedrock
3030’’
C = 1100 C = 1100 psfpsfSoft Clay Soft Clay
γγFillFill = 130 = 130 pcfpcf
Bedrock Bedrock
3030’’
C = 1100 C = 1100 psfpsf
69.1)30)(130()1100)(6(.S.F ==

Compute FS Against Circular Arc Compute FS Against Circular Arc Failure Failure –– Normal Method Normal Method (Hand Solution)(Hand Solution)
gg For deep clay subsoil, the “critical” (min FS) failure surface For deep clay subsoil, the “critical” (min FS) failure surface will generally pass deep into the weakest clay layer. The will generally pass deep into the weakest clay layer. The center of the circle usually lies above the fill slopecenter of the circle usually lies above the fill slope
FillFill33'33'
7'7' SandSand
35'35' ClayClay
DenseDenseGravelGravel
10'10'
25'25'
2:12:1RR
RROO
FillFill33'33'
7'7' SandSand
35'35' ClayClay
DenseDenseGravelGravel
10'10'
25'25'
2:12:1RR
RROO
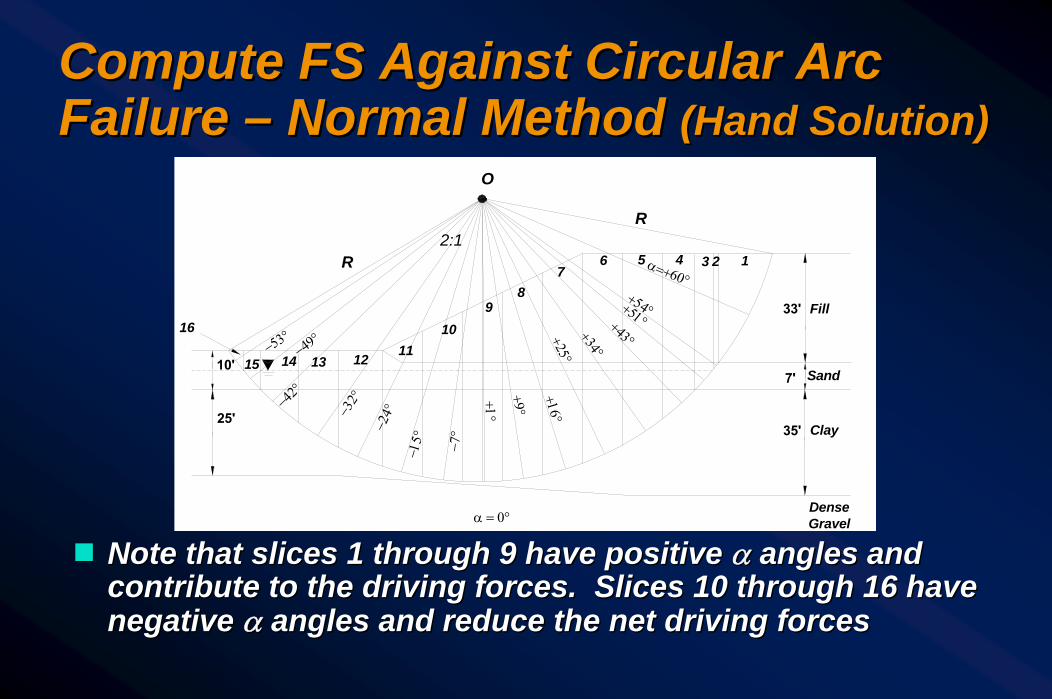
Compute FS Against Circular Arc Compute FS Against Circular Arc Failure Failure –– Normal Method Normal Method (Hand Solution)(Hand Solution)
gg Note that slices 1 through 9 have positive Note that slices 1 through 9 have positive αα angles and angles and contribute to the driving forces. Slices 10 through 16 have contribute to the driving forces. Slices 10 through 16 have negative negative αα angles and reduce the net driving forcesangles and reduce the net driving forces
O
R
R
33'
7'
35'25'
10'
Fill
Sand
Clay
Dense Gravel
1234567
89
1112131415
16
2:1
10
α=+60°+54°+51°+43°+34°
+25°+16°
+9°
+1°
−7°
−15°
−24°−3
2°−42°
−49°−53°
α = 0°
u ul
u ul
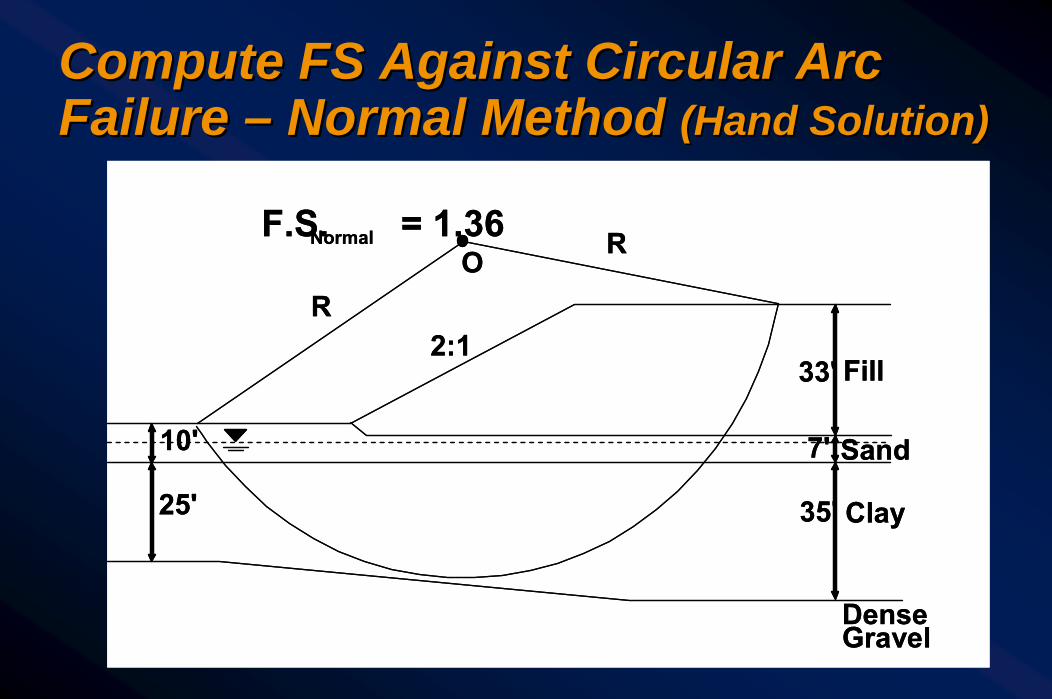
Compute FS Against Circular Arc Compute FS Against Circular Arc Failure Failure –– Normal Method Normal Method (Hand Solution)(Hand Solution)
Fill33'
7' Sand
35' Clay
DenseGravel
10'
25'
2:1R
ROF.S. = 1.36Normal
Fill33'
7' Sand
35' Clay
DenseGravel
10'
25'
2:1R
ROF.S. = 1.36Normal
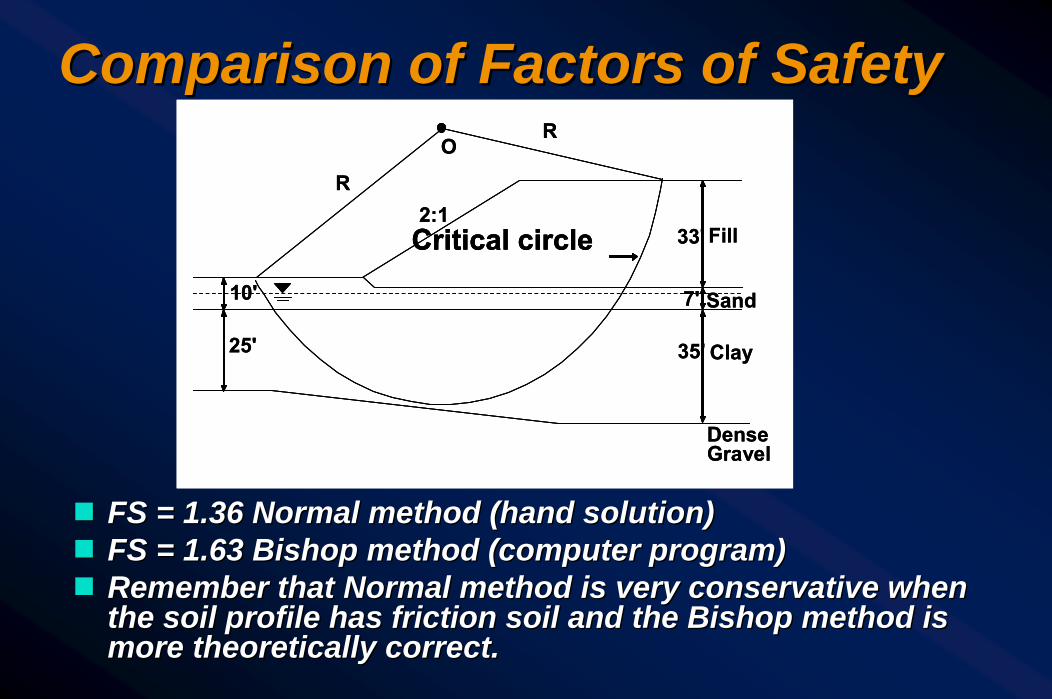
Comparison of Factors of SafetyComparison of Factors of Safety
gg FS = 1.36 Normal method (hand solution)FS = 1.36 Normal method (hand solution)gg FS = 1.63 Bishop method (computer program)FS = 1.63 Bishop method (computer program)gg Remember that Normal method is very conservative when Remember that Normal method is very conservative when
the soil profile has friction soil and the Bishop method is the soil profile has friction soil and the Bishop method is more theoretically correct.more theoretically correct.
Fill33'
7' Sand
35' Clay
DenseGravel
10'
25'
2:1R
RO
Critical circle Fill33'
7' Sand
35' Clay
DenseGravel
10'
25'
2:1R
RO
Critical circleCritical circle
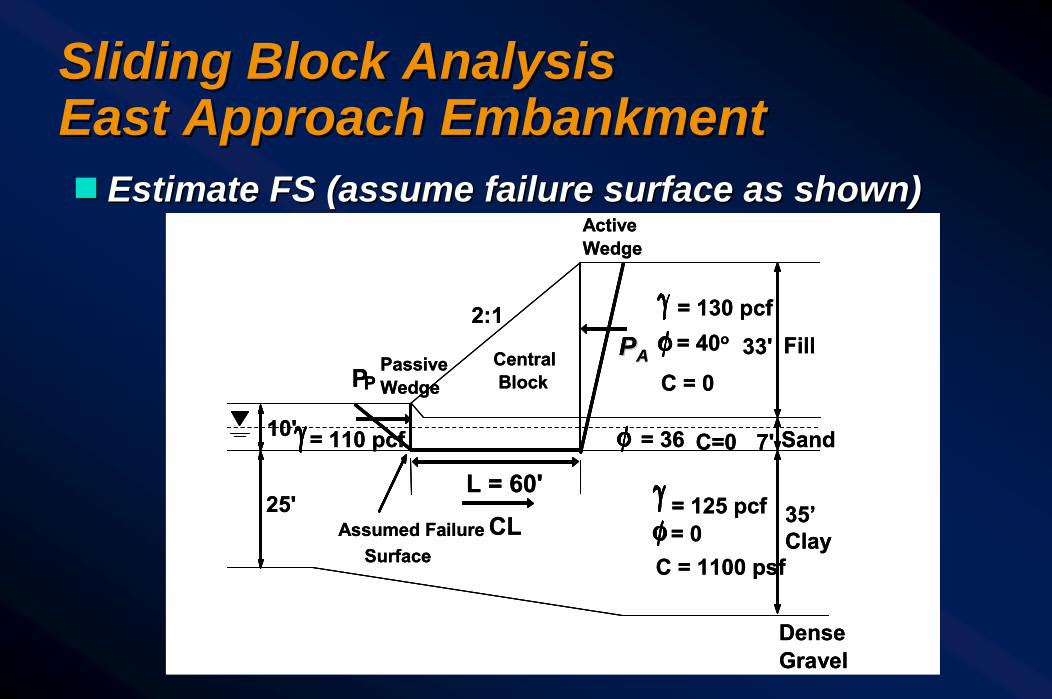
Sliding Block AnalysisSliding Block AnalysisEast Approach EmbankmentEast Approach Embankmentgg Estimate FS (assume failure surface as shown)Estimate FS (assume failure surface as shown)
Fill33'
7' Sand
35’Clay
DenseGravel
10'
25'
2:1
= 110 pcf = 36
= 130 pcf= 40o
= 125 pcf= 0
C = 0
C = 1100 psf
C=0
P
CLL = 60'
P
Assumed FailureSurface
ActiveWedge
PassiveWedge
CentralBlock
PPAA Fill33'
7' Sand
35’Clay
DenseGravel
10'
25'
2:1
= 110 pcf = 36
= 130 pcf= 40o
= 125 pcf= 0
C = 0
C = 1100 psf
C=0
P
CLL = 60'
P
Assumed FailureSurface
ActiveWedge
PassiveWedge
CentralBlock
PPAAPPAA
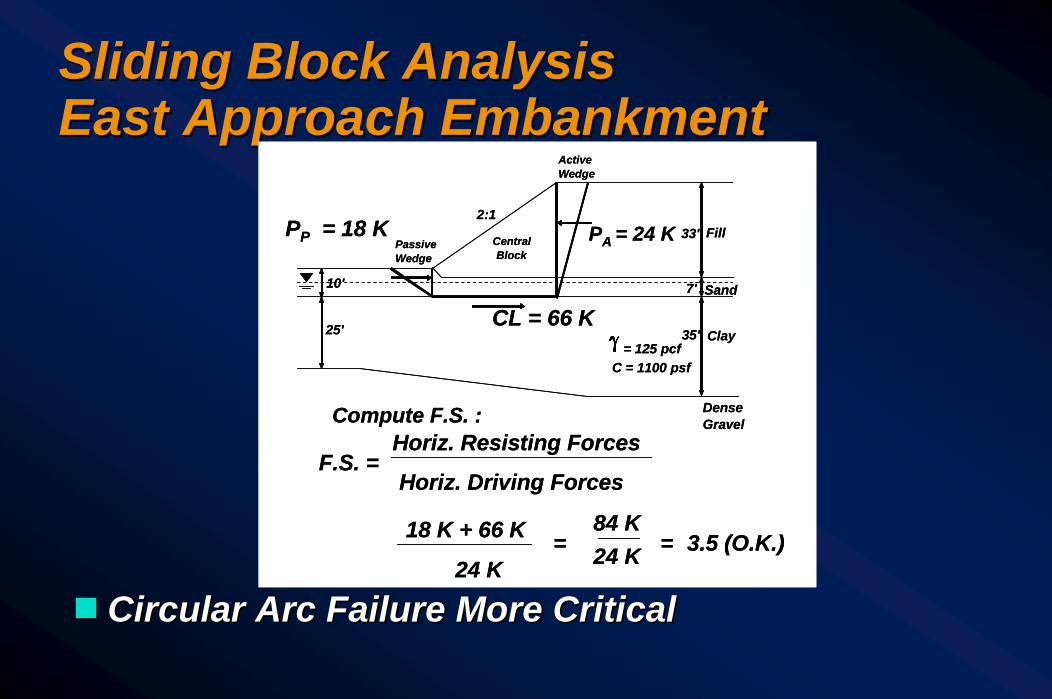
Sliding Block AnalysisSliding Block AnalysisEast Approach EmbankmentEast Approach Embankment
gg Circular Arc Failure More CriticalCircular Arc Failure More Critical
Fill33'
7' Sand
35' Clay
DenseGravel
10'
25'
2:1
= 125 pcfC = 1100 psf
PA = 24 K
CL = 66 K
ActiveWedge
PassiveWedge
CentralBlock
24 K
PP = 18 K
Compute F.S. :
F.S. =Horiz. Resisting Forces
Horiz. Driving Forces
18 K + 66 K =84 K24 K = 3.5 (O.K.)
Fill33'
7' Sand
35' Clay
DenseGravel
10'
25'
2:1
= 125 pcfC = 1100 psf
PA = 24 K
CL = 66 K
ActiveWedge
PassiveWedge
CentralBlock
24 K
PP = 18 K
Compute F.S. :
F.S. =Horiz. Resisting Forces
Horiz. Driving Forces
18 K + 66 K =84 K24 K = 3.5 (O.K.)

Summary of Embankment Slope Summary of Embankment Slope StabilityStabilityggDesign soil profileDesign soil profile
-- Soil layer unit weights and strengths estimatedSoil layer unit weights and strengths estimatedggCircular arc analysisCircular arc analysis
-- Approach embankment slope stability safety Approach embankment slope stability safety factor of 1.63 against circular failurefactor of 1.63 against circular failure
ggSliding block analysisSliding block analysis-- Approach embankment slope stability safety Approach embankment slope stability safety
factor of 3.5 against sliding failurefactor of 3.5 against sliding failure

Any Questions?Any Questions?
THE ROAD TOUNDERSTANDING
SOILSAND
FOUNDATIONS