Soilbuild Business Space REIT · HSBC ASEAN & India Conference 2016 . Soilbuild Business Space REIT...
35
HSBC ASEAN & India Conference 2016 . Soilbuild Business Space REIT 30 June 2016
Transcript of Soilbuild Business Space REIT · HSBC ASEAN & India Conference 2016 . Soilbuild Business Space REIT...

HSBC ASEAN & India Conference 2016 .
Soilbuild Business Space REIT
30 June 2016

2
Disclaimer
This presentation should be read in conjunction with the financial statements of Soilbuild Business Space REIT for the first quarter from 1 January 2016 to 31 March 2016 (hereinafter referred to 1Q FY2016).
This presentation is for information only and does not constitute an offer or solicitation of an offer to subscribe for, acquire, purchase, dispose of or sell any units in Soilbuild Business Space REIT (“Soilbuild REIT”, and units in Soilbuild REIT, “Units”) or any other securities or investment.
Nothing in this presentation should be construed as financial, investment, business, legal or tax advice and you should consult your own independent professional advisors.
This presentation may contain forward-looking statements that involve risks, uncertainties and assumptions. Future performance, outcomes and results may differ materially from those expressed in forward-looking statements as a result of a number of risks, uncertainties and assumptions. You are cautioned not to place undue reliance on these forward-looking statements, which are based on the current view of management of future events.
The value of Units and the income derived from them, if any, may fall or rise. Units are not obligations of, deposits in, or guaranteed by, the Manager or any of its affiliates. An investment in Units is subject to investment risks, including the possible loss of the principal amount invested.
Investors should note that they will have no right to request the Manager to redeem or purchase their Units for so long as the Units are listed on Singapore Exchange Securities Trading Limited (the “SGX-ST”). It is intended that holders of Units may only deal in their Units through trading on the SGX-ST. The listing of the Units on the SGX-ST does not guarantee a liquid market for the Units.
The past performance of Soilbuild REIT is not indicative of the future performance of Soilbuild REIT. Similarly, the past performance of SB REIT Management Pte. Ltd. (“Manager”) is not indicative of the future performance of the Manager.

3
Content
About Soilbuild Business Space REIT 4
1Q FY2016 Financial Performance 7
Financial Position / Capital Management 12
Portfolio Update 15
Right of First Refusal Properties 25
Proposed Acquisition of Bukit Batok Connection 27
Market Update and Outlook 31

About Soilbuild Business Space REIT

5
Overview of Soilbuild REIT
Sponsor
Soilbuild Group Holdings Ltd.
Public Unitholders
Manager
SB REIT Management Pte. Ltd.
24.9% 75.1%
100%
Trustee
DBS Trustee Limited
Property Portfolio
Property Manager
SB Property Services Pte. Ltd.
Note: (1) As at 31 December 2015 (2) As at 30 April 2016
Investment Mandate
Primarily in business space assets located in Singapore
Portfolio 11 properties valued at S$1.19 billion(1)
NLA of 3.53 million sq ft
Sponsor
Soilbuild Group Holdings Ltd.
– Leading integrated property group based in Singapore with 40 years of experience
– NAV of c.S$600 million as of 31 December 2015
Sponsor Stake 24.9%(2)
Manager SB REIT Management Pte. Ltd.
Credit Rating Baa3 (Moody’s)

6
Soilbuild REIT Roadmap
16 Aug 2013: Listed on SGX-ST
22 Jan 2014: Assigned BBB- corporate investment grade credit rating
26 May 2014: Completed maiden acquisition of Tellus Marine for S$18.2 million
16 Jul 2014: Awarded “Best Investor Relations” and “Best Annual Report”
31 Oct 2014: Completed KTL Offshore acquisition for S$55.7 million
23 Dec 2014: Completed Speedy-Tech acquisition for S$24.3 million
27 May 2015: Completed Technics acquisition for S$98.1 million
11 Feb 2015: Solaris Greenmark Platinum award renewed
25 Apr 2015: Established a S$500 million Medium Term Notes (“MTN”) Programme
21 May 2015: First issuance of S$100 million 3.45% Fixed Rate Notes Due 2018 under the MTN Programme
22 Apr 2015: Soilbuild REIT’s first equity fund raising of S$90 million via private placement
25 Sep 2015: Completed refinancing of S$185 million Club Loan to March 2020
22 Mar 2016: Assigned Baa3 investment grade issuer rating
8 April 2016: Second issuance of S$100 million 3.60% Fixed Rate Notes Due 2021 under the MTN Programme
27 May 2016: Withdrawal of S&P corporate credit rating. S&P reaffirmed the final “BBB-” long term corporate credit rating with a stable outlook
14 June 2016: Proposed Acquisition and Entry into of The Master Lease Agreement in relation to Bukit Batok Connection
Financial Performance
1Q FY2016
8
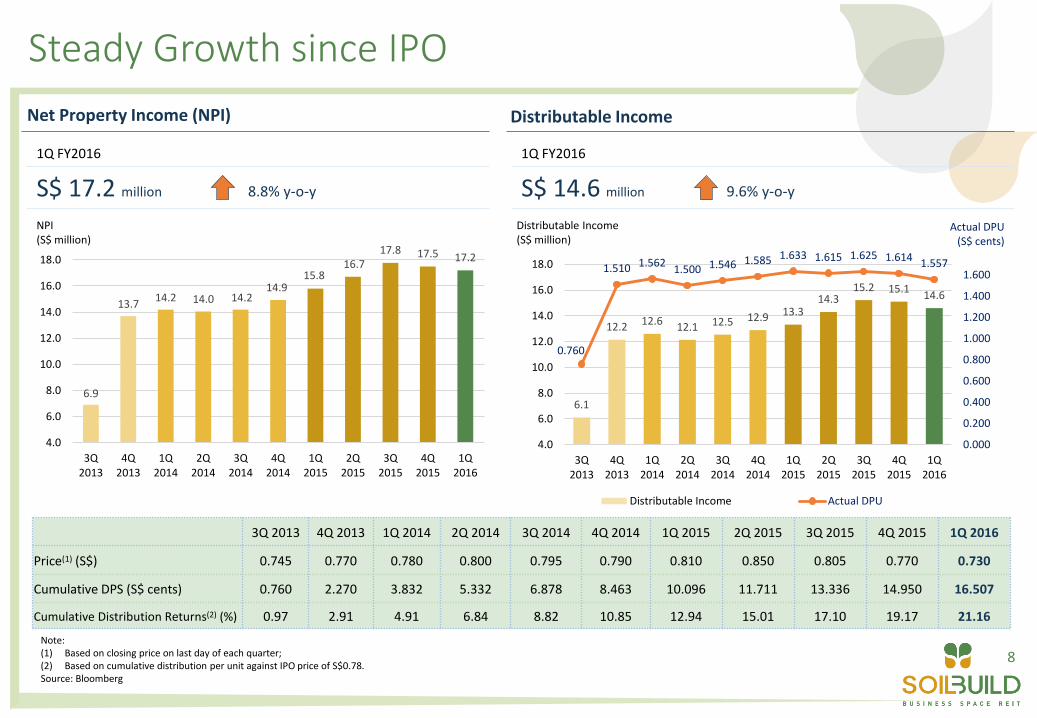
Steady Growth since IPO
6.1
12.2 12.6 12.1 12.5 12.9 13.3
14.3 15.2 15.1
14.6
0.760
1.510 1.562 1.500 1.546 1.585 1.633 1.615 1.625 1.614
1.557
0.000
0.200
0.400
0.600
0.800
1.000
1.200
1.400
1.600
4.0
6.0
8.0
10.0
12.0
14.0
16.0
18.0
3Q2013
4Q2013
1Q2014
2Q2014
3Q2014
4Q2014
1Q2015
2Q2015
3Q2015
4Q2015
1Q2016
Distributable Income Actual DPU
Net Property Income (NPI) Distributable Income
6.9
13.7 14.2 14.0 14.2
14.9 15.8
16.7 17.8 17.5 17.2
4.0
6.0
8.0
10.0
12.0
14.0
16.0
18.0
3Q2013
4Q2013
1Q2014
2Q2014
3Q2014
4Q2014
1Q2015
2Q2015
3Q2015
4Q2015
1Q2016
3Q 2013 4Q 2013 1Q 2014 2Q 2014 3Q 2014 4Q 2014 1Q 2015 2Q 2015 3Q 2015 4Q 2015 1Q 2016
Price(1) (S$) 0.745 0.770 0.780 0.800 0.795 0.790 0.810 0.850 0.805 0.770 0.730
Cumulative DPS (S$ cents) 0.760 2.270 3.832 5.332 6.878 8.463 10.096 11.711 13.336 14.950 16.507
Cumulative Distribution Returns(2) (%) 0.97 2.91 4.91 6.84 8.82 10.85 12.94 15.01 17.10 19.17 21.16
Note: (1) Based on closing price on last day of each quarter; (2) Based on cumulative distribution per unit against IPO price of S$0.78. Source: Bloomberg
Distributable Income (S$ million)
Actual DPU (S$ cents)
1Q FY2016 1Q FY2016
S$ 17.2 million 8.8% y-o-y S$ 14.6 million 9.6% y-o-y
NPI (S$ million)

9
1Q FY2016 Financial Results
For the period from
1Q FY2016 1Q FY2015
Variance
1 January 2016 to 31 March 2016
(S$’000)
Gross Revenue 20,142 18,615 8.2%
Less Property Expenses (2,949) (2,817) (4.7%)
Net Property Income 17,193 15,798 8.8%
Interest Income 236 47 402.1%
Finance Expenses(1) (3,296) (2,993) (10.1%)
Manager’s Fees(2) (1,461) (1,332) (9.7%) Trustee’s Fees (50) (47) (6.4%)
Other Trust Expenses (254) (447) 43.2%
Total Return before Distribution 12,368 11,026 12.2%
Add back Non-Tax Deductible Items(3) 2,241 2,299 (2.5%)
Distributable Income 14,609 13,325 9.6%
Note: (1) Finance Expenses comprise interest expense, amortisation of debt arrangement and prepayment fees and bank commitment fees. (2) Manager’s Fees comprise base fees. (3) Non-tax deductible Items comprise the Manager’s management fees, property management and lease management fees paid or payable in Units, rent free amortisation, Trustee’s fees, amortisation
of debt arrangement and prepayment fees and bank commitment fees.

10
Distribution per Unit
Note: (1) Based on the closing price of S$0.73 as at 31 March 2016. (2) Actual FY2015 DPU (3) Based on the closing price of S$0.77 as at 31 December 2015.
1Q FY2016 vs 1Q FY2015
1Q FY2016 1Q FY2015 Variance
Distributable Income (S$’000) 14,609 13,325 9.6%
Distribution per Unit (“DPU”) (cents) 1.557 1.633 (4.7%)
Annualised DPU (cents) 6.228 6.487(2) (4.0%)
Annualised Distribution Yield 8.5%(1) 8.4%(3) 1.2%
Number of Units issued 938,010,400 815,750,896 15.0%
11
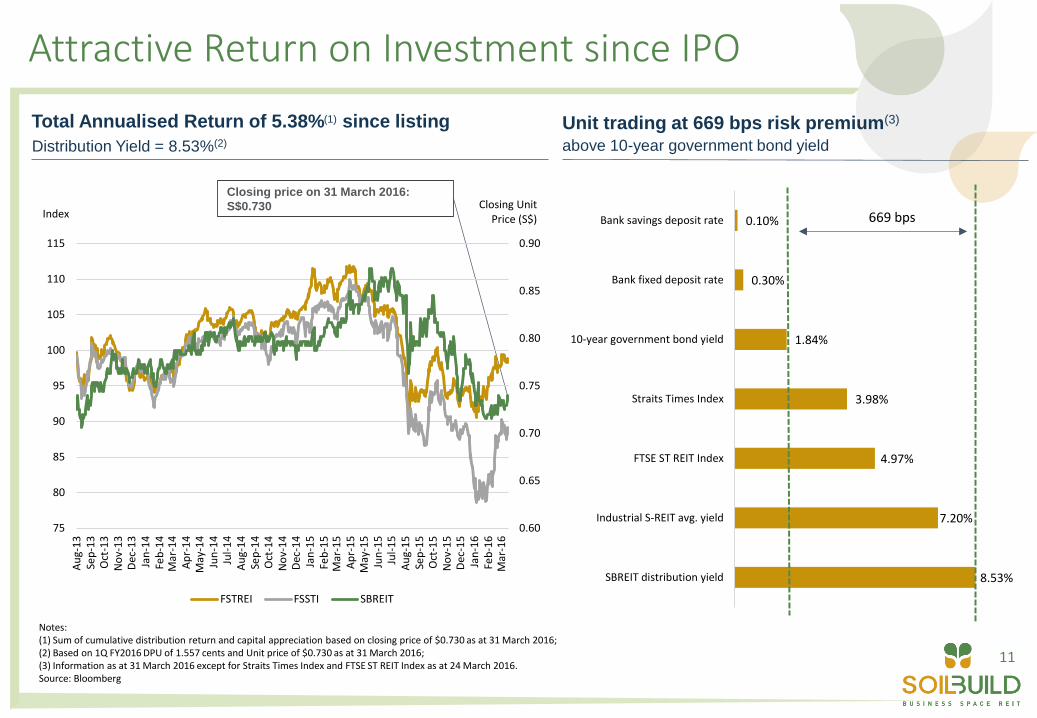
Attractive Return on Investment since IPO
Notes: (1) Sum of cumulative distribution return and capital appreciation based on closing price of $0.730 as at 31 March 2016; (2) Based on 1Q FY2016 DPU of 1.557 cents and Unit price of $0.730 as at 31 March 2016; (3) Information as at 31 March 2016 except for Straits Times Index and FTSE ST REIT Index as at 24 March 2016. Source: Bloomberg
Total Annualised Return of 5.38%(1) since listing
Distribution Yield = 8.53%(2)
Unit trading at 669 bps risk premium(3) above 10-year government bond yield
Closing price on 31 March 2016:
S$0.730
8.53%
7.20%
4.97%
3.98%
1.84%
0.30%
0.10%
SBREIT distribution yield
Industrial S-REIT avg. yield
FTSE ST REIT Index
Straits Times Index
10-year government bond yield
Bank fixed deposit rate
Bank savings deposit rate 669 bps
0.60
0.65
0.70
0.75
0.80
0.85
0.90
75
80
85
90
95
100
105
110
115
Au
g-1
3Se
p-1
3O
ct-1
3N
ov-
13
Dec
-13
Jan
-14
Feb
-14
Mar
-14
Ap
r-1
4M
ay-1
4Ju
n-1
4Ju
l-1
4A
ug-
14
Sep
-14
Oct
-14
No
v-1
4D
ec-1
4Ja
n-1
5Fe
b-1
5M
ar-1
5A
pr-
15
May
-15
Jun
-15
Jul-
15
Au
g-1
5Se
p-1
5O
ct-1
5N
ov-
15
Dec
-15
Jan
-16
Feb
-16
Mar
-16
Closing Unit Price (S$) Index
FSTREI FSSTI SBREIT

Financial Position / Capital Management

13
1Q FY2016 Financial Results – Statement of Financial Position
All figures S$’000 unless otherwise stated 31 March 2016 31 December 2015
Investment Properties 1,190,732 1,190,700
Other Assets 25,614 23,830
Total Assets 1,216,346 1,214,530
Borrowings 428,683 398,502
Other Liabilities 44,227 70,055
Net Assets 743,436 745,973
Units in Issue (‘000) 938,010 934,442
Net Asset Value per Unit (S$) 0.79 0.80

14
1) Soilbuild REIT is rated Baa3 by Moody’s.
Prudent Capital Management
3) Aggregate leverage of 36.0%(2) allows headroom of S$81 million(3)
Post Refinancing
Total Bank Financing Facilities S$185 million
Total Bank Debt Drawn Down S$185 million
Multicurrency Debt Issuance Programme drawn down
S$200 million
Interest-free Loan S$55 million
Unencumbered Investment Properties S$830 million
Secured leverage (4)
15%
Average All-in Interest Cost(5) 3.36%
Weighted Average Debt Maturity(2) 3.6 years
Weighted Average Term of Fixed Rate Borrowings
2.3 years
Notes: (1) Post refinancing of S$100 million term loan facility on 8 April 2016. (2) Includes interest free loan in relation to the Solaris upfront land premium. (3) Based on target aggregate leverage of 40%. (4) Secured Debt/Total Assets. (5) Excludes interest-free loan.
2) Lengthened weighted average debt maturity and fixed the interest rate for 100% of borrowings with the latest MTN issuance.
To mitigate interest rate risk, 100%(1) of total debt hedged with interest rate swaps/MTN
55
95
100
90
97.5
100
2016 2017 2018 2019 2020 2021
S$'m
illio
ns
Club Facility drawn down MTN Interest Free Loan
% of Debt Maturing 35.2% 42.1% 22.7%
Refinanced S$100 million term loan facility to 2021(1)

Portfolio Update

16
Portfolio Overview
Keppel Terminal Sentosa
Jurong Island
Jurong Port
Second Link (Tuas Checkpoint)
PSA Terminal
Tuas Port (2022)
ONE-NORTH
CHANGI SIMEI
EXPO JOO KOON
BOON LAY PIONEER
BUONA VISTA
Solaris NLA: 441,533 sq ft Valuation: S$360.0 million
Eightrium NLA: 177,286 sq ft Valuation: S$102.8 million
NLA: 1,240,583 sq ft Valuation: S$319.0 million
COS Printers NLA: 58,752 sq ft Valuation: S$11.2 million
Tuas Connection NLA: 651,072 sq ft Valuation: S$126.0 million
BK Marine NLA: 73,737 sq ft Valuation: S$16.5 million
West Park BizCentral
NLA: 312,375 sq ft Valuation: S$62.0 million
Valuation(1) S$1,190.7 million
Total NLA 3.53 million sq ft
WALE (by GRI) 4.7 years
Occupancy 94.8%
Portfolio Summary
CBD
Industrial Properties Business Park Properties
Tellus Marine NLA: 77,162 sq ft (2) Valuation: S$15.7 million (2)
SEMBAWANG
NLA: 208,057 sq ft Valuation: S$56.0 million
KTL Offshore
NK Ingredients
NLA: 93,767 sq ft Valuation: S$24.5 million
Speedy-Tech
Notes: (1) Based on CBRE’s & Colliers’ valuations dated 31 December 2015. (2) NLA and Valuation excludes the construction of a new annex to Tellus Marine.
NLA: 203,468 sq ft Valuation: S$97.0 million
Technics Offshore

17
Occupancy From Multi-tenanted Properties
97.4
100
86.3
100
92.3
99.7
94.8
92.7 90.1
80
85
90
95
100
3Q FY2013 4Q FY2013 1Q FY2014 2Q FY2014 3Q FY2014 4Q FY2014 1Q FY2015 2Q FY2015 3Q FY2015 4Q FY2015 1Q FY2016
Occ
up
ancy
(%
)
Eightrium
Tuas Connection
West Park BizCentral
Portfolio
Industrial Average
Portfolio Occupancy As at end of each quarter
3Q FY2013
4Q FY2013
1Q FY2014
2Q FY2014
3Q FY2014
4Q FY2014
1Q FY2015
2Q FY2015
3Q FY2015
4Q FY2015
1Q FY2016
Eightrium 97.4% 98.5% 100.0% 100.0% 100.0% 100.0% 100.0% 100.0% 100.0% 100.0% 100.0%
Tuas Connection 100.0% 100.0% 100.0% 93.2% 100.0% 100.0% 100.0% 100.0% 93.5% 93.5% 86.3%
West Park BizCentral 100.0% 100.0% 100.0% 99.8% 99.8% 100.0% 100.0% 99.3% 99.6% 94.2% 92.3%
Portfolio 99.8% 99.9% 100.0% 98.5% 99.9% 100.0% 100.0% 99.8% 98.7% 96.8% 94.8%
Industrial Average(1) 92.7% 91.9% 91.6% 90.7% 90.9% 90.9% 90.7% 91.0% 90.8% 90.6% 90.1%
Notes: (1) Source: JTC (1Q 2016)

18
Excellence above our peers…
Weighted Average Lease Expiry
By Gross Rental Income(2)
2.8
2.9
3.0
3.5
3.6
3.7
4.0
4.5
4.7
8.7
MINT
AACI
Sabana
VIT
CIT
A-REIT
Cache
MLT
SB REIT
Keppel DC
Note: (1) Source: Jefferies report dated 6 June 2016 (2) Source: Various REITs; Except for Mapletree Logistics Trust and Keppel DC REIT by Net Lettable Area as at 31 March 2016.
Weighted Average Land Lease Expiry
Weighted by Valuation(1)
One of the Youngest Portfolios of Business Space Properties
Long Balance Land Lease Expiry of 45.0 years

19
7.2%
15.1%
17.2% 6.7% 6.2%
29.9%
15.3%
12.5%
22.1%
7.2%
14.1%
37.4%
5.7% 5.0%
30.6%
0%
5%
10%
15%
20%
25%
30%
35%
40%
2016 2017 2018 2019 2020 >2020
Lease Expiry Profile By NLA Lease Expiry Profile By Gross Rental Income
Well Staggered Lease Expiry Profile
WALE (by NLA)
4.3 years
WALE (by Gross Rental Income)
4.7 years
Portfolio Lease Expiry Profile By % of NLA & % of Rental Income
Solaris Master Lease Expiry
Solaris Master Lease Expiry
10.9%
3.1% 0.4%
5.5%
2.2%
Solaris Lease Expiry (by GRI)
< Aug 2018
> Aug 2018
2019
2020
>2020
29.7%
20
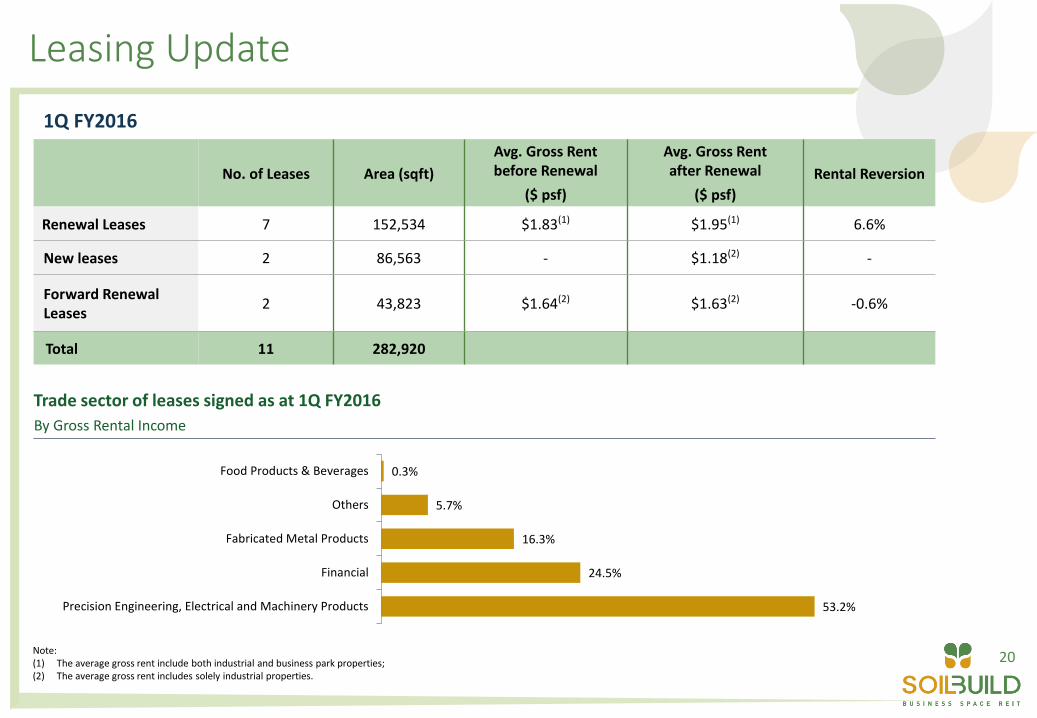
Leasing Update
No. of Leases Area (sqft)
Avg. Gross Rent before Renewal
Avg. Gross Rent after Renewal Rental Reversion
($ psf) ($ psf)
Renewal Leases 7 152,534 $1.83(1) $1.95(1) 6.6%
New leases 2 86,563 - $1.18(2) -
Forward Renewal Leases 2 43,823 $1.64(2) $1.63(2) -0.6%
Total 11 282,920
1Q FY2016
Trade sector of leases signed as at 1Q FY2016
By Gross Rental Income
53.2%
24.5%
16.3%
5.7%
0.3%
Precision Engineering, Electrical and Machinery Products
Financial
Fabricated Metal Products
Others
Food Products & Beverages
Note: (1) The average gross rent include both industrial and business park properties; (2) The average gross rent includes solely industrial properties.

21
9.1%
5.7%
4.4%
4.3%
4.0%
3.9%
3.3%
2.8%
2.4%
2.3%
Technics Offshore
NK Ingredients Pte Ltd
SPRING Singapore
KTL Offshore Pte Ltd
Mediatek Singapore Pte Ltd
Autodesk Asia Pte Ltd
Nestle Singapore (Pte) Ltd
John Wiley & Sons (Singapore) Pte Ltd
Dyson Operations Pte Ltd
SB Storage Pte Ltd
Quality & Diverse Tenant Base
Top 10 Tenants
By Gross Rental Income (1)
Notes: (1) Based on monthly gross rental and includes underlying tenants at Solaris as at 31 March 2016.
Top 10 tenants contribute 42.2% of monthly gross rental income.
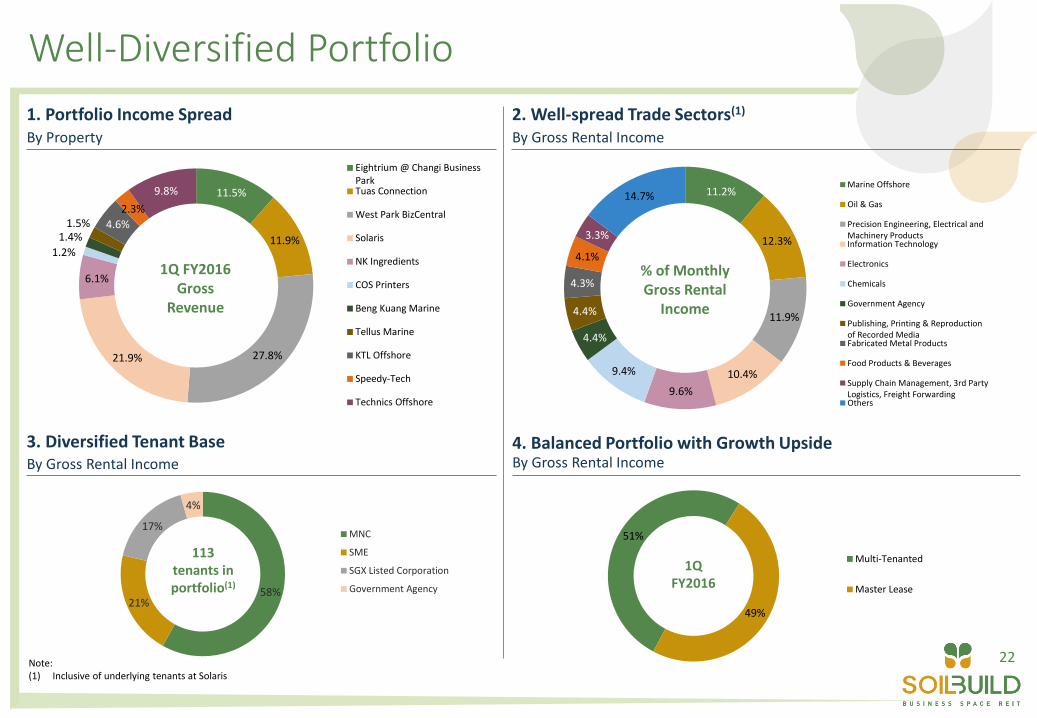
22
58% 21%
17%
4%
MNC
SME
SGX Listed Corporation
Government Agency
51%
49%
Multi-Tenanted
Master Lease
11.5%
11.9%
27.8% 21.9%
6.1%
1.2%
1.4% 1.5% 4.6%
2.3%
9.8%
Eightrium @ Changi BusinessParkTuas Connection
West Park BizCentral
Solaris
NK Ingredients
COS Printers
Beng Kuang Marine
Tellus Marine
KTL Offshore
Speedy-Tech
Technics Offshore
Well-Diversified Portfolio
1. Portfolio Income Spread By Property
2. Well-spread Trade Sectors(1) By Gross Rental Income
4. Balanced Portfolio with Growth Upside By Gross Rental Income
Note: (1) Inclusive of underlying tenants at Solaris
1Q FY2016 Gross
Revenue
1Q FY2016
113 tenants in portfolio(1)
3. Diversified Tenant Base By Gross Rental Income
% of Monthly Gross Rental
Income
11.2%
12.3%
11.9%
10.4%
9.6%
9.4%
4.4%
4.4%
4.3%
4.1%
3.3%
14.7% Marine Offshore
Oil & Gas
Precision Engineering, Electrical andMachinery ProductsInformation Technology
Electronics
Chemicals
Government Agency
Publishing, Printing & Reproductionof Recorded MediaFabricated Metal Products
Food Products & Beverages
Supply Chain Management, 3rd PartyLogistics, Freight ForwardingOthers
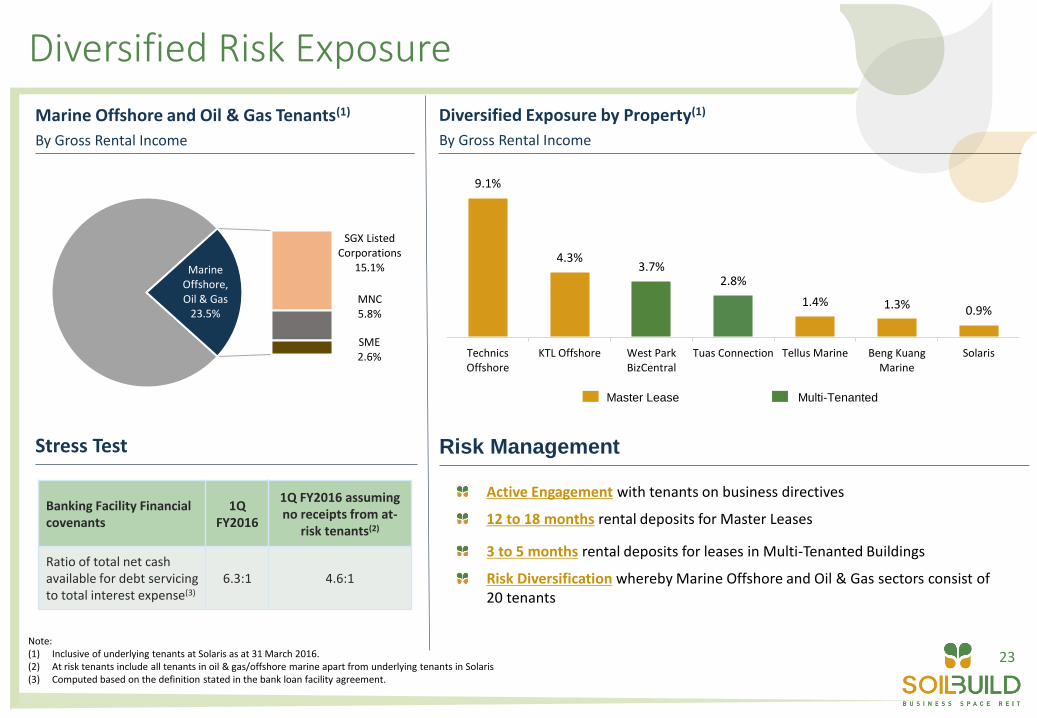
23
Diversified Risk Exposure
Marine Offshore and Oil & Gas Tenants(1)
By Gross Rental Income
Stress Test
SGX Listed Corporations
15.1%
MNC 5.8%
SME 2.6%
Marine Offshore, Oil & Gas
23.5%
9.1%
4.3% 3.7%
2.8%
1.4% 1.3% 0.9%
TechnicsOffshore
KTL Offshore West ParkBizCentral
Tuas Connection Tellus Marine Beng KuangMarine
Solaris
Note: (1) Inclusive of underlying tenants at Solaris as at 31 March 2016. (2) At risk tenants include all tenants in oil & gas/offshore marine apart from underlying tenants in Solaris (3) Computed based on the definition stated in the bank loan facility agreement.
Diversified Exposure by Property(1)
By Gross Rental Income
Active Engagement with tenants on business directives
12 to 18 months rental deposits for Master Leases
3 to 5 months rental deposits for leases in Multi-Tenanted Buildings
Risk Diversification whereby Marine Offshore and Oil & Gas sectors consist of 20 tenants
Master Lease Multi-Tenanted
Banking Facility Financial covenants
1Q FY2016
1Q FY2016 assuming no receipts from at-
risk tenants(2)
Ratio of total net cash available for debt servicing to total interest expense(3)
6.3:1 4.6:1
Risk Management

24
2016 2017 2018
Solaris NK Ingredients COS Printers BK Marine
Tellus Marine KTL Offshore Speedy-Tech Technics
Growing Cashflows from Master Leases
3.0% 2.0%
Long-term Master Leases Lease Term from start of Master Lease Agreement
Fixed Annual Rental Escalation of Master Leases Rental Revenue (S$ million)
39.9 41.0 41.9
Master Leases feature long term leases ranging from 5 to 15 years provides stability
Master Leases provide organic growth through annual or bi-annual rental escalations
Risk mitigation through 6-18 month rental deposits from Master Lessees and blue chip sub-tenant base
Expected Stable and Growing Cash Flows from the Master Leases
Master Leases structured on a double and triple net lease basis, minimising expenses to Soilbuild REIT
1
2
3
4
Master Lease Property Date of Acquisition Lease Term
1 Technics Offshore 27 May 2015 15 Years
2 NK Ingredients 15 February 2013 15 Years
3 COS Printers 19 March 2013 10 Years
4 Tellus Marine 26 May 2014 10 Years
5 Speedy-Tech 23 December 2014 10 Years
6 Beng Kuang Marine 10 May 2013 7 Years
7 KTL Offshore 31 October 2014 7 Years
8 Solaris 16 August 2013 5 Years

Right of First Refusal Properties

26
Acquisition of ROFR Properties
Current ROFR pipeline of 4 industrial properties with maximum GFA(1) in excess of 2.3 million sq ft
ROFR pipeline to continue growing as the Sponsor undertakes new development of business space properties
Acquisition / Development of Business Space Properties
Actively seeks to undertake developments(2) that will enhance the value of Soilbuild REIT
Ability to leverage on the Sponsor’s experience and expertise in designing and executing of construction projects
Ability to capitalize on the Sponsor’s extensive network to source 3rd party acquisition opportunities
Bukit Batok Connection 9-storey light industrial ramp-up building (TOP received) Max GFA: 404,000 sq ft
PIE
PIE
PIE
PIE
CTE
CTE PIE
PIE
AYE
Bukit Batok
MRT Bartley
MRT
Tai Seng
MRT
MacPherson
MRT
Paya Lebar
MRT
Aljunied
MRT
Boon Keng
MRT
Potong Pasir
MRT
Woodleigh
MRT
iPark 3 blocks of 7-storey flatted factory and a single-storey amenity centre (target redevelopment in 2018) Max GFA: 1,031,000 sq ft
Waterfront 5-storey light industrial building (target redevelopment in 2016) Max GFA: 326,000 sq ft
Waterview 7-storey light industrial building and a single-storey amenity (target redevelopment in 2016) Max GFA: 575,000 sq ft
+
Existing ROFR Assets
Notes: (1) GFA based on maximum allowable plot ratio (2) Subject to the limit imposed by the Property Funds Appendix.
2
Sponsor Right of First Refusal Properties
1

Proposed Acquisition of Bukit Batok Connection

28
Key Highlights of Proposed Acquisition
Location 2 Bukit Batok Street 23
Description 9 storey ramp-up light industrial development
Land Tenure 30 years with effect from 26
November 2012 (balance 26.5 years)
Land Area 161,577 sqft
Plot Ratio / Zoning 2.5 / Business 1
Gross Floor Area 403,591 sqft
Net Lettable Area 377,776 sqft
Car Park Lots 306 Car lots
190 Lorry lots
Bukit Batok Connection

29
Key Highlights of Proposed Acquisition
Note: (1) Acquisition fee is computed based on 1.0% of the property value. As the acquisition will constitute an ‘interested party transaction’ under Appendix 6 of the Code
on Collective Investment Schemes (the ‘Property Funds Appendix’) issued by the Monetary Authority of Singapore (‘MAS’), the acquisition fee units, shall not be sold within one year from the date of issuance in accordance with Paragraph 5.6 of the Property Funds Appendix.
Total Acquisition Cost
Purchase Consideration S$96.30 million
Acquisition Fee1 S$0.96 million
Stamp duty, professional fees and other expenses S$3.23 million
Total Cost S$100.49 million
Market Valuation by Independent Valuer
Valuer Valuation (S$ m) Capital value GFA (S$
psf)
Knight Frank Pte Ltd 96.6 239.4
CBRE Pte Ltd 96.0 237.9
Average 96.3 238.6

30
Key Highlights of Proposed Acquisition
Master Lessee SB (Westview) Investment Pte Ltd
Master Lease Tenure 7 Years
Initial Annual Rental S$8.0 million per annum
Rent Structure Double-net
Lessee shall be responsible for: (i) property tax and (ii) day-to-day maintenance and upkeep of property and insurance
Annual Rental Escalation Up to 2.0% annually
Master Lease Details

Market Update and Outlook

32
Industrial Properties Profile
95.7
105.9
96.4
103.9
0
5
10
15
20
25
30
80.0
85.0
90.0
95.0
100.0
105.0
110.0
4Q 2012 1Q 2013 2Q 2013 3Q 2013 4Q 2013 1Q 2014 2Q 2014 3Q 2014 4Q 2014 1Q 2015 2Q 2015 3Q 2015 4Q 2015 1Q 2016
Vac
ancy
rat
e (%
)
Ren
tal i
nd
ex
Multiple-User Factory Single-User Factory Warehouse Business Park
(4Q 2012 vs 1Q 2016) Multi-user Single-user Warehouse Business Park
Vacancy Rate (%) 3.0% 3.2% 2.5% 0.8%
Rental Index 4.3% 5.9% 3.6% 3.9%
Source: JTC (1Q 2016)
Rental index 4Q2012 = 100

33
Industrial Space Supply
9.02 9.04 9.08 9.14 9.36 9.42 9.61 9.76 9.89 9.97 10.12 10.23 10.34 10.30
21.49 21.57 21.88 22.07 22.24 22.36 22.53 22.66 22.80 22.93 23.00 23.19 23.32 23.47
7.38 7.41 7.48 7.53 7.74 7.93 8.22 8.28 8.41 8.51 8.58 8.69 8.89 9.07 1.55 1.54 1.57 1.54 1.55 1.60 1.60 1.60 1.74 1.78 1.80 1.84 1.92 2.05
4Q 20121Q 20132Q 20133Q 20134Q 20131Q 20142Q 20143Q 20144Q 20141Q 20152Q 20153Q 20154Q 20151Q 2016
Multiple-User Factory Single-User Factory Warehouse Business Park
Total Industrial Stock (‘million sq m)
since 4Q2012
39.4 39.6 40.0 40.3 40.9 41.3 42.0 42.3 42.8 43.2 43.5 44.0 44.5 44.9
14.0%
14.2% 9.2% 22.9% 32.3%
0.49 0.44 0.41 0.44 0.16
1.22
0.58
0.11 0.21
0.01
0.58
0.78
0.02 0.06
2016 2017 2018 2019 2020
Multiple-user factory Single-user factory
Warehouse Business Park
0.14
0.01
0.03
Business Park
and High Specs
sub-sectors have
high level of pre-
commitment
Total Industrial Supply in the Pipeline
2.43 1.81 0.54 0.71 0.20
Source: JTC (1Q 2016)

34
Market Update and Outlook
• Based on advance estimates released by the Ministry of Trade and Industry, Singapore’s economy in 1Q 2016 grew by 1.8% year-on-year, unchanged from the previous quarter. Growth was flat on a quarter-on-quarter seasonally-adjusted annualised basis, in contrast to the 6.2% expansion in the preceding quarter.
• Purchasing Managers’ Index for May 2016 remained unchanged at 49.8 from the preceding month, registering the highest reading since December 2015.
• Factory activity continues to contract over eleven consecutive months although new orders, exports, factory output and manufacturing employment have improved.
Singapore’s Economy
• With the slowdown in the manufacturing sector, rentals of all industrial properties softened by 2.7% in 1Q 2016 over the preceding quarter.
• The largest contraction was attributed by Multiple-user factory registering a 3.7% decline in rental index over 4Q 2015. Single-user factory, Business Park and Warehouse contracted 1.9%, 1.0% and 0.8% respectively over the preceding quarter.
Industrial
Property
Sector
• Despite the slow market conditions, the Manager has proactively negotiated and secured renewals and new leases for over 280,000 sq ft of space as at 31 March 2016.
• The challenge ahead is to re-let the vacant space and renew 7.2% or 250,000 sq feet of leases that are expiring for the rest of the year.
Soilbuild Business
Space REIT

Thank You
Roy Teo Chief Executive Officer Tel: (65) 6415 5983
Email: [email protected]
Lim Hui Hua Chief Financial Officer Tel: (65) 6415 5985
Email: [email protected]
Key Contacts: