Soil Sem Afm
5
259 Processing and Application of Ceramics 4 [4] (2010) 259–263 Structure and composition of soils # Snežana Nenadović 1,* , Miloš Nenadović 2 , Ljiljana Kljajević 1 , Vladimir Pavlović 3 , Aleksandar Đorđević 3 , Branko Matović 1 1 Laboratory for Material Science, Institute for Nuclear Sciences “Vinča”, University of Belgrade, Belgrade, Serbia 2 Laboratory for Atomic Physics, Institute for Nuclear Sciences “Vinča”, University of Belgrade, Belgrade, Serbia 3 Faculty of Agriculture, University of Belgrade, Belgrade, Serbia Received 17 November 2010; received in revised form 21 December 2010; accepted 27 December 2010 Abstract This paper presents a study of soils structure and composition using up to date technique, such as scanning electronic microscopy, atomic force microscopy, X-ray diffraction, X-ray fluorescence, as well as some other characterization methods. It was shown that soil particles have porous structure and dimensions in the range from several millimeters to several hundreds of nanometers and consist of different minerals such as kaolin, quartz and feldspate. Keywords: soil, structure, XRD, SEM, AFM, pipette method I. Introduction Soil micro-morphology is becoming more important and involved in studies on soils as porous media with their characteristic physical properties [1]. Soil is the upper layer of the unsaturated zone of the earth, and very diverse in composition and behaviour. The phase composition of soil consists of mineral particles, which differ in size, shape, agglomeration and organic matter in various stages of degradation. In particular scanning electron microscopy has been largely used to observe natural soil aggregates [2,3] and also analyze inorgan- ic soil components and their associates. This technique was used in a study of the fractal dimension of clay min- erals as well as associations of aluminium-iron species with silica particles [4] and the mixture of clay minerals with inorganic materials [5]. Soil science permeates other sciences concerning all materials that can be found in soils, such as mineralo- gy, crystallography, chemistry, physics, petrology, geo- sciences etc. It is important to add that soil matrix can provide nutrition for organisms and is also closely re- lated to biomedicine. Thus, soil is a complex mixture of chemicals and organisms some of which are usual- ly organized at the nanolevel. The definition of nano- technology has expanded from the initial discoveries of the capacity to move and locate atoms singularly to something much larger [6]. Now, it is possible to un- derstand soil structures using techniques developed for nanotechnology such as scanning electronic microsco- py, atomic force microscopy [7,8], X-ray diffraction, X- ray fluorescence etc. Thus, main goal of this investiga- tion was to characterize soil in its natural state. II. Experimental The investigated soil samples were taken from a small agricultural valley located at Rudovci tableland near Lazarevac, Serbia (44°22’ N, 20°24’ E) having the average inclination of 4–5°. Soil samples were tak- en from horizons within the area of 4 km 2 and for our investigation the samples from the first horizon were used. The soil sample was air-dried and sifted through 2 mm sieve. 10 g of the sifted sample was added to 25 ml of 0.4 M solution of Na 4 P 2 O 7 ×10H 2 O in the H 2 O 2 / water solution in order to separate organic part of the soil from the inorganic one. The obtained suspension was dilluted by addition of water, which was left to boil, and sifted through 0.5 mm sieve. The sediment that re- # Paper presented at 4 th Serbian Conference on Electron Microscopy, Belgrade, Serbia, 2010 * Corresponding author: tel: +381 11 3408 779 fax: +381 11 244 7335, e-mail: [email protected]
-
Upload
abhijeet-gandage -
Category
Documents
-
view
212 -
download
0
description
Paper on microstructure studies of soil using Scanning Electron microscope and atomic force microscopy
Transcript of Soil Sem Afm

259
Processing and Application of Ceramics 4 [4] (2010) 259–263
Structure and composition of soils#
Snežana Nenadović1,*, Miloš Nenadović2, Ljiljana Kljajević1, Vladimir Pavlović3, Aleksandar Đorđević3, Branko Matović1
1Laboratory for Material Science, Institute for Nuclear Sciences “Vinča”, University of Belgrade, Belgrade, Serbia2Laboratory for Atomic Physics, Institute for Nuclear Sciences “Vinča”, University of Belgrade, Belgrade, Serbia3Faculty of Agriculture, University of Belgrade, Belgrade, SerbiaReceived 17 November 2010; received in revised form 21 December 2010; accepted 27 December 2010
AbstractThis paper presents a study of soils structure and composition using up to date technique, such as scanning electronic microscopy, atomic force microscopy, X-ray diffraction, X-ray fluorescence, as well as some other characterization methods. It was shown that soil particles have porous structure and dimensions in the range from several millimeters to several hundreds of nanometers and consist of different minerals such as kaolin, quartz and feldspate.
Keywords: soil, structure, XRD, SEM, AFM, pipette method
I. IntroductionSoil micro-morphology is becoming more important
and involved in studies on soils as porous media with their characteristic physical properties [1]. Soil is the upper layer of the unsaturated zone of the earth, and very diverse in composition and behaviour. The phase composition of soil consists of mineral particles, which differ in size, shape, agglomeration and organic matter in various stages of degradation. In particular scanning electron microscopy has been largely used to observe natural soil aggregates [2,3] and also analyze inorgan-ic soil components and their associates. This technique was used in a study of the fractal dimension of clay min-erals as well as associations of aluminium-iron species with silica particles [4] and the mixture of clay minerals with inorganic materials [5].
Soil science permeates other sciences concerning all materials that can be found in soils, such as mineralo-gy, crystallography, chemistry, physics, petrology, geo-sciences etc. It is important to add that soil matrix can provide nutrition for organisms and is also closely re-
lated to biomedicine. Thus, soil is a complex mixture of chemicals and organisms some of which are usual-ly organized at the nanolevel. The definition of nano-technology has expanded from the initial discoveries of the capacity to move and locate atoms singularly to something much larger [6]. Now, it is possible to un-derstand soil structures using techniques developed for nanotechnology such as scanning electronic microsco-py, atomic force microscopy [7,8], X-ray diffraction, X-ray fluorescence etc. Thus, main goal of this investiga-tion was to characterize soil in its natural state.
II. ExperimentalThe investigated soil samples were taken from a
small agricultural valley located at Rudovci tableland near Lazarevac, Serbia (44°22’ N, 20°24’ E) having the average inclination of 4–5°. Soil samples were tak-en from horizons within the area of 4 km2 and for our investigation the samples from the first horizon were used. The soil sample was air-dried and sifted through 2 mm sieve. 10 g of the sifted sample was added to 25 ml of 0.4 M solution of Na4P2O7×10H2O in the H2O2/water solution in order to separate organic part of the soil from the inorganic one. The obtained suspension was dilluted by addition of water, which was left to boil, and sifted through 0.5 mm sieve. The sediment that re-
#Paper presented at 4th Serbian Conference on Electron Microscopy, Belgrade, Serbia, 2010 * Corresponding author: tel: +381 11 3408 779 fax: +381 11 244 7335, e-mail: [email protected]

260
S. Nenadović et al. / Processing and Application of Ceramics 4 [4] (2010) 259–263
mained on sieve was washed, dried at 105°C and final-ly sifted through 0.2 mm sieve [9]. The fractions of sand and clay were separated by pipette method [10–14].
Granulometric composition was determined using sedimentation method. The crystal structure of soil, be-fore and after pipette method, was examined with X-ray diffractometer Siemens D-500, with Cu Kα radiation. The diffracted X-rays were collected over 2θ range 20–80° using a step width of 0.02° and measuring for 1s per step. Particle size and morphology of the soil were in-vestigated by scanning electron microscopy (SEM) us-ing JEOL JSM 6390 LV operating at 25 kV. The surface morphology of the soil was quantified using an atomic force microscopy (AFM). The AFM studies were car-ried out on Veeco MultiMode Quadrex IIIe in the tap-ping mode, where cantilever is tapping the surface and gives topography by interaction with surface. Solid phase AFM imaging was performed in tapping mode with a 15-20 μm high pyramidal tip made from 0.5–2 Ω∙cm phosphorus n-doped Si. The resonance frequency of tip was 268.2 kHz. The scan rate was maintained in order of 2 Hz to get the optimal image quality. During the tapping mode it was very important to avoid thermal drift, which is manifested by lines and irregular shapes over the image.
III. Results and discussionMechanical elements of the soils have a mutual dif-
ference in their dimensions, shapes, origin, mineralog-ical composition and chemical and physical properties. Particle dimensions are in the range from several mil-limeters to several hundreds of nanometers (Table 1). According to the classification of soils by their texture done by Wiegner [15] and content of physical clay it can be concluded that the investigated soil belongs to a type of clay named light clay. Chemical composition of each fraction of particles is presented in Table 2. It can
be seen that with decreasing of particle size the amount of SiO2 decreases and the amount of Al2O3 increases. This results in different oxide ratio, that affect on chem-ical and physical properties.
Recent investigation shows that all types of soils have more or less complex mineralogical composition. X-ray analysis of soil, shown in Fig. 1, gave basic data of qual-itative composition of soil samples. Soil powder consists of different minerals and the most frequent components are kaolin, quartz and feldspate. Mineralogical composi-tion of the specified fraction of particles is different and depends on their chemical composition. Quartz in the soils has primary (volcanic) origin and it is the most fre-quent in acid soils. Analysis of soil samples confirmed that they are moderately acid (pH value of 5.1).
Microstructure of noncarbonated soil of clay sedi-ments is presented in Fig. 2. Quartz is the most frequent mineral of alluvial horizon in the investigated samples. SEM micrograph of the green soil sample, shown in Fig. 2a, confirms that the broad distribution of particles is obtained after mechanical separation, ranging from few micrometers to few hundreds of micrometers. Ka-olin and quartz particles are clearly visible. SEM micro-graph with higher magnification (Fig. 2c) confirms that particles have porous and cracking structure which is responsible for many soil properties. Aggregate struc-
Figure 1. XRD analysis of soil powder from the fraction having size 0.2–0.05 mm (K-kaolin, F-feldspate, Q-quartz)
Table 1. Granulometric composition of the analyzed soil
Total sand Coarse powder Physical clay
Coarse sand2–0.2 mm
[wt.%]
Fine sand0.2–0.05 mm
[wt.%]
Coarse powder0.05–0.01 mm
[wt.%]
Powder0.01–0.002 mm
[wt.%]
Colloidal clay<0.002 mm
[wt.%]
0.57 2.67 41.3 19.82 35.65
Table 2. Chemical composition of soil mechanical fractions
Particle size[mm] SiO2 Al2O3 Fe2O3 CaO MgO K2O Na2O P2O5
2–0.2 85.0 8.1 1.1 0.9 0.9 1.5 1.6 0.070.2–0.05 73.9 13.5 4.2 3.1 1.1 1.7 1.5 0.120.05–0.01 70.2 14.0 5.9 2.2 1.1 1.5 3.9 0.210.01–0.002 67.2 18.2 7.9 1.5 1.6 2.5 1.3 0.29
<0.002 44.1 27.6 2.2 0.6 0.7 1.5 1.5 0.12

261
S. Nenadović et al. / Processing and Application of Ceramics 4 [4] (2010) 259–263
Figure 3. SEM micrographs of soil sample, obtained by pipette method, recorded at different magnifications: a) 90×, b) 400× and c) 2500×
Figure 2. SEM micrographs of green soil sample recorded at different magnifications: a) 90×, b) 400× and c) 2500×
a)
a)
b)
b)
c)
c)
262
S. Nenadović et al. / Processing and Application of Ceramics 4 [4] (2010) 259–263
ture whose elemental particles are bonded in small qua-si stable clods with clearly defined surfaces known as structure aggregates is clearly visible. Those aggre-gates have three-dimensional structure very different in shape, size, stability and interior structure. The aggre-gate structure has a strong influence on soil strength.
In the most cases, sand agglomerates have more or less uniform dimensions and they can be approximated by spheres with uneven surfaces such as these on Fig. 2. Sand has weak chemical activity caused by its low specific surface area. Sand does not show plasticity and stickiness, does not swell in water and does not change its volume in dry state. Basic part of this fraction has influ-ence on water circulation and, thus, on pollutants diffu-sion. Therefore, very sandy soils, because of domination of macro pores (Fig. 2), have weak waterproof ability and insignificant water capillary rise. Dissolved salts and ions are easy to rinse out from the sand fractions.
SEM micrographs of soil sample, obtained by pi-pette method are shown in Fig. 3. Particles have size in the range from 50 to 200 μm and clearly defined poros-ity similar to clay. According to dimensional analysis and other properties this powder fraction is considered to be in transitional state between sand and clay. Thus, this powder fraction has low chemical activity. Wetting shows weak plasticity, stickiness and swelling. Contrary to the sand, powder in dry state has hard consistence. Be-cause of emphasized capillarity, powder fraction has av-erage waterproof ability, high capillary rise, while capil-lary rise is significantly less pronounced than in sands.
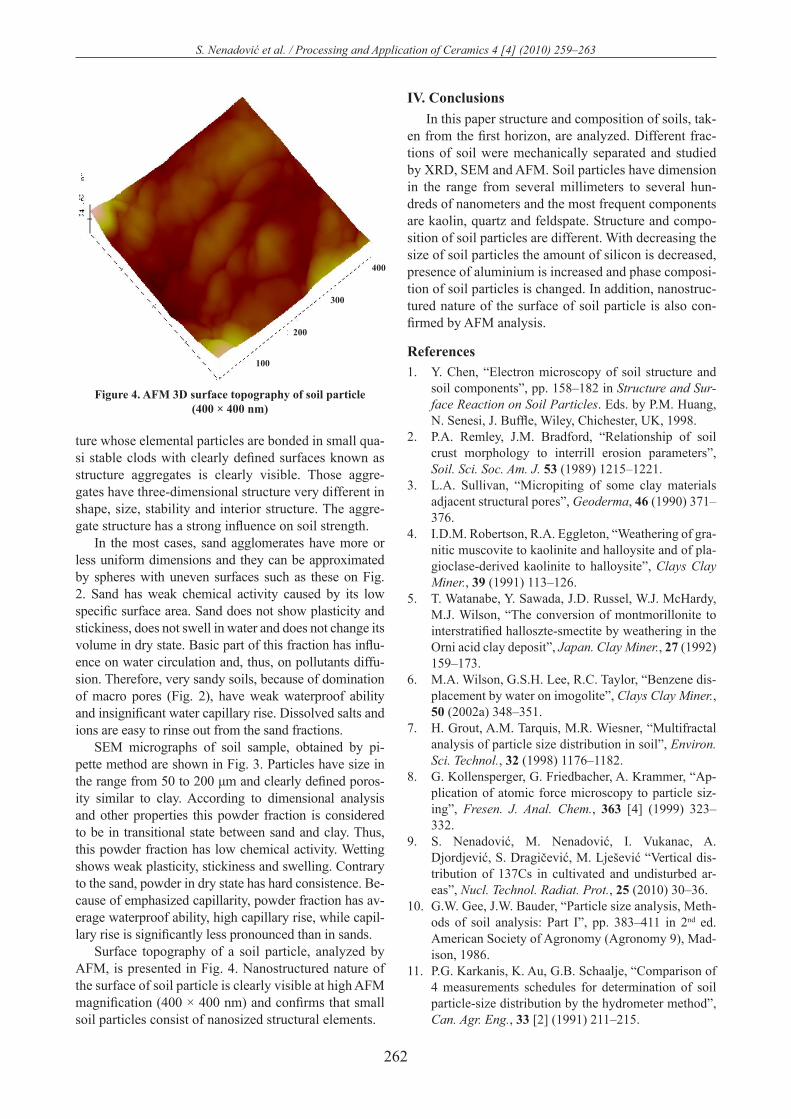
Surface topography of a soil particle, analyzed by AFM, is presented in Fig. 4. Nanostructured nature of the surface of soil particle is clearly visible at high AFM magnification (400 × 400 nm) and confirms that small soil particles consist of nanosized structural elements.
IV. ConclusionsIn this paper structure and composition of soils, tak-
en from the first horizon, are analyzed. Different frac-tions of soil were mechanically separated and studied by XRD, SEM and AFM. Soil particles have dimension in the range from several millimeters to several hun-dreds of nanometers and the most frequent components are kaolin, quartz and feldspate. Structure and compo-sition of soil particles are different. With decreasing the size of soil particles the amount of silicon is decreased, presence of aluminium is increased and phase composi-tion of soil particles is changed. In addition, nanostruc-tured nature of the surface of soil particle is also con-firmed by AFM analysis.
ReferencesY. Chen, “Electron microscopy of soil structure and 1. soil components”, pp. 158–182 in Structure and Sur-face Reaction on Soil Particles. Eds. by P.M. Huang, N. Senesi, J. Buffle, Wiley, Chichester, UK, 1998.P.A. Remley, J.M. Bradford, “Relationship of soil 2. crust morphology to interrill erosion parameters”, Soil. Sci. Soc. Am. J. 53 (1989) 1215–1221.L.A. Sullivan, “Micropiting of some clay materials 3. adjacent structural pores”, Geoderma, 46 (1990) 371–376.I.D.M. Robertson, R.A. Eggleton, “Weathering of gra-4. nitic muscovite to kaolinite and halloysite and of pla-gioclase-derived kaolinite to halloysite”, Clays Clay Miner., 39 (1991) 113–126.T. Watanabe, Y. Sawada, J.D. Russel, W.J. McHardy, 5. M.J. Wilson, “The conversion of montmorillonite to interstratified halloszte-smectite by weathering in the Orni acid clay deposit”, Japan. Clay Miner., 27 (1992) 159–173.M.A. Wilson, G.S.H. Lee, R.C. Taylor, “Benzene dis-6. placement by water on imogolite”, Clays Clay Miner., 50 (2002a) 348–351.H. Grout, A.M. Tarquis, M.R. Wiesner, “Multifractal 7. analysis of particle size distribution in soil”, Environ. Sci. Technol., 32 (1998) 1176–1182.G. Kollensperger, G. Friedbacher, A. Krammer, “Ap-8. plication of atomic force microscopy to particle siz-ing”, Fresen. J. Anal. Chem., 363 [4] (1999) 323–332.S. Nenadović, M. Nenadović, I. Vukanac, A. 9. Djordjević, S. Dragičević, M. Lješević “Vertical dis-tribution of 137Cs in cultivated and undisturbed ar-eas”, Nucl. Technol. Radiat. Prot., 25 (2010) 30–36.G.W. Gee, J.W. Bauder, “Particle size analysis, Meth-10. ods of soil analysis: Part I”, pp. 383–411 in 2nd ed. American Society of Agronomy (Agronomy 9), Mad-ison, 1986.P.G. Karkanis, K. Au, G.B. Schaalje, “Comparison of 11. 4 measurements schedules for determination of soil particle-size distribution by the hydrometer method”, Can. Agr. Eng., 33 [2] (1991) 211–215.
Figure 4. AFM 3D surface topography of soil particle (400 × 400 nm)
100
200
300
400

263
S. Nenadović et al. / Processing and Application of Ceramics 4 [4] (2010) 259–263
C.M.P. Vaz, J.M. Naime, A. Macedo, “Soil particle 12. size fractions determined by gamma-ray attenuation”, Soil Sci., 164 [6] (1999) 403–410.M. Konert, J. Vanderberghe, “Comparison of laser 13. grain size analysis with pipette and sieve analysis: a solution for the underestimation of the clay fraction”, Sedimentology, 44 [3] (1997) 523–535.
G.D. Buchan, K.S. Grewal, J.J. Claydon, R.J. Mcpher-14. son, “A comparison of sedigraph and pipette methods for soil particle-size analysis”, Aust. J. Soil Res., 31 [4] (1993) 407–417.L.E. Wagner, D. Ding, “Representing aggregate size 15. distributions as modified log normal distributions”, Trans. Am. Soc. Agr. Eng., 37 [3] (1994) 815–821.