Soil Reinforcement and foundations
56
“STUDY OF ENGINEERING PROPERTIES OF SOIL USING AGGREGATE DUST” GUIDED BY DR. Mrs. S. A. BHALCHANDRA Submitted By 1. Biradar Amasidd D. (BE06F01F017) 2. Borgaonkar Shiwani J. (BE06F01F043) 3. Kulkarni Swapna N. (BE06F01F050) 4. Shinde Priyanka S. A project on
-
Upload
manoj-terekar -
Category
Documents
-
view
31 -
download
3
description
a seminar on Soil Reinforcement including topics about soil reinforcementsoil mechanicsfoundationsfoundation engineeringcivil enginnering
Transcript of Soil Reinforcement and foundations

“STUDY OF ENGINEERING PROPERTIES OF SOIL USING AGGREGATE DUST”
GUIDED BYDR. Mrs. S. A. BHALCHANDRA
Submitted By
1. Biradar Amasidd D. (BE06F01F017)
2. Borgaonkar Shiwani J. (BE06F01F043)
3. Kulkarni Swapna N. (BE06F01F050)
4. Shinde Priyanka S. (BE06F01F086)
5. Kucche Kaviraj J. (BE07S01F005)
6.Shinde Mahesh B. (BE07S01F008
A project on

CONTENTS
INTRODUCTION
LITERATURE REVIEW
SYSTEM DEVELOPMENT
PERFORMANCE ANALYSIS
CONCLUSION
REFERANCES
The study is conducted on locally available soil(behind Hostel-A Government Engineering College Aurangabad) and a black cotton soil collected from near the Madhubahan hotel Beed Bypass Aurangabad.
Aggregate dust is collected from Waluj MIDC region crusher plant
And the experiments are conducted at Geotechnical Lab. Civil engineering department, Government Engineering College Aurangabad
1. INTRODUCTION
1. BC soils absorb water heavily, swell, become soft, lose strength, easily
compressible and has tendency to heave during wet condition.
2. BC soils shrink in volume and develop cracks during summer(70mm wide
and 1 m deep). They are characterised by extreme hardness and cracks
when dry.
3. When Free Swell Index exceeds 50%(called highly expansive ), undergo
volumetric changes leading to pavement distortion, cracking and general
unevenness due to seasonal wetting and drying.
4. BC soils produce a CBR value of 2 to 5% if compacted efficiently
As we know:
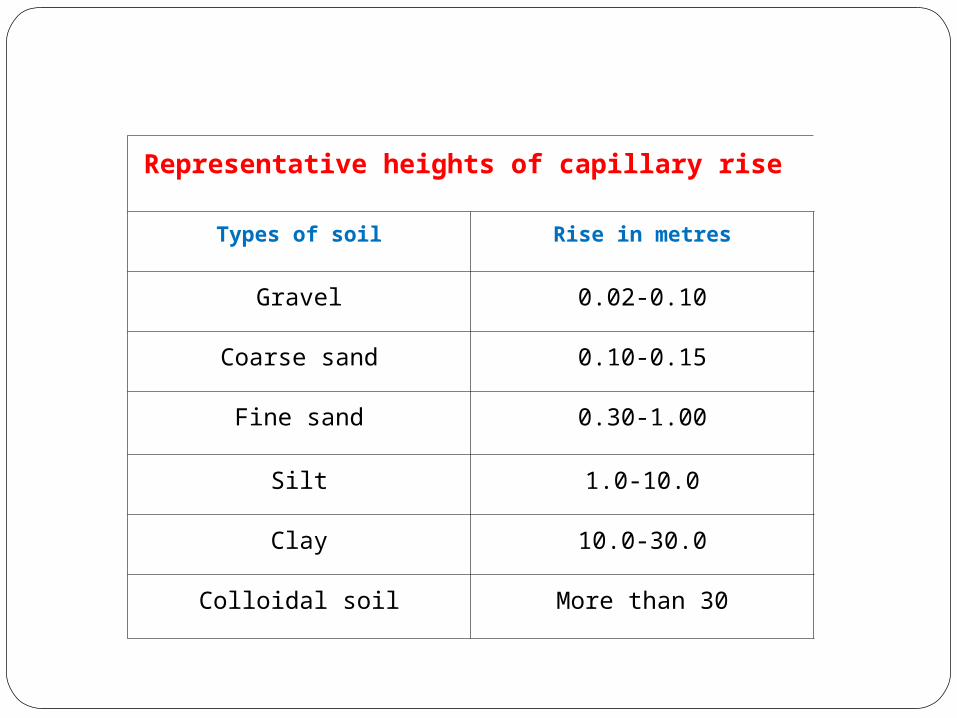
Representative heights of capillary rise
Types of soil Rise in metres
Gravel 0.02-0.10
Coarse sand 0.10-0.15
Fine sand 0.30-1.00
Silt 1.0-10.0
Clay 10.0-30.0
Colloidal soil More than 30

Recent trend in research works in the field of geotechnical
Engineering and construction materials focuses more on the
search for the cheap and locally available materials such as
aggregate dust fly ash baggage ash etc. as a stabilizing agents For
the purpose of full or partially replacement of traditional wastes.
Stone dust is becoming a new focus of researchers of the
enhanced friction property such waste when combined with soil.
Thus this project is aimed at evaluating the possibility of utilizing
aggregate dust in increasing the engineering properties of soil
Glass Fibers
Geo-Nets
Aggregate Dusts
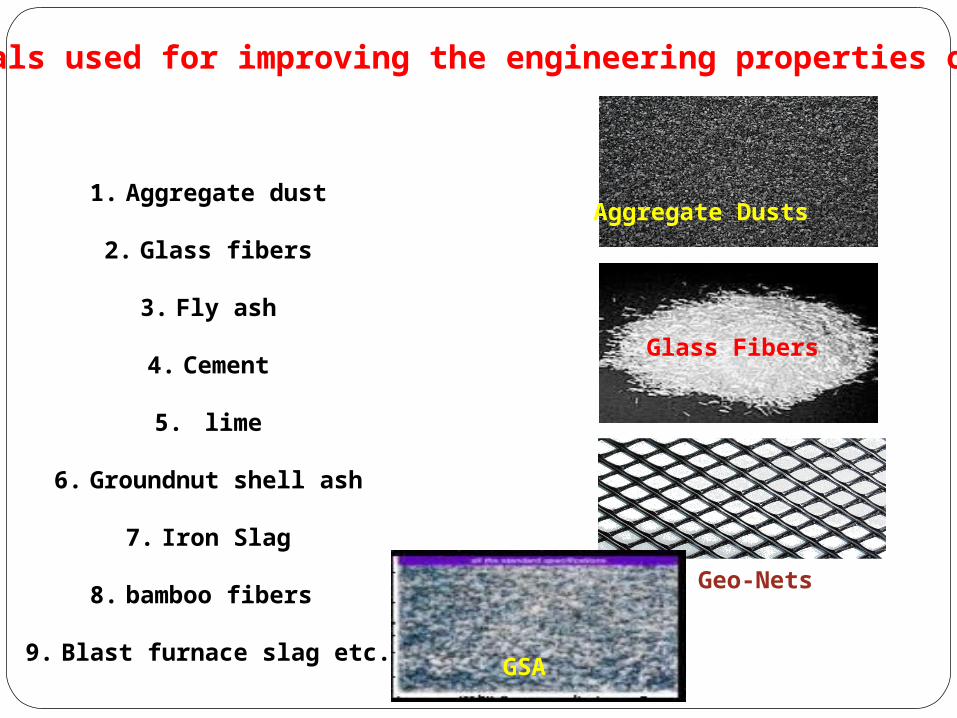
Materials used for improving the engineering properties of soil
1. Aggregate dust
2. Glass fibers
3. Fly ash
4. Cement
5. lime
6. Groundnut shell ash
7. Iron Slag
8. bamboo fibers
9. Blast furnace slag etc. GSA

Less expansive
Increases the maximum dry density
Increases shear strength
Less differential settlement
Stability of slopes.
Withstand earthquake forces(prevent the liquefaction of soil)
Increases CBR value which has great significance in
transportation engineering
Advantages of Reinforced Earth Structure

Main components of reinforced earth
- Fill- Reinforcement - Facings

2. LITERATURE REVIEWWhen construction is carried out in weak foundation soils
following points should be consideredBearing capacity failures.Differential settlements.Large lateral pressures and movement.Slope instability
To avoid such problems, reinforcing of soil is done by using reinforcing material as mention.

Geogrid-Reinforced Retaining Walls
One of the retaining wall construction along highway in the northern area of Brazil with heights ranging from 2m to 8.2 m.
To prevent potential of pore water pressures through foundation, a drainage system with non-woven geotextile strips as a reinforced material was used.
After that the settlements and lateral movements were monitored during the construction up to 90 days after the start of the construction.
Case Study 1.0

Not to scale3.0 m
1.2 m (dia.)
H=2 - 8.2 m
GRPS fill platform
Jet grout columns
Uniaxial geogrids
Traffic loading = 20 kPa
L> 0.7H
9 m Organic siltand clay
(SPT N=0 to 1)
Clayey silt(SPT N>10)
4.50
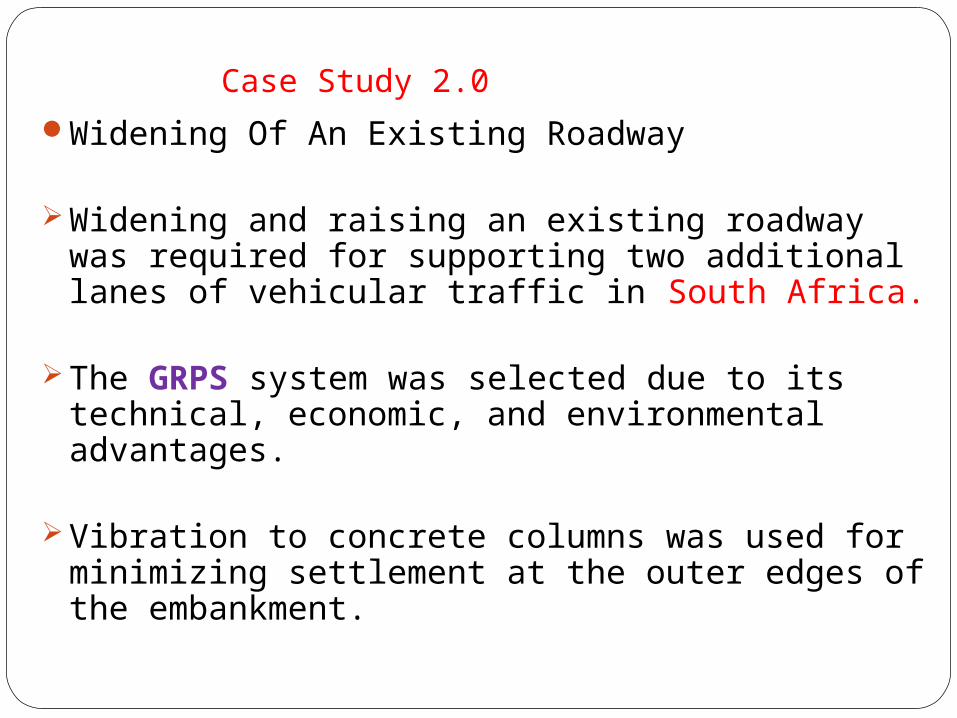
Widening Of An Existing Roadway
Widening and raising an existing roadway was required for supporting two additional lanes of vehicular traffic in South Africa.
The GRPS system was selected due to its technical, economic, and environmental advantages.
Vibration to concrete columns was used for minimizing settlement at the outer edges of the embankment.
Case Study 2.0

Marl
Clayey sand fill
Permanent pavement section
Loose clayey fine sandDense clayey fine sand
Wick drains
Organic siltOrganic silt
Welded wire form slopeTemporary wall
Vibro-concrete columnsVibro-concretecolumns
Lightweight fillExisting roadway
Not to scale
3.0m
5.5m
1.7m
1.8m
Since the completion of this widening roadway in 1997, no problems have been reported.
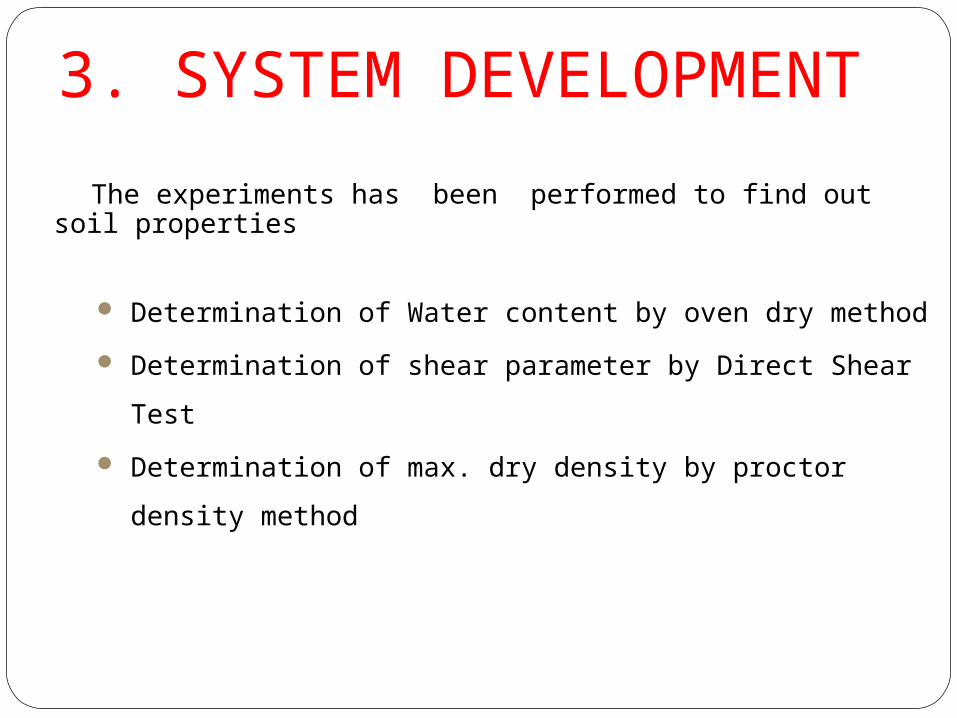
3. SYSTEM DEVELOPMENT The experiments has been performed to find out soil properties
Determination of Water content by oven dry method
Determination of shear parameter by Direct Shear Test
Determination of max. dry density by proctor density
method
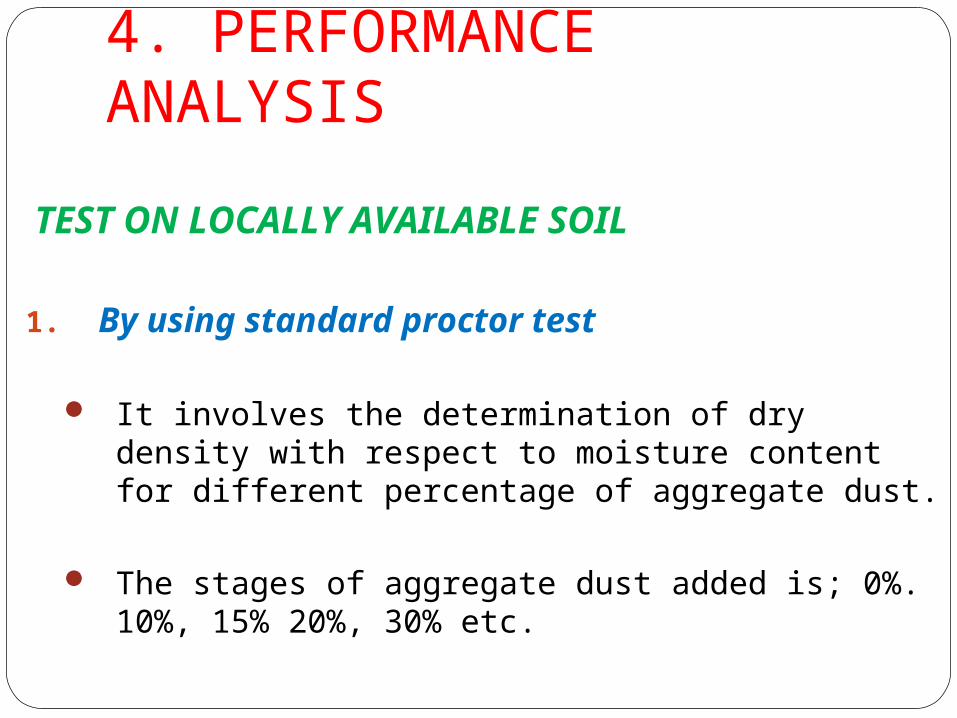
4. PERFORMANCE ANALYSIS
TEST ON LOCALLY AVAILABLE SOIL
1. By using standard proctor test
It involves the determination of dry density with respect to moisture content for different percentage of aggregate dust.
The stages of aggregate dust added is; 0%. 10%, 15% 20%, 30% etc.

One of market survey about Stone crusher in Aurangabad city shows following results;
Total no. aggregate crusher plant arround the Aurangabad city;
- Chauka – 4 no- Paithan road – 2 no- Chikalthana MIDC region – 1 no- Waluj MIDC region – 2 no
Rate of aggregate dust sold – 1200/brassTransportation by means of Trucks, Tractors etcOnwer referance – Tukaram Dhandage (Chauka region)
T.O. Rathod (Kannad region)

PROPERTIES OF MATERIALS
1. Specific gravity of aggregate dust = 2.8
2. Sieve analysis of aggregate dust
A. AGGREGATE DUST
I.S. Sieve no. Mass of soil retained (gm)
% Mass of soil retained
Cumulative % retained
% passing
4.75mm 9 0.9 0.9 99.12.36mm 62 6.2 7.1 92.91.18mm 406 40.6 47.7 52.30.6mm 161 16.1 63.8 36.2
0.425mm 25 2.5 66.3 33.70.300mm 122 12.2 78.5 21.50.150mm 127 12.7 91.2 8.80.075mm 65 6.5 97.7 2.3
pan 23 2.3 100 0.0
•Fineness modulus of aggregate dust=452.7/800 = 0.56
•Coefficient of uniformity= D60 / D10 = 8.125
•Coefficient of curvature= ( D30 )2 / (D10 xD60 ) = 0.84
Hence well graded

MDD VS OMC CURVE OF AGGREGATE DUST
Variation of dry density with %water content for aggregate dust
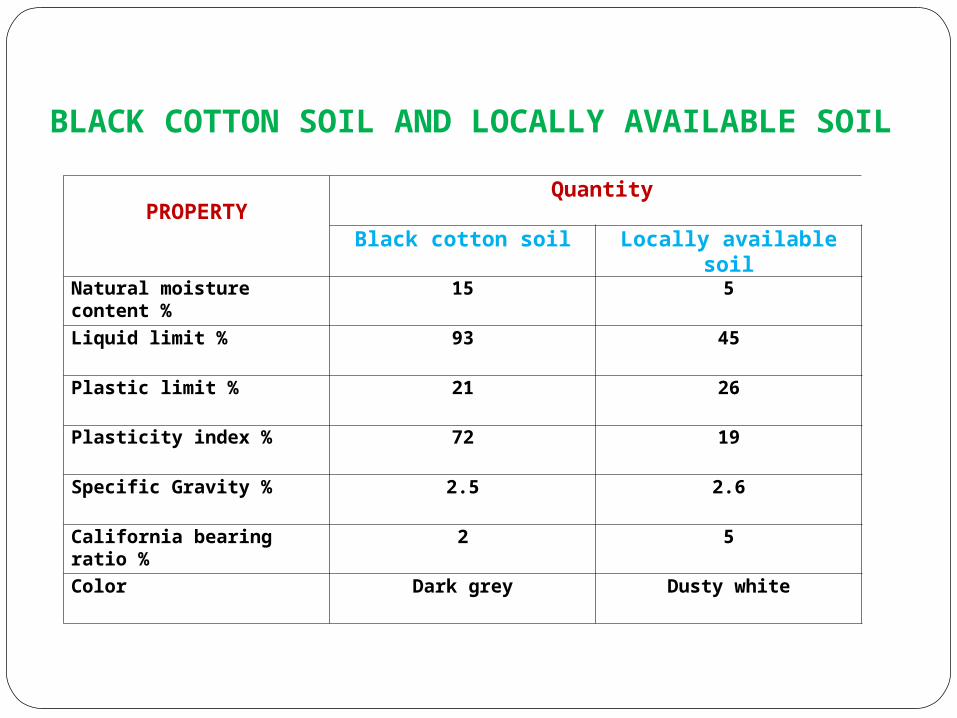
PROPERTY Quantity
Black cotton soil Locally available soil
Natural moisture content % 15 5
Liquid limit % 93 45
Plastic limit % 21 26
Plasticity index % 72 19
Specific Gravity % 2.5 2.6
California bearing ratio % 2 5
Color Dark grey Dusty white
BLACK COTTON SOIL AND LOCALLY AVAILABLE SOIL

TESTS CONDUCTED ON LOCALLY AVAILABLE SOIL
1. STANDARD PROCTOR TEST
2. SHEAR STRENGTH TEST

1.STANDARD PROCTORTEST

The test results show the Maximum dry density of 2000 Kg/m3 to the corresponding Optimum moisture content as 17.20%.
0% AGGREGATE DUST

The graph shows the slightly improvement of MDD 2150 Kg/m3 corresponding to water content as 16.3%.
10% AGRREGATE DUST

The graph shows the MDD of 2200Kg/m3 corresponding to water content as 16.4 %.
15% AGGREGATE DUST
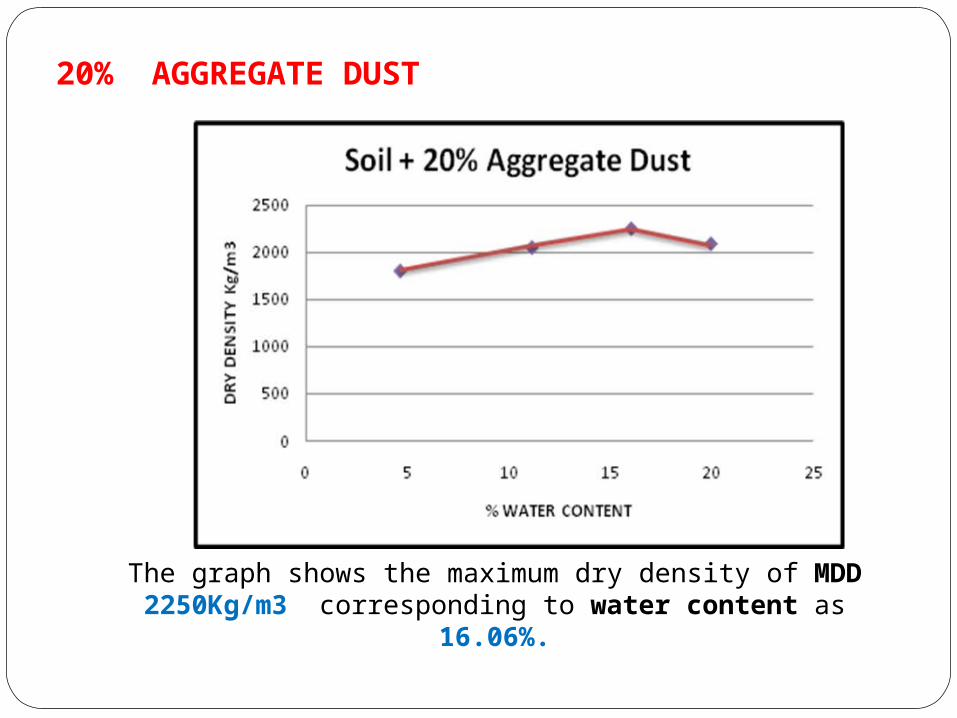
The graph shows the maximum dry density of MDD 2250Kg/m3 corresponding to water content as 16.06%.
20% AGGREGATE DUST

The graph shows the slightly maximum dry density of MDD 2280Kg/m3 corresponding to water content as 15.80%.
30% AGGREGATE DUST

2. SHEAR STRENGTH TEST

0% AGGREGATE DUST

10% AGGREGATE DUST

15% AGGREGATE DUST

20% AGGREGATE DUST
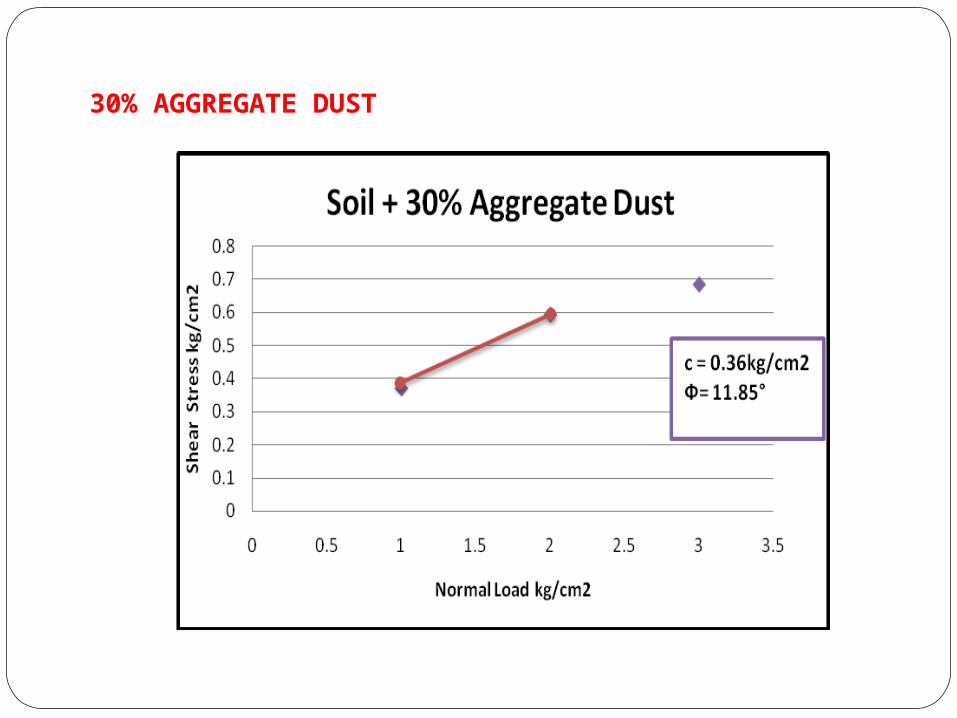
30% AGGREGATE DUST

TESTS CONDUCTED ON BLACK COTTON SOIL
1. STANDARD PROCTOR TEST
2. SHEAR STRENGTH TEST

1. STANDARD PROCTOR TEST

0% Aggregate Dust
The test results show the Maximum dry density as 1890 Kg/m3 to the corresponding Optimum moisture content as 22.10%.

10% Aggregate dust
The test results show the Maximum dry density as 1960 Kg/m3 to the corresponding Optimum moisture content of 22.10%.
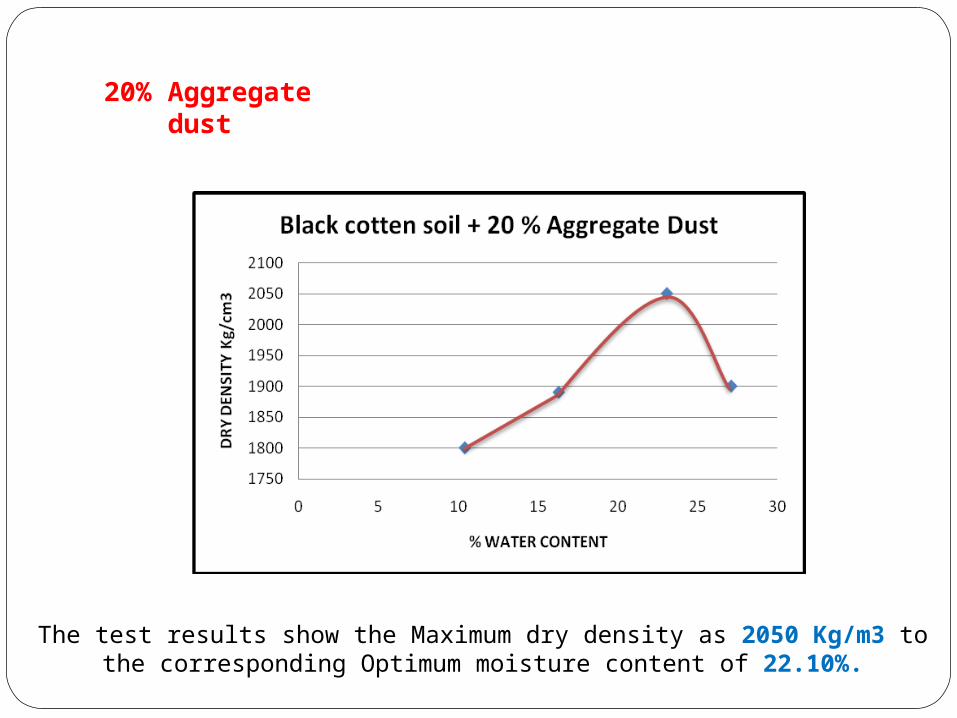
The test results show the Maximum dry density as 2050 Kg/m3 to the corresponding Optimum moisture content of 22.10%.
20% Aggregate dust
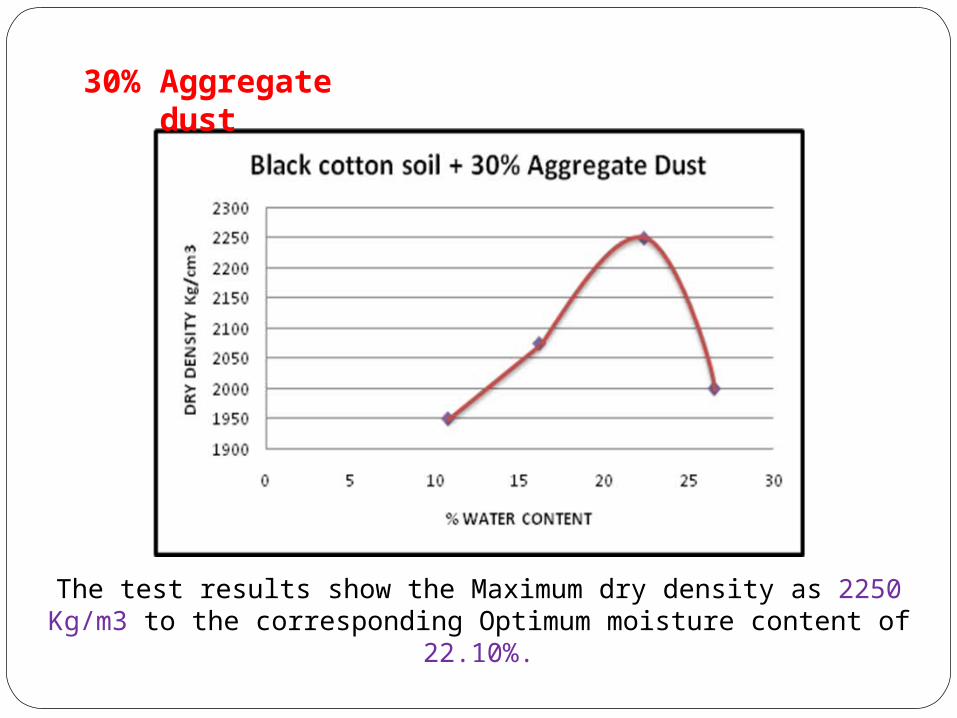
The test results show the Maximum dry density as 2250 Kg/m3 to the corresponding Optimum moisture content of 22.10%.
30% Aggregate dust

2. SHEAR STRENGTH TEST

0% Aggregate Dust

black cotton soil with 10% aggregate dust
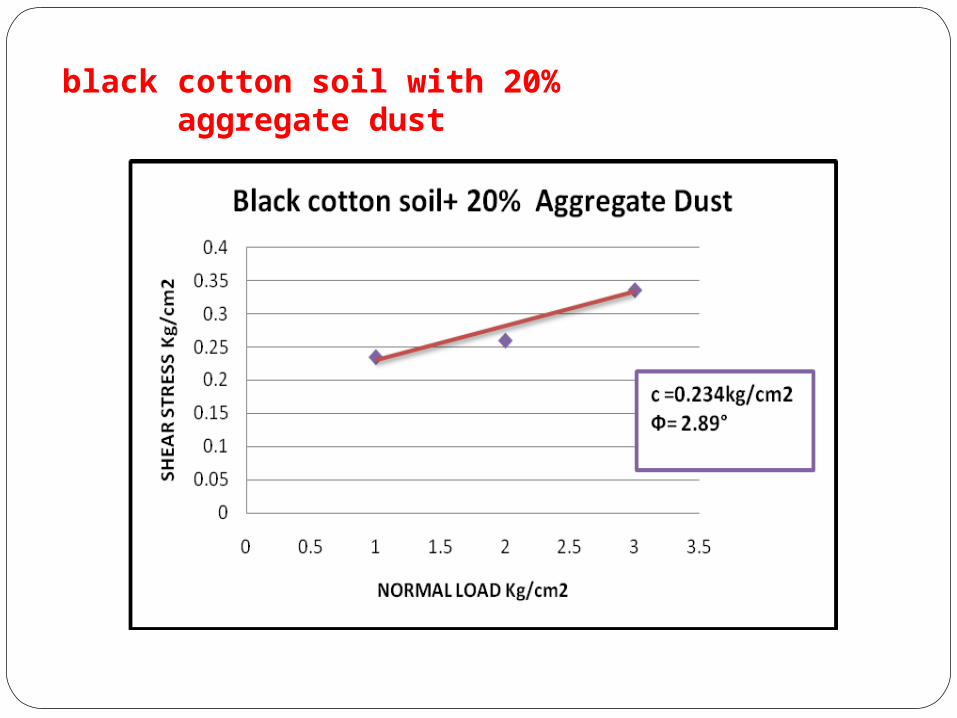
black cotton soil with 20% aggregate dust

Black cotton soil with 30% aggregate dust

RESULT
1. Comparison between MDD and % of aggregate dust for locally available Soil
Sr.No
% Aggregate Dust
OMC Change in OMC (%)
MDD Kg/m3
increase in
MDD (%)
1 0 17.2 - 2000 -
2 10 16.20 -5.8 2150 7.5
3 15 16.36 -4.8 2200 9.09
4 20 16.06 -6.6 2250 12.5
5 30 15.80 -8.1 2280 14.1

Decrement of OMC with the corresponding increment in aggregate dust. - well gradation of soil
2. Comparison between OMC and % of aggregate dust for locally available soil

3. variation of c and Φ with % of aggregate dust for locally available soil
Sr.No
% Aggregat
e Dust
C Increase in C (%)
Φ Increase in Φ (%)
1 0 0.18 - 1.71 -
2 10 0.19 5.55 11.03
545
3 15 0.22 22.22 8.81 450
4 20 0.295
63.88 12.13
1042
5 30 0.36 100 11.81
1010 0
2
4
6
8
10
12
14
0% 10% 15% 20% 30%Percentage aggregate dust added
Variation of C and Φ with % aggregate dust
c * 10Φ

4. Comparison between MDD and % of aggregate dust for black cotton soil
Sr.No
% Aggreg
ate Dust
OMC Changes in OMC (%)
MDD Kg/m3
Changes in
MDD (%)
1 0 22.10 0 1890 0
2 10 23.30 +5.42 1955 3.4
3 20 23.10 +4.52 2050 8.64
4 30 22.35 +1.13 2250 19.0471700
1800
1900
2000
2100
2200
2300
0% 10% 20% 30%
MDD
Aggregate Dust
Variation of MDD with % aggregate dust
MDD(kg/m3)
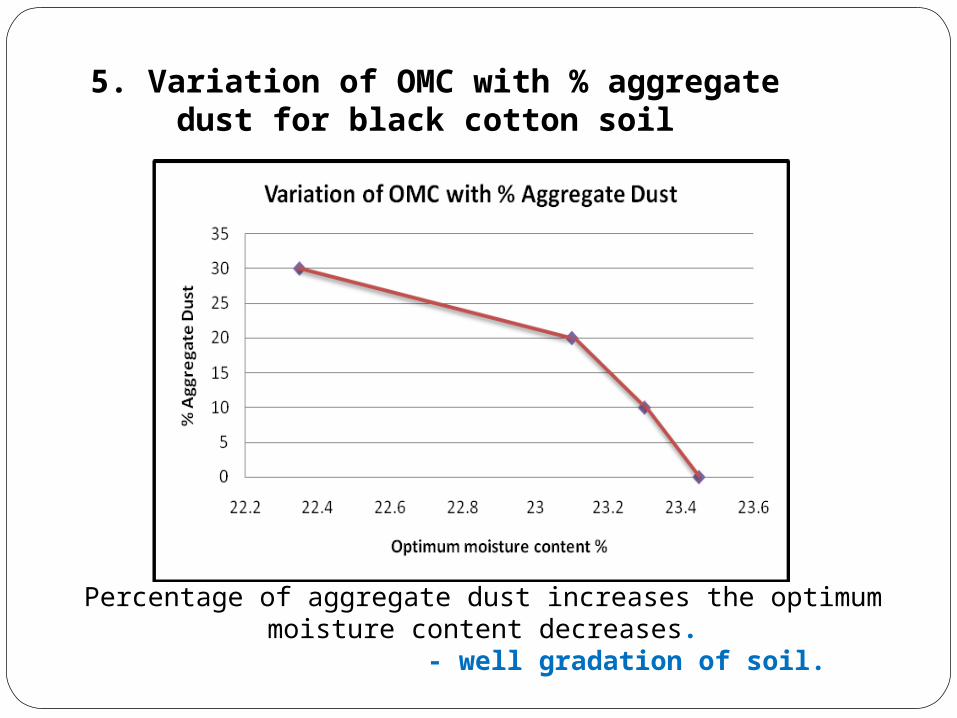
Percentage of aggregate dust increases the optimum moisture content decreases. - well gradation of soil.
5. Variation of OMC with % aggregate dust for black cotton soil

6. variation of c and Φ with % of aggregate dust for black cotton soil
Sr.No
% Aggregate
Dust
C Changes in C (%)
Φ Changes in
Φ (%)
1 0 0.201
- 0.257
-
2 10 0.201
0 2.63 10.2
3 20 0.234
+16.42 2.89 11.24
4 30 0.276
+29.182
5.19 20.19 0
1
2
3
4
5
6
0% 10% 20% 30%Percentage aggregate dust added
Variation of C and Φ with % aggregate dust
c * 10Φ
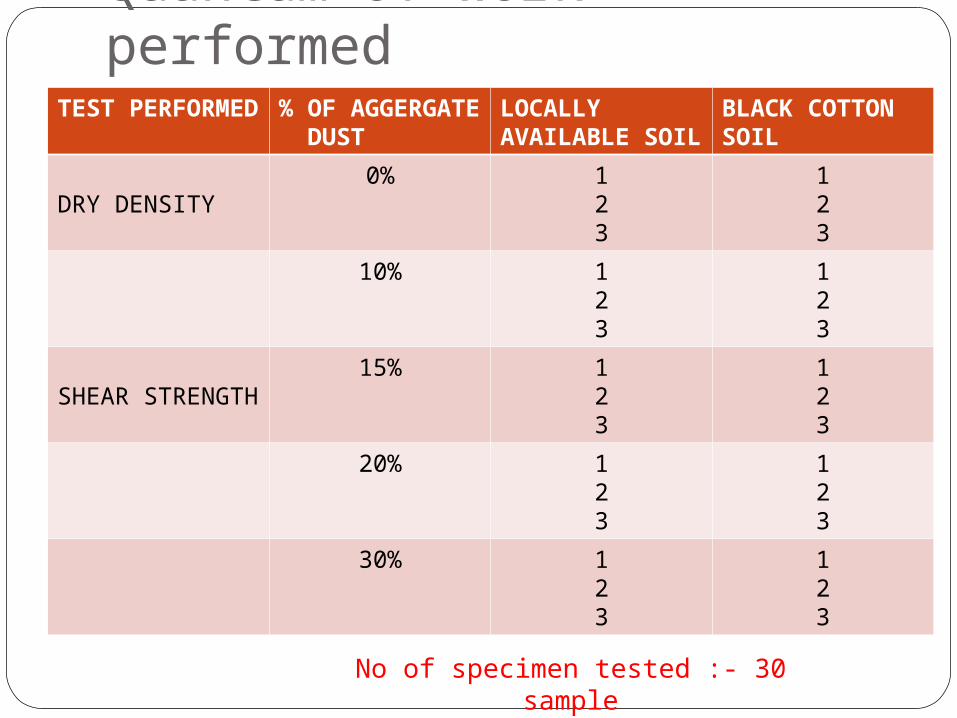
Quantum of work performedTEST PERFORMED
% OF AGGERGATE DUST
LOCALLY AVAILABLE SOIL
BLACK COTTON SOIL
DRY DENSITY0% 1
23
123
10% 123
123
SHEAR STRENGTH
15% 123
123
20% 123
123
30% 123
123
No of specimen tested :- 30 sample

For locally available soil:
There is a huge increment of maximum dry density i.e. 7.5%, 9.09%, 12.5%, and 14% to the corresponding increment aggregate dust of 10%, 15%, 20 %, and 30% respectively.
There is tremendous increment of frictional property of 6.45, 5.15, 7.09 and 6.92 times the initial to the corresponding aggregate dust of, 10%, 15%, 20 %, and 30% respectively.
There is slight improvement in the cohesive property of soil i.e. 5.55%, 22.22%, 63. 88% and 100% to the corresponding aggregate dust of 10%, 15%, and 20 % 30% respectively
CONCLUSION

For black cotton soil:
The increment of maximum dry density of 3.5%, 8.46% and 19.04% is recorded with the corresponding increment in aggregate dust of 10%, 20% and 30% respectively.
There is considerable increment of frictional property (Φ) i.e. 10.2, 11.2 and20.19 times to the corresponding aggregate dust of 10%, 20 % and 30% respectively.
There is slight improvement in the cohesive property (C) of soil i.e. 0%, 16.42%, and 29.18% to the corresponding aggregate dust of 10%, 20 % and 30% respectively

All above conclusions will overcome the socio-economic constraints with economy.
This field is new area of research and further development for geotechnical engineers.

Dr. B. C. Punmia, Ashok Kumar Jain, Arun Kumar Jain ,”Soil Mechanics & Foundations” (16 Edt.), Laxmi Publication Ltd, 2005
Shashi K. Gulhati, Manoj Datta ,”Geotechnical Engineering” Tecmax Publication, 2006,
Indian Standard codes & Publication Series IS-2720 (Part 1-30), SP 20
BS 1377, method of testing soil for civil engineering purpose, British standard Institute London
I Murugan & C Natarajan, ”Reinforcing traditional Indian construction with morden construction technique” Indian Journal of traditional knowledge, Vol. 8(4) Oct.2009, page
ASTM (1992) Annual book of ASTM standards
REFERENCES