Soil Properties' Response to Wheat and Corn Stubble ...
56
Louisiana State University LSU Digital Commons LSU Master's eses Graduate School 2017 Soil Properties' Response to Wheat and Corn Stubble Residue Management in Louisiana Autumn Danielle Acree Louisiana State University and Agricultural and Mechanical College, [email protected] Follow this and additional works at: hps://digitalcommons.lsu.edu/gradschool_theses Part of the Plant Sciences Commons is esis is brought to you for free and open access by the Graduate School at LSU Digital Commons. It has been accepted for inclusion in LSU Master's eses by an authorized graduate school editor of LSU Digital Commons. For more information, please contact [email protected]. Recommended Citation Acree, Autumn Danielle, "Soil Properties' Response to Wheat and Corn Stubble Residue Management in Louisiana" (2017). LSU Master's eses. 4517. hps://digitalcommons.lsu.edu/gradschool_theses/4517
Transcript of Soil Properties' Response to Wheat and Corn Stubble ...

Louisiana State UniversityLSU Digital Commons
LSU Master's Theses Graduate School
2017
Soil Properties' Response to Wheat and CornStubble Residue Management in LouisianaAutumn Danielle AcreeLouisiana State University and Agricultural and Mechanical College, [email protected]
Follow this and additional works at: https://digitalcommons.lsu.edu/gradschool_theses
Part of the Plant Sciences Commons
This Thesis is brought to you for free and open access by the Graduate School at LSU Digital Commons. It has been accepted for inclusion in LSUMaster's Theses by an authorized graduate school editor of LSU Digital Commons. For more information, please contact [email protected].
Recommended CitationAcree, Autumn Danielle, "Soil Properties' Response to Wheat and Corn Stubble Residue Management in Louisiana" (2017). LSUMaster's Theses. 4517.https://digitalcommons.lsu.edu/gradschool_theses/4517
SOIL PROPERTIES’ RESPONSE TO WHEAT AND CORN STUBBLE RESIDUE MANAGEMENT IN LOUISIANA
A Thesis
Submitted to the Graduate Faculty of the Louisiana State University and
Agricultural and Mechanical College in partial fulfillment of the
requirements for the degree of Master of Science
in
The School of Plant, Environmental, and Soil Sciences
by
Autumn Danielle Acree B.S., Louisiana State University, 2015
August 2017

ii
Acknowledgements
I would like to express my sincere gratitude to my advisor Dr. Lisa Fultz for
the continuous support of my master’s study and research, for her patience,
motivation, enthusiasm, and immense knowledge. Her guidance helped me in my
research and writing. I could not have imagined having a better advisor and
mentor for my master’s study.
I would also like to thank the rest of my thesis committee: Dr. Brenda
Tubana and Dr. Jim Wang for their encouragement and insightful comments. I
know I can always count on your doors being open whenever I need anything,
and I am very grateful for that.
My sincere thanks to Drs. Josh Lofton and Beatrix Haggard for providing
the opportunity for me to pursue a master’s degree at Louisiana State University.
You have been involved in this project since day one, and I appreciate all of your
support.
To the research associates and student workers at the Macon Ridge
Research Station in Winnsboro, LA, thank you for the assistance with planting,
burning, and collecting samples in the field.
To my fellow lab mates, thank you for all your hard work in the lab and the
field. It was a pleasure forming friendships with you that I will cherish forever.
Last but not least, I would like to thank my family for the unconditional love
and support. You have always been my biggest fans and encouraged me to
follow my dreams whatever they may be.

iii
Table of Contents Acknowledgements .................................................................................................. ii List of Tables ........................................................................................................... iv List of Figures ........................................................................................................... v Abstract ................................................................................................................... vii Chapter 1. Introduction ............................................................................................ 1 Chapter 2. Soil Properties' Response to Wheat Stubble and Corn Stubble Residue Management in Louisiana ...................................................................... 11 Chapter 3. Conclusions ......................................................................................... 46 Vita ......................................................................................................................... 47

iv
List of Tables Table 1.1 Crop residue nutrient content. ................................................................ 3 Table 2.1. ANOVA p-values for soil organic matter in wheat stubble residue as affected by treatment, sampling time, year, and their interactions. ..................... 21 Table 2.2. ANOVA p-values for soil organic matter in corn stubble residue as affected by treatment, sampling time, and their interactions. .............................. 23 Table 2.3. ANOVA p-values for nitrate-N in wheat stubble residue as affected by treatment, sampling time, year, and their interactions. ........................................ 24 Table 2.4. ANOVA p-values for ammonium-N in wheat stubble residue as affected by treatment, sampling time, year, and their interactions. ..................... 26 Table 2.5. ANOVA p-values for inorganic N (nitrate-N and ammonium-N) in corn stubble residue as affected by treatment, sampling time, and their interactions. 28 Table 2.6. ANOVA p-values for in β-glucosidase activity in wheat stubble residue as affected by treatment, sampling time, year, and their interactions. ................ 29 Table 2.7. ANOVA p-values for in β-glucosidase activity in corn stubble residue as affected by treatment, sampling time, and their interactions........................... 31 Table 2.8. ANOVA p-values for in N-acetyl-β-D-glucosaminidase activity in wheat stubble residue as affected by treatment, sampling time, year, and their interactions. ........................................................................................................... 33 Table 2.9. ANOVA p-values for in N-acetyl-β-D-glucosaminidase activity in corn stubble residue as affected by treatment, sampling time, and their interactions. 34 Table 2.10. Total abundance of FAMEs in corn stubble residue as affected by time. ....................................................................................................................... 37

v
List of Figures Fig. 2.1. Soil organic matter concentration in samples from prescribed fire, no-till, and conventionally tilled treatments pre- (0 hrs) and up to 4320 hrs (6 months) post-management of wheat residue…………………………………………………21 Fig. 2.2. Soil organic matter concentration in samples collected year 2014 and 2015 from prescribed fire, no-till, and conventionally tilled treatments pre- (0 hrs) and up to 4320 hrs (6 months) post-management of wheat residue…………….22 Fig. 2.3. Soil organic matter concentration in samples from prescribed fire, no-till, and conventionally tilled treatments pre- (0 hrs) and up to 4320 hrs (6 months) post-management of corn residue………………………………………...…….…..23 Fig. 2.4. Nitrate-N (NO3
--N) concentration in samples averaged over time from pre- (0 hrs) to 4320 hrs (6 months) post-management in prescribed fire, no-till, and conventionally tilled treatments in wheat residue…………………………..…24 Fig. 2.5. Nitrate-N (NO3
--N) concentration in samples averaged over time from pre- (0 hrs) to 4320 hrs (6 months) post-management and across prescribed fire, no-till, and conventionally tilled treatments in wheat residue……………..…..…..25 Fig. 2.6. Ammonium-N (NH4
+-N) concentration in samples from prescribed fire, no-till, and conventionally tilled treatments pre- (0 hrs) and up to 4320 hrs (6 months) post-management of wheat residue……………….………………………26 Fig. 2.7. Ammonium-N (NH4
+-N) concentration in samples collected year 2014 and 2015 from prescribed fire, no-till, and conventionally tilled treatments pre- (0 hrs) and up to 4320 hrs (6 months) post-management of wheat residue……….27 Fig. 2.8. Nitrate-N (NO3
- -N) concentration in samples averaged over treatments of prescribed fire, no-till, and tilled management practices at pre- (0 hrs) and up to 4320 hrs (6 months) post-management of corn residue……………….……….28 Fig. 2.9. Ammonium-N (NH4
+-N) concentration in samples from prescribed fire, no-till, and conventionally tilled treatments pre- (0 hrs) and up to 4320 hrs (6 months) post-management of corn residue………………………………………...29 Fig. 2.10. β-glucosidase activity in samples averaged over time from pre- (0 hrs) to 4320 hrs (6 months) post-management in prescribed fire, no-till, and conventionally tilled treatments in wheat residue……………………………..…...30 Fig. 2.11. β-glucosidase activity concentration in samples averaged over treatments of prescribed fire, no-till, and tilled management practices at pre- (0 hrs) and up to 4320 hrs (6 months) post-management of wheat residue…….…30

vi
Fig. 2.12. β-glucosidase activity in samples from prescribed fire, no-till, and conventionally tilled treatments pre- (0 hrs) and up to 4320 hrs (6 months) post-management of corn residue…………………………………………………...…….32 Fig. 2.13. N-acetyl-β-D-glucosaminidase (NAGase) activity in from prescribed fire, no-till, and conventionally tilled treatments pre- (0 hrs) and up to 4320 hrs (6 months) post-management of wheat residue………………………………..……..33 Fig. 2.14. N-acetyl-β-D-glucosaminidase (NAGase) activity in samples collected year 2014 and 2015 from prescribed fire, no-till, and conventionally tilled treatments pre- (0 hrs) and up to 4320 hrs (6 months) post-management of wheat residue…………………………………………………………………….…….34 Fig. 2.15. N-acetyl-β-D-glucosaminidase (NAGase) activity in samples averaged over treatments of prescribed fire, no-till, and tilled management practices at pre- (0 hrs) and up to 4320 hrs (6 months) post-management of corn residue…..….34 Fig. 2.16. Distance based redundancy analysis (db RDA) plot derived from fatty acid profiles from samples collected in 2014 wheat stubble residue under tilled (green triangles), no-till (red circles), and prescribed fire treatments (black circles)…………………………………………………………………………….…….35 Fig. 2.17. Distance based redundancy analysis (db RDA) plot derived from fatty acid profiles from samples collected in 2014 wheat stubble residue from tilled, no-till, and prescribed fire treatments at pre- (0 hrs) and up to 720 hrs (30 days) post-management………………………………………………………………..……36 Fig. 2.18. Distance based redundancy analysis (db RDA) plot derived from fatty acid profiles from samples collected in corn stubble residue from no-till treatment at pre- (0 hrs) and up to 720 hrs (30 days) post-management………………..….38 Fig. 2.19. Distance based redundancy analysis (db RDA) plot derived from fatty acid profiles from samples collected in corn stubble residue from tilled treatment at pre- (0 hrs) and up to 720 hrs (30 days) post-management…………..……….39 Fig. 2.20. Distance based redundancy analysis (db RDA) plot derived from fatty acid profiles from samples collected in corn stubble residue from prescribed fire treatment at pre- (0 hrs) and up to 720 hrs (30 days) post-management…….....40

vii
Abstract
Crop residue plays an important role in improving soil fertility. Crop
residue affects soil biological and chemical properties by increasing soil organic
matter, nutrient status and availability, and microbial activity. The degree of the
effects of crop residue on soil fertility depends on the crop residue management
practice. Samples were collected in 2014 in wheat (Triticum spp.) stubble and
corn (Zea mays) stubble residue. A second soil sample collection under wheat
stubble residue was taken in 2015 in the prescribed fire and no-till sections. A
total of 342 soil samples (0-2.5cm) were collected across conventional tillage, no-
till, and prescribed fire treatments of wheat stubble and corn stubble residue
located on the Macon Ridge Research Station in Winnsboro, LA. Samples were
collected pre-management (0 hr) and at 1, 24, 168, 720, and 4320 hr intervals
post-management and analyzed for soil chemical (macronutrients and soil
organic matter) and biological (microbial community structure and enzyme
activities) properties. In 2015, additional samples were taken in wheat stubble
residue 6 hrs and 168 hrs (1 week) post-management. Additional samples were
collected in corn stubble residue 6 hrs post-management. Prescribed fire
increased NO3--N relative to no-till and conventional tillage in wheat stubble.
Prescribed fire increased β-glucosidase activity relative to conventional tillage but
was similar to β-glucosidase activity observed in no-till. Short term changes in
organic matter, nutrients, and enzyme activity were observed in prescribed fire,
no-till, and conventional tillage. Shifts in microbial communities were observed in
wheat stubble residue with Gram negative, total bacteria, and actinomycetes

viii
dominating the prescribed fire soil and abundance of arbuscular mycorrhizal
fungi, saprophytic fungi, and fungi:bacteria dominated no-till and conventional
tillage soil. The effects of management practices on microbial community
structure was unable to be determined in corn stubble residue based on the fatty
acid profiles tested in this study. While prescribed fire increased NO3--N and β-
glucosidase activity, similarities between management were observed in NH4+-N,
soil organic matter, and N-acetyl-β-D-glucosaminidase activity. Therefore, further
research needs to be done in order to determine the most efficient crop residue
management practice to optimize soil fertility.

1
Chapter 1. Introduction
1.1 Crop Residue in Agriculture
Crop residues are materials left in an agricultural field after the crop has
been harvested including stalks and stubble, leaves and seed pods. Crop residue
plays an important role in maintaining soil fertility by improving soil chemical,
biological, and physical properties (Singh and Rengel, 2007). Crop residue
effects soil physical properties by decreasing the risk of soil erosion, improving
soil water holding capacity, and conserving soil moisture and temperature. Soil
chemical properties affected by crop residue includes nutrient status and
availability, soil pH, and soil organic matter.
Crop residues sustain and increase soil organic matter by slowly
decomposing, building up organic matter in the 0-7.5 cm soil depth. The increase
in soil organic matter leads to an increase in meso and macrofauna populations
and activities, microbial diversity, and C and nutrients in microbial biomass
(García-Orenes et al., 2003). Soil organisms are important for soil fertility and
perform vital functions in the soil. Soil microorganisms enhance soil fertility due to
their involvement in the cycling of nutrients like C and N by decomposing the
organic matter entering the soil (Gougoulias et al., 2014). The mineralization and
immobilization from the microbial activity contributes to an increase in nutrient
status and availability. Certain soil microorganisms such as mycorrhizal fungi can
also increase the availability of mineral nutrients to plants (Marschner and Dell,
1994). Different microbial groups produce different soil enzymes which are
involved in C cycling in soil. Therefore, shifts in the microbial community

2
composition have important implications for soil fertility. β-glucosidase, for
example, is important for decomposition of the labile fraction of plant tissue
(Madejon et al., 2003). N-acetyl-β-D-glucosaminidase catalyzes the hydrolysis of
chitin (Ekenler and Tabatabai, 2004).
Crop residue plays an important role in soil C and N storage. Crop residue
is the main source of soil C in agricultural systems (Schmatz et al, 2017) and
contains nutrients that affect the dynamics of soil C and N in the soil. Crop
residue contains all mineral nutrients; however, the amount of nutrients depends
on the type of crop (Singh and Rengel, 2007; Table 1.1). In Louisiana, wheat and
corn stubble are commonly used as crop residues. Wheat and corn stubble
residue have high C:N ratios (<24:1) increasing the resistance to microbial
decomposition (USDA NRCS 1977). Wheat stubble is less dense than corn
stubble; therefore, wheat has a higher surface area and has the potential to
break down at a faster rate than corn. The amount of nutrients in the crop residue
control the rate of decomposition and formation of microbial biomass (de Bruijn
and Butterbach-Bahl 2010). However, it is difficult to determine the amount of
nutrients that crop residue releases into the soil at a given time due to complex
processes controlling residue decomposition and nutrient release (Singh and
Rengel, 2007). The effects of crop residue on the soil’s physical, biological, and
chemical properties depends on the crop residue management practice, such as
prescribed fire, tillage, or no-till. Therefore, determining the best crop residue
management practice is essential to soil fertility.

3
Table 1.1 Crop residue nutrient content.
1.2 Prescribed Fire Management Practice
Prescribed fire is an intentional application of fire, set under controlled
conditions to achieve specific objectives (Merrill and Alexander, 1987).
Prescribed fire controls excess crop residue providing an ease of tillage to obtain
an efficient seedbed for planting and decreases incidence of disease where crop
residues can be a host for pathogens (Singh and Rengel, 2007).
Fire influences soil chemical (macronutrients and soil organic matter) and
biological (microbial community structure and enzyme activities) processes
(Singh and Rengel, 2007). The effects are a result of burn severity, which
consists of peak temperatures and duration of the fire. Low (up to 250oC) to
moderate (250oC- 500oC) severity fires, such as most of those prescribed in
forest management promotes renovation of the dominant vegetation through
elimination of undesired species and transient increase of pH and available
nutrients. No irreversible ecosystem change occurs, but the enhancement of
hydrophobicity can render the soil less able to soak up water and more prone to
erosion. Severe (500oC and up) fires, such as wildfires, can cause negative
effects on soil such as significant removal of organic matter, deterioration of both
structure and porosity, considerable loss of nutrients through volatilization, ash
entrapment in smoke columns, leaching and erosion, and marked alteration of
Crop Residue
N P2O5 K2O S
Wheat 5 1.5 15.5 1
Corn 5.5 2 11 0.51 Based on Table from Gelderman et al., 2011
Nutrient Content1 (kg tonne
-1)

4
both quantity and specific composition of microbial and soil-dwelling invertebrate
communities (Certini, 2005).
Prescribed fire has been found to increase pH of soil. Following a
Mediterranean forest fire, the incorporation of ash into the soil and the complete
oxidation of the soil organic matter increased pH of the soil (Alcaniz et al, 2016). .
Available phosphorous (P) also increased after a prescribed fire event due to the
combustion of vegetation, the incorporation of ash into the soil and the
mineralization of organic P. Total nitrogen (N), calcium (Ca2+) and magnesium
(Mg2+) levels increased post-fire due to the high volatilization temperatures of
these nutrients, the formation of ash from the combustion of organic matter and
its incorporation into the soil (Alcaniz et al, 2016). In Spartina patens-dominated
tidal marshes, fire caused organic matter decomposition, which released plant
nutrients, thereby stimulating increased biomass production, leading to a net
organic matter increase (Cahoon et al, 2004). In natural grasslands in southern
India, burning stimulated soil enzyme activities in the surface layer due to the
increase in the population of soil microorganisms, brought about by the relative
increase in nutrients and organic matter observed in the burned area together
with favorable moisture and temperature, following grass fire in natural
grasslands in southern India (Senthilkumar et al, 1997).
Soil heating alters soil organic matter and increases nutrient availability,
therefore affecting subsequent microbial growth. In a China wetland, prescribed
fire increased microbial metabolism in the post-burned soil through influencing
soil microbial composition and activity. Fire increased carbon (C) mineralization

5
rates due to increased organic C and N contents in the burned soils in the China
wetland and improved quality of substrate for microbial growth and possibly
increased labile compounds, which all stimulates microbial growth (Zhoa et al.,
2012). In a coniferous forest, fire affects nutrient availability by modifying
microbial community structure due to the heating of the soil (Perry et al, 1984).
Increases in soil temperature from fire contributes to increases in soil inorganic N
pools through increased microbial activity and N mineralization rates in
grasslands (Augustine et al 2014).
1.3 No-Till vs. Conventionally Tilled Management Practices
No-till is a conservation practice that leaves the crop residue undisturbed
from harvest through planting (Singh and Rengel, 2007). No-till protects against
erosion and controls soil moisture due to the vegetative cover remaining on the
surface. Soil stays cooler until a little later in the spring and summer because of
the insulating layer of crop residue. (Carefoot et al., 1990; Cox et al., 1990). In
Alberta, soil temperature was lower in the spring up to a 10 cm depth in no-till
than conventional tillage (Nyborg and Malhi, 1989; Malhi and O’Sullivan, 1990).
Organic matter decomposition rate is reduced in cooler soils; therefore, the
nutrients in the crop residue is released slowly (Carefoot et al., 1990). The slow
release of nutrients in crop residue in cooler soils reduces the amount of
nutrients readily available to the crop.
Tillage incorporates crop residue into the soil, which leaves the soil
surface bare and without cover protection leaving the soil vulnerable to wind and
water erosion. One advantage of conventional tillage is that the needed

6
machinery is widely available and the techniques are well-known. Soils that are
tilled typically warm faster in the spring than those with less tillage; therefore,
organic matter decomposes rapidly releasing nutrients that are readily available
for the crop (Nyborg and Malhi, 1989; Malhi and O’Sullivan, 1990). Conventional
tillage can increase porosity and loosen soil, allowing for good air exchange and
root growth, but tillage also destroys soil structure (Busari et al., 2015).
No-till has enhanced soil qualities relative to tillage management. Since
no-till practices leave crop residue on the surface, soil chemical and biological
processes are influenced at the upper depth (0-7.5 cm) of the soil. Leaving crop
residues on the soil surface protects soils from wind and water erosion by
buffering the soil against forces of raindrop impact and wind shear (Lal 2005;
Unger and McCalla 1980). Leaving crop residues on the soil surface reduces
water evaporation in the top few inches of the soil conserving soil moisture.
Tillage has been found to have lower soil organic matter content than no-till soils.
The accumulation of crop residue in no-till soils results in a higher amount of
organic matter. When there is an enrichment in soil organic matter, there is an
increase abundance of microorganisms, such as of fungi, bacteria, arbuscular
mycorrhizal fungi, and actinobacteria (Reji et al., 2012). The changes in microbial
communities could be due to favorable environmental conditions in no-till soils,
such as high organic matter and nutrients which also increases enzymatic activity
(Melero et al., 2011; Acosta-Martínez et al., 2008; Alvear et al., 2005).
Conventional tillage systems had a lower amount of soil organic C and total N
than no-till practices in a continuous corn system on a Decatur silt loam soil (Reji

7
et al., 2012). No-till practices increased total C and N relative to conventionally
tilled practices in a continuous corn, corn-soybean, and corn-soybean-wheat-
Cowpea systems (Aziz et al., 2013). Total C also kept decreasing over time in
the tilled soil. Tillage has lower inorganic N than no-till soils (Busari et al., 2015).
Tillage increases leaching rate due to soil structure deterioration, which could
explain the lower inorganic N content.
Since crop residue management practices have different impacts on soil,
determining the best management practice is important to maximize crop
residue’s effectiveness on soil fertility. The objective of this study was to
determine the impacts of prescribed fire, no-till, and conventional tillage on soil
chemical and biological properties in wheat stubble residue and corn stubble
residue. We hypothesized that prescribed fire will increase inorganic N
concentration, soil enzyme activity, and soil organic matter relative to no-till and
tilled management enhancing soil fertility in wheat and corn stubble residue.
1.4 References Acosta-Martínez, V., D. Acosta-Mercado, D. Sotomayor-Ramírez, and L. Cruz-
Rodríguez. 2008. “Microbial communities and enzymatic activities under different management in semiarid soils”. Appl. Soil Ecol. 38 249:260.
Alcañiz, M., L. Outeiro, M. Francos, J. Farguell, and X. Úbeda. 2016. "Long-term
Dynamics of Soil Chemical Properties after a Prescribed Fire in a Mediterranean Forest (Montgrí Massif, Catalonia, Spain)." Science of The Total Environment. doi:10.1016/j.scitotenv..01.115.
Alvear, M., A. Rosas, J. Rouanet, and F. Borie. 2005. “Effects of three soil tillage
systems on some biological activities in an Ultisol from southern Chile.” Soil Tillage Res. 82 195:202.

8
Augustine, D. J., P. Brewer, D. M. Blumenthal, J. D. Derner, and J. C. Von Fischer. 2014. "Prescribed Fire, Soil Inorganic Nitrogen Dynamics, and Plant Responses in a Semiarid Grassland." Journal of Arid Environments 104: 59-66. doi:10.1016/j.jaridenv.2014.01.022.
Aziz, I., T. Mahmood, and K.R. Islam. 2013. "Effect of long term no-till and
conventional tillage practices on soil quality." Soil & Tillage Research 131, 28-35. Science Citation Index, EBSCOhost (accessed May 29, 2017).
Busari, M. A., S. S. Kukal, A. Kaur, R. Bhatt, and A. A. Dulazi. 2015.
"Conservation tillage impacts on soil, crop and the environment." International Soil and Water Conservation Research 3, 119-129. ScienceDirect, EBSCOhost (accessed April 26, 2017).
Carefoot, J.M., Nyborg, M., Lindwall, C.W. 1990. “Tillage-induced soil changes
and related grain yield in a semi-arid region.” Can. J. Soil Sci. 70, 203–214.
Cahoon, D.R., M.A. Ford, and P.F. Hensel. 2004. “Ecogeomorphology of
Spartina patens-dominated tidal marshes: Soil organic matter accumulation, marsh elevation dynamics, and disturbance.” Coastal and Estuarine Studies 59:247–266. doi:10.1029/CE059p0247
Certini, G. 2005. "Effects of Fire on Properties of Forest Soils: A Review."
Oecologia, 2005. Cox, W.J., Zobel, R.W., van Es, H.M., Otis, D.J. 1990. “Tillage effects on some
soil physical and corn physiological characteristics.” Agron. J. 82, 806–812.
de Bruijn, A.M.G., and Butterbach-Bahl K. 2010. “Linking carbon and nitrogen
mineralization with microbial responses to substrate availability—the DECONIT model.” Plant Soil 328:271–290. doi:10.1007/s11104-009-0108-9
Ekenler, M. and Tabatabai, M.A., 2004. “β-glucosaminidase activity as an index
of nitrogen mineralization in soils.” Commun. Soil Sci. Plant Anal. 35, 1081–1094.
García-Orenes, F., A Morugán-Coronado., R. Zornoza, A. Cerdà, and K. Scow.
2013. “Changes in Soil Microbial Community Structure Influenced by Agricultural Management Practices in a Mediterranean Agro-Ecosystem.” PLoS ONE 8(11): e80522. doi:10.1371/journal.pone.0080522

9
Gelderman, R., R. Beck, R. Fanning, and L. Wagner. 2011. "The Value of Crop Residue." iGrow South Dakota State University Extension. Accessed June 22, 2017.
Gougoulias C., Clark, J.M., and Shaw, L.J. 2014. “The role of soil microbes in the
global carbon cycle: tracking the below-ground microbial processing of plant-derived carbon for manipulating carbon dynamics in agricultural systems.” J Sci Food Agric. 94: 2362–2371. doi: 10.1002/jsfa.6577
Lal R. 2005. “World crop residues production and implications of its use as a
biofuel.” Environ Int 31:575–584. Madejon, E., P. Burgos, R. Lopez, and F. Cabrera. 2003. “Agricultural use of
three organic residues: effect on orange production and on properties of a soil of the ‘Comarca Costa de Huelva’(SW Spain).” Nutr. Cycl. Agroecosyst. 65 281:288.
Malhi, S.S. and O’Sullivan, P.A. 1990. “Soil temperature, moisture and
compaction under zero and conventional tillage in central Alberta.” Soil Till. Res. 17, 167–172.
Marschner, H. & Dell, B. 1994. “Nutrient uptake in mycorrhizal symbiosis.” Plant
and Soil. 159: 89. doi:10.1007/BF00000098 Melero, S., R.J. Lopez-Bellido, L. Lopez-Bellido, V. Munoz-Romero, F. Moreno,
J.M. Murill. 2011. “Long-term effect of tillage, rotation and nitrogen fertiliser on soil quality in a Mediterranean Vertisol.” Soil Tillage Res. 114 97:107.
Merrill, D.F. and M.E. Alexander. 1987. “Glossary of forest fire management
terms.” Fourth ed. National Research Council of Canada, Canadian Committee on Forest Fire Management, Ottawa, Ontario. Publ. NRCC No. 26516.
Nyborg, M., Malhi, S.S., 1989. “Effect of zero and conventional tillage on barley
yield and NO3-N content, moisture and temperature of soil in north-central Alberta.” Soil Till. Res. 15, 1–9
Perry D.A., Rose S., Pilz D., Schoenberger M.M.. 1984. “Reduction of natural
ferric iron chelators in disturbed forest soils.” Soil Sci Soc Am J 48:379–382.

10
Reji P., Mathew, F. Y., Githinji L., Ankumah R., and Balkcom K. S. 2012. "Impact of No-Tillage and Conventional Tillage Systems on Soil Microbial Communities." Applied And Environmental Soil Science, Vol 2012 Directory of Open Access Journals, EBSCOhost (accessed May 29, 2017).
Schmatz, R., S. Recous, C. Aita, M. Tahir, A. Schu, B. Chaves, and S.
Giacomini. 2017. "Crop residue quality and soil type influence the priming effect but not the fate of crop residue C." Plant & Soil 414, no. 1/2: 229-245. Environment Index, EBSCOhost (accessed May 29, 2017).
Senthilkumar, K., S. Manian, and K.Udaiyan. 1997. "The effect of burning on soil
enzyme activities in natural grasslands in southern India." Ecological Research 12, no. 1: 21-25.
Singh, B. and Z. Rengel. 2007."The Role of Crop Residues in Improving Soil
Fertility." Soil Biology Nutrient Cycling in Terrestrial Ecosystems. 183-214. Accessed June 20, 2017. doi:10.1007/978-3-540-68027-7_7.
Unger P.W. and McCalla T.M. 1980 “Conservation tillage systems.” Adv Agron
33:1–58 USDA NRCS. 1977. Conservation Agronomy Technical Notes, No. 30:
Relationships of carbon to nitrogen in crop residues. Available at http://www.nm.nrcs.usda.gov/Technical/tech-notes/agro/ AG30.pdf. [verified 1.19.11]
Zhao, H., D. Q. Tong, Q. Lin, X. Lu, and G. Wang. 2012. "Effect of fires on soil organic carbon pool and mineralization in a northeastern China wetland." Geoderma 189-190, 532-539. GeoRef, EBSCOhost (accessed June 24, 2016).

11
Chapter 2. Soil Properties’ Response to Wheat Stubble and Corn Stubble Residue Management in Louisiana
2.1 Introduction Crop residue plays an important role in soil fertility. Crop residue increases
soil organic matter (SOM) and contributes to C and N storage. Soil organisms
are influenced by crop residue due to the SOM increase providing C as an
energy source. Soil microorganisms are involved in C and N cycling by producing
enzymes and decomposing the organic matter entering the soil improving soil
fertility. β-glucosidase is an enzyme that is important for decomposition of the
labile fraction of plant tissue (Madejon et al., 2003). N-acetyl-β-D-
glucosaminidase is an enzyme that catalyzes the hydrolysis of chitin (Ekenler
and Tabatabai, 2004). Crop residue enhance soil fertility by providing an optimal
environment for microbial activity, SOM decomposition, and nutrient release.
However, the efficiency of crop residue on soil chemical and biological properties
is based on the management practice (prescribed fire, no-till, and conventional
tillage).
There is little research on prescribed fire as a crop residue management
practice. However, prescribed fire has been proven beneficial to soils in forests,
wetlands, and grasslands (Alcaniz et al., 2016; Augustine et al., 2014;
Senthilkumar et al., 1997; Zhoa et al., 2012;). Prescribed fire can control excess
crop residue providing an ease of tillage and decrease incidence of disease.
Prescribed fire increased nutrient availability due to the formation of ash from the
combustion of organic matter and its incorporation into the soil in a

12
Mediterranean forest (Alcaniz et al., 2016). Prescribed fire increased soil
inorganic N pools due to increased microbial activity and N mineralization rates a
semiarid grassland (Augustine et al., 2014). Prescribed fire increased soil
enzyme activity due to the increase in the population of soil microorganisms in a
natural grassland in India (Senthilkumar et al., 1997). Prescribed fire increased
soil microbial activity due to increased nutrient availability in a northeastern China
wetland (Zhoa et al., 2012).
No-till is a conservation practice that leaves the crop residue undisturbed
on the soil’s surface (Singh and Rengel, 2007). Since no-till practices leave crop
residue on the surface, soil chemical and biological processes are influenced at
the upper depth (0-7.5 cm) of the soil. Leaving crop residue on the surface of the
soil protects against wind and water erosion and controls soil moisture. Soil stays
cooler until a little later in the spring and summer because of the insulating layer
of crop residue, which could reduce organic matter decomposition rate (Carefoot
et al., 1990; Cox et al., 1990). When organic matter decomposes slowly, the
nutrients in the crop residue are released gradually reducing the amount of
nutrients available to the crop.
Conventional tillage incorporates crop residue into the soil leaving the soil
surface bare and without cover protection making the soil vulnerable to wind and
water erosion. Soils that are tilled typically warm faster in the spring than those
with less tillage; therefore, organic matter decomposes rapidly releasing nutrients
that are readily available for the crop (Nyborg and Malhi, 1989; Malhi and
O’Sullivan, 1990). Tillage has been found to have lower soil organic matter

13
content than no-till soils. The accumulation of crop residue in no-till soils results
in a higher amount of organic matter. When there is an enrichment in soil organic
matter, there is an increase abundance of microorganisms, such as of fungi,
bacteria, arbuscular mycorrhizal fungi, and actinobacteria (Reji et al., 2012).
Tilled soils had lower enzymatic activity than no till soils in response to shifts in
availability of organic substrates, soil moisture, soil temperature, soil aeration and
constitution of soil flora and fauna (Acosta-Martínez et al., 2008; Alvear et al.,
2005; Melero et al., 2011). Conventional tillage systems had a lower amount of
soil organic C and total N than no-till practices in a continuous corn system on a
Decatur silt loam soil (Reji et al., 2012). No-till practices increased total C and N
relative to conventionally tilled practices in a continuous corn, corn-soybean, and
corn-soybean-wheat-Cowpea systems (Aziz et al., 2013). Tillage has lower
inorganic N than no-till soils (Busari et al., 2015). Tillage deteriorates soil
structure increases leaching rate, which could explain the lower inorganic N
content.
While there are advantages and disadvantages to each management
practice, it is important to determine the crop residue management practice that
maximizes the benefits of crop residue on soil fertility. The objective of this study
was to determine the impacts of prescribed fire, no-till, and conventional tillage
on soil physical, chemical, and biological properties in wheat stubble residue and
corn stubble residue. We hypothesized that prescribed fire will increase inorganic
N concentration, soil enzyme activity, and soil organic matter relative to no-till
and tilled management enhancing soil fertility in wheat and corn stubble residue.
14
2.2 Materials and Methods
2.2.1 Site Description
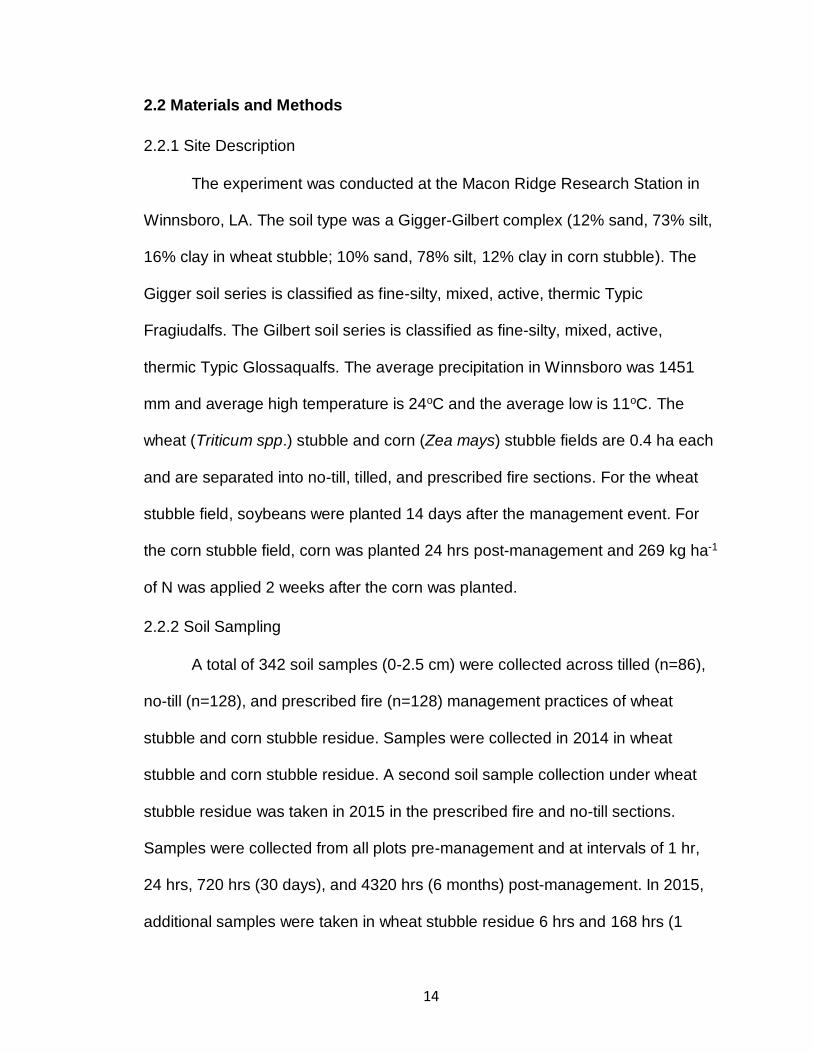
The experiment was conducted at the Macon Ridge Research Station in
Winnsboro, LA. The soil type was a Gigger-Gilbert complex (12% sand, 73% silt,
16% clay in wheat stubble; 10% sand, 78% silt, 12% clay in corn stubble). The
Gigger soil series is classified as fine-silty, mixed, active, thermic Typic
Fragiudalfs. The Gilbert soil series is classified as fine-silty, mixed, active,
thermic Typic Glossaqualfs. The average precipitation in Winnsboro was 1451
mm and average high temperature is 24oC and the average low is 11oC. The
wheat (Triticum spp.) stubble and corn (Zea mays) stubble fields are 0.4 ha each
and are separated into no-till, tilled, and prescribed fire sections. For the wheat
stubble field, soybeans were planted 14 days after the management event. For
the corn stubble field, corn was planted 24 hrs post-management and 269 kg ha-1
of N was applied 2 weeks after the corn was planted.
2.2.2 Soil Sampling
A total of 342 soil samples (0-2.5 cm) were collected across tilled (n=86),
no-till (n=128), and prescribed fire (n=128) management practices of wheat
stubble and corn stubble residue. Samples were collected in 2014 in wheat
stubble and corn stubble residue. A second soil sample collection under wheat
stubble residue was taken in 2015 in the prescribed fire and no-till sections.
Samples were collected from all plots pre-management and at intervals of 1 hr,
24 hrs, 720 hrs (30 days), and 4320 hrs (6 months) post-management. In 2015,
additional samples were taken in wheat stubble residue 6 hrs and 168 hrs (1

15
week) post-management. Additional samples were collected in corn stubble
residue 6 hrs post-management. Due to technical failure, the 4320 hrs post-
management wheat stubble residue samples in 2014 were unable to be
processed. The soil samples were passed through a 2 mm sieve and placed in
plastic bags and immediately stored in a 4oC freezer. A portion of the soil
samples were air dried prior to analysis. Samples were analyzed for soil chemical
(macronutrients and soil organic matter) and biological (microbial community
structure and enzyme activity) properties.
2.2.3 Soil Physical Properties
Particle size analysis was determined using the modified hydrometer
method as described in Grossman and Reinsch (2002). Briefly, 50 grams of air
dried sieved soil was placed into plastic bottles with 10 mL of 10% sodium
hexametaphosphate to facilitate the dispersion of soil particles. The bottles were
then filled halfway with DI water and placed on a shaker for 4 hrs. After shaking,
the soil solution is transferred into a 1 L graduated cylinder and adjusted to 1L
volume with DI water. The soil particles in the cylinder were carefully mixed and a
hydrometer was immediately inserted in order to calculate sand content, and
temperature was recorded. After 24 hrs, another hydrometer and temperature
reading was made without mixing in order to calculate clay content. Silt was
calculated based on sand and clay content. Temperature (oC) was used to
correct for variation in water viscosity by adjusting the hydrometer readings by
adding 0.36 to every degree that exceeds 20oC. The USDA textural triangle was
used to determine soil texture.

16
2.2.4 Soil Chemical Properties
2.2.4.1 Soil Organic Matter
Soil organic matter was determined by the weight loss-on-ignition method
(Nelson and Sommers, 1996). Briefly, air dried soil samples were oven-dried at
105°C overnight, cooled in a desiccator, and weighed. The samples were then
ignited at 400°C for 24 hrs in a muffle furnace. After ignition, samples were again
weighed to determine loss-on-ignition. Soil organic matter was then estimated
according to the equation: %SOM = (%LOI*0.7) – 0.23 as recommended in the
Cornell Soil Health Assessment Training Manual (Gugino et al, 2009).
2.2.4.2 Inorganic Nitrogen
Inorganic nitrogen (NO3--N & NH4
+-N) was measured using potassium
chloride (KCl) extraction (Mulvaney, 1996). One gram of air dried soil was added
to 10 mL of 2 M KCl and was placed in the shaker for one hr. After shaking,
samples were filtered through Whatman 42 filter paper. To determine NO3--N
concentration, 200 µL of Vanadium (III) solution was added to a 96-well plate and
then 40 µL of filtrate was added and incubated in the dark at 37oC for one hr.
After incubation, the absorbance was read at 540 nm using a spectrophotometer.
To determine NH4+-N, 100 µL of salicylate solution was added to a 96-well plate
and then 40 µL of filtrate was added and lastly 100 µL of bleach solution was
added. The 96-well plate was then incubated in the dark for 50 minutes at room
temperature. After incubation, the absorbance was read at 650 nm using a
spectrophotometer. The concentration of inorganic nitrogen was determined
based on a standard curve.

17
2.2.5 Soil Biological Properties
2.2.5.1 β-Glucosidase Enzyme Activity
β-glucosidase enzyme activity was assessed by the p–nitrophenol method
(Tabatabai, 1994). Briefly, 0.5 gram of air dried soil samples were used to
determine β-glucosidase enzyme activity measured as μmol p-nitrophenol kg-1 h-
1. Soil samples were placed in three 50 mL Erlenmeyer flasks. Two of the flasks
were replicates and one flask was the control. For the replicates, 2 mL of
Modified Universal Buffer, pH 6, and 0.5 mL of 0.05 M p-Nitrophenyl-β-D-
glucoside (PNG) solution were added. The controls only received 2 mL of
Modified Universal Buffer, pH 6; therefore, no PNG solution was added. The
flasks were then incubated at 37oC for one hr and then 0.5 mL of 0.5 M CaCl2
and 2 mL 0.1 M Tris (hydroxylmethyl) aminomethane (THAM), pH 12, were
added to all flasks. The controls then received 0.5 mL of PNG solution. The soil
suspension was filtered through Whatman 2 filter paper and 200 µL aliquots of
each sample were pipetted into three wells in a 96-well plate. The 96-well plate
was placed in an EON spectrophotometer (BioTek, Vermont), and the yellow
color filtrate intensity was measured at 420 nm and concentration of p-
nitrophenol was determined based on a standard curve.
2.2.5.2 N-acetyl-β-D-glucosaminidase (NAGase)
Air dried soil samples were used to determine N-acetyl-β-D-
glucosaminidase enzyme activity measured as μmol p-nitrophenol kg-1 h-1
described by the p–nitrophenol method (Tabatabai, 1994). A half gram of each
soil sample was placed in three 50 mL Erlenmeyer flasks. Two flask were for

18
replicates, and one flask was for the control. For the replicates, 2 mL of 0.1 M
Acetate buffer pH 5.5 and 0.5 ml of 10 mM p-Nitrophenyl-N-acetyl-B-D-
glucosaminide (pNNAG) solution were added. The controls received 2 mL of 0.1
M Acetate buffer pH 5.5 but no pNNAG solution. The flasks were then incubated
at 37oC for one hr and then 0.5 mL of 0.5 M CaCl2 and 2 mL 0.1 M THAM pH 12
were added to all flasks. The controls then received 0.5 mL of pNNAG solution.
The soil suspension was then filtered through Whatman 2 filter paper and then
200 µL aliquots of each sample were pipetted into three wells in a 96-well plate.
The yellow color filtrate intensity was measured at 420 nm via an EON
spectrophotometer (BioTek, Vermont), and concentration of p-nitrophenol was
determined based on a standard curve.
2.2.5.3 Soil Microbial Community Structure
Soil microbial community structure was determined using individual fatty
acid methyl esters as biomarkers per the ester-linked fatty acid ethyl ester (EL-
FAME) analysis described by Schutter and Dick (2000). The EL FAME extraction
procedure occurred in three steps: methylation, neutralization, and extraction.
Three grams of field moist soil was measured and 15 mL of the methylation
reagent, 0.2 M potassium hydroxide in methanol was added. The samples were
then incubated at 37oC for one hr in a water bath while being vortexed every 15
minutes. The samples were cooled at ambient temperature and 3 mL of 1.0 M
acetic acid was added to neutralize pH. After the neutralization process, 3 mL of
hexane was added and centrifuged at 2200 rpm for 5 minutes in order to
separate EL-FAMEs into the organic phase. The organic phase was then

19
transferred into a separate test tube and concentrated with N2 gas to evaporate
the hexane. The samples were analyzed on an Agilent 7890B gas
chromatograph (California) with a silica packed 0.2 mm x 25 m Agilent J&W Ultra
Inert column, flame ionization detectors, and oven program of 190 oC to 285 oC in
10 oC increments.
The concentration of FAME (nmol g-1 soil) were calculated using the 19:0
internal standard and relative abundance (mol%) was calculated by dividing each
FAME by the total sum of all identified EL-FAMEs in a sample. Identified EL-
FAMEs are named by the number of C atoms, a colon, and the number of double
bonds followed by the position of the first double bond from the methyl (w) end.
Notations include cyclic (cyclo), cis (c), and iso and anteiso branched EL-FAMEs.
Biomarkers included: 17:0 10-methyl, 18:0 10-methyl, 16:0 10-methyl for
actinomycetes (Frostegard et al., 1993; Zelles, 1997) ; 16:1 w5c for arbuscular
mycorrhizal fungi (AMF) (Paul and Clark, 1988; Pennanen et al., 1996); 18:1
w9c, 18:2 w6c, 18:3 w6c (6,9,12), and 20:1 w9c for saprophytic fungi (Paul and
Clark, 1988; Zelles, 1997; Frostegard et al., 1993; Madan et al., 2002); 16:1 w9c,
16:1 w7c, 17:0 cyclo, 19:0 cyclo w6c, 18:1 w7c, 18:1 w5c, 19:1 w6c, and 19:0
cyclo for Gram-negative bacteria (Zelles and Bai, 1994; Ratledge and Wilkinson,
1988; Frostegard et al., 1993; Laczko et al., 1997); and 14:0 iso, 15:0 iso, 15:0
anteiso, 16:0 iso, 16:0 anteiso, 17:0 iso, 17:0 anteiso, 17:1 w9c, and 18:0 for
Gram-positive bacteria (Morgan and Winstanley, 1997; White et al., 1998;
Laczko et al., 1997; Frostegard et al., 1993; Ratledge and Wilkinson, 1988;
Pennanen et al., 1996; O'Leary and Wilkinson, 1988).

20
2.2.6 Data Analysis
Basic analysis of variance (ANOVA) was used to compare across residue
management treatments (prescribed fire, tillage, and no-till). In the case of wheat
stubble, if no year effect was observed, samples were pooled across years. R
was used for multivariate data and all statistics (R Core Team, 2013). LSD for
mean separation was from the agricolae package (de Mendiburu, 2017). Non-
metric distance based multivariate analysis for FAME data was done using the
capscale command in the vegan package (Oksanen et al., 2017). Vectors were
done using the envfit function of the vegan package.
2.3 Results and Discussion
2.3.1 Treatment Effects on Soil Organic Matter
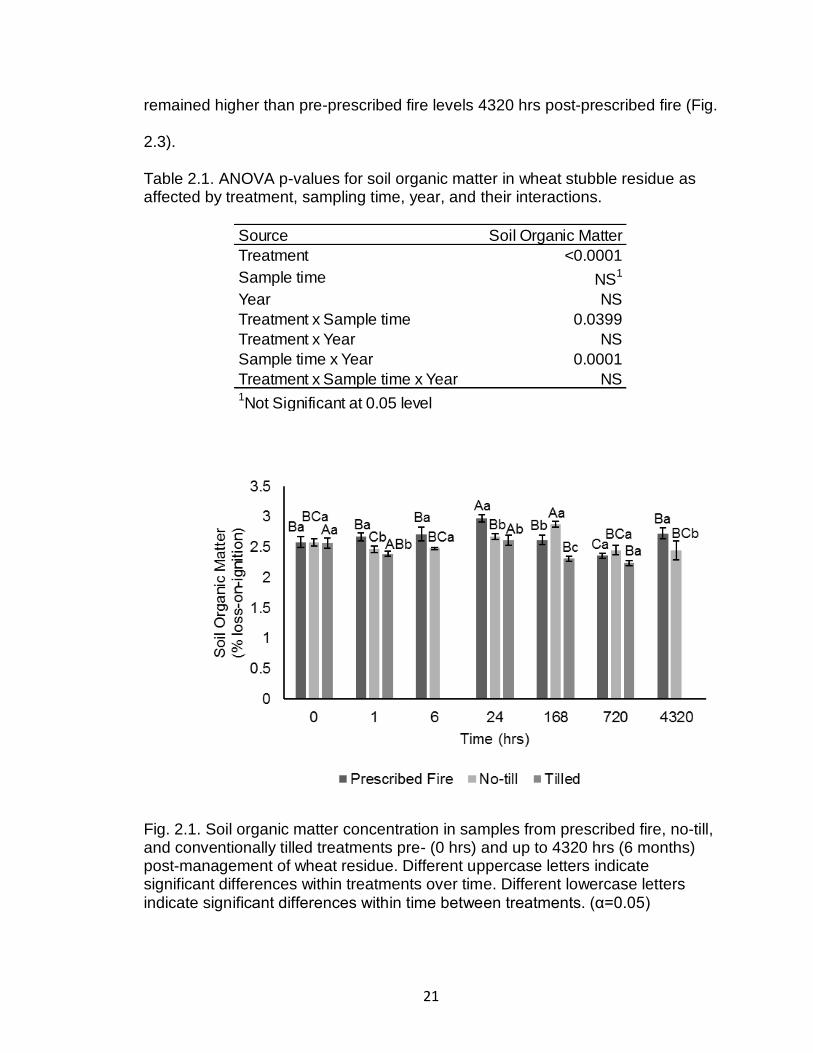
In wheat stubble residue, a treatment by sample time interaction occurred
for soil organic matter concentrations (Table 2.1). Soil organic matter increased
in 1 hr post-prescribed fire and again at 24 hrs post-prescribed fire decreasing to
pre-prescribed fire levels at 168 hrs post-prescribed fire. Prescribed fire soil
contained the most soil organic matter 24 hrs post-management and 4320 hrs
post-management relative to no-till and tilled (Fig. 2.1). A year by time interaction
was observed possibly due to variations in time of sampling between years
(Table 2.1; Fig. 2.2).
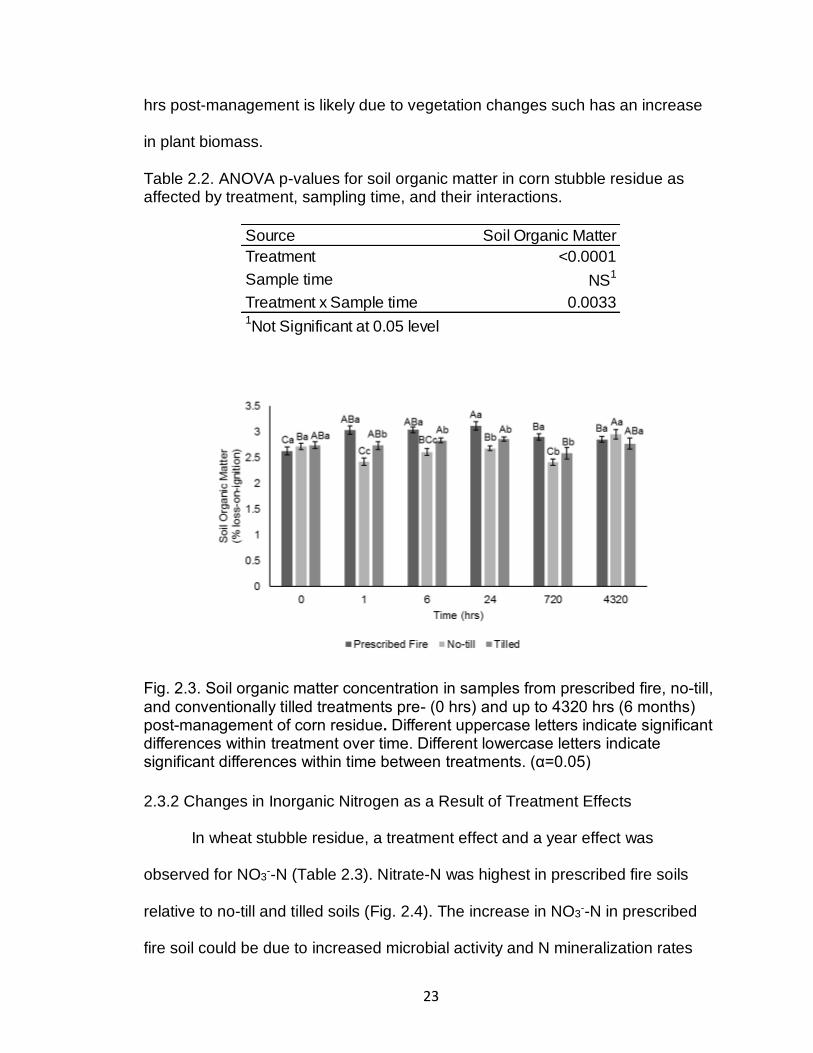
In corn stubble residue, an interaction between treatment and sample time
was observed for soil organic matter (Table 2.2). Soil organic matter was highest
in prescribed fire soil relative to no-till and tilled soils up to 720 hrs post-
management. Soil organic matter increased 1 hr post-prescribed fire and
21
remained higher than pre-prescribed fire levels 4320 hrs post-prescribed fire (Fig.
2.3).
Table 2.1. ANOVA p-values for soil organic matter in wheat stubble residue as affected by treatment, sampling time, year, and their interactions.
Fig. 2.1. Soil organic matter concentration in samples from prescribed fire, no-till, and conventionally tilled treatments pre- (0 hrs) and up to 4320 hrs (6 months) post-management of wheat residue. Different uppercase letters indicate significant differences within treatments over time. Different lowercase letters indicate significant differences within time between treatments. (α=0.05)
Source Soil Organic Matter
Treatment <0.0001
Sample time NS1
Year NS
Treatment x Sample time 0.0399
Treatment x Year NS
Sample time x Year 0.0001
Treatment x Sample time x Year NS1Not Significant at 0.05 level

22
Fig. 2.2. Soil organic matter concentration in samples collected year 2014 and 2015 from prescribed fire, no-till, and conventionally tilled treatments pre- (0 hrs) and up to 4320 hrs (6 months) post-management of wheat residue. Different uppercase letters indicate significant differences within years over time. Different lowercase letters indicate significant differences within time between years. (α=0.05)
Soil organic matter increased in the prescribed fire soils in wheat and corn
stubble residue relative to tilled and no-till soils. The increase in soil organic
matter after a prescribed fire event was also observed in Spartina patens-
dominated tidal marshes where fire caused organic matter to decompose
releasing plant nutrients and stimulating increases in biomass production leading
to a net organic matter increase (Cahoon et al, 2004). The increase in soil
organic matter could also be due to the incorporation of anthropogenic charcoal
(biochar) from the crop residue into the soil due to the prescribed fire event
influencing C cycling (Alexis et al., 2012; Alcaniz et al., 2016; Wiechmann et al.,
2015). Biochar is C-rich and nitrogen-depleted increasing resistance to microbial
degradation (Wiechmann et al., 2015). The increase in soil organic matter 4320
23
hrs post-management is likely due to vegetation changes such has an increase
in plant biomass.
Table 2.2. ANOVA p-values for soil organic matter in corn stubble residue as affected by treatment, sampling time, and their interactions.
Fig. 2.3. Soil organic matter concentration in samples from prescribed fire, no-till, and conventionally tilled treatments pre- (0 hrs) and up to 4320 hrs (6 months) post-management of corn residue. Different uppercase letters indicate significant differences within treatment over time. Different lowercase letters indicate significant differences within time between treatments. (α=0.05)
2.3.2 Changes in Inorganic Nitrogen as a Result of Treatment Effects
In wheat stubble residue, a treatment effect and a year effect was
observed for NO3--N (Table 2.3). Nitrate-N was highest in prescribed fire soils
relative to no-till and tilled soils (Fig. 2.4). The increase in NO3--N in prescribed
fire soil could be due to increased microbial activity and N mineralization rates
Source Soil Organic Matter
Treatment <0.0001
Sample time NS1
Treatment x Sample time 0.00331Not Significant at 0.05 level

24
(Augustine et al., 2014). There was no difference in NO3--N in tilled and no-till
soils. Nitrate-N was higher in year 2014 than year 2015 possibly due to abiotic
factors or variations in sampling times (Fig. 2.5).
Table 2.3. ANOVA p-values for nitrate-N in wheat stubble residue as affected by treatment, sampling time, year, and their interactions.
Fig. 2.4. Nitrate-N (NO3--N) concentration in samples averaged over time from
pre- (0 hrs) to 4320 hrs (6 months) post-management in prescribed fire, no-till, and conventionally tilled treatments in wheat residue. Different lowercase letters indicate significant differences within time between treatments. (α=0.05)
Source Nitrate-N
Treatment 0.0135
Sample time NS1
Year <0.0001
Treatment x Sample time NS
Treatment x Year NS
Sample time x Year NS
Treatment x Sample time x Year NS1Not Significant at 0.05 level

25
Fig. 2.5. Nitrate-N (NO3--N) concentration in samples averaged over time from
pre- (0 hrs) to 4320 hrs (6 months) post-prescribed fire and across prescribed fire, no-till, and conventionally tilled treatments in wheat residue. Different lowercase letters indicate significant differences within time and treatments between years. (α=0.05)
There was an interaction between treatment and sample time observed for
NH4+-N in wheat stubble residue (Table 2.4). Ammonium-N increased 24 hrs
post-management and decreased to minimum levels 720 hrs post-management
and increased to maximum levels 4320 hrs post-management (Fig. 2.6). Since
soybeans were planted 14 days after the fire event, the decrease in NH4+-N at
720 hrs post-prescribed fire could be due to nutrient uptake by the plant. The
maximum increase in NH4+-N 4320 hrs post-management could be a result of the
conversion of organic N to inorganic N by the soybeans. Tilled soil had highest
amount of NH4+-N relative to no-till and prescribed fire soils 24 hrs post-
management (Fig. 2.6). A year by time interaction was observed potentially due
to variations in time of sampling between years (Table 2.4; Fig. 2.7). The spike in
NH4+-N at 4320 hrs post-management is possibly due to vegetation changes.

26
Table 2.4. ANOVA p-values for ammonium-N in wheat stubble residue as affected by treatment, sampling time, year, and their interactions.
Fig. 2.6. Ammonium-N (NH4+-N) concentration in samples collected year 2014
and 2015 from prescribed fire, no-till, and conventionally tilled treatments pre- (0 hrs) and up to 4320 hrs (6 months) post-management of wheat residue. Different uppercase letters indicate significant differences within treatment over time. Different lowercase letters indicate significant differences within time between treatments. (α=0.05)
Source Ammonium-N
Treatment NS1
Sample time <0.0001
Year NS
Treatment x Sample time 0.0001
Treatment x Year NS
Sample time x Year 0.0010
Treatment x Sample time x Year NS1Not Significant at 0.05 level

27
Fig. 2.7. Ammonium-N (NH4+-N) concentration in samples collected year 2014
and 2015 from prescribed fire, no-till, and conventionally tilled treatments pre- (0 hrs) and up to 4320 hrs (6 months) post-management of wheat residue. Different uppercase letters indicate significant differences within years over time. Different lowercase letters indicate significant differences within time between years. (α=0.05)
In corn stubble residue, a sampling time effect was observed for NO3
--N
(Table 2.5). Nitrate-N decreased 1 hr post-management and recovered to pre-
management levels 720 hrs post-management (Fig. 2.8). The decrease in NO3--
N 1 hr and up to 720 hrs post-management could be due to abiotic factors such
as rainfall and temperature since there was no treatment effect. An interaction
between treatment and sample time was observed for NH4+-N (Table 2.5).
Ammonium-N decreased 1 hr post-management and increased in the tilled soil
24 hrs post-tillage. NH4+-N recovered to pre-management levels in no-till soil 720
hrs post-management. NH4+-N increased to its maximum 4320 hrs post-
prescribed fire. NH4+-N increased drastically in the prescribed fire and no-till soils
720 hrs post-management (Fig. 2.9). Nitrogen fertilizer was applied 14 days after

28
the management event which could explain the drastic increase in NH4+-N 720
hrs post-management.
Table 2.5. ANOVA p-values for inorganic N (nitrate-N and ammonium-N) in corn stubble residue as affected by treatment, sampling time, and their interactions.
Fig. 2.8. Nitrate-N (NO3- -N) concentration in samples averaged over treatments
of prescribed fire, no-till, and tilled management practices in year 2014 and 2015 at pre- (0 hrs) and up to 4320 hrs (6 months) post-management of corn residue. Different uppercase letters indicate significant differences within treatments over time. (α=0.05)
Source Nitrate-N Ammonium-N
Treatment NS1
0.0064
Sample time 0.0208 <0.0001
Treatment x Sample time NS <0.00011Not Significant at 0.05 level

29
Fig. 2.9. Ammonium-N (NH4+-N) concentration in samples from prescribed fire,
no-till, and conventionally tilled treatments pre- (0 hrs) and up to 4320 hrs (6 months) post-management of corn residue. Different uppercase letters indicate significant differences within treatment over time. Different lowercase letters indicate significant differences within time between treatments. (α=0.05) 2.3.3 Soil Enzyme Activity Response to Treatments
In wheat stubble residue, a treatment effect and sampling time effect was
observed for β-glucosidase activity (Table 2.6). Tilled soil had the lowest β-
glucosidase activity relative to no-till and prescribed fire (Fig. 2.10). β-
glucosidase activity decreased 1 hr post-management and increased to
maximum activity at 4320 post-management (Fig. 2.11). The increase in β-
glucosidase activity 4320 hrs post-management could be in response to the
increased amount of biomass at the surface due to plant growth.
Table 2.6. ANOVA p-values for in β-glucosidase activity in wheat stubble residue as affected by treatment, sampling time, year, and their interactions.
Source β-glucosidase
Treatment <0.0001
Sample time <0.0001
Year NS1
Treatment x Sample time NS
Treatment x Year NS
Sample time x Year NS
Treatment x Sample time x Year NS1Not Significant at 0.05 level

30
Fig. 2.10. β-glucosidase activity in samples averaged over time from pre- (0 hrs) to 4320 hrs (6 months) post-management in prescribed fire, no-till, and conventionally tilled treatments in wheat residue. Different lowercase letters indicate significant differences within time between treatments. (α=0.05)
In corn stubble residue, an interaction was observed between treatment
and sampling time for β-glucosidase activity (Table 2.7). β-glucosidase activity
decreased 6 hrs post-prescribed fire and recovered to pre-prescribed fire levels
24 hrs post-prescribed fire.
Fig. 2.11. β-glucosidase activity concentration in samples averaged over treatments of prescribed fire, no-till, and tilled management practices at pre- (0 hrs) and up to 4320 hrs (6 months) post-management of wheat residue. Different uppercase letters indicate significant differences within treatments over time. (α=0.05)

31
β-glucosidase activity decreased in no-till soils 24 hrs post-management and
recovered to pre-management levels at 4320 hrs post-management (Fig. 2.12).
The recovery of β-glucosidase activity 4320 hrs post-management could be in
response to more corn biomass at the surface. Tilled soil had the lowest β-
glucosidase activity before the management event and 4320 hrs post-
management (Fig. 2.12).
Tillage incorporates crop residue into the soil, which could explain the
decrease in β-glucosidase activity in tilled soil at the surface layer (0-2.5 cm)
relative to no-till and prescribed fire soil. Results were similar to those reported
by Bergstrom et al. (2000) that indicated tillage had a lower amount of β-
glucosidase activity at 0-7.5 cm depth relative to no-till soil. These results are
also comparable to that shown previously where tilled soils contained lower
enzymatic activity than no till soils in response to shifts in availability of organic
substrates, in soil moisture, soil temperature, soil aeration and constitution of soil
flora and fauna (Melero et al., 2011; Acosta-Martínez et al., 2008; Alvear et al.,
2005).
Table 2.7. ANOVA p-values for in β-glucosidase activity in corn stubble residue as affected by treatment, sampling time, and their interactions.
Source β-glucosidase
Treatment NS1
Sample time NS
Treatment x Sample time 0.01061Not Significant at 0.05 level

32
Fig. 2.12. β-glucosidase activity in samples from prescribed fire, no-till, and conventionally tilled treatments pre- (0 hrs) and up to 4320 hrs (6 months) post-management of corn residue. Different uppercase letters indicate significant differences within treatment over time. Different lowercase letters indicate significant differences within time between treatments. (α=0.05)
In wheat stubble residue, an interaction between treatment and sampling
time was observed (Table 2.8). No-till soil had the highest amount of NAGase
activity up to 720 hrs post-management. Since no-till leaves crop residue
undisturbed on the soil surface, there is a more stable pool of extracellular
enzymes because the soil environment is less oxidizing than in tilled soil which
could explain the higher amount of NAGase activity in the no-till soil (Melero et
al., 2009; Trasar-Cepeda et al., 2008). Prescribed fire and no-till soil had similar
NAGase activity 4320 hrs post-management. NAGase activity increased to its
maximum 4320 hrs post-management possibly due to vegetative changes (Fig.
2.13). A year by time interaction was observed potentially due to variations in
time of sampling between years (Table 2.8; Fig. 2.14).

33
Table 2.8. ANOVA p-values for in N-acetyl-β-D-glucosaminidase activity in wheat stubble residue as affected by treatment, sampling time, year, and their interactions.
In corn stubble residue, a sample time effect was observed for NAGase
activity (Table 2.9). NAGase increased 1 hr post-management and returned to
pre-management levels 720 hrs post-management. NAGase increased to
maximum activity at 4320 hrs post-management (Fig. 2.15). The increase in soil
enzyme activity 4320 hrs post-management could be in response to increased
amount of biomass at the surface.
Fig. 2.13. N-acetyl-β-D-glucosaminidase (NAGase) activity in samples from prescribed fire, no-till, and conventionally tilled treatments pre- (0 hrs) and up to 4320 hrs (6 months) post-management of wheat residue. Different uppercase letters indicate significant differences within treatments over time. Different lowercase letters indicate significant differences within time between treatments. (α=0.05)
Source N-acetyl-β-D-glucosaminide
Treatment <0.0001
Sample time 0.0035
Year 0.0208
Treatment x Sample time 0.0002
Treatment x Year NS1
Sample time x Year <0.0001
Treatment x Sample time x Year NS1Not Significant at 0.05 level

34
Fig. 2.14. N-acetyl-β-D-glucosaminidase (NAGase) activity in samples collected year 2014 and 2015 from prescribed fire, no-till, and conventionally tilled treatments pre- (0 hrs) and up to 4320 hrs (6 months) post-management of wheat residue. Different uppercase letters indicate significant differences within years over time. Different lowercase letters indicate significant differences within time between years. (α=0.05) Table 2.9. ANOVA p-values for in N-acetyl-β-D-glucosaminidase activity in corn stubble residue as affected by treatment, sampling time, and their interactions.
Fig. 2.15. N-acetyl-β-D-glucosaminidase (NAGase) activity in samples averaged over treatments of prescribed fire, no-till, and tilled management practices at pre- (0 hrs) and up to 4320 hrs (6 months) post-management of corn residue. Different uppercase letters indicate significant differences within treatments over time. (α=0.05)
Source N-acetyl-β-D-glucosaminide
Treatment NS1
Sample time <0.0001
Treatment x Sample time NS1Not Significant at 0.05 level

35
2.3.4 Soil Microbial Community Structure as a Result of Treatment Effects In wheat stubble residue, there were no differences in absolute
abundance of FAMEs; however, a treatment effect and a time effect was
observed for relative abundance of FAMEs. Therefore, total FAMEs did not
increase between treatments or across time, but different microbial groups
shifted in abundance relative to treatments and over time. Prescribed fire soil had
a relative abundance of Gram negative, total bacteria, and actinomycetes. No-till
and tilled soils had similar microbial communities with a relative abundance of
AMF, saprophytic fungi, and fungi:bacteria (Fig. 2.16).
Axis 1 (45.2 %)
-1.5 -1.0 -0.5 0.0 0.5 1.0
Axis
2 (
22
.5 %
)
-1.5
-1.0
-0.5
0.0
0.5
1.0
1.5
Prescribed Fire
No-till
Tilled
mGMp
Total bacteria
Fungi:Bacteria
S. Fungi
mGMn
mAMF
Actinomycetes
Fig. 2.16. Distance based redundancy analysis (db RDA) plot derived from fatty acid profiles from samples collected in 2014 wheat stubble residue under tilled (green triangles), no-till (red circles), and prescribed fire treatments (black circles). Vectors in the bi-plot overlay were constructed from a matrix containing taxonomic groups. (mGMp = Gram positive bacteria; mGMn = Gram negative bacteria; mAMF = Arbuscular mycorrhizal fungi; S. Fungi = Saprophytic Fungi)

36
Prescribed fire can modify microbial community structure due to the
heating of the soil which could explain the different microbial communities in
prescribed fire soil relative to tilled and no-till (Perry et al., 1984). Pre-
management (0 hrs) and 1 hr post-management had a relative abundance of
saprophytic fungi, fungi:bacteria, and Gram negative bacteria. There was a shift
in microbial community structure 24 hrs post-management where there was a
relative abundance of AMF. At 168 hrs post-management, the microbial
community shifted to a relative abundance of Gram positive bacteria. At 720 hrs
post-management, the microbial community shifted to a relative abundance of
total bacteria (Fig. 2.17). Since there was no interaction between treatment and
sampling time, the shifts in microbial community structure over time could be the
result of abiotic factors such as rainfall, temperature, and time of day.
Axis 1 (45.2 %)
-1.5 -1.0 -0.5 0.0 0.5 1.0
Axis
2 (
22
.5 %
)
-1.5
-1.0
-0.5
0.0
0.5
1.0
1.5
0 hr
1 hr
24 hr
168 hr
720 hr
mGMp
Total bacteria
Fungi:Bacteria
S. Fungi
mGMn
mAMF
Actinomycetes
Fig. 2.17. Distance based redundancy analysis (db RDA) plot derived from fatty acid profiles from samples collected in 2014 wheat stubble residue from tilled, no-till, and prescribed fire treatments at pre- (0 hrs) and up to 720 hrs (30 days) post-management. Pre are black circles, 1 hr is red circles, 24 hrs are green triangles, 168 hrs are gold triangles, and 720 hrs are blue squares. Vectors in the bi-plot overlay were constructed from a matrix containing taxonomic groups. (mGMp = Gram positive bacteria; mGMn = Gram negative bacteria; mAMF = Arbuscular mycorrhizal fungi; S. Fungi = Saprophytic Fungi)

37
In corn stubble residue, there was a time effect observed for total
abundance of FAMEs (Table 2.10). Total FAMEs increased 1 hr post-
management then decreased 6 hrs post-management. This trend was observed
in Gram positive bacteria, Gram negative bacteria, actinomycetes, total bacteria,
and saprophytic fungi. AMF was not affected by time but was more abundant in
no-till soil (3.32 nmol g-1 in no-till; 2.31 nmol g-1 in prescribed fire; 1.99 nmol g-1 in
tilled) possibly due to the soil being undisturbed. Inorganic N decreased 1 hr-post
management which could be explained by the increase in total FAMEs. Since
corn stubble has a high C:N ratio, microorganisms could be consuming the N in
order to breakdown the residue 1 hr-post management favoring immobilization
(Hoorman and Islam 2010). An increase in total FAMEs has the potential to
increase soil enzyme activity by producing enzymes for C and N cycling, which
could explain the increase in NAGase activity 1 hr post-management (Burns and
Wallenstein 2010).
Table 2.10. Total abundance of FAMEs in corn stubble residue as affected by time.
FAMEs1
0 hr2 1 hr 6 hrs 720 hrs
Total FAMEs 87.20 ab3 100.30 a 78.17 bc 64.36 c
Gram Postive Bacteria 10.31 ab 11.55 a 9.38 b 7.03 c
Gram Negative Bacteria 5.05 ab 6.12 a 4.56 b 3.98 b
Actinomycetes 5.61 ab 6.12 a 4.86 bc 4.36 c
Total Bacteria 20.98 ab 23.79 a 18.80 bc 15.37 c
Saprophytic Fungi 13.63 ab 15.95 a 12.06 b 10.52 b1Fatty Acid Methyl Esters
2Hours after management
nmol g-1
3Different lower case letters indicate significant differences within
microbial groups across sampling time (p ≤ 0.05).

38
A treatment by time interaction occurred for relative abundance of FAMEs
in corn stubble residue. No-till soil had an abundance of AMF, Gram negative
bacteria, and saprophytic fungi at 6 hrs and 720 hrs post-management (Fig.
2.18). Microbial community structure could not be determined pre-management
and 1 hr post-management in the no-till soil. Microbial community structure could
not be determined in the tilled soil (Fig. 2.19). There was an abundance of Gram
positive bacteria and total bacteria pre-prescribed fire and 1 hr post-prescribed
fire (Fig. 2.20). Microbial community structure could not be determined 6 hrs and
720 hrs post-prescribed fire.
Axis 1 (39.8 %)
-1.5 -1.0 -0.5 0.0 0.5 1.0 1.5
Axis
2 (
19.7
%)
-0.4
-0.2
0.0
0.2
0.4
0.6
0.8
0 hr
1 hr
6 hr
720
mGMp
Total bacteria
Fungi:Bacteria
S. Fungi
mGMn
mAMF
Fig. 2.18. Distance based redundancy analysis (db RDA) plot derived from fatty acid profiles from samples collected in corn stubble residue from no-till treatment at pre- (0 hrs) and up to 720 hrs (30 days) post-management. Pre are black circles, 1 hr is red circles, 6 hrs are green triangles, and 720 hrs are gold triangles. Vectors in the bi-plot overlay were constructed from a matrix containing taxonomic groups. (mGMp = Gram positive bacteria; mGMn = Gram negative bacteria; mAMF = Arbuscular mycorrhizal fungi; S. Fungi = Saprophytic Fungi)

39
While microbial community structure can be determined in prescribed fire,
no-till, and tilled treatments, variation was observed in corn stubble residue over
time that was not associated with the fatty acid profiles that were tested. These
variations could be due to abiotic factors, such as temperature, rainfall, and
sampling time. Another explanation for the variations could be that there are
other fatty acid profiles present in the soil that were not tested. Therefore, further
research needs to be done in order to determine crop residue management
effects on microbial community structure over time.
Axis 1 (39.8 %)
-1.5 -1.0 -0.5 0.0 0.5 1.0 1.5
Axis
2 (
19.7
%)
-0.6
-0.4
-0.2
0.0
0.2
0.4
0.6
0 hr
1 hr
6 hr
720
mGMp
Total bacteria
Fungi:Bacteria
S. Fungi
mGMn
mAMF
Fig. 2.19. Distance based redundancy analysis (db RDA) plot derived from fatty acid profiles from samples collected in corn stubble residue from tilled treatment at pre- (0 hrs) and up to 720 hrs (30 days) post-management. Pre are black circles, 1 hr is red circles, 6 hrs are green triangles, and 720 hrs are gold triangles. Vectors in the bi-plot overlay were constructed from a matrix containing taxonomic groups. (mGMp = Gram positive bacteria; mGMn = Gram negative bacteria; mAMF = Arbuscular mycorrhizal fungi; S. Fungi = Saprophytic Fungi)

40
Axis 1 (39.8 %)
-1.5 -1.0 -0.5 0.0 0.5 1.0 1.5
Axis
2 (
19.7
%)
-0.6
-0.4
-0.2
0.0
0.2
0.4
0 hr
1 hr
6 hr
720 hr
mGMp
Total bacteria
Fungi:Bacteria
S. Fungi
mGMn
mAMF
Fig. 2.20. Distance based redundancy analysis (db RDA) plot derived from fatty acid profiles from samples collected in corn stubble residue from prescribed fire treatment at pre- (0 hrs) and up to 720 hrs (30 days) post-management. Pre are black circles, 1 hr is red circles, 6 hrs are green triangles, and 720 hrs are gold triangles. Vectors in the bi-plot overlay were constructed from a matrix containing taxonomic groups. (mGMp = Gram positive bacteria; mGMn = Gram negative bacteria; mAMF = Arbuscular mycorrhizal fungi; S. Fungi = Saprophytic Fungi)
2.4 Conclusions
The effects of prescribed fire, no-till, and conventional tillage on soil
biological and chemical properties in wheat and corn stubble residue were
determined by this study. Short term changes in organic matter, nutrients, and
enzyme activity were observed for prescribed fire, no-till, and conventional tillage
in wheat and corn stubble residue. Prescribed fire increased nitrate-N relative to
no-till and conventional tillage in wheat stubble residue. β-glucosidase activity
was lowest in conventional tillage in wheat stubble residue. In wheat stubble

41
residue, prescribed fire soil had an abundance of Gram negative, total bacteria,
and actinomycetes. No-till and tilled soils had similar microbial communities with
an abundance of AMF, saprophytic fungi, and fungi:bacteria. There were shifts in
microbial communities over time from abundance of saprophytic fungi,
fungi:bacteria, and Gram negative bacteria pre-management and 1 hr post-
management to an abundance of AMF 24 hr post-management to an abundance
of Gram positive bacteria 168 hrs post-management to an abundance of total
bacteria 720 hrs post-management. The effects of the crop residue management
practices on microbial community structure over time was unable to be
determined based on the fatty acid profiles tested in this study in corn stubble
residue. Further research needs to be done in order to determine the most
efficient crop residue management practice to optimize soil fertility in wheat and
corn stubble residue in Louisiana.
2.5 References Acosta-Martínez, V., D. Acosta-Mercado, D. Sotomayor-Ramírez, L. Cruz-
Rodríguez. 2008. “Microbial communities and enzymatic activities under different management in semiarid soils.” Appl. Soil Ecol. 38 (2008) 249e260.
Alcañiz, M., L. Outeiro, M. Francos, J. Farguell, and X. Úbeda. 2016. "Long-term
Dynamics of Soil Chemical Properties after a Prescribed Fire in a Mediterranean Forest (Montgrí Massif, Catalonia, Spain)." Science of The Total Environment, 2016. doi:10.1016/j.scitotenv.01.115.
Alexis, M.A., Rasse, D.P., Knicker, H., Anquetil, C., and Rumpel, C. 2012.
"Evolution of soil organic matter after prescribed fire: A 20-year chronosequence." GeodermaAGRIS, EBSCOhost (accessed June 15, 2017).
Alvear, M., A. Rosas, J. Rouanet, F. Borie. 2005. “Effects of three soil tillage
systems on some biological activities in an Ultisol from southern Chile.” Soil Tillage Res. 82 195e202.

42
Augustine, D. J., P. Brewer, D. M. Blumenthal, J. D. Derner, and J. C. Von Fischer. 2014. "Prescribed Fire, Soil Inorganic Nitrogen Dynamics, and Plant Responses in a Semiarid Grassland." Journal of Arid Environments 104 (2014): 59-66. doi:10.1016/j.jaridenv.2014.01.022.
Aziz, I., T. Mahmood, and K.R. Islam. 2013. "Effect of long term no-till and
conventional tillage practices on soil quality." Soil & Tillage Research 131, 28-35. Science Citation Index, EBSCOhost (accessed June 26, 2017).
Bergstrom, D.W., Monreal, C.M., Tomlin, A.D., Miller, J.J. 2000. "Interpretation of
soil enzyme activities in a comparison of tillage practices along a topographic and textural gradient." Canadian Journal Of Soil Science no. 1: AGRIS, EBSCOhost (accessed June 15, 2017).
Burns, R.G. and M.D. Wallenstein. 2010. “Microbial extracellular enzymes and
natural and synthetic polymer degradation in soil: current research and future prospects.” World science congress 19 67-69.
Busari, M. A., S. S. Kukal, A. Kaur, R. Bhatt, and A. A. Dulazi. 2015.
"Conservation tillage impacts on soil, crop and the environment." International Soil and Water Conservation Research 3, 119-129. ScienceDirect, EBSCOhost (accessed April 26, 2017).
Carefoot, J.M., Nyborg, M., Lindwall, C.W., 1990. “Tillage-induced soil changes
and related grain yield in a semi-arid region.” Can. J. Soil Sci. 70, 203–214.
Cox, W.J., Zobel, R.W., van Es, H.M., Otis, D.J., 1990. “Tillage effects on some
soil physical and corn physiological characteristics.” Agron. J. 82, 806–812.
de Mendiburu, F. 2016. “agricolae: Statistical Procedures for Agricultural
Research.” R package version 1.2-4. https://CRAN.Rproject.org/package=agricolae
Ekenler, M. and Tabatabai, M.A., 2004. “β-glucosaminidase activity as an index
of nitrogen mineralization in soils.” Commun. Soil Sci. Plant Anal. 35, 1081–1094.
Frostegard, A., Tunlid, A., Baath, E. 1993. “Phospholipid fatty acid composition,
biomass, and activity of soil microbial communities from two soil types experimentally exposed to different metals.” Applied and Environmental Microbiology 59, 3605±3617.

43
Grossman, R.B. and T.G. Reinsch. 2002. “Bulk Density and Linear Extensibility.” In: J.H. Dane and G.C. Topp, editors, Methods of Soil Analysis: Physical Methods, Part 4, Soil Science Society of America, Madison, p. 201-228.
Gugino, B.K., Idowu, O.J., Schindelbeck, R.R., van Es, H.M., Wolfe, D.W.,
Moebius-Clune, B.N., Thies, J.E. and Abawi, G.S. 2009. Cornell Soil Health Assessment Training Manual. Edition 2.0, Cornell University, Geneva, NY.
Hoorman, J.J. and R. Islam. 2010. Understanding soil microbes and nutrient
recycling. The Ohio State University. SAG-16-10 Laczko, E., A. Rudaz, and A. Aragno. 1997. “Diversity of anthropogenically
influenced or disturbed soil microbial communities.” In: H. Insam and A. Rangger, editors, Microbial communities, functional versus structural approaches. Springer-Verlag, Berlin. p. 57–67.
Madan R., Pankhurst, C., Hawke, B., Smith, S. 2002. “Use of fatty acids for
identification of AM fungi and estimation of the biomass of AM spores in soil.” Soil Biol Biochem 34:125– 128. doi:10.1016/s0038-0717(01)00151-1
Madejon, E., P. Burgos, R. Lopez, and F. Cabrera. 2003. “Agricultural use of
three organic residues: effect on orange production and on properties of a soil of the ‘Comarca Costa de Huelva’(SW Spain).” Nutr. Cycl. Agroecosyst. 65 281:288.
Malhi, S.S. and O’Sullivan, P.A. 1990. “Soil temperature, moisture and
compaction under zero and conventional tillage in central Alberta.” Soil Till. Res. 17, 167–172.
Melero, S., R. Lo pez-Garrido, J.M. Murillo, and F. Moreno. 2009. “Conservation
tillage: short-and long-term effects on soil carbon fractions and enzymatic activities under Mediterranean conditions.” Soil Tillage Res. 104 292e298.
Melero, S., R.J. Lo pez-Bellido, L. Lo pez-Bellido, V. Mun~oz-Romero, F.
Moreno, and J.M. Murillo. 2011. “Long-term effect of tillage, rotation and nitrogen fertiliser on soil quality in a Mediterranean Vertisol.” Soil Tillage Res. 114 97:107.
Morgan, J. and C. Winstanley. 1997. “Microbial biomarkers.” In: J. van Elsas et
al., editors, Modern soil microbiology. Marcel Dekker, New York. p. 331–352.
Mulvaney, R.L. 1996. “Nitrogen - Inorganic forms.” In Methods of Soil Analysis,
Part 3, Chemical Methods, Bigham JM and Bartels JM ed. SSSA-ASA, Madison, WI Etats-Unis, p. 1123-1184.

44
Nelson, D.W. and L.E. Sommers. 1996. “Total carbon, organic carbon and organic matter.” In: D.L. Sparks, editor, Methods of Soil Analysis: Chemical Methods, part 3, Soil Science Society of America, Madison, p. 961-1010.
Nyborg, M. and Malhi, S.S., 1989. “Effect of zero and conventional tillage on
barley yield and NO3-N content, moisture and temperature of soil in north-central Alberta.” Soil Till. Res. 15, 1–9
Oksanen, J., F. G. Blanchet, M. Friendly, R. Kindt, P. Legendre, D. McGlinn, P.
R. Minchin, R. B. O'Hara, G. L. Simpson, P. Solymos, M. Henry, H. Stevens, E. Szoecs, and H. Wagner. 2017. vegan: Community Ecology Package. R package version 2.4-2. https://CRAN.R-project.org/package=vegan
O’Leary, W.M. and S.G. Wilkinson. 1988. “Gram-positive bacteria.” In: C.
Ratledge and S.G. Wilkinson, editors, Microbial lipids. Academic Press, London. p. 117–185.
Paul, E.A. and F.E. Clark. 1988. Soil microbiology and biochemistry. Academic
Press, San Diego. Pennanen, T., Frostegard, A., Fritze, H., and Baath, E. 1996. “Phospholipid fatty
acid composition and heavy metal tolerance of soil microbial communities along two heavy metal polluted gradients in coniferous forest.” Applied and Environmental Microbiology 62, 420±428.
Perry D.A., Rose S., Pilz D., Schoenberger M.M. 1984. “Reduction of natural
ferric iron chelators in disturbed forest soils.” Soil Sci Soc Am J 48:379–382.
R Core Team. 2013. R: A language and environment for statistical computing. R
Foundation for Statistical Computing, Vienna, Austria. URL http://www.R-project.org/.
Ratledge, C. and S.G. Wilkinson. 1988. Microbial lipids. Academic Press,
London. Reji P., Mathew, F. Y., Githinji L., Ankumah R., and Balkcom K. S. 2012. "Impact
of No-Tillage and Conventional Tillage Systems on Soil Microbial Communities." Applied And Environmental Soil Science, Vol 2012 (2012) Directory of Open Access Journals, EBSCOhost (accessed May 29, 2017).

45
Schutter, M.E and R.P. Dick. 2000. Comparison of Fatty Acid Methyl Ester (FAME) methods for characterizing microbial communities. Soil Science Society of America Journal 64:1659- 1668.
Senthilkumar, K., S. Manian, and K. Udaiyan. 1997. "The effect of burning on soil
enzyme activities in natural grasslands in southern India." Ecological Research 12, no. 1: 21-25.
Singh, B. and Z. Rengel. 2007."The Role of Crop Residues in Improving Soil
Fertility." Soil Biology Nutrient Cycling in Terrestrial Ecosystems. 183-214. Accessed June 20, 2017. doi:10.1007/978-3-540-68027-7_7.
Trasar-Cepeda, C., M. Leiros, F. Gil-Sotres. 2008. “Hydrolytic enzyme activities
in agricultural and forest soils. Some implications for their use as indicators of soil quality.” Soil Biol. Biochem. 40 2146e2155.
Wiechmann, M. L, M. D. Hurteau, J. P. Kaye, and J. R. Miesel. 2015. "Macro-
particle charcoal C content following prescribed burning in a mixed-conifer forest, Sierra Nevada, California." Plos One 10, no. 8: e0135014. MEDLINE, EBSCOhost (accessed July 6, 2017).
Zelles L. 1997. “Phospholipid fatty acid profiles in selected members of soil
microbial communities.” Chemosphere. 35:275–294. Zelles, L. and Bai, Q.Y. 1994. “Fatty acid patterns of phospholipids and
lipopolysaccharides in environmental samples.” Chemosphere, 28, 391-411
Zhao, H., D.Q. Tong, Q. Lin, X. Lu, and G. Wang. 2012. "Effect of fires on soil
organic carbon pool and mineralization in a northeastern China wetland." Geoderma 189-190, 532-539. GeoRef, EBSCOhost (accessed June 24, 2016).

46
Chapter 3. Conclusions
Crop residues have been proven beneficial in improving soil fertility.
However, crop residue management practices impact the effectiveness of crop
residue on soil biological and chemical properties. With little research done on
prescribed fire as a crop residue management practice, we established this study
in order to determine the effects of prescribed fire, no-till, and conventional tillage
on soil organic matter, nutrients, soil enzyme activity, and soil microbial
community structure in wheat and corn stubble residue. Prescribed fire increased
NO3--N relative to no-till and conventional tillage in wheat stubble, which aligned
with our hypothesis. Prescribed fire also increased β-glucosidase activity relative
to conventional tillage but was similar to β-glucosidase activity observed in no-till.
Short term changes in organic matter, nutrients, and enzyme activity were
observed in prescribed fire, no-till, and conventional tillage. Shifts in microbial
communities were observed in wheat stubble residue with of Gram negative, total
bacteria, and actinomycetes dominating the prescribed fire soil and abundance of
AMF, saprophytic fungi, and fungi:bacteria dominated no-till and conventional
tillage soil. We were unable to determine effects of management practices on
microbial community structure on corn stubble residue based on the fatty acid
profiles we tested. While prescribed fire increased NO3--N and β-glucosidase
activity, similarities between management practices were observed in NH4+-N,
soil organic matter, and NAGase activity. Therefore, further research needs to be
done in order to determine the most efficient crop residue management practice
to optimize soil fertility.

47
Vita Autumn Danielle Acree was born and raised in Winnsboro, Louisiana. She
completed her B.S. in Environmental Management Systems at Louisiana State
University in Baton Rouge, Louisiana. She immediately entered her master’s
program at Louisiana State University under Dr. Lisa Fultz in the School of Plant,
Environmental, and Soil Sciences. Upon completion of her master’s degree, she
plans to attend Texas Tech University in Lubbock, Texas to pursue a doctorate
degree in Plant and Soil Science under Dr. David Weindorf.