Soil microbial and biochemical properties as affected by ... Balasubramanian.pdf ·...
14
Tropical Ecology 56(3): 289-302, 2015 ISSN 0564-3295 © International Society for Tropical Ecology www.tropecol.com Soil microbial and biochemical properties as affected by floods in different landuse systems of Burachapori Wildlife Sanctuary, northeast India D. BALASUBRAMANIAN, K. ARUNACHALAM * & A. ARUNACHALAM ** Restoration Ecology Lab., Department of Forestry, North Eastern Regional Institute of Science & Technology, Nirjuli 791109, Arunachal Pradesh, India Abstract: Changes in soil physico-chemical and biological properties as affected by floods were studied in different landuse systems present in and around the Burachapori wildlife sanctuary. Among soil physical properties, bulk density and water holding capacity of the soil samples decreased remarkably after the flood, while soil moisture increased in all the samples. Soil was acidic in grassland as compared to other landuse systems studied. However, the pH values showed an increasing trend in all the landuse systems following floods. Soil nutrients were affected significantly (P < 0.05) due to floods. Microbial biomass C, N and P values (g g -1 ) were greatest in forest soils (C = 920.43; N = 93.62; P = 45.64), followed by homegarden (C = 482.22; N = 91.16; P = 42.16) during both pre- and post-flood conditions. Among soil nutrients nitrogen loss was intense at surface soil (0 to 10 cm) in forest (ca. 121 %), followed by agriculture (ca. 90 %) and home garden (ca. 63 %) systems. Similarly, over all nutrient loss was greatest in forest, agriculture and home garden when compared to grassland and plantations. Soil dehydrogenase activity was greater after the flood at both 0 - 10 cm and 10 - 20 cm soil depths. In the top 0 - 10 cm soil, loss of microbial biomass C after flood was over 100 % in home garden (ca. 106 %), and below 70 % in the other landuse systems studied. Nonetheless, the loss of microbial biomass was severe at sub-surface (10 - 20 cm) soil in all the landuse systems. The contribution of microbial biomass N to soil total N pool increased in the surface soil as compared to the sub-surface soil during post-flood conditions. Amongst microbial-C and nutrients, the loss of microbial N was low (≤ 50 %) in all the landuse systems when compared to microbial C and P. Resumen: Se estudiaron los cambios en las propiedades físico-químicas y biológicas del suelo producidos por las inundaciones en diferentes sistemas de uso del suelo en el interior y alrededor del Santuario de Vida Silvestre Burachapori. Entre las propiedades físicas del suelo, la densidad aparente y la capacidad de retención de agua de las muestras de suelo disminuyeron notablemente después de la inundación, mientras que la humedad del suelo se incrementó en todas las muestras. El suelo fue ácido en los pastizales en comparación con los otros sistemas de uso del suelo estudiados. Sin embargo, los valores de pH tendieron a aumentar en todos los sistemas de uso de la tierra tras las inundaciones. Los nutrientes del suelo se vieron afectados significativamente (P < 0.05) debido a las inundaciones. Los valores más altos de C, N y P en la biomasa microbiana (g g -1 ) se registraron en los suelos forestales (C = 920.43; N = 93.62, P = 45.64), seguido por los huertos caseros (C = 482.22; N = 91.16, P = 42.16), tanto antes como después de las inundaciones. Entre los nutrientes del suelo, la pérdida * Corresponding Author; e-mail: [email protected] * Present Address: School of Environment and Natural Resources, Doon University, Dehradun 248001, Uttarakhand, India ** Present Address: Division of Natural Resource Management, Indian Council of Agricultural Research, KAB-II, Pusa, New Delhi 110012, India
Transcript of Soil microbial and biochemical properties as affected by ... Balasubramanian.pdf ·...
Tropical Ecology 56(3): 289-302, 2015 ISSN 0564-3295
© International Society for Tropical Ecology
www.tropecol.com
Soil microbial and biochemical properties as affected by floods in
different landuse systems of Burachapori Wildlife Sanctuary,
northeast India
D. BALASUBRAMANIAN, K. ARUNACHALAM* & A. ARUNACHALAM
**
Restoration Ecology Lab., Department of Forestry, North Eastern Regional Institute of
Science & Technology, Nirjuli 791109, Arunachal Pradesh, India
Abstract: Changes in soil physico-chemical and biological properties as affected by floods
were studied in different landuse systems present in and around the Burachapori wildlife
sanctuary. Among soil physical properties, bulk density and water holding capacity of the soil
samples decreased remarkably after the flood, while soil moisture increased in all the samples.
Soil was acidic in grassland as compared to other landuse systems studied. However, the pH
values showed an increasing trend in all the landuse systems following floods. Soil nutrients
were affected significantly (P < 0.05) due to floods. Microbial biomass C, N and P values (g g-1)
were greatest in forest soils (C = 920.43; N = 93.62; P = 45.64), followed by homegarden (C =
482.22; N = 91.16; P = 42.16) during both pre- and post-flood conditions. Among soil nutrients
nitrogen loss was intense at surface soil (0 to 10 cm) in forest (ca. 121 %), followed by
agriculture (ca. 90 %) and home garden (ca. 63 %) systems. Similarly, over all nutrient loss was
greatest in forest, agriculture and home garden when compared to grassland and plantations.
Soil dehydrogenase activity was greater after the flood at both 0 - 10 cm and 10 - 20 cm soil
depths. In the top 0 - 10 cm soil, loss of microbial biomass C after flood was over 100 % in home
garden (ca. 106 %), and below 70 % in the other landuse systems studied. Nonetheless, the loss
of microbial biomass was severe at sub-surface (10 - 20 cm) soil in all the landuse systems. The
contribution of microbial biomass N to soil total N pool increased in the surface soil as compared
to the sub-surface soil during post-flood conditions. Amongst microbial-C and nutrients, the
loss of microbial N was low (≤ 50 %) in all the landuse systems when compared to microbial C
and P.
Resumen: Se estudiaron los cambios en las propiedades físico-químicas y biológicas del
suelo producidos por las inundaciones en diferentes sistemas de uso del suelo en el interior y
alrededor del Santuario de Vida Silvestre Burachapori. Entre las propiedades físicas del suelo,
la densidad aparente y la capacidad de retención de agua de las muestras de suelo
disminuyeron notablemente después de la inundación, mientras que la humedad del suelo se
incrementó en todas las muestras. El suelo fue ácido en los pastizales en comparación con los
otros sistemas de uso del suelo estudiados. Sin embargo, los valores de pH tendieron a
aumentar en todos los sistemas de uso de la tierra tras las inundaciones. Los nutrientes del
suelo se vieron afectados significativamente (P < 0.05) debido a las inundaciones. Los valores
más altos de C, N y P en la biomasa microbiana (g g-1) se registraron en los suelos forestales (C
= 920.43; N = 93.62, P = 45.64), seguido por los huertos caseros (C = 482.22; N = 91.16, P =
42.16), tanto antes como después de las inundaciones. Entre los nutrientes del suelo, la pérdida
*Corresponding Author; e-mail: [email protected] *Present Address: School of Environment and Natural Resources, Doon University, Dehradun 248001, Uttarakhand,
India **Present Address: Division of Natural Resource Management, Indian Council of Agricultural Research, KAB-II, Pusa,
New Delhi 110012, India
290 SOIL PROPERTIES AS AFFECTED BY FLOOD
de nitrógeno fue intensa en el suelo superficial (0 a 10 cm) en el bosque (ca. 121 %), seguido de
lossistemas agrícolas (ca. 90 %) y de huerto casero (ca. 63 %). Asimismo, la pérdida general de
nutrientes fue mayor en los bosques, la agricultura y los huertos caseros, en comparación con los
pastizales y las plantaciones. La actividad de la deshidrogenasa del suelo fue mayor después de
la inundación tanto en la profundidad del suelo de 0 - 10 cm como en la de 10 - 20 cm. En el
suelo de 0 - 10 cm, la pérdida de C de la biomasa microbiana después de la inundación fue más
de100 % en el huerto casero (ca. 106 %), e inferior a 70 % en los otros sistemas de uso del suelo
estudiados. No obstante, la pérdida de biomasa microbiana fue severa en el suelo subsuperficial
(10 - 20 cm) en todos los sistemas de uso del suelo. La contribución del Ndela biomasa
microbiana al almacén total de N del suelo aumentó en el suelo superficial en comparación con
el suelo subsuperficial en condiciones post-inundación. Entre el C y los nutrientes microbianos,
la pérdida de N microbiano fue baja (≤ 50%) en todos los sistemas de uso del suelo en
comparación con el C y el P microbiano.
Resumo: Mudanças nas propriedades biológicas e físico-químicasdo solo afetado por
inundações foram estudados sob diferentes sistemas de uso do solo presentes em e ao redor do
Santuário de Vida Selvagem de Burachapori. Entre as propriedades físicas do solo, a densidade
aparente e a capacidade de retenção de água das amostras de solo diminuiram significativa
mente depois dainundação, enquanto que a humidade do solo aumentou em todas as amostras.
O solo era acídico na pastagem, em comparação com os outros sistemas de uso estudados. No
entanto, os valores do pH mostraram uma tendência crescente em todos os sistemas de uso do
solo na sequência das inundações. Devido às inundações, os nutrientes do solo foram afetados de
forma significativa (P < 0,05). Os valores C, N e P (g g-1) da biomassa microbiana foram
maiores em solos florestais (C = 920,43; N = 93,62, P = 45,64), seguido pelos quintais de casa (C
= 482,22; N = 91.16, P = 42.16), quer durante as condições de pré como de pós-cheias. Entre os
nutrientes do solo, a perda de azoto foi intensa na camada superficial (0 a 10 cm) em solos de
floresta (ca. 121 %), seguida pelo solo agrícola (ca. 90 %) e quintal de casa (ca. 63 %). De uma
forma similar,a perda global de nutrientes foi maior na floresta, agricultura e quintais de casa
quando comparada com as pastagens e plantações. A atividade da desidrogenase no solo foi
maior após a inundaçãoquer nas camadas de 0 - 10 cm e na de 10 - 20 cm de profundidade do
solo. Na camada 0 - 10 cm de solo, a perda de C da biomassa microbiana após a inundação foi
superior a 100 % no quintal de casa (cerca de 106 %), e abaixo de 70 % nos outros sistemas de
uso do solo estudados. No entanto, a perda de biomassa microbiana foi severana camada sub-
superfícial (10 - 20 cm) em todos os sistemas de uso do solo. A contribuição do N da biomassa
microbiana no conjunto do N total no solo aumentou na sua superfície, em comparação com o
solo sub-superfícial nas condições de pós-inundação. Entre o C e os nutrientes microbianos, a
perda de N microbiano foi baixa (≤ 50 %) em todos os sistemas de uso do solo em relação
aoverificado para o C e P microbianos.
Key words: Flood, landuse, enzyme activity, microbial biomass, soil.
Introduction
Climatic factors have become more significant
in recent times due to extreme climatic events
induced by intensive anthropogenic activities
affecting our ecosystem in multiple ways. One of
the extreme climate events being seasonal flooding
of rivers due to heavy rainfall. Such flooding could
cause mechanical injury to vegetation (Nilsson &
Svedmark 2002; Streng et al. 1989) or may result
in sediment deposition. In the process, soil
chemistry is also altered when O2 is depleted due
to submergence and the pH of the soils shifting
towards neutrality (Henderson & Patrick 1982).
Nonetheless, the flood events belong to natural
disturbances, which typically remove some or all
organisms from an area and initiate a sequence of
successive processes resulting in gradual recovery
of initial ecosystem properties (Lake 2000; Ogbodo
2011). India is the worst flood-affected country in

BALASUBRAMANIAN, ARUNACHALAM & ARUNACHALAM 291
the world after Bangladesh and accounts for one
fifth of the global death count due to floods
(Bhanumurthy et al. 2010). The most flood-prone
areas in India are the Brahmaputra and Ganga
River basins in Indo-Gangetic-Brahmaputra plains
in north and northeast India, which carry 60 % of
the nation’s total river flow. The present study was
carried out in one of the most vulnerable ecological
setting in the Brahmaputra river basin where
about 70 % of the total rainfall is mainly during
monsoon season that lasts for four months (June -
September). Due to heavy rainfall, river undergoes
heavy discharge vis-à-vis flood causing erosion of
the banks in the upper reaches and over-toping in
the lower segments (Biswas et al. 2000; Rawat et
al. 2013). In such cases, the major reason for the
floods is the indiscriminate deforestation that
leads to loosening of topsoil with rains (Bhanu-
murthy et al. 2010). This is quite evident in the
northeast Himalayan mountain regions, especially
in Arunachal Pradesh in the higher altitudes,
causing regular floods in the down-stream state,
Assam.
The flooding of yards, gardens, grassland, and
other agricultural lands can expectedly have
significant short and long-term effects on the soil.
For instance, flooding a soil affects physical,
chemical and biological processes in the soil
nutrient cycling of terrestrial ecosystems
(Ponnamperuma 1972). The water potential
‘upshock’ have been studied earlier (Kieft et al.
1987; Schimel et al.1999) on microbial community.
In the present study we presumed that upshock
during flood may induce multiple stress (viz.,
saturation, anoxia, erosion etc.) on microbial
biomass and thus nutrient immobilization. While
microbial biomass in soil have been established to
act as ‘sink’ and ‘source’ of plant nutrients in the
humid tropics, their post-flood dynamics vis-à-vis
soil enzymatic activities are poorly understood. In
addition, evaluating soil physico-chemical and
biological properties is important to find ways to
restore the soil quality and health in flooded/ or
post-flood conditions. Hence, it is hypothesized
that seasonal flood may reduce the nutrient
immobilization in microbial biomass. Thus, the
present study aims to evaluate the changes and
relationships amongst soil physico-chemical,
microbiological and biochemical properties as
influenced by floods in different landuse systems
existing in and around the Burachapori Wildlife
Sanctuary (BCWLS) located in south bank of
Brahmaputra River, Assam (northeast India).
Materials and methods
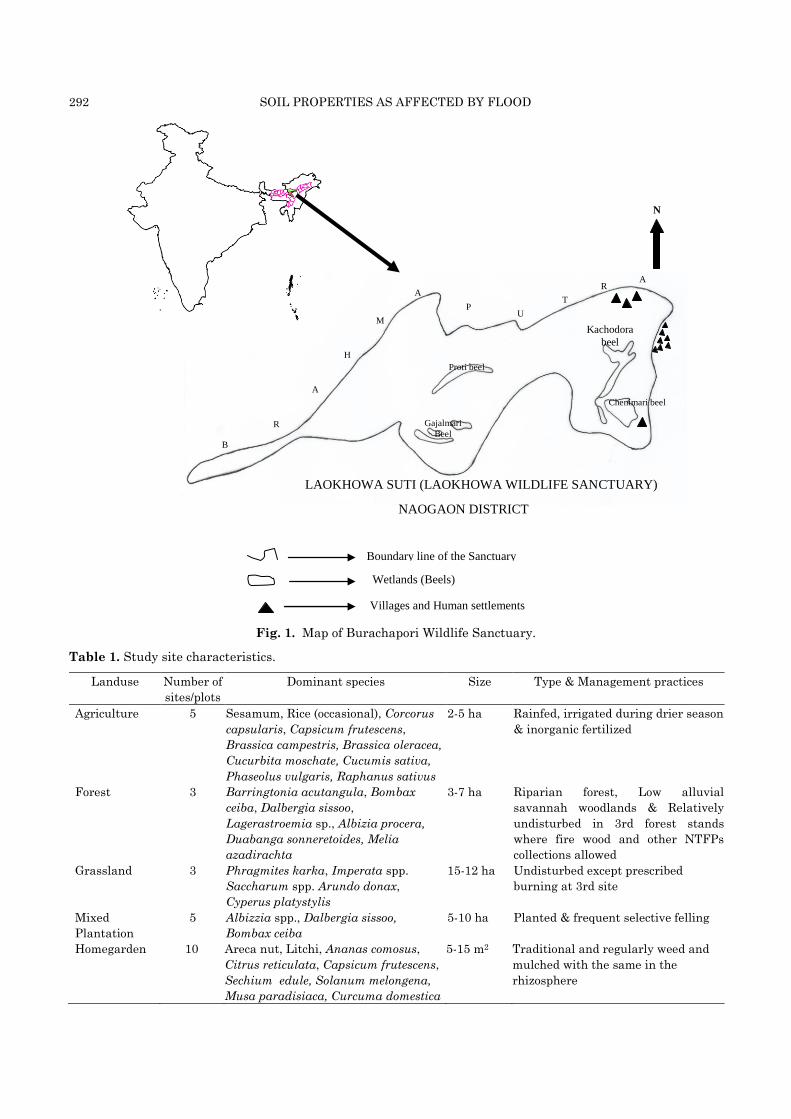
The study site
This study was conducted in Burachapori
Wildlife Sanctuary (latitude 26° 30' 32" N to 26° 33'
40" N and longitude 92° 35' 54" E to 92° 46' 07" E)
located on the south bank of the mighty river
Brahmaputra in Naogaon district of Assam in
North-eastern India (Fig. 1). It was declared as a
reserved forest (RF) in 1974, became a wildlife
sanctuary in 1995 covering an area of 44.06 km2
with forest type being alluvial flood plains in
nature. Soil was sandy loam and homogenous.
Major part of the sanctuary is covered by
grassland with patches of wetlands, locally known
as ‘beels’. There are 14 villages with a total of 1750
households and 12038 humans dominated by
immigrants belonging to Nepali, Bihari and
Bengali community, and 13594 cattle population in
and around the Burachapori Wildlife Sanctuary.
Wild animals include tiger, elephant, wild buffalos,
one horned rhinoceros, hog deer, wild boar besides
birds like Bengal Florian, Black necked stork,
Open billed stork, White eyed pochard, Millard,
Spotbill, Large whistling teal etc.. Dominant tree
species being Lagerastroemia sp., Bombax sp.,
Albizzia spp., Dalbergia sissoo, Zizyphus spp. etc.,
and the predominant grass are Imperata spp.
Cymbopogan spp., Alpinia spp. etc. Besides these,
witnessed aquatic macrophytes and wetland
associated plant species in the sanctuary are
Azolla pinnata, Eichhornia crassipes, Lemna
minor, Pistia stratiotes, Salvinia spp., Euryale
ferox, Nelumbo nucifera, Nymphaea nouchali,
Nymphoides cristatum, Nymphoides indicum,
Trapa spp., Hydrilla verticillata, Nechamandra
alternifolia, Vallisneria spiralis, Alternantha
sessiles, Cyperus platystylis, Cynodon dactylon,
Echinochloa stagnina, Eleocharis acutangula,
Enhydra fluctuans, Hygrorhiza aristata, Ipomoea
aquatica, Jussiaea repens, Polygonum flaccidum,
Scirpus eriophorum, Vetiveria zizanoides, Sagit-
taria trifolia etc.
The sanctuary is deeply flooded during
monsoon (May to September) while it remains dry
in winter (mid-November to February). During the
study period, the annual mean maximum and
minimum temperature varied between 33 °C and
16.7 °C respectively, annual total precipitation was
2000 mm with more than 80 % rainfall occurring
during the monsoon season (May-September).
Occasional rains also occurred during winter.
292 SOIL PROPERTIES AS AFFECTED BY FLOOD
Fig. 1. Map of Burachapori Wildlife Sanctuary.
Table 1. Study site characteristics.
Landuse Number of
sites/plots
Dominant species Size Type & Management practices
Agriculture 5 Sesamum, Rice (occasional), Corcorus
capsularis, Capsicum frutescens,
Brassica campestris, Brassica oleracea,
Cucurbita moschate, Cucumis sativa,
Phaseolus vulgaris, Raphanus sativus
2-5 ha Rainfed, irrigated during drier season
& inorganic fertilized
Forest 3 Barringtonia acutangula, Bombax
ceiba, Dalbergia sissoo,
Lagerastroemia sp., Albizia procera,
Duabanga sonneretoides, Melia
azadirachta
3-7 ha Riparian forest, Low alluvial
savannah woodlands & Relatively
undisturbed in 3rd forest stands
where fire wood and other NTFPs
collections allowed
Grassland 3 Phragmites karka, Imperata spp.
Saccharum spp. Arundo donax,
Cyperus platystylis
15-12 ha Undisturbed except prescribed
burning at 3rd site
Mixed
Plantation
5 Albizzia spp., Dalbergia sissoo,
Bombax ceiba
5-10 ha Planted & frequent selective felling
Homegarden 10 Areca nut, Litchi, Ananas comosus,
Citrus reticulata, Capsicum frutescens,
Sechium edule, Solanum melongena,
Musa paradisiaca, Curcuma domestica
5-15 m2 Traditional and regularly weed and
mulched with the same in the
rhizosphere
Villages and Human settlements
Wetlands (Beels)
Boundary line of the Sanctuary
B
A
H
M
A
P U
T
R A
R
Kachodora
beel
Chenimari beel
Proti beel
Gajalmari
Beel
LAOKHOWA SUTI (LAOKHOWA WILDLIFE SANCTUARY)
NAOGAON DISTRICT
N
BALASUBRAMANIAN, ARUNACHALAM & ARUNACHALAM 293
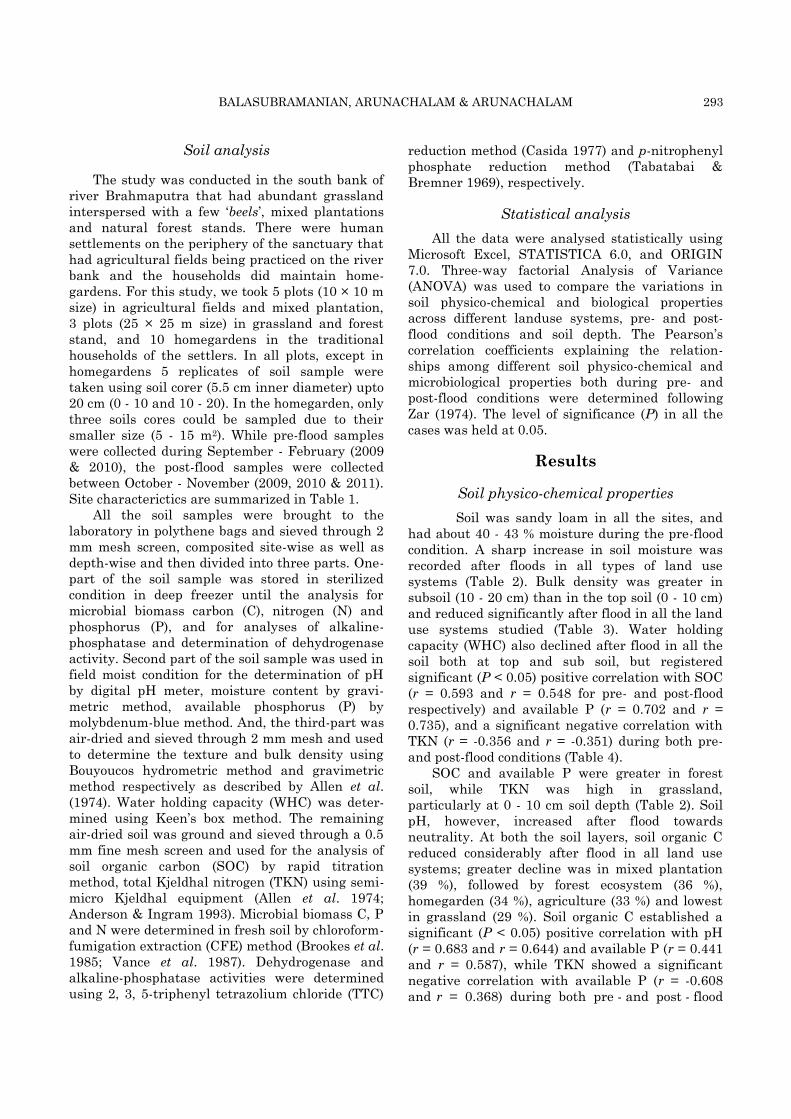
Soil analysis
The study was conducted in the south bank of
river Brahmaputra that had abundant grassland
interspersed with a few ‘beels’, mixed plantations
and natural forest stands. There were human
settlements on the periphery of the sanctuary that
had agricultural fields being practiced on the river
bank and the households did maintain home-
gardens. For this study, we took 5 plots (10 × 10 m
size) in agricultural fields and mixed plantation,
3 plots (25 × 25 m size) in grassland and forest
stand, and 10 homegardens in the traditional
households of the settlers. In all plots, except in
homegardens 5 replicates of soil sample were
taken using soil corer (5.5 cm inner diameter) upto
20 cm (0 - 10 and 10 - 20). In the homegarden, only
three soils cores could be sampled due to their
smaller size (5 - 15 m2). While pre-flood samples
were collected during September - February (2009
& 2010), the post-flood samples were collected
between October - November (2009, 2010 & 2011).
Site characterictics are summarized in Table 1.
All the soil samples were brought to the
laboratory in polythene bags and sieved through 2
mm mesh screen, composited site-wise as well as
depth-wise and then divided into three parts. One-
part of the soil sample was stored in sterilized
condition in deep freezer until the analysis for
microbial biomass carbon (C), nitrogen (N) and
phosphorus (P), and for analyses of alkaline-
phosphatase and determination of dehydrogenase
activity. Second part of the soil sample was used in
field moist condition for the determination of pH
by digital pH meter, moisture content by gravi-
metric method, available phosphorus (P) by
molybdenum-blue method. And, the third-part was
air-dried and sieved through 2 mm mesh and used
to determine the texture and bulk density using
Bouyoucos hydrometric method and gravimetric
method respectively as described by Allen et al.
(1974). Water holding capacity (WHC) was deter-
mined using Keen’s box method. The remaining
air-dried soil was ground and sieved through a 0.5
mm fine mesh screen and used for the analysis of
soil organic carbon (SOC) by rapid titration
method, total Kjeldhal nitrogen (TKN) using semi-
micro Kjeldhal equipment (Allen et al. 1974;
Anderson & Ingram 1993). Microbial biomass C, P
and N were determined in fresh soil by chloroform-
fumigation extraction (CFE) method (Brookes et al.
1985; Vance et al. 1987). Dehydrogenase and
alkaline-phosphatase activities were determined
using 2, 3, 5-triphenyl tetrazolium chloride (TTC)
reduction method (Casida 1977) and p-nitrophenyl
phosphate reduction method (Tabatabai &
Bremner 1969), respectively.
Statistical analysis
All the data were analysed statistically using
Microsoft Excel, STATISTICA 6.0, and ORIGIN
7.0. Three-way factorial Analysis of Variance
(ANOVA) was used to compare the variations in
soil physico-chemical and biological properties
across different landuse systems, pre- and post-
flood conditions and soil depth. The Pearson’s
correlation coefficients explaining the relation-
ships among different soil physico-chemical and
microbiological properties both during pre- and
post-flood conditions were determined following
Zar (1974). The level of significance (P) in all the
cases was held at 0.05.
Results
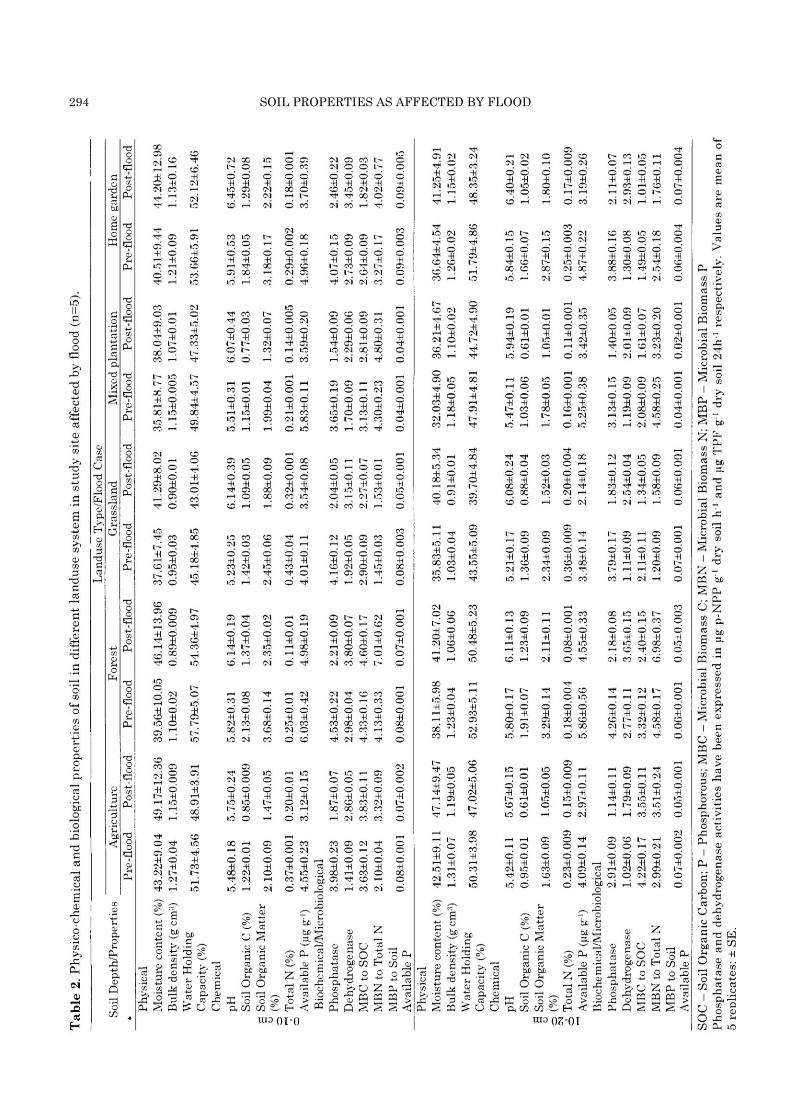
Soil physico-chemical properties
Soil was sandy loam in all the sites, and
had about 40 - 43 % moisture during the pre-flood
condition. A sharp increase in soil moisture was
recorded after floods in all types of land use
systems (Table 2). Bulk density was greater in
subsoil (10 - 20 cm) than in the top soil (0 - 10 cm)
and reduced significantly after flood in all the land
use systems studied (Table 3). Water holding
capacity (WHC) also declined after flood in all the
soil both at top and sub soil, but registered
significant (P < 0.05) positive correlation with SOC
(r = 0.593 and r = 0.548 for pre- and post-flood
respectively) and available P (r = 0.702 and r =
0.735), and a significant negative correlation with
TKN (r = -0.356 and r = -0.351) during both pre-
and post-flood conditions (Table 4).
SOC and available P were greater in forest
soil, while TKN was high in grassland,
particularly at 0 - 10 cm soil depth (Table 2). Soil
pH, however, increased after flood towards
neutrality. At both the soil layers, soil organic C
reduced considerably after flood in all land use
systems; greater decline was in mixed plantation
(39 %), followed by forest ecosystem (36 %),
homegarden (34 %), agriculture (33 %) and lowest
in grassland (29 %). Soil organic C established a
significant (P < 0.05) positive correlation with pH
(r = 0.683 and r = 0.644) and available P (r = 0.441
and r = 0.587), while TKN showed a significant
negative correlation with available P (r = -0.608
and r = 0.368) during both pre - and post - flood
294 SOIL PROPERTIES AS AFFECTED BY FLOOD

BALASUBRAMANIAN, ARUNACHALAM & ARUNACHALAM 295
Table 3. Three-way factorial ANOVA for soil physico-chemical and microbiological properties.
Source of Variations
Factors/F-Values
LT (df=4) SD (df=1) FC (df=1)
Interactions
LT*SD
(df=4)
LT*FC
(df=4)
SD*FC
(df=1)
LT*SD*FC
(df=4)
Physical Properties
Moisture content (%) 300.34* 167.59* 519.05* 5.30* 3.62* 0.45ns 6.56*
Bulk density (g cm3) 100.04* 36.56* 129.76* 5.39* 3.73* 0.22ns 0.71ns
Water holding capacity (%) 225.33* 118.16* 131.71* 3.30* 0.16ns 2.24ns 1.04ns
Chemical Properties
pH 90.52* 6.54* 531.08* 0.22ns 25.97* 0.59ns 0.17ns
SOC (%) 240.50* 89.91* 642.47* 1.33ns 12.72* 0.52ns 1.08ns
TKN (%) 37.65* 34.33* 109.90* 2.22ns 1.69ns 2.05ns 1.48ns
Available P (µg g-1) 686.46* 276.43* 2564.88* 23.01* 48.50* 9.82* 19.17*
Microbiological Properties
Microbial C (µg g-1) 32822.42* 44208.51* 60340.83* 2506.54* 1848.42* 18.25* 350.08*
Microbial N (µg g-1) 358.01* 1792.36* 2182.90* 66.63* 49.77* 11.04* 2.35ns
Microbial P (µg g-1) 177.40* 349.64* 597.83* 5.05* 3.87* 0.17ns 1.31ns
Enzyme Activities
Phosphatase 262.25* 327.55* 8304.88* 37.54* 15.07* 18.88* 5.13*
Dehydrogenase 762.61* 837.86* 2502.72* 45.02* 30.07* 12.10* 37.05*
% Contribution of Microbial Biomass to Soil C, N, P
MBC/SOC (%) 220.91* 250.94* 68.27* 27.83* 2.67* 12.97* 6.22*
MBN/TKN (%) 34.46* 1.53ns 7.48* 2.31ns 5.11* 3.14ns 0.61ns
MBP/Available P (%) 87.71* 95.80* 34.21* 5.90* 6.60* 0.69ns 4.66*
LT - Landuse Type; SD - Soil Depth; FC - Flood Case.
SOC - Soil Organic Carbon; TKN - Total Kjeldhal Nitrogen; P - Phosphorous; MBC - Microbial Biomass C; MBN -
Microbial Biomass N; MBP - Microbial Biomass P.
Phosphatase and Dehydrogenase expressed in µg p-NPP g-1 dry soil h-1 and µg TPF g-1 dry soil 24h-1 respectively.
*Values are significant (P < 0.05); ns - not significant; df - degree of freedom.
conditions (Table 4). Surprisingly, soil C/N ratio
inclined significantly after flooding in all the
landuse systems, except in mixed plantation and
home garden soils where the C/N ratio declined,
particularly at 10 - 20 cm soil depth. Although not
significant (P > 0.05), C/P ratio generally
decreased after floods (Table 2). In all, both C/N
and C/P ratios showed significant variations
between landuse types, apart from flooding effect.
But the variations were not significant between
soil depths. C/N (r = 0.589 and r = 0.730), and C/P
(r = 0.541 and r = 0.565) ratios had significant
positive correlation (P < 0.05) with SOC during
pre-flood as well as post-flood conditions (Table 4).
On the contrary, C/N ratio had negative
correlation with TKN both during pre-flood (r =
-0.716) and post-flood conditions (r = -0.664).
Nonetheless, the C/P ratio registered a significant
positive correlation (P < 0.05) with TKN.
Soil microbiological properties
Among different landuse types, microbial
biomass C, N and P was higher in forest
ecosystem, followed by home garden soil during
both pre- and post flood conditions (Fig. 1). Over
all, the microbial biomass (C, N and P) declined
significantly (F = 43.02, P < 0.05) after flood in all
the landuse systems. While comparing soil depths,
top 0 - 10 cm layer accounted for greater microbial
biomass C, N and P. The contribution of microbial
biomass C, N and P to soil organic C, total N and
available P respectively varied significantly bet-
296 SOIL PROPERTIES AS AFFECTED BY FLOOD
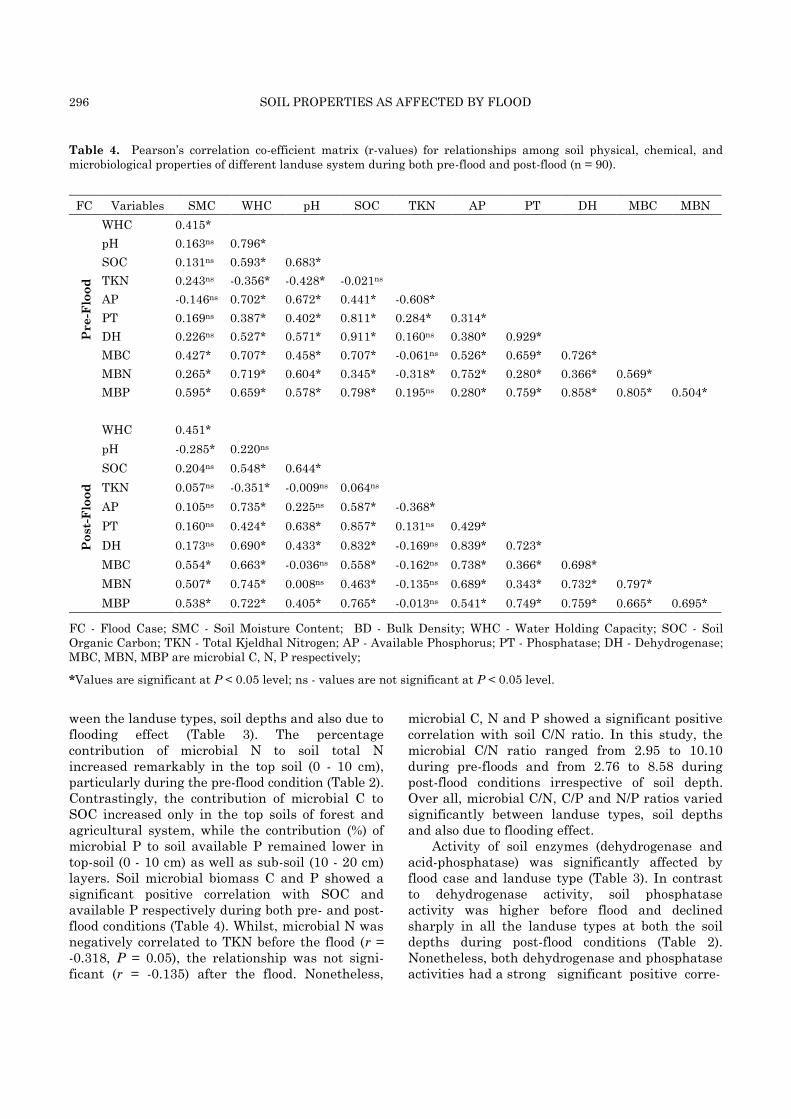
Table 4. Pearson’s correlation co-efficient matrix (r-values) for relationships among soil physical, chemical, and
microbiological properties of different landuse system during both pre-flood and post-flood (n = 90).
FC Variables SMC WHC pH SOC TKN AP PT DH MBC MBN
Pre
-Flo
od
WHC 0.415*
pH 0.163ns 0.796*
SOC 0.131ns 0.593* 0.683*
TKN 0.243ns -0.356* -0.428* -0.021ns
AP -0.146ns 0.702* 0.672* 0.441* -0.608*
PT 0.169ns 0.387* 0.402* 0.811* 0.284* 0.314*
DH 0.226ns 0.527* 0.571* 0.911* 0.160ns 0.380* 0.929*
MBC 0.427* 0.707* 0.458* 0.707* -0.061ns 0.526* 0.659* 0.726*
MBN 0.265* 0.719* 0.604* 0.345* -0.318* 0.752* 0.280* 0.366* 0.569*
MBP 0.595* 0.659* 0.578* 0.798* 0.195ns 0.280* 0.759* 0.858* 0.805* 0.504*
Po
st-
Flo
od
WHC 0.451*
pH -0.285* 0.220ns
SOC 0.204ns 0.548* 0.644*
TKN 0.057ns -0.351* -0.009ns 0.064ns
AP 0.105ns 0.735* 0.225ns 0.587* -0.368*
PT 0.160ns 0.424* 0.638* 0.857* 0.131ns 0.429*
DH 0.173ns 0.690* 0.433* 0.832* -0.169ns 0.839* 0.723*
MBC 0.554* 0.663* -0.036ns 0.558* -0.162ns 0.738* 0.366* 0.698*
MBN 0.507* 0.745* 0.008ns 0.463* -0.135ns 0.689* 0.343* 0.732* 0.797*
MBP 0.538* 0.722* 0.405* 0.765* -0.013ns 0.541* 0.749* 0.759* 0.665* 0.695*
FC - Flood Case; SMC - Soil Moisture Content; BD - Bulk Density; WHC - Water Holding Capacity; SOC - Soil
Organic Carbon; TKN - Total Kjeldhal Nitrogen; AP - Available Phosphorus; PT - Phosphatase; DH - Dehydrogenase;
MBC, MBN, MBP are microbial C, N, P respectively;
*Values are significant at P < 0.05 level; ns - values are not significant at P < 0.05 level.
ween the landuse types, soil depths and also due to
flooding effect (Table 3). The percentage
contribution of microbial N to soil total N
increased remarkably in the top soil (0 - 10 cm),
particularly during the pre-flood condition (Table 2).
Contrastingly, the contribution of microbial C to
SOC increased only in the top soils of forest and
agricultural system, while the contribution (%) of
microbial P to soil available P remained lower in
top-soil (0 - 10 cm) as well as sub-soil (10 - 20 cm)
layers. Soil microbial biomass C and P showed a
significant positive correlation with SOC and
available P respectively during both pre- and post-
flood conditions (Table 4). Whilst, microbial N was
negatively correlated to TKN before the flood (r =
-0.318, P = 0.05), the relationship was not signi-
ficant (r = -0.135) after the flood. Nonetheless,
microbial C, N and P showed a significant positive
correlation with soil C/N ratio. In this study, the
microbial C/N ratio ranged from 2.95 to 10.10
during pre-floods and from 2.76 to 8.58 during
post-flood conditions irrespective of soil depth.
Over all, microbial C/N, C/P and N/P ratios varied
significantly between landuse types, soil depths
and also due to flooding effect.
Activity of soil enzymes (dehydrogenase and
acid-phosphatase) was significantly affected by
flood case and landuse type (Table 3). In contrast
to dehydrogenase activity, soil phosphatase
activity was higher before flood and declined
sharply in all the landuse types at both the soil
depths during post-flood conditions (Table 2).
Nonetheless, both dehydrogenase and phosphatase
activities had a strong significant positive corre-

BALASUBRAMANIAN, ARUNACHALAM & ARUNACHALAM 297
Fig. 2. Soil microbial biomass C, N and P in top (0-10 cm) and subsoil (10-20 cm) layers in different landuse
systems during pre-flood (PRF) and post-flood (POF) conditions. (L1 – Agriculture; L2 – Forest; L3 – Grassland;
L4 – Mixed plantation; L5 – Home Garden).
(0 - 10 cm) (10 - 20 cm)
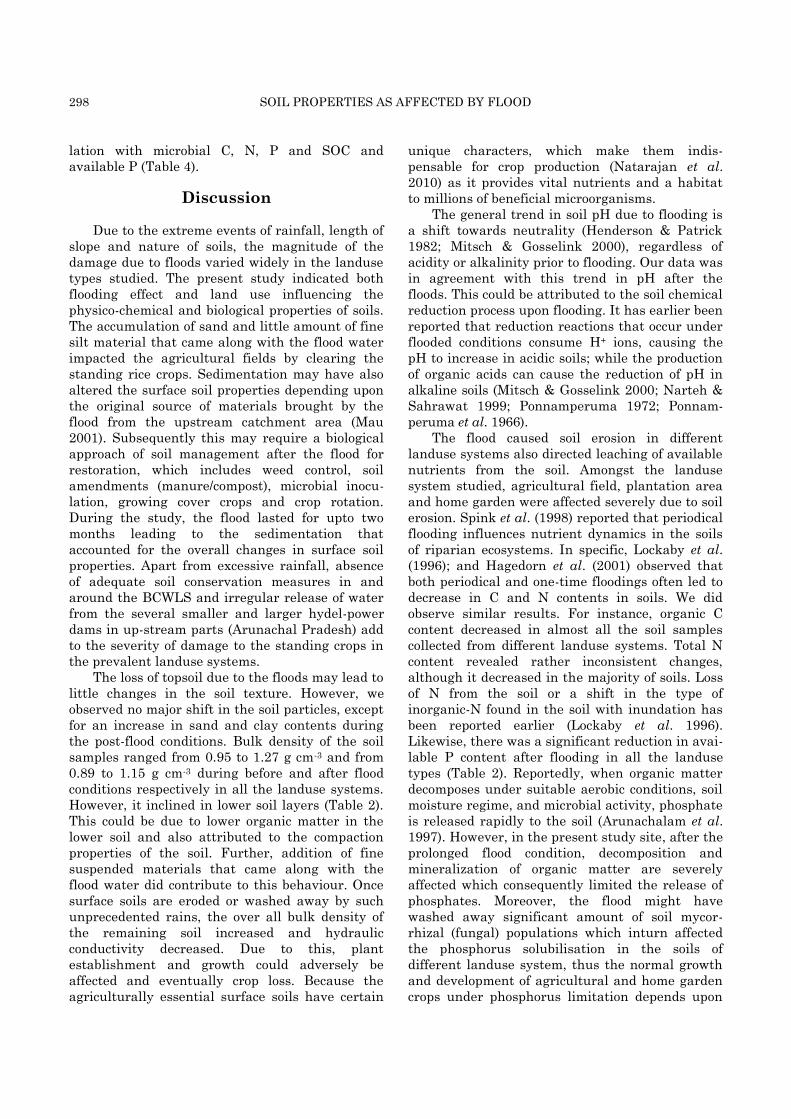
298 SOIL PROPERTIES AS AFFECTED BY FLOOD
lation with microbial C, N, P and SOC and
available P (Table 4).
Discussion
Due to the extreme events of rainfall, length of
slope and nature of soils, the magnitude of the
damage due to floods varied widely in the landuse
types studied. The present study indicated both
flooding effect and land use influencing the
physico-chemical and biological properties of soils.
The accumulation of sand and little amount of fine
silt material that came along with the flood water
impacted the agricultural fields by clearing the
standing rice crops. Sedimentation may have also
altered the surface soil properties depending upon
the original source of materials brought by the
flood from the upstream catchment area (Mau
2001). Subsequently this may require a biological
approach of soil management after the flood for
restoration, which includes weed control, soil
amendments (manure/compost), microbial inocu-
lation, growing cover crops and crop rotation.
During the study, the flood lasted for upto two
months leading to the sedimentation that
accounted for the overall changes in surface soil
properties. Apart from excessive rainfall, absence
of adequate soil conservation measures in and
around the BCWLS and irregular release of water
from the several smaller and larger hydel-power
dams in up-stream parts (Arunachal Pradesh) add
to the severity of damage to the standing crops in
the prevalent landuse systems.
The loss of topsoil due to the floods may lead to
little changes in the soil texture. However, we
observed no major shift in the soil particles, except
for an increase in sand and clay contents during
the post-flood conditions. Bulk density of the soil
samples ranged from 0.95 to 1.27 g cm-3 and from
0.89 to 1.15 g cm-3 during before and after flood
conditions respectively in all the landuse systems.
However, it inclined in lower soil layers (Table 2).
This could be due to lower organic matter in the
lower soil and also attributed to the compaction
properties of the soil. Further, addition of fine
suspended materials that came along with the
flood water did contribute to this behaviour. Once
surface soils are eroded or washed away by such
unprecedented rains, the over all bulk density of
the remaining soil increased and hydraulic
conductivity decreased. Due to this, plant
establishment and growth could adversely be
affected and eventually crop loss. Because the
agriculturally essential surface soils have certain
unique characters, which make them indis-
pensable for crop production (Natarajan et al.
2010) as it provides vital nutrients and a habitat
to millions of beneficial microorganisms.
The general trend in soil pH due to flooding is
a shift towards neutrality (Henderson & Patrick
1982; Mitsch & Gosselink 2000), regardless of
acidity or alkalinity prior to flooding. Our data was
in agreement with this trend in pH after the
floods. This could be attributed to the soil chemical
reduction process upon flooding. It has earlier been
reported that reduction reactions that occur under
flooded conditions consume H+ ions, causing the
pH to increase in acidic soils; while the production
of organic acids can cause the reduction of pH in
alkaline soils (Mitsch & Gosselink 2000; Narteh &
Sahrawat 1999; Ponnamperuma 1972; Ponnam-
peruma et al. 1966).
The flood caused soil erosion in different
landuse systems also directed leaching of available
nutrients from the soil. Amongst the landuse
system studied, agricultural field, plantation area
and home garden were affected severely due to soil
erosion. Spink et al. (1998) reported that periodical
flooding influences nutrient dynamics in the soils
of riparian ecosystems. In specific, Lockaby et al.
(1996); and Hagedorn et al. (2001) observed that
both periodical and one-time floodings often led to
decrease in C and N contents in soils. We did
observe similar results. For instance, organic C
content decreased in almost all the soil samples
collected from different landuse systems. Total N
content revealed rather inconsistent changes,
although it decreased in the majority of soils. Loss
of N from the soil or a shift in the type of
inorganic-N found in the soil with inundation has
been reported earlier (Lockaby et al. 1996).
Likewise, there was a significant reduction in avai-
lable P content after flooding in all the landuse
types (Table 2). Reportedly, when organic matter
decomposes under suitable aerobic conditions, soil
moisture regime, and microbial activity, phosphate
is released rapidly to the soil (Arunachalam et al.
1997). However, in the present study site, after the
prolonged flood condition, decomposition and
mineralization of organic matter are severely
affected which consequently limited the release of
phosphates. Moreover, the flood might have
washed away significant amount of soil mycor-
rhizal (fungal) populations which inturn affected
the phosphorus solubilisation in the soils of
different landuse system, thus the normal growth
and development of agricultural and home garden
crops under phosphorus limitation depends upon

BALASUBRAMANIAN, ARUNACHALAM & ARUNACHALAM 299
the need/requirement of phosphorus fertilization
for those soils/crops.
When surface soils are removed due to flood
and other natural disasters, the first negative
biochemical effect is on the soil organic matter and
microorganisms (Natarajan et al. 2010; Rawat et
al. 2013). In general, upon flooding, soils become
chemically reduced due to the rapid uptake
remaining oxygen in soils by the aerobes which
consequently might have resulted in significant
reduction in nutrient availability after the flood.
Moreover, the microbial decomposition of organic
matter content is relatively slow, ineffective and
incomplete under flooded or anaerobic soil
conditions. Tropical soils contain on an average
200 mg of soil microbial biomass in every kilogram
of the soil (Chander et al. 1997). The decrease in
microbial biomass (C, N and P) after flood in the
present investigation could be attributed to the
loss of organic matter, soil erosion and subsequent
reduction in microbial communities due to flood.
This is evident from the significant positive
correlations between soil C and the microbial
biomass (C, N and P). Arunachalam &
Arunachalam (2002) also observed similar trends
in flood affected areas in Arunachal Pradesh. If an
energy source is not added to soil and new biomass
is not synthesized, and hence microbial biomass
expectedly decline after releasing nutrients (Devi
et al. 2014; Watanabe et al. 1987). This also
indicates that organic matter input is necessary to
maintain soil microbial activity and mineralisation
process. Moreover, flood and waterlogging for one
or three months (June - August) effectively
prevented the aerobic decomposition of organic
remains. This means that aerobic bacteria that are
responsible for the oxidation of organic material
cannot survive in these prolonged waterlogging
conditions (Tiner 1999) which inturn lead to the
lower microbial biomass after the flood.
Watanabe & Inubushi (1986) observed that
microbial biomass measured by chloroform fumi-
gation increased at the soil surface and decreased
in the puddle layer during flooding. Further, they
estimated that the residence time of microbial
biomass N to be 33 days, which suggests that the
turnover of microbial biomass is much faster in
tropical-wetland soils. In the present study, the
available nutrient and microbial biomass nutrients
in subsurface soils in all the landuse types were
lower as compared with the top soils. This further
indicates that the organic amendments and
fertilization of sub-surface soils are necessary to
ensure rapid build-up of microbial populations and
initiate nutrient cycling (Natarajan et al. 2010).
Simultaneously, SOC, total N and available P also
decreased in the soil after flooding. This may have
favoured competition between plants and microbes
for nutrient sources. As a result microbial C, N
and P were also lower during post-flood conditions
in all the landuse systems.
While dehydrogenase activity increased signi-
ficantly in soils after flood (Tables 2 and 3),
phosphatase activity declined in both soil depths
(Table 2). Fewer studies have reported greater
dehydrogenase activity in flooded soils (Baruah &
Mishra 1984; Benckiser et al. 1984; Dkhar &
Mishra 1983; Tiwari et al. 1989), and attributed this
to decreased redox potential (Okazaki et al. 1983;
Pedrazzini & McKee 1984). However, soil enzy-
matic activities had significant relationships with
microbial biomass (C, N and P) which is in
conformity with the observations of Dick et al.
(1996) and McLatchey & Reddy (1998). The
phosphatase activity was found to have strong
significant positive correlations with SOC during
both flood case (pre- and post-flood). Corres-
pondingly, Jordan & Kremer (1994) and Aon &
Colaneri (2001) have shown significant correlations
amongst the activity of phosphatases (acid and
alkaline) and soil organic matter. In the present
study too, both phosphatase (r = 0.911) and
dehydrogenase (r = 0.832) activities significantly (P
< 0.05) correlated with soil organic C.
The relationship between soil physico-chemical
and microbiological properties was significantly
affected by the flood. This was marked by the
inconsistent correlation among physico-chemical,
biochemical and microbiological properties of soil
during pre- and post flood condition. The signi-
ficant negative correlation during pre-flood and
insignificant negative correlation after flood
conditions between TKN and microbial N confirms
that prolonged flood in all the landuse systems
substantially held for the nitrogen immobilisation
during and after flood. Apart from enhanced
nitrogen leaching, it also indicates rapid
consumption of available nitrates by the anaerobic
and facultative microbes during post-flood
condition. However, the relationship between SOC
and microbial C; and available P and microbial P
remained unaffected. Dehydrogenase activity
registered significant positive correlation (P <
0.05) with the MBC/SOC and MBN/TKN in flood
affected soil, whilst in pre-flood condition, the
correlation was not significant between them
(Table 4). It suggests that initial colonization and
recovering process of microbial activity in flooded
300 SOIL PROPERTIES AS AFFECTED BY FLOOD
soil. In the present study, it was established that
flood had considerable effect on the relationship
between the C/P ratio and microbial biomass
carbon. Evidently, there was no significant
correlation between C/P ratio and MBC after flood.
In conclusion, it could be said that soil
properties changed significantly after the flood.
There was an increase of soil moisture content, pH,
dehydrogenase activity and C/N ratio. At the same
time, WHC, organic C, total N, available P,
microbial nutrients and phosphatase (alkaline)
activity declined after flooding in different landuse
systems studied. The present results did not
confirm to the nutrient immobilization in microbial
biomass during upshocks, such as here in flood
case, but did reveal a marked increase in soil
dehydrogenase activity that is an indicator of soil
biochemistry. Nonetheless, the flood affected
agricultural and homegarden soils could be
restored by application of essential plant nutrients
such as N and P applied at normal rate as required
by the local farmers in order to restore the crop
yields food production system. While, soil enzy-
matic activity could be used as an indicator to
determine soil quality, amending soil with
available organic residues and ploughing after the
flood could resume the microbial activity which
may subsequently increase the plant available
nutrients for sustaining the net productivity and
ecosystem services per se.
Acknowledgments
We thank the Council of Scientific and
Industrial Research (CSIR) for financial support.
The authors are grateful to PCCF and Chief
Wildlife Warden of Burachapori Wildlife Sanc-
tuary (BCWLS), Govt. of Assam, for granting
permission to visit Sanctuary area and Dr. C.
Muthukumaravel (DFO), Mr. R. Das (Range
Officer) and Forest guards of the BCWLS for
providing necessary facilities during field study.
Mr. M. Ingti and Mr. D. Bhuyan assisted in
sampling collections and laboratory analyses.
Special thanks to the villagers in and around
BCWLS for permissions to sample in their
agricultural fields and home gardens.
References
Allen, S. E., H. M. Grimshaw, J. A. Parkinson & C.
Quarmby. 1974. Chemical Analysis of Ecological
Materials. Blackwell Scientific Publications, Oxford.
UK.
Anderson J. M. & J. S. I. Ingram. 1993. Tropical Soil
Biology and Fertility. A Handbook of Methods. 2nd
edn. CAB International, U.K.
Aon, M. A. & A. C. Colaneri. 2001. Temporal and spatial
evolution of enzymatic activities and physico-
chemical properties in an agricultural soil. Applied
Soil Ecology 18: 255-270.
Arunachalam, A. & K. Arunachalam. 2002. Dynamics of
soil microbial biomass as affected by flood in the
humid tropics. Indian Journal of Soil Conservation
30: 21-28.
Arunachalam, K., A. Arunachalam, R. S. Tripathi & H.
N. Pandey. 1997. Dynamics of microbial population
during the aggregation phase of a selectively logged
tropical humid forest in northeastern India.
Tropical Ecology 38: 333-341.
Baruah, M. & R. R. Mishra. 1984. Dehydrogenase and
urease activities in rice field soils. Soil Biology and
Biochemistry 16: 423-424.
Benckiser, G., S. Santiago, H. U. Neue, I. Watanabe & J.
C. G. Ottow. 1984. Effect of fertilization and
exudation, dehydrogenase activity, iron reducing
populations and Fe2+ formation in the rhizosphere of
rice (Oryza sativa L.) in relation to iron toxicity.
Plant and Soil 79: 305-316.
Bhanumurthy, V., P. Manjusree & G. Srinivasa Rao.
2010. Flood disaster management. pp. 283-296. In:
P. S. Roy, R. S. Dwivedi & D. Vijayan (eds.) Remote
Sensing Applications. National Remote Sensing
Centre, ISRO, Balanagar, Hyderabad, India.
Biswas, S. P., D. Baruah & A. Hazarika. 2000. An
experimental study of soil conservation using herba-
ceous plants in Majuli Island, Assam, India. The
Environmentalist 20: 19-27.
Brookes, P. C., A. Landman, G. Pruden & D. S.
Jenkinson. 1985. Chloroform fumigation and the
release of soil nitrogen: a rapid direct extraction
method for measuring microbial biomass nitrogen in
soil. Soil Biology and Biochemistry 17: 837-842.
Casida, L. E. 1977. Microbial metabolic activity in soil as
measured by dehydrogenase determinations.
Applied and Environmental Microbiology 34:
630-636.
Chander, K., S. Goyal, M. C. Mundra & K. K. Kapur.
1997. Organic matter, microbial biomass and
enzyme activity of soils under different crop
rotations in the tropics. Biology and Fertility of Soils
24: 306-310.
Devi, T. I., P. S. Yadava & S. C. Garkoti. 2014. Cattle
grazing influences soil microbial biomass in sub-
tropical grassland ecosystems at Nambol, Manipur,
northeast India. Tropical Ecology 55: 195-206.
BALASUBRAMANIAN, ARUNACHALAM & ARUNACHALAM 301
Dick, R. P., D. P. Breakwell & R. F. Turco. 1996. Soil
enzyme activities and biodiversity measurements as
integrative microbiological indicators. Methods for
assessing soil quality. Soil Science Society of
America Journal 9: 9-17.
Dkhar, M. S. & R. R. Mishra. 1983. Dehydrogenase and
urease activities of maize (Zea mays L.) field soils.
Plant and Soil 70: 327-333.
Hagedorn, F., J. B. Bucher & P. Schleppi. 2001.
Contrasting dynamics of dissolved inorganic and
organic nitrogen in soil and surface waters of
forested catchments with Gleysols. Geoderma 100:
173-192.
Henderson, R. E. & W. H. Patrick Jr. 1982. Soil aeration
and productivity. pp. 51-69. In: M. Rechcígl (ed.)
Handbook of Agricultural Productivity. Volume-I
Plant Productivity. CRC Press, Boca Raton, Florida.
Jordan, D. & R. J. Kremer. 1994. Potential use of
microbial activity as an indicator of soil quality. pp.
245-249. In: C. E. Pankhurst, B. M. Double, V. V. S.
R. Gupta & P. R. Grace (eds.) Soil Biota-Manage-
ment in Sustainable Farming Systems. CSIRO
Publications, Australia.
Kieft, L. T., E. Soroker & M. K. Firestone. 1987.
Microbial biomass response to a rapid increase in
water potential when a dry soil is wetted. Soil
Biology and Biochemistry 19: 119-126.
Lake, P. S. 2000. Disturbances, patchiness, and
diversity in streams. Journal of the North American
Benthological Society 19: 573-592.
Lockaby, B. G., R. S. Wheat & R. G. Clawson. 1996.
Influence of hydroperiod on litter conversion to soil
organic matter in a floodplain forest. Soil Science
Society of America Journal 60: 1989-1993.
Mau, D. P. 2001. Sediment Deposition and Trends and
Transport of Phosphorus and Other Chemical
Constituents, Cheney Reservoir Watershed, South-
central Kansas. U.S. Geological Survey (USGS)
Water-Resources Investigations Report 01-4085,
U.S.A.
Mitsch, W. J. & J. E. Gosselink. 2000. Wetlands. 3rd
edn. John Wiley & Sons, New York, U.S.A.
McLatchey, G. P. & K. R. Reddy. 1998. Regulation of
organic matter decomposition and nutrient release
in a wetland soil. Journal of Environmental Quality
27: 1268-1274.
Narteh, L. T. & K. L. Sahrawat. 1999. Influence of
flooding on electrochemical and chemical properties
of West African soils. Geoderma 87: 179-207.
Natarajan, A., R. Hegde, L. G. K. Naidu, A. Raizada, R.
N. Adhikari, S. L. Patil, K. Rajan & D. Sarkar.
2010. Soil and plant nutrient loss during the recent
floods in North Karnataka: Implications and
ameliorative measures. Current Science 99: 1333-
1340.
Nilsson, C. & M. Svedmark. 2002. Basic principles and
ecological consequences of changing water regimes:
Riparian plant communities. Environmental
Management 30: 468-480.
Ogbodo, E. N. 2011. Assessment of some soil fertility
characteristics of Abakaliki urban flood plains of
south-east Nigeria, for sustainable crop production.
World Journal of Agricultural Sciences 7: 489-495.
Okazaki, M., E. Hirata & K. Tensho. 1983. TTC
reduction in submerged soils. Soil Science and Plant
Nutrition 29: 489-497.
Pedrazzini, F. R. & K. L. McKee. 1984. Effect of flooding
on activities of dehydrogenase in rice (Oryza sativa
L.) roots. Soil Science and Plant Nutrition 30:
359-366.
Ponnamperuma, F. N. 1972. The chemistry of
submerged soils. Advances in Agronomy 24: 29-96.
Ponnamperuma, F. N., E. Martinez & T. Loy. 1966.
Influence of redox potential and partial pressure of
carbon dioxide on pH and the suspension effect of
flooded soils. Soil Science 101: 421-431.
Rawat, J. S., R. C. Joshi & M. Mesia. 2013. Estimation
of erosivity index and soil loss under different land
uses in the tropical foothills of eastern himalaya
(India). Tropical Ecology 54: 47-58.
Schimel, J. P., J. M. Gulledge, J. S. Clein-Curle, J. E.
Lindstrom & J. F. Braddock. 1999. Moisture effects
on microbial activity and community structure in
decomposing birch litter in the Alaskan taiga. Soil
Biology and Biochemistry 31: 831-838.
Spink, A., R. E. Sparks, M. van Oorshot & J. T. A.
Verhoeven. 1998. Nutrient dynamics of large river
floodplains. Regulated Rivers Research and Manage-
ment 14: 203-216.
Streng, D. R., J. S. Glitzenstein & P. A. Harcombe. 1989.
Woody seedling dynamics in an east Texas
floodplain forest. Ecological Monograph 59: 177-204.
Tabatabai, M. A. & J. M. Bremner. 1969. Use of p-
nitrophenyl phosphate for assay of soil phosphatase
activity. Soil Biology and Biochemistry 1: 301-307.
Tiner, R. W. 1999. Wetland Indicators: A Guide to
Identification, Delineation, Classification and
Mapping. CRC Press LLC, Lewis Publishers, Boca
Raton, Florida.
Tiwari, M. B., B. K. Tiwari & R. R. Mishra. 1989.
Enzyme activity and carbon dioxide evolution from
upland and wetland rice soil under three
agricultural practices in hilly regions. Biology and
Fertility of Soils 7: 359-364.

302 SOIL PROPERTIES AS AFFECTED BY FLOOD
Vance, E. D., P. C. Brookes & D. S. Jenkinson. 1987. An
extraction method for measuring soil microbial
biomass. Soil Biology and Biochemistry 19: 703-707.
Watanabe, I. & K. Inubushi. 1986. Dynamics of
available nitrogen in paddy soils. 1. Changes in
available N during rice cultivation and origin of N.
Soil Science and Plant Nutrition 32: 37-50.
Watanabe, I., S. K. De Datta & P. A. Roger. 1987.
Nitrogen cycling in wetland rice soils. pp. 239-256.
In: J. R. Wilson (ed.) Proceeding of Symposium on
Advances in Nitrogen Cycling in Agricultural
Ecosystems. Brisbane, Australia.
Zar, J. H. 1974. Biostatistical Analysis. Prentice-Hall
Inc., Englewood Cliffs, New Jersey.
(Received on 09.01.2013 and accepted after revisions, on 26.12.2013)