
Soil health: Impact of tillage, carbon, soil quality, and ... · tillage, carbon, soil quality and...
84
Don Reicosky, (Soil Scientist, Emeritus) Soil Health: impact of tillage, carbon, soil quality and biodiversity MORRIS "SOILS LAB" * USDA-ARS-MWA North Central Soil Conservation Research Laboratory Morris, MN USA Agricultural Research Service [email protected] Chippewa Watershed: Sustainable Agriculture and Soil Health Workshop Mar. 27, 2014
-
Upload
vuongthien -
Category
Documents
-
view
218 -
download
3
Transcript of Soil health: Impact of tillage, carbon, soil quality, and ... · tillage, carbon, soil quality and...

Don Reicosky,
(Soil Scientist, Emeritus)
by
Soil Health: impact of tillage, carbon, soil quality
and biodiversity
MORRIS
"SOILS LAB"
* USDA-ARS-MWA
North Central Soil
Conservation Research
Laboratory Morris, MN
USA
Agricultural
Research
Service
Chippewa Watershed: Sustainable
Agriculture and Soil Health Workshop Mar. 27, 2014
FPeters
Typewritten Text
wq-ppt2-18

It’s all about
“C” management!
Food Security
(Sustainability)
(mostly)

Activity: Education
Project/Program,
Restoration/
Conservation Project,
Volunteer Monitoring
Description: We
seek to improve
water quality
through increasing
awareness and
engaging the public
around watershed
issues while
promoting a healthy
agricultural,
industrial and
recreation based
economy for the
region
Chippewa Watershed Project

Carbon sequestration involves removing carbon from the
atmosphere via photosynthesis and storing it in different
components of terrestrial or aquatic ecosystems. Carbon
sequestration is enhanced by agricultural systems that
utilize conservation agriculture, incorporate cover crops,
rotate crops, add organic amendments, manage nutrients
efficiently, restore degraded soil, and convert land to
native vegetation or install permanently vegetated
conservation buffers. These practices improve soil
quality and increase soil organic matter, which in turn
increase water retention, reduce drought risk, improve
fertility, reduce erosion and protect water quality.
Soil Carbon Sequestration
and Water Quality
We depend on soil for our food supplies and many
other vital functions including water management.
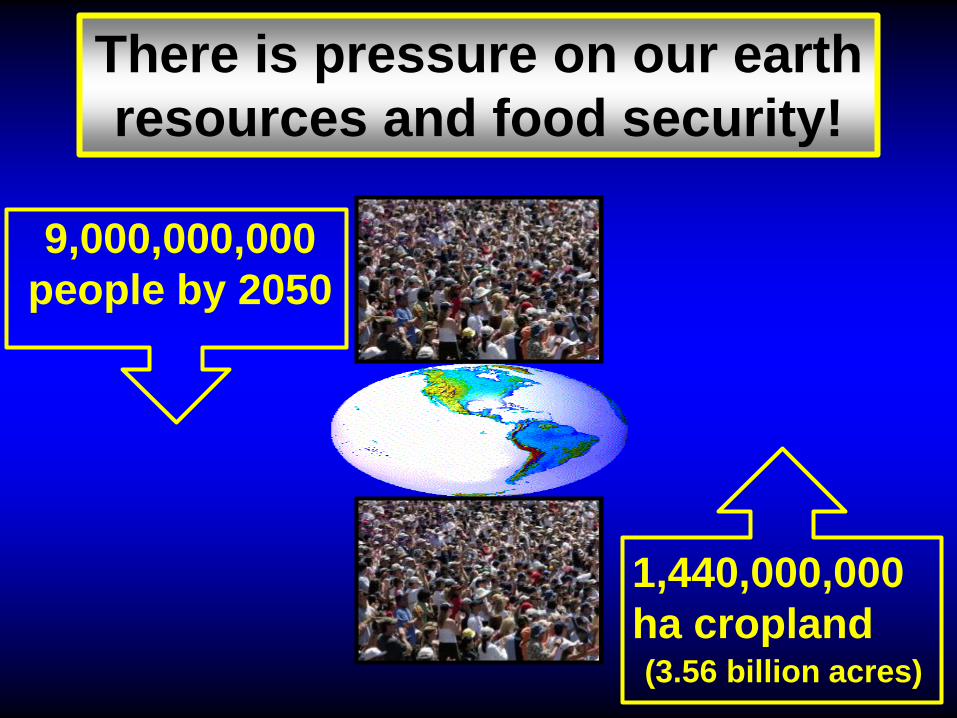
There is pressure on our earth
resources and food security!
1,440,000,000
ha cropland (3.56 billion acres)
9,000,000,000
people by 2050

OUR HUNGRY WORLD
OUR THREATENED PLANET
OUR CHILDREN’S FUTURE
OUR ONE CHANCE… Conservation Agriculture
All rest on “OUR LIVING SOIL” that depends on
soil organic carbon!
C
The “key” component is:

Food Security
Soil Organic Carbon
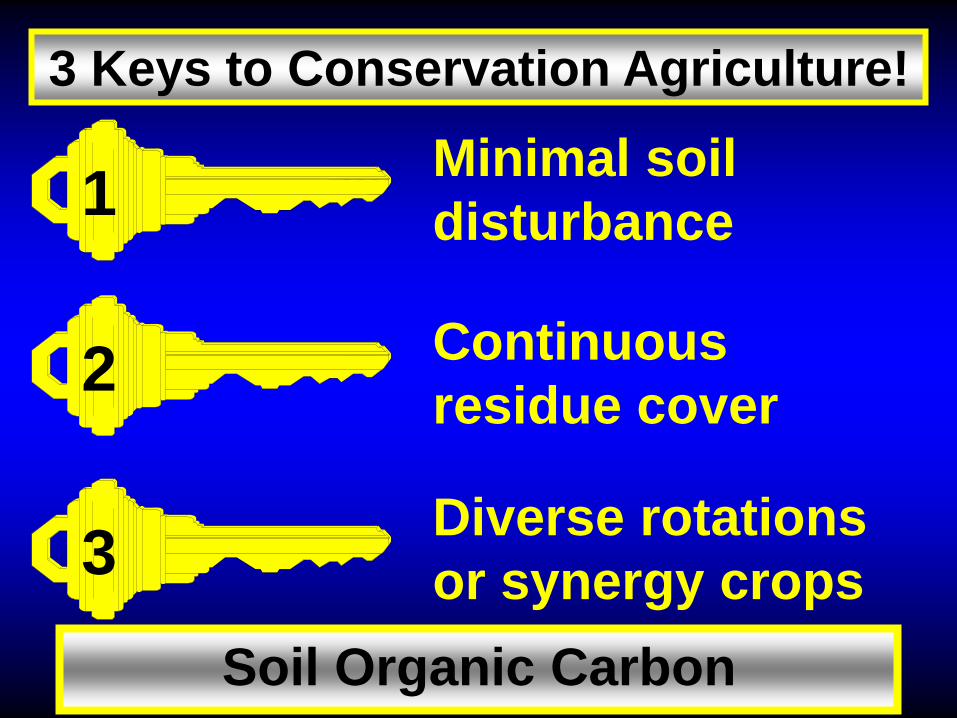
3 Keys to Conservation Agriculture!
1 Minimal soil
disturbance
2 Continuous
residue cover
3 Diverse rotations
or synergy crops
Soil Organic Carbon
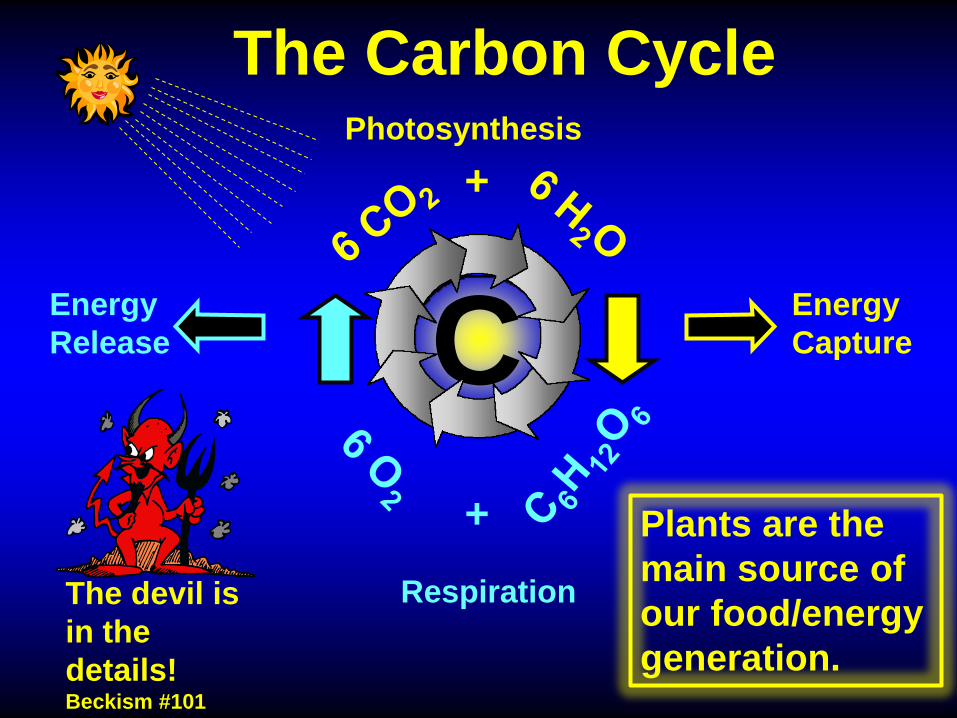
C
Photosynthesis
Energy
Capture
The Carbon Cycle
Respiration
Energy
Release
+
+
The devil is
in the
details! Beckism #101
Plants are the
main source of
our food/energy
generation.

C
C
C C
C
C
C
C C
C
C
C
C C C
C C
C
C
C C
C C C
C C
C C C
C C
C
C C C
C C
C C C
C
C
C
C C C
C C
C
C
C C
C C
C
C
C
C
C
C
C
C
C
C
C
C
C
C C
C
C
C
C
C
C
C
C
C
C
C
C
C
C
C
C
C
C
C
C
C
C
C C
C
C
C
C
C
C
C
C
C
C
C C C
C C
Plant Power
Carbon capture
Carbon storage
Energy storage
Food source
Energy source
Soil carbon input
Environmental
benefits
Quality of Life
View the plant as carbon! (~ 45% C)

Carbon is the “C” that starts
“C”onservation!
C
Conservation is more about plant management than soil
management because of the importance of carbon.

Food
Feed
Fuel
Fiber
C
Sun
Soil
Air Water
Ou
r R
es
ou
rces
Ecosystem Services

Nature’s Interdependent Tri-Cycles:
Water, Carbon, Nitrogen,
H2O C N
Tillage
Layer
Tillage disrupts the natural cycles!

H2O
Carbon is our greatest water management tool.
C
C Increases: infiltration, transpiration, soil tilth, soil
structure, available water holding
capacity, water use efficiency, water
storage, root depth,soil biological
activity, water quality, root and worm
bio-pores, aeration, nutrient cycling,
drainage
C Decreases: Soil runoff, erosion, evaporation,
sediments, temperature, crusting,
pollution, compaction, desertification,
“C” = live and dead plant
leaves, stems, roots, biomass,
residue, mulch layer, POM, SOM,
manure, humus and humic acids.
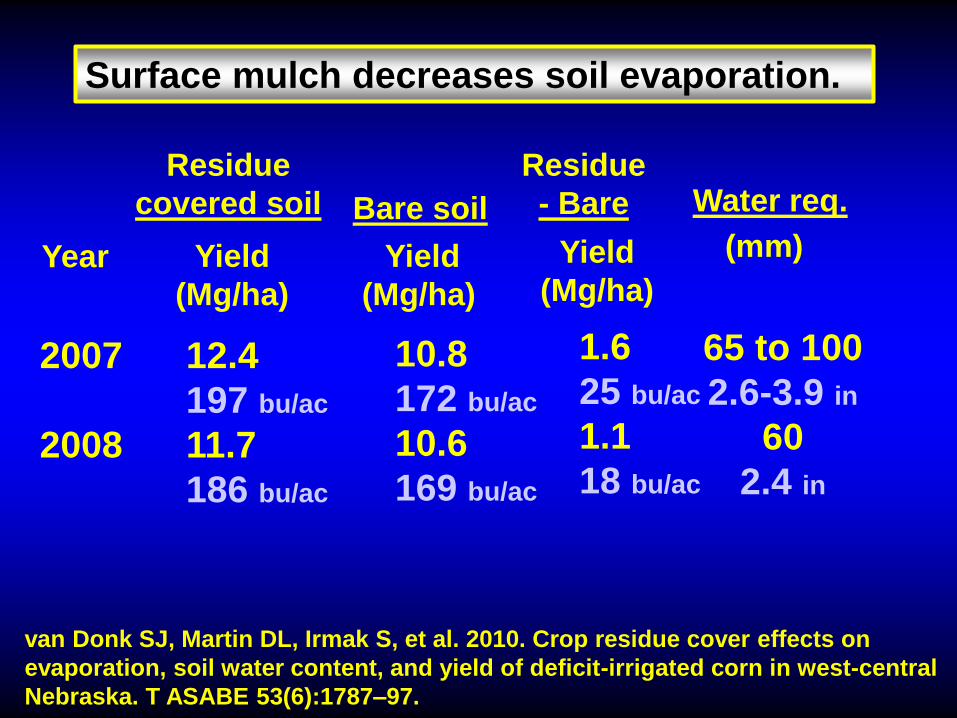
Residue
covered soil Bare soil
Year
2007
2008
Yield
(Mg/ha)
12.4
197 bu/ac
11.7
186 bu/ac
Yield
(Mg/ha)
10.8
172 bu/ac
10.6
169 bu/ac
65 to 100
2.6-3.9 in
60
2.4 in
(mm)
van Donk SJ, Martin DL, Irmak S, et al. 2010. Crop residue cover effects on
evaporation, soil water content, and yield of deficit-irrigated corn in west-central
Nebraska. T ASABE 53(6):1787–97.
Residue
- Bare
Yield
(Mg/ha)
1.6
25 bu/ac
1.1
18 bu/ac
Water req.
Surface mulch decreases soil evaporation.

Tillage-induced
Carbon Dioxide Loss
CO2CO2
No. 1 Environmental Enemy
in Production Agriculture

M = Mobile
R. = Research
G = Gas
E = Exchange
M = Machine
MR. GEM
Invisible effects of invisible forces!


Tillage Type
MP SS MK YK RM NT0
40
80
120
160
MP SS MK YK RM NT
Cu
m.
CO
2 L
os
s (
g C
O2 m
-2)
0
20
40
60
80
5 hours after tillage 24 hours after tillage
59.8
31.7
11.5
4.7 3.41.4
159.7
66.2
26.7
19.415.4
7.2
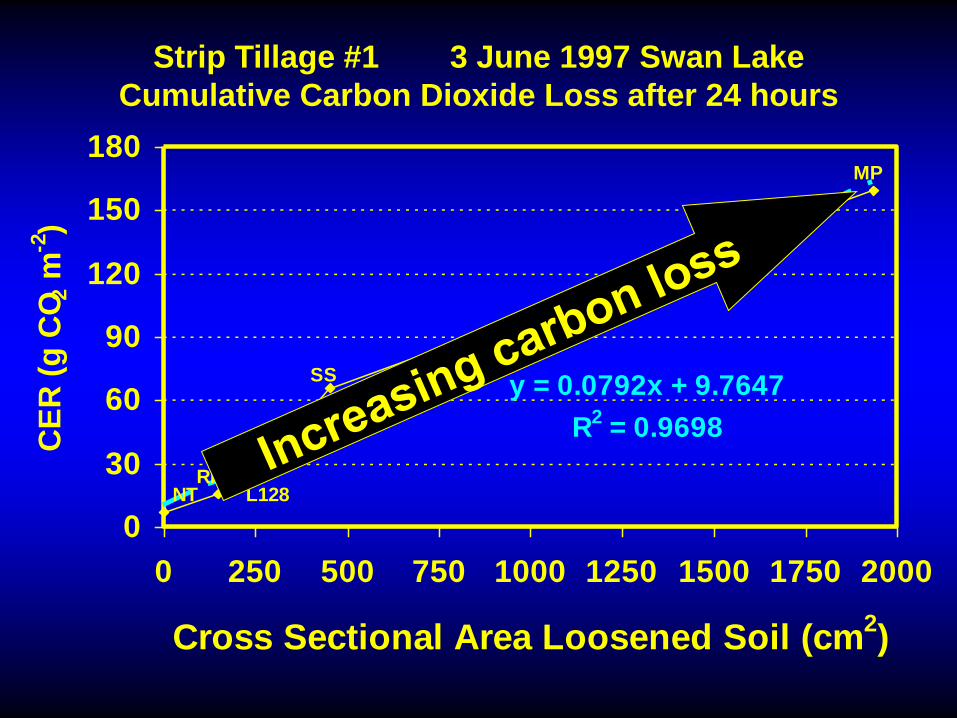
y = 0.0792x + 9.7647
R2 = 0.9698
0
30
60
90
120
150
180
0 250 500 750 1000 1250 1500 1750 2000
Cross Sectional Area Loosened Soil (cm2)
CE
R (
g C
O2 m
-2)
MP
SS
RM
MK
NT L128
Strip Tillage #1 3 June 1997 Swan Lake
Cumulative Carbon Dioxide Loss after 24 hours


Not Tilled
4 in.
100 mm
6 in.
152 mm
8 in.
203 mm
11 in.
280 mm
Soil Surface
1998 Plow Depth Study Swan Lake Farm

4 in.
100 mm
6 in.
152 mm 8 in.
203 mm 11 in.
280 mm
Not Tilled Soil Surface
12 Aug., 1998 Plow Depth Study Swan Lake Farm
24 hour cumulative CO2 losses (g CO2 m-2)
48
10
105
202 229

What do large “no-till”
seeders due to CO2 emissions?
Previous work showed tillage-
induced CO2 emissions were
proportional to soil volume
disturbed.

Low disturbance drill High disturbance drill
Comparison of No-Till Drills

Low disturbance drill Non
disturbed High disturbance drill
Disc Harrow Moldboard Plow

CO2 & H2O loss from Low vs High Disturbance Drills
0.38 0.35
3.01
0
1
2
3
4
5
None Low High
Disturbance Type
CO
2 l
os
s (
gC
O2
/m2
/h)
CO2 loss
Evaporation
0
0
0.2
0.4
0.6
0.8
1.0
Ev
ap
ora
tio
n (
mm
/h)
0.70
0.17
0.35
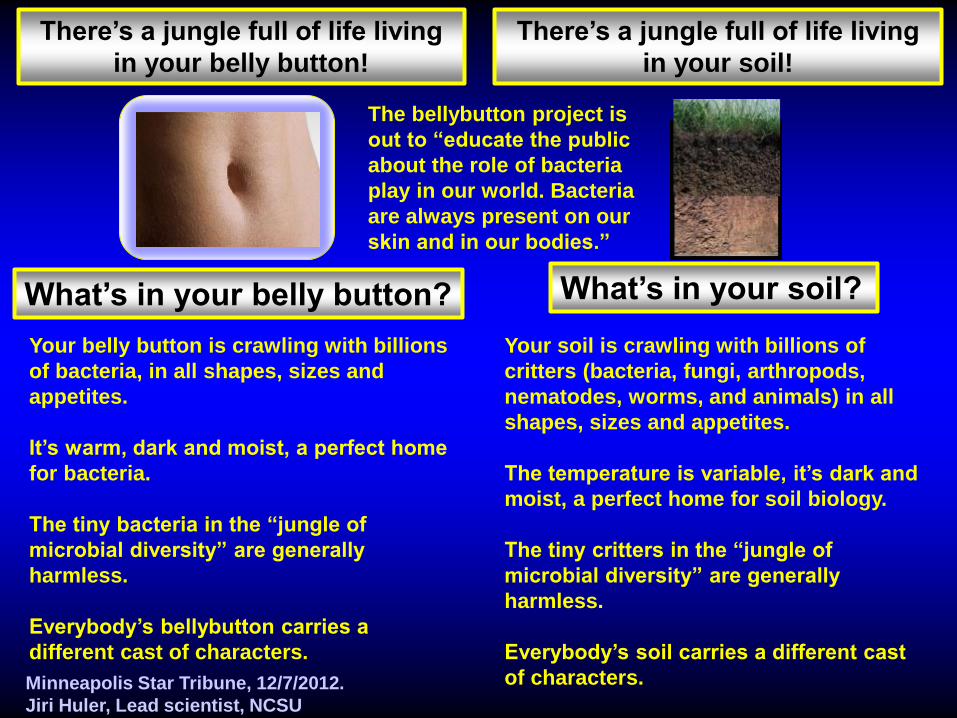
There’s a jungle full of life living
in your belly button!
There’s a jungle full of life living
in your soil!
Your belly button is crawling with billions
of bacteria, in all shapes, sizes and
appetites.
It’s warm, dark and moist, a perfect home
for bacteria.
The tiny bacteria in the “jungle of
microbial diversity” are generally
harmless.
Everybody’s bellybutton carries a
different cast of characters.
Minneapolis Star Tribune, 12/7/2012.
Jiri Huler, Lead scientist, NCSU
Your soil is crawling with billions of
critters (bacteria, fungi, arthropods,
nematodes, worms, and animals) in all
shapes, sizes and appetites.
The temperature is variable, it’s dark and
moist, a perfect home for soil biology.
The tiny critters in the “jungle of
microbial diversity” are generally
harmless.
Everybody’s soil carries a different cast
of characters.
What’s in your belly button? What’s in your soil?
The bellybutton project is
out to “educate the public
about the role of bacteria
play in our world. Bacteria
are always present on our
skin and in our bodies.”

5% OF SOIL ORGANIC MATTER IS LIVING ORGANISMS
http://www.rw.ttu.edu/2302_butler/chapter6.htm

Mammals - gophers, moles, mice, groundhogs
Earthworms - night crawlers, garden worms
Insects and mollusks - ants, beetles, centipedes, snails,
slugs
Microfauna - nematodes, protozoa, rotifers≈
Microflora - fungi, yeast, molds, mychorhiza
Actinomycetes - smaller than fungi, act like bacteria
Bacteria - autotrophs, heterotrophs, rhizobia, nitrobacter
Algae - green, blue-green
The “living soil”, a biological system.
≈
“That soil fauna and microbial action
is the equivalent of grazing two
African elephants per acre.”
Source: Jerry Hatfield, the director of USDA’s National Laboratory for Agriculture
and the Environment in Ames, Iowa.

A healthy population of earthworms will construct 3178 km of small
burrows and 1192 km of pencil thick burrows in a hectare of soil.
Earthworms will move tons of nutrients and soil on each hectare
every year and are our natural soil mixers.
Source: http://davidkusel.com/farm/nightcrawler1.htm
Nightcrawler's compost
pile called a midden
O
O
O
O
O
Earthworms are “nature’s” plow (and a lot more!)

Before
Primary
Tillage
After
Primary
Tillage
After
Secondary
Tillage
CO2 loss CO2 loss
Intensive tillage “butchers the biology” in
the soil. It cuts, slices, and dices the soil
and blend’s, mixes, and inverts the soil
creating havoc for the soil biology (fauna).

The soil is a natural living system that contains a lot of life and
when tilled intensively is dramatically changed. It can be
considered analogous to human reaction to a combination of:
earthquake
forest fire tsunami
tornado hurricane
all rolled into one perturbation event!
asteroid
impact
Tillage is a biotic disturbance!
“Turmoil of Tillage”

Intensive soil tillage opens the “all you can
eat buffet” for the birds and microbes.
Earthworms are allergic to cold steel! Mike Bell
Tillage creates twin problems:
-- Accelerated soil degradation
-- Accelerated soil erosion
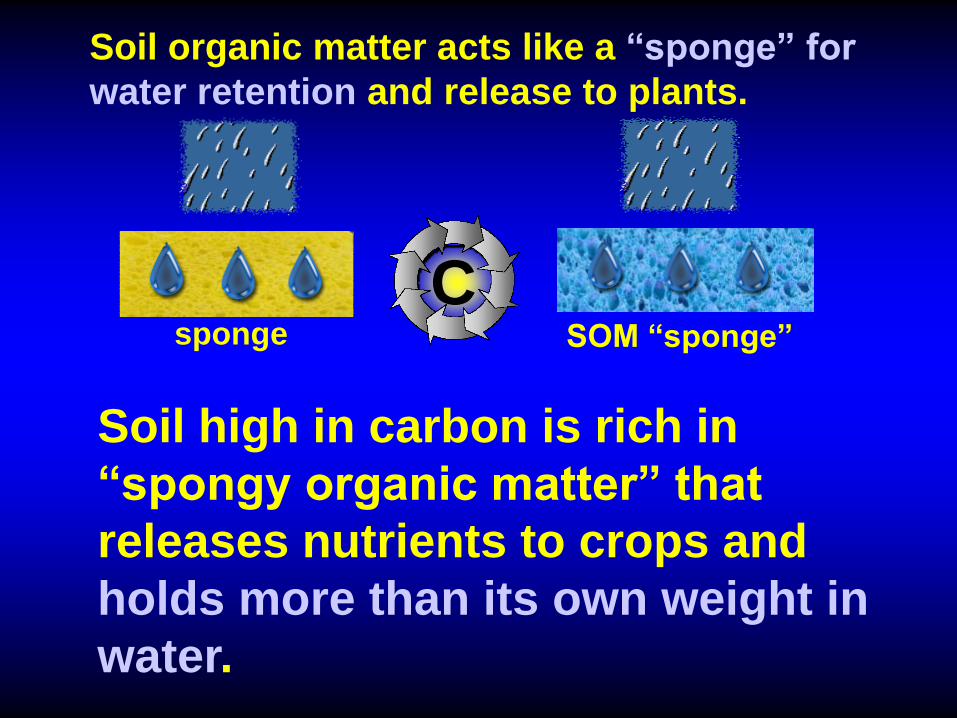
Soil organic matter acts like a “sponge” for
water retention and release to plants.
Soil high in carbon is rich in
“spongy organic matter” that
releases nutrients to crops and
holds more than its own weight in
water.
SOM “sponge” sponge
C

Available water capacity (AWC) is analogous to a
bucket. The larger the “bucket”, the more water
stored available to the plants.
Source: Dept. of Agriculture Bulletin 462, 1960
AWC = textural
water + SOM “sponge”
water
Sand, silt, clay
C
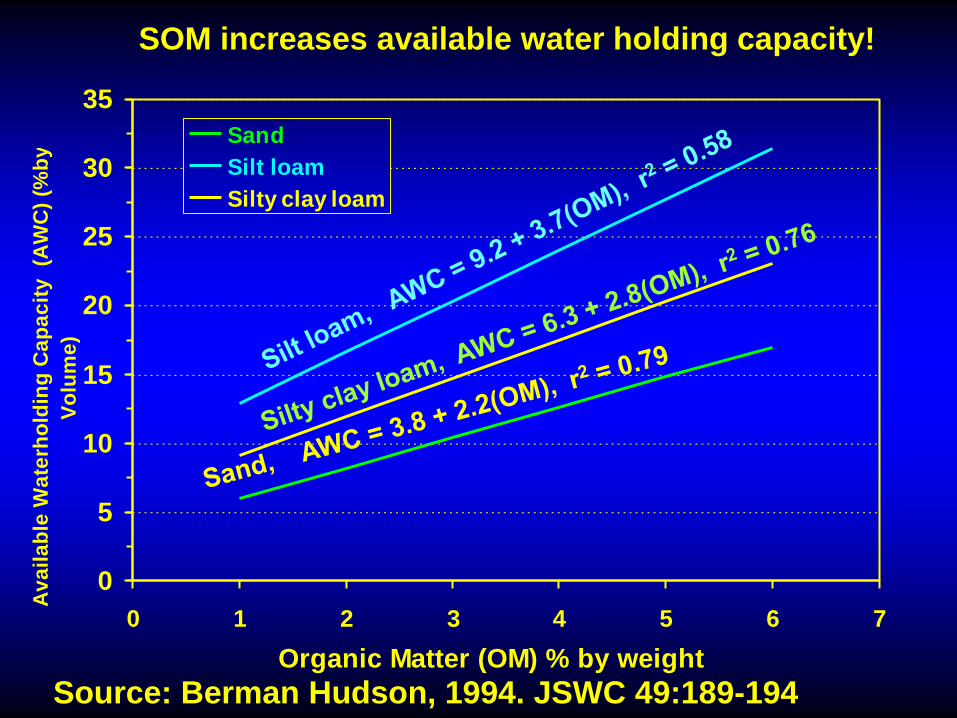
0
5
10
15
20
25
30
35
0 1 2 3 4 5 6 7
Organic Matter (OM) % by weight
Av
ail
ab
le W
ate
rho
ldin
g C
ap
ac
ity
(A
WC
) (%
by
Vo
lum
e)
Sand
Silt loam
Silty clay loam
Source: Berman Hudson, 1994. JSWC 49:189-194
SOM increases available water holding capacity!

Sand soil Available Water holding Capacity (AWC)
(cm H2O/ 25 cm soil)
(in. H2O/ ft. soil)
SOM = 0% 1% 2% 3%
1.0 cm
0.48 in.
1.5 cm
0.72 in.
2.0 cm
0.96 in.
2.6 cm
1.25 in.
Source: Berman Hudson, 1994. JSWC 49:189-194.
soil
matrix
water
Soil organic matter “sponge” water +

Silt loam soil Available Water holding Capacity (AWC)
(cm H2O/ 25 cm soil)
(in. H2O/ ft. soil)
SOM = 0% 1% 2% 3%
2.3 cm
1.10 in.
3.2 cm
1.54 in.
4.2 cm
2.02 in.
5.1 cm
2.45 in.
Source: Berman Hudson, 1994. JSWC 49:189-194.
soil
matrix
water
Soil organic matter “sponge” water +
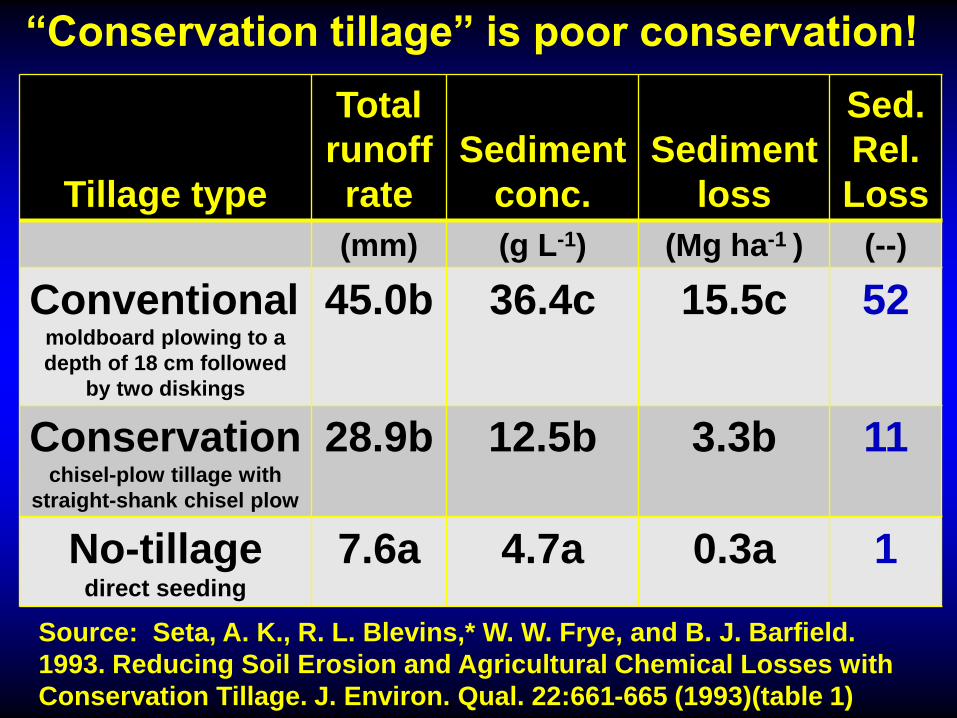
Tillage type
Total
runoff
rate
Sediment
conc.
Sediment
loss
Sed.
Rel.
Loss
(mm) (g L-1) (Mg ha-1 ) (--)
Conventional moldboard plowing to a
depth of 18 cm followed
by two diskings
45.0b 36.4c 15.5c 52
Conservation chisel-plow tillage with
straight-shank chisel plow
28.9b 12.5b 3.3b 11
No-tillage direct seeding
7.6a 4.7a 0.3a 1
Source: Seta, A. K., R. L. Blevins,* W. W. Frye, and B. J. Barfield.
1993. Reducing Soil Erosion and Agricultural Chemical Losses with
Conservation Tillage. J. Environ. Qual. 22:661-665 (1993)(table 1)
“Conservation tillage” is poor conservation!
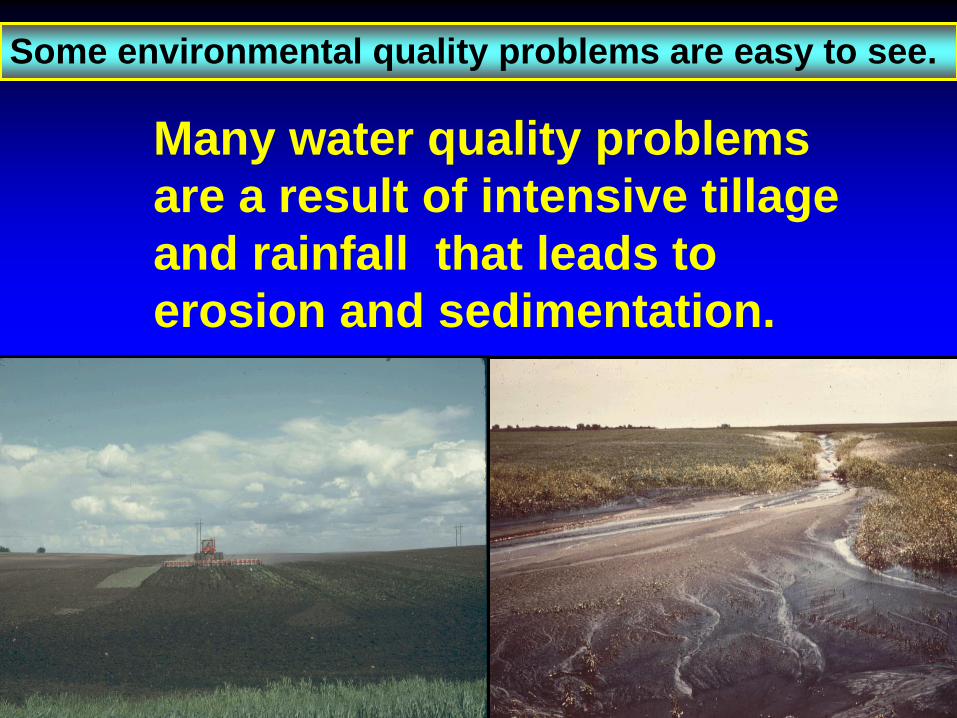
Many water quality problems
are a result of intensive tillage
and rainfall that leads to
erosion and sedimentation.
Some environmental quality problems are easy to see.

Last year’s crop
residue-with tall stalks
left in the soil-help
protect this field. No till
and residue
management help
prevent soil erosion
and polluted runoff
A 3 to 4 inch deep fan
of mud fills the
bottom of this large,
steep and unprotected
field. Multiple gullies
scar the sloping land
at this location.
Conventional tillage (inversion)
- unprotected soils.
“Conservation tillage” (non-inversion)
- poorly protected soils.
No-Tillage (direct seeding)
- fully protected soils.
Poor “Conservation” Has Consequences!
Even good residue
management is no longer
enough to protect soil
and water, supporting
practices such as grass
waterways and buffers
are needed to stand up to
heavy rains.
Photo credits: Environmental Working Group, 2013
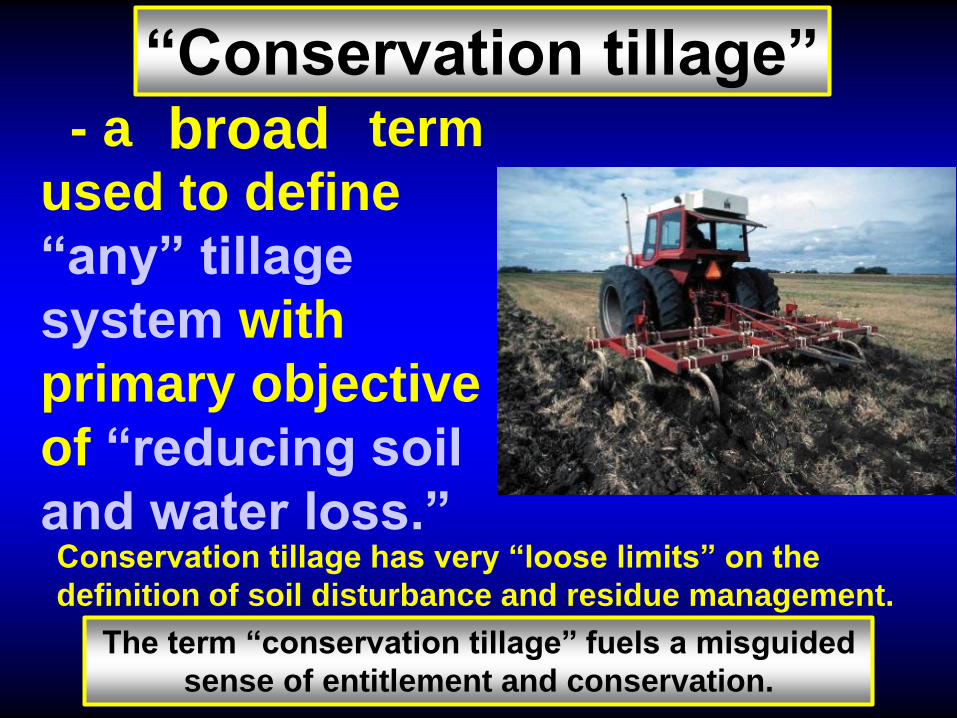
- a term
used to define
“any” tillage
system with
primary objective
of “reducing soil
and water loss.”
broad
Conservation tillage has very “loose limits” on the
definition of soil disturbance and residue management.
“Conservation tillage”
The term “conservation tillage” fuels a misguided
sense of entitlement and conservation.

What is Conservation Tillage?
The phrase “conservation tillage” is an oxymoron. An
oxymoron is a figure of speech in which incongruous or
contradictory terms appear side by side.
Any form of intensive tillage is not a form of conservation
for the way intensive tillage degrades and fractures the
natural soil structure. Tillage destroys or disturbs the
ecosystems of soil fauna so important for nutrient cycling.
Tillage moves the soil down slope via tillage erosion.
Intensive tillage loosens the soil and buries the crop
residue, allowing the soil to dry, setting up the system for
severe erosion with the next high-intensity rainfall event.
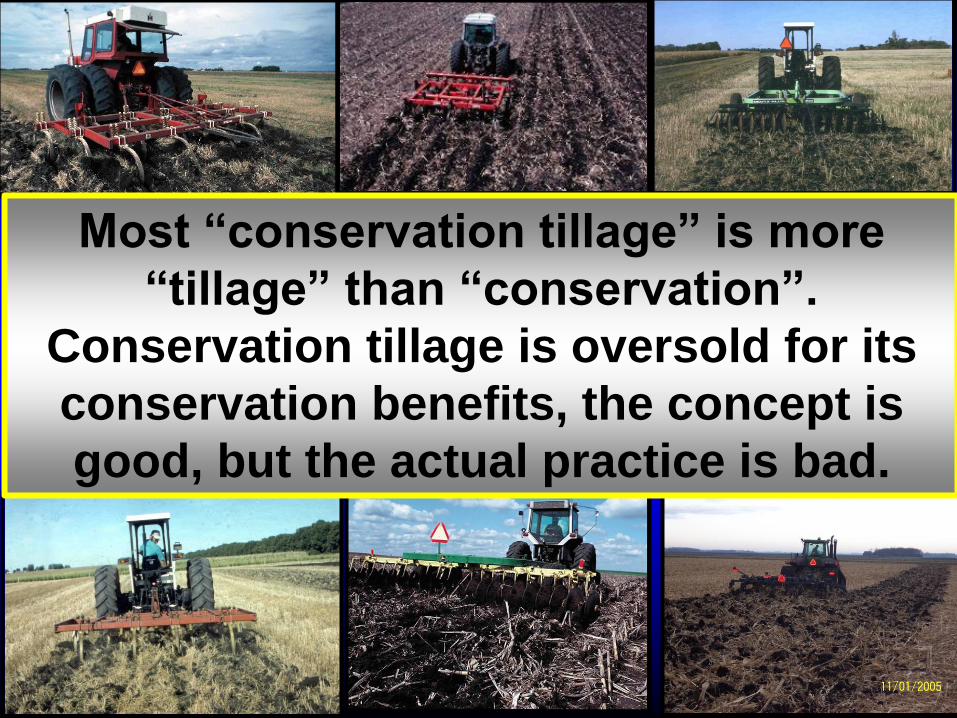
Most “conservation tillage” is more
“tillage” than “conservation”.
Conservation tillage is oversold for its
conservation benefits, the concept is
good, but the actual practice is bad.
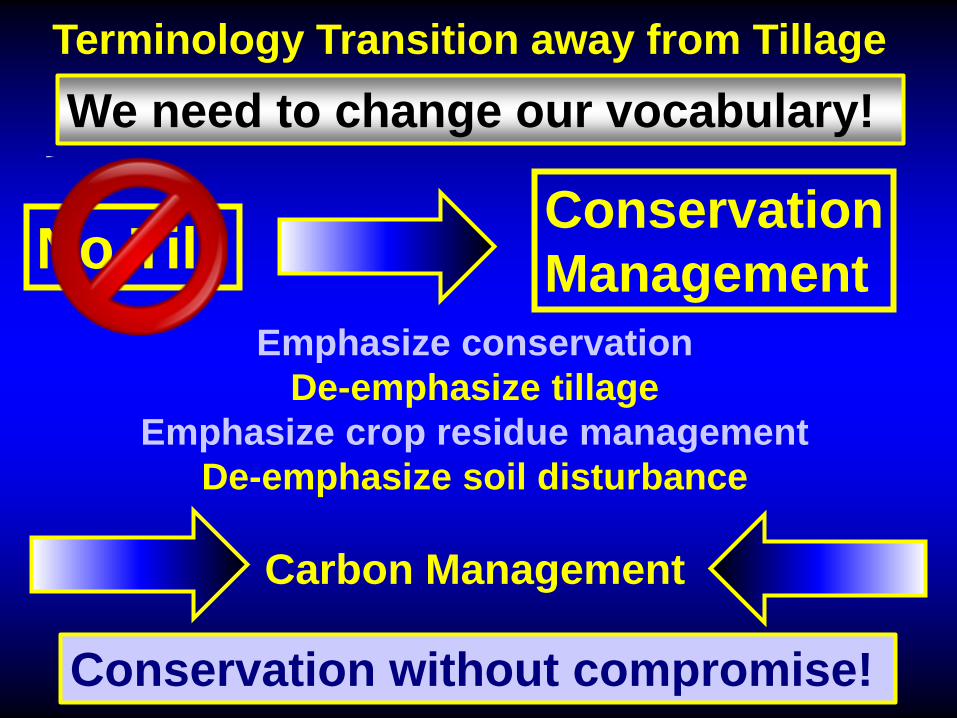
No Till Conservation
Management
Terminology Transition away from Tillage
Emphasize conservation
De-emphasize tillage
Emphasize crop residue management
De-emphasize soil disturbance
Carbon Management
We need to change our vocabulary!
Conservation without compromise!

Conservation: “Touch the earth lightly, use the earth gently,
Nourish the life of all the world in our care.” Source: Shirley Erina Murray, 1992
Conservation is a word to be respected,
revered and used to describe agriculture.
However, conservation does not belong in the
same sentence with tillage.
The action of conserving something, in
particular. Preservation, protection, or
restoration of the natural environment, natural
ecosystems, vegetation, and wildlife.
Vo
lum
e s
oil
dis
turb
ed
0
+
Mo
ldb
oa
rd p
low
Dis
c p
low
Ch
ise
l p
low
Ro
tary
til
lag
e
Fie
ld c
ult
iva
tor
De
ep
Rip
pe
r
Su
bs
oil
-HD
Su
bs
oil
-LD
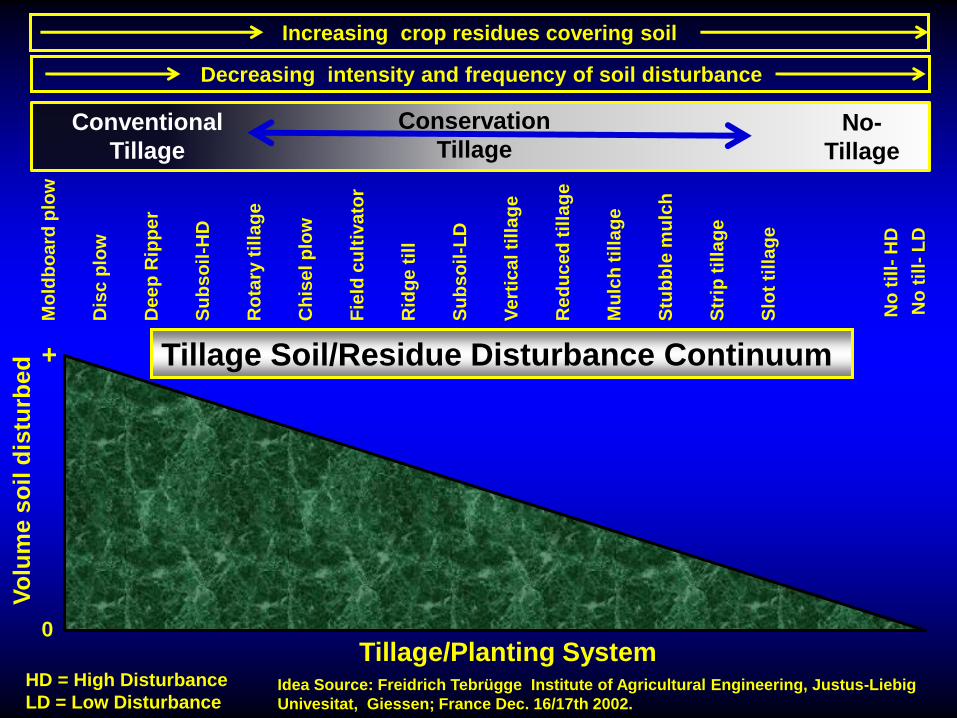
HD = High Disturbance
LD = Low Disturbance
Stu
bb
le m
ulc
h
Ve
rtic
al ti
lla
ge
Slo
t ti
lla
ge
Str
ip t
illa
ge
Red
uced
til
lag
e
Mu
lch
til
lag
e
No
til
l- H
D
No
til
l- L
D
Rid
ge
til
l
Tillage Soil/Residue Disturbance Continuum
Conservation
Tillage Conventional
Tillage
No-
Tillage
Tillage/Planting System
Decreasing intensity and frequency of soil disturbance
Increasing crop residues covering soil
Idea Source: Freidrich Tebrügge Institute of Agricultural Engineering, Justus-Liebig
Univesitat, Giessen; France Dec. 16/17th 2002.

Conventional
Tillage
Conservation
Tillage
Direct
Seeding
Zero Conservation
Much tillage
Some Conservation
Some tillage
Much Conservation
Zero tillage
Tillage Soil Disturbance Continuum
Conservation
Tillage
Conventional
Tillage
Least
disturbance
Most
disturbance
No-
Tillage
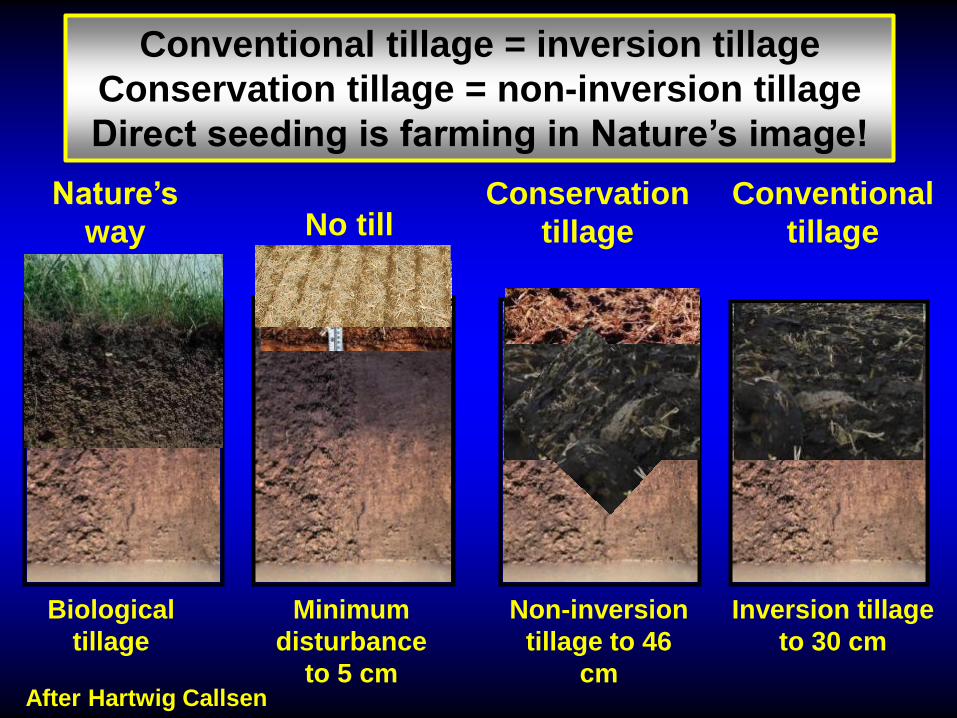
Nature’s
way No till Conservation
tillage
Conventional
tillage
Inversion tillage
to 30 cm
Non-inversion
tillage to 46
cm
Minimum
disturbance
to 5 cm
Biological
tillage
Conventional tillage = inversion tillage
Conservation tillage = non-inversion tillage
Direct seeding is farming in Nature’s image!
After Hartwig Callsen

True “C”onservation
is carbon management The two primary practices that contribute to the largest
amount of conservation are:
1.No-Tillage minimizes soil carbon loss.
2.Synergy crops maximizes soil carbon input.

“Connect the dots around Conservation Agriculture”
CA
Time savings Reduced labor
requirements Reduced
machinery wear
Energy
savings
Higher
soil H2O
Reduced air
pollution
Decreased
compaction
Increased
SOM
Improved
infiltration Improved
water quality
Reduced soil
erosion
More
wildlife
Improved
soil
biology
Continuous
crop residue
cover
Diverse rotations/
cover crops
Minimum soil
disturbance

Dead crop residue = “passive protective blanket”
“conserves water”
“releases nutrients”
“Carbon” coverings for the soil!
Live crop biomass = “active protective blanket”
“extracts water”
“accumulates nutrients”
Both are food
sources for the
soil biology!

http://www.rw.ttu.edu/2302_butler/chapter6.htm
Multi-tasking with cover crops!
More than just erosion control!
1. Fit cover crops into the rotation
2. Cover the soil 100% of the time
3. Carbon input 100% of the time
Photo credit: Jill Clapperton
Diversity enables a more sustainable system.
You can’t have soil biology without plants as their host.

“C”over “C”rop “C”ocktails
Synergy Crops
Bringing together the individual crop
benefits into a community of crops whose
synergistic effects to subsequent crops
are greater than the sum of the individual
crop contributions.
Biodiversity

Natural Fertility
Crop biomass ~ 46 %C
Soil organic matter = 58 %C
Difference = 12 %C
Microbial and
fungal
decomposition
Biological
activity =
Nutrient
release
K P Ca Mg
Bo
Cu
S Cl Zn
Mn
Mo Fe Na
C, H, O, N
CO2 CO2

vs
Which is better for the long term? “Pushing”
carbon!
“Pulling”
iron?

Min. soil disturbance
Min. soil loss
Cont. crop residue cover
Diverse rotations
Min. carbon loss
Soil protection
Feed the soil biology
Manage water
Recycle nutrients
Max. carbon input
C Cover
Crops No-
Tillage
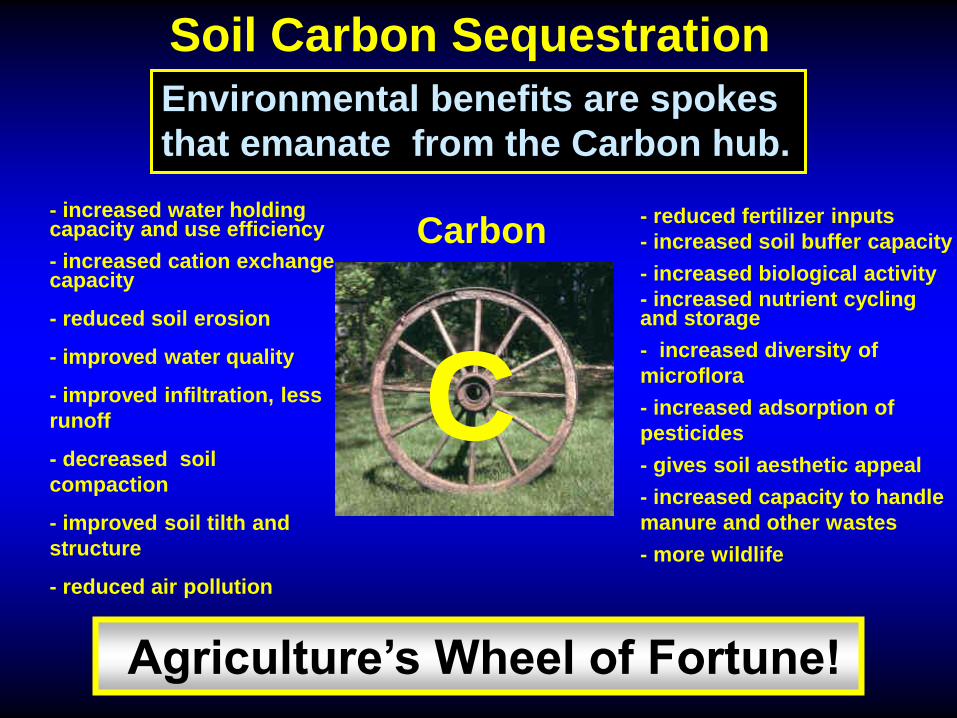
Soil Carbon Sequestration
Environmental benefits are spokes
that emanate from the Carbon hub.
- increased water holding capacity and use efficiency
- increased cation exchange capacity
- reduced soil erosion
- improved water quality
- improved infiltration, less
runoff
- decreased soil
compaction
- improved soil tilth and
structure
- reduced air pollution
- reduced fertilizer inputs
- increased soil buffer capacity
- increased biological activity
- increased nutrient cycling and storage
- increased diversity of
microflora
- increased adsorption of
pesticides
- gives soil aesthetic appeal
- increased capacity to handle
manure and other wastes
- more wildlife
Agriculture’s Wheel of Fortune!
C
Carbon

C
Decrease runoff
Decrease erosion
(water, wind, tillage)
increase infiltration
Decrease evaporation
Increase soil water and air
quality
Reduce biological
disturbance
Enables bio-pore
formation
Decrease inputs
Cope with climate
extremes
Decrease crusting
Improved soil tilth
Improves soil structure
Increase profitability
Improve water quality
Improve quality of life of
farmers
Promote biodiversity
Intensify production
Reduce the C footprint and
emission of GHG
Reduce the energy costs
Increase soil organic
matter
increase H2O holding
capacity
increase water use
efficiency
Recycle nutrients
Increased biological
activity
Increased biodiversity
Decrease pollution
Store more water
Reverse soil degradation
Regenerate soil
Increases soil biological
activity
N source, N scavenger,
Conservation Agriculture
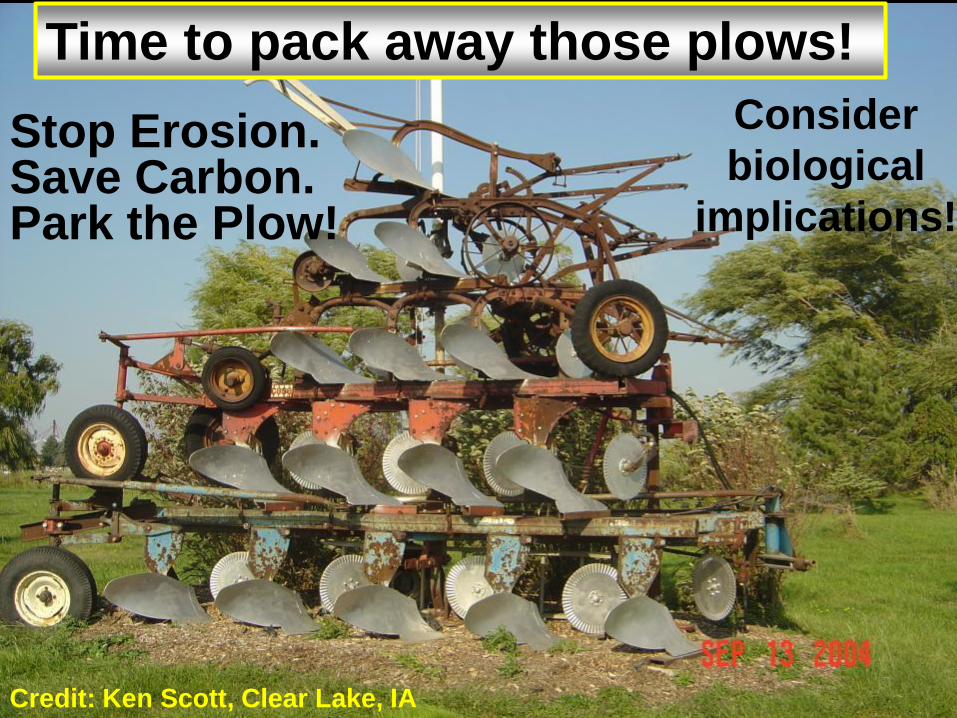
Stop Erosion. Save Carbon. Park the Plow!
Credit: Ken Scott, Clear Lake, IA
Time to pack away those plows!
Consider
biological
implications!

Plant
protection
Soil
protection
Carb
on
man
ag
em
en
t
Carb
on
man
ag
em
en
t
Food
Security

Keep your carbon
footprint small and
manage carbon for
ecosystem services! CO2 CO2
CO2 CO2
Best done with no-till & cover crop mixes!


Environmental Quality Triangle
Soil
Q
Carbon is the Foundation of Soil Quality. Soil Quality
is the foundation of Environmental Quality.

The Monitoring Tool Box is a
Land Stewardship project
publication. Land Stewardship
Project is a private, nonprofit
organization committed to fostering
an ethic‘ of stewardship for
farmland, promoting sustainable
agriculture, and developing
sustainable communities.
You must measure
before you can manage!
Monitoring Topics Quality of Life, Farm Sustainability
with Financial Data, Birds,
Frogs and Toads, Soil, Streams,
pests and pesticide usage, pasture
vegetation

C

C Decrease runoff
Decrease erosion
(water, wind, tillage)
increase infiltration
Decrease evaporation
Increase soil water and air
quality
Reduce biological
disturbance
Enables bio-pore
formation
Decrease inputs
Cope with climate
extremes
Decrease crusting
Improved soil tilth
Improves soil structure
Increase profitability
Improve water quality
Improve quality of life of
farmers
Promote biodiversity
Intensify production
Reduce the C footprint and
emission of GHG
Reduce the energy costs
Increase soil organic
matter
increase H2O holding
capacity
increase water use
efficiency
Recycle nutrients
Increased biological
activity
Increased biodiversity
Decrease pollution
Store more water
Reverse soil degradation
Regenerate soil
Increases soil biological
activity
N source, N scavenger,

C
H2O
N
P
Cycle
of
Life

C
H2O
N
P
Cycle
of
Life

C
H2O
N
P
Cycle
of
Life

Click for pictures of life and activity behind the lifecycle
chart in the four nutrient cycles.

Reduced soil disturbance and
increased retention of crop residues
on the soil surface improve soil
porosity, water infiltration and
holding capacity, and can reduce
erosion from water and wind by
90% or more. This results in less
sedimentation ditches, streams,
rivers and lakes. Reduced
sedimentation improves fish habitat
and minimizes the need for
dredging. Less soil erosion also
reduces offsite movement of
agricultural chemicals tied to the
soil particles.
http://www.directseed.org/overview.htm
Pacific Northwest Direct Seed Association
Conservation Agriculture and
Water Quality

Food security is soil security is national security
“C”onservation Agriculture
Soil “C”onservation
Soil “C”arbon
C
Soil erosion must be minimized!

Global water quality depends on global soil quality
Soil carbon is linked to all measures of soil quality.

“Ecosystems and the services they provide are financially significant and …. to degrade and damage them is tantamount to economic suicide.” Klaus Toepher, head of the U.N. Environment Program.
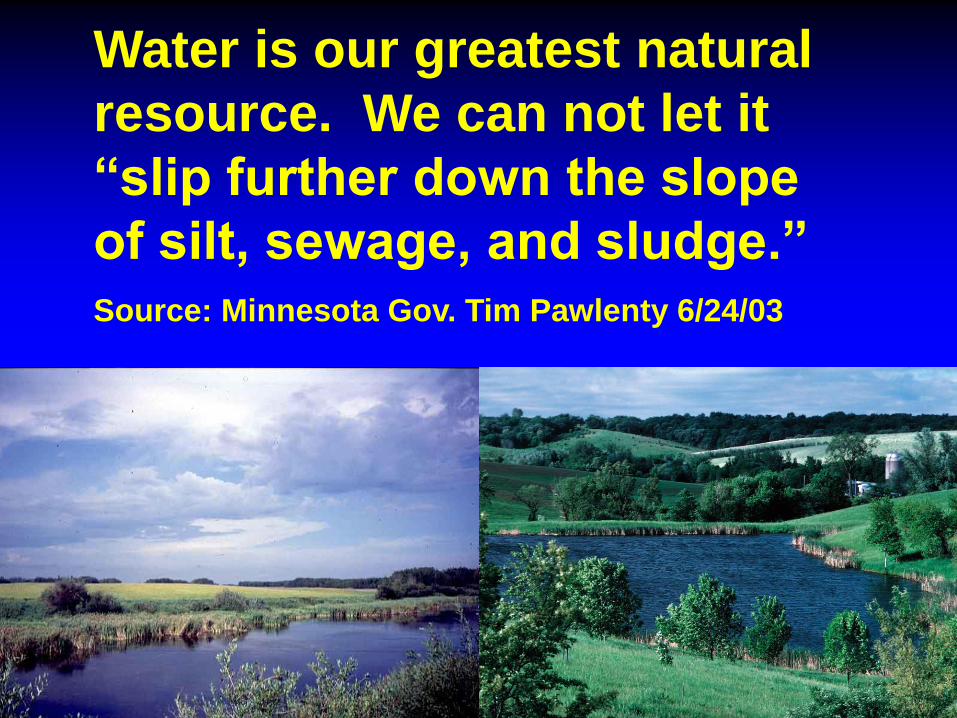
Water is our greatest natural
resource. We can not let it
“slip further down the slope
of silt, sewage, and sludge.”
Source: Minnesota Gov. Tim Pawlenty 6/24/03

“This is an urgent matter of human development, and
human dignity. Together, we can provide safe, clean
water to all the world’s people. The world’s water
resources are our lifeline for survival, and for
sustainable development in the 21st century.
Together, we must manage them better.”
Kofi A. Annan
Water is essential for life.
Message of the United Nations Secretary-General
to launch the “Water for Life" decade.
22 March 2005
Conservation agriculture and carbon
management can play a big role in
resource management.
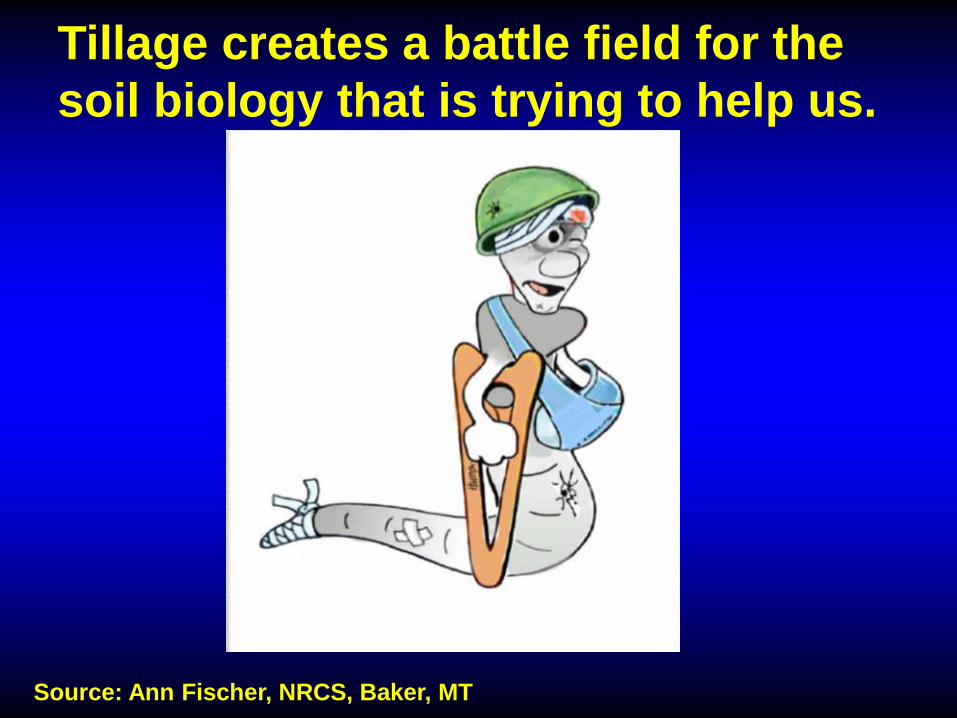
Source: Ann Fischer, NRCS, Baker, MT
Tillage creates a battle field for the
soil biology that is trying to help us.

Conservation is all about carbon.
Excel in carbon management.
Food Security Conservation
is not a
burden on
the budget
Conservation
is an
investment in
food security

Excel in carbon management.
Synergy crops provide many
little-understood benefits in the
complex soil-plant system.

** Soil Biology Team ** The “living soil”
Earthworms, insects and rodents are the most visible components
of the “living soil” team. They work in tandem either soil
microorganisms and fungi to contribute to aeration and nutrient
cycling as part of a “soil factory” team effort.
Most “soil critters” are bothered by tillage!

No “flow” No “blow” No “glow”
Conservation Agriculture
Carbon Management No-Till, Zero Till, Direct Seed


![THE IMPACT OF ALTERNATIVE SOIL TILLAGE ON SOIL ......P[eter] (2012). The Impact of Alternative Soil Tillage on Soil Resistance and CO 2 Emissions, Chapter 30 in DAAAM International](https://static.fdocuments.net/doc/165x107/6111311bc227415001007bc4/the-impact-of-alternative-soil-tillage-on-soil-peter-2012-the-impact.jpg)


