Soil Fertility Status - Chambal Fertilisers - Home€¦ · · 2012-06-19food security and the be...
44
Soil Fertility Status of North-Western States of India
Transcript of Soil Fertility Status - Chambal Fertilisers - Home€¦ · · 2012-06-19food security and the be...

Soil Fertility Statusof North-Western States of India
Preface
Land degradation, either salinization, alkalization, Although cost effective
natural or induced by deterioration of soil structure, options are available to
humans, is a continuing accelerated wind and water restore the soil quality and
process. It has become, erosion, loss of organic productivity, there is a need to
however, an important issue matter and biodiversity. increase awareness at high
through its adverse effects on Efforts to restore productivity policy-making level with
national natural resources, of a degraded land must sound scientific evidence.
food secur i ty and the be coupled with efforts It is, therefore, important to
livelihood of the population. to recognize productive develop spatial or other
Food security is directly capacity of soil resources. databases about the extent
related to the ability of land to Restoring the soil quality for of soil degradation, its
support the population. crop production through the biophysical, economic and
appropriate soil management social impacts as well as Causes for land degradation
and conservation techniques successful examples of soil are numerous and include
is important for all nations, productivity improvement decline of soil ferti l ity,
primarily those at risk with programmes.development of acidity,
respect to food security.
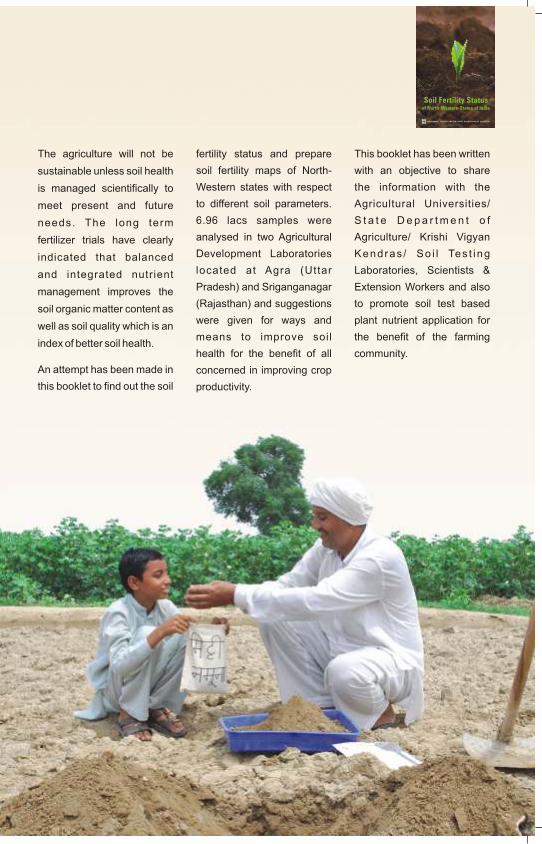
The agriculture will not be fertility status and prepare This booklet has been written
soil fertility maps of North- with an objective to share sustainable unless soil health
Western states with respect the information with the is managed scientifically to
to different soil parameters. Agricultural Universities/ meet present and future
6.96 lacs samples were S t a t e D e p a r t m e n t o f needs. The long term
analysed in two Agricultural Agriculture/ Krishi Vigyan fertilizer trials have clearly
Development Laboratories Kendras / So i l Tes t ing indicated that balanced located at Agra (Uttar Laboratories, Scientists & and integrated nutrient Pradesh) and Sriganganagar Extension Workers and also management improves the (Rajasthan) and suggestions to promote soil test based
soil organic matter content as were given for ways and plant nutrient application for
well as soil quality which is an means to improve soil the benefit of the farming
index of better soil health.health for the benefit of all community.
An attempt has been made in concerned in improving crop
this booklet to find out the soil productivity.
Soil Fertility Statusof North-Western States of India
Preface
Land degradation, either salinization, alkalization, Although cost effective
natural or induced by deterioration of soil structure, options are available to
humans, is a continuing accelerated wind and water restore the soil quality and
process. It has become, erosion, loss of organic productivity, there is a need to
however, an important issue matter and biodiversity. increase awareness at high
through its adverse effects on Efforts to restore productivity policy-making level with
national natural resources, of a degraded land must sound scientific evidence.
food secur i ty and the be coupled with efforts It is, therefore, important to
livelihood of the population. to recognize productive develop spatial or other
Food security is directly capacity of soil resources. databases about the extent
related to the ability of land to Restoring the soil quality for of soil degradation, its
support the population. crop production through the biophysical, economic and
appropriate soil management social impacts as well as Causes for land degradation
and conservation techniques successful examples of soil are numerous and include
is important for all nations, productivity improvement decline of soil ferti l ity,
primarily those at risk with programmes.development of acidity,
respect to food security.
The agriculture will not be fertility status and prepare This booklet has been written
soil fertility maps of North- with an objective to share sustainable unless soil health
Western states with respect the information with the is managed scientifically to
to different soil parameters. Agricultural Universities/ meet present and future
6.96 lacs samples were S t a t e D e p a r t m e n t o f needs. The long term
analysed in two Agricultural Agriculture/ Krishi Vigyan fertilizer trials have clearly
Development Laboratories Kendras / So i l Tes t ing indicated that balanced located at Agra (Uttar Laboratories, Scientists & and integrated nutrient Pradesh) and Sriganganagar Extension Workers and also management improves the (Rajasthan) and suggestions to promote soil test based
soil organic matter content as were given for ways and plant nutrient application for
well as soil quality which is an means to improve soil the benefit of the farming
index of better soil health.health for the benefit of all community.
An attempt has been made in concerned in improving crop
this booklet to find out the soil productivity.
Soil Fertility Statusof North-Western States of India

Prepared by:
For details please contact:
• ADL-AGRA: 11B/99A, Foundry Nagar, Hathras Road,
Agra (U.P.) 282006. Phone No.: 0562-2241762.
• ADL-SRIGANGANAGAR: 2A/12, 1st Floor, Gaganpath Road, Jawahar Nagar,
Sriganganagar (Raj.) 335001 Phone No.: 0154-2463016
Dr. Naresh Prasad, Tel.: 011-41697979, Email: [email protected]
Table of Contents
S. No. Content Page No.
1 About Chambal 01-02
2 Introduction 03-04
3 Methodology 05-06
4 Inferences 07-10
5 Recommendations / Suggestions 11-12
6 References 12
7 Tables 13-20
8 Soil Fertility Maps - 21-28
Soil Reaction, Salinity & NPK Status
• India 21
• Uttar Pradesh 22
• Punjab 23
• Rajasthan 24
• Haryana 25
• Madhya Pradesh 26
• Gujarat 27
• Chhattisgarh 28
9. Soil Fertility Maps - 29-33
Micronutrients & Sulphur Status
• Uttar Pradesh 29
• Madhya Pradesh 30
• Rajasthan 31
• Haryana 32
• Punjab 33
10. Our Network 34
11. Total Farm Solutions 35-36
Soil Fertility Statusof North-Western States of India
About Chambal...
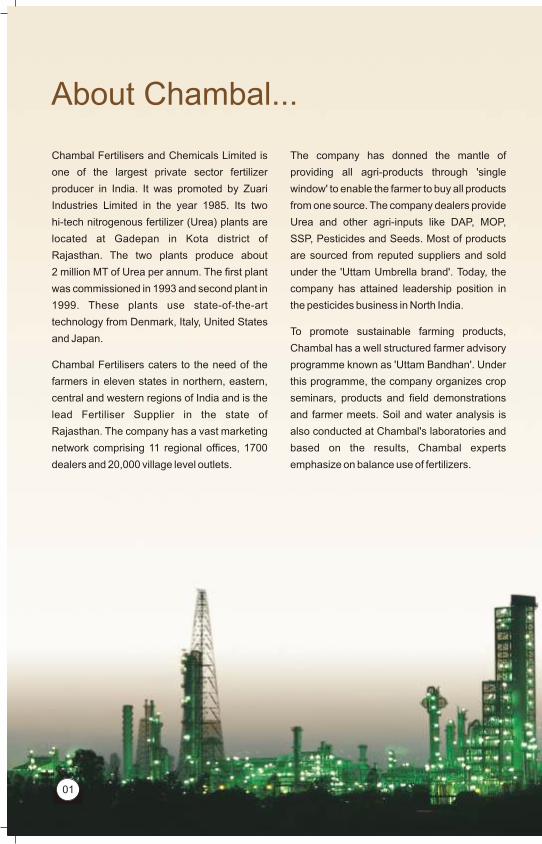
Chambal Fertilisers and Chemicals Limited is The company has donned the mantle of
one of the largest private sector fertilizer providing all agri-products through 'single
producer in India. It was promoted by Zuari window' to enable the farmer to buy all products
Industries Limited in the year 1985. Its two from one source. The company dealers provide
hi-tech nitrogenous fertilizer (Urea) plants are Urea and other agri-inputs like DAP, MOP,
located at Gadepan in Kota district of SSP, Pesticides and Seeds. Most of products
Rajasthan. The two plants produce about are sourced from reputed suppliers and sold
2 million MT of Urea per annum. The first plant under the 'Uttam Umbrella brand'. Today, the
was commissioned in 1993 and second plant in company has attained leadership position in
1999. These plants use state-of-the-art the pesticides business in North India.
technology from Denmark, Italy, United States To promote sustainable farming products,
and Japan.Chambal has a well structured farmer advisory
Chambal Fertilisers caters to the need of the programme known as 'Uttam Bandhan'. Under
farmers in eleven states in northern, eastern, this programme, the company organizes crop
central and western regions of India and is the seminars, products and field demonstrations
lead Fertiliser Supplier in the state of and farmer meets. Soil and water analysis is
Rajasthan. The company has a vast marketing also conducted at Chambal's laboratories and
network comprising 11 regional offices, 1700 based on the results, Chambal experts
dealers and 20,000 village level outlets. emphasize on balance use of fertilizers.
01
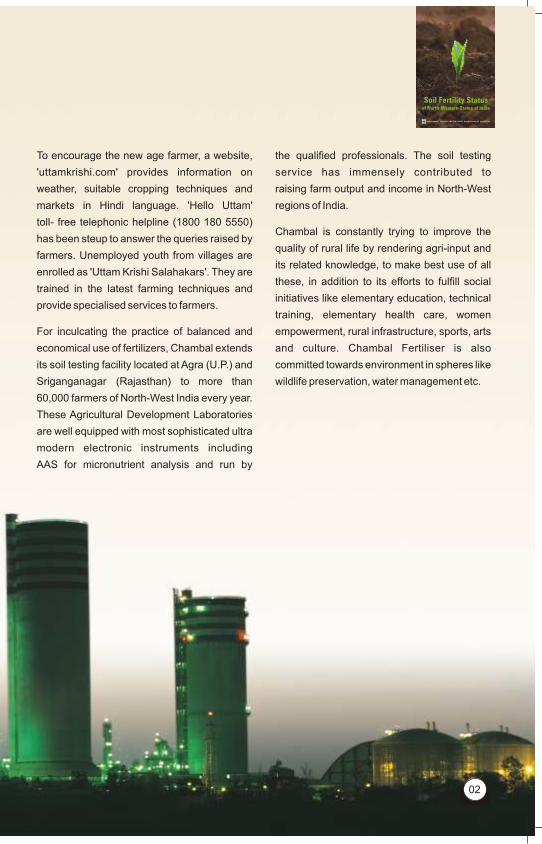
To encourage the new age farmer, a website, the qualified professionals. The soil testing
'uttamkrishi.com' provides information on service has immensely contributed to
weather, suitable cropping techniques and raising farm output and income in North-West
markets in Hindi language. 'Hello Uttam' regions of India.
toll- free telephonic helpline (1800 180 5550) Chambal is constantly trying to improve the
has been steup to answer the queries raised by quality of rural life by rendering agri-input and
farmers. Unemployed youth from villages are its related knowledge, to make best use of all
enrolled as 'Uttam Krishi Salahakars'. They are these, in addition to its efforts to fulfill social
trained in the latest farming techniques and initiatives like elementary education, technical
provide specialised services to farmers.training, elementary health care, women
For inculcating the practice of balanced and empowerment, rural infrastructure, sports, arts
economical use of fertilizers, Chambal extends and culture. Chambal Fertiliser is also
its soil testing facility located at Agra (U.P.) and committed towards environment in spheres like
Sriganganagar (Rajasthan) to more than wildlife preservation, water management etc.
60,000 farmers of North-West India every year.
These Agricultural Development Laboratories
are well equipped with most sophisticated ultra
modern electronic instruments including
AAS for micronutrient analysis and run by
02
Soil Fertility Statusof North-Western States of India
About Chambal...
Chambal Fertilisers and Chemicals Limited is The company has donned the mantle of
one of the largest private sector fertilizer providing all agri-products through 'single
producer in India. It was promoted by Zuari window' to enable the farmer to buy all products
Industries Limited in the year 1985. Its two from one source. The company dealers provide
hi-tech nitrogenous fertilizer (Urea) plants are Urea and other agri-inputs like DAP, MOP,
located at Gadepan in Kota district of SSP, Pesticides and Seeds. Most of products
Rajasthan. The two plants produce about are sourced from reputed suppliers and sold
2 million MT of Urea per annum. The first plant under the 'Uttam Umbrella brand'. Today, the
was commissioned in 1993 and second plant in company has attained leadership position in
1999. These plants use state-of-the-art the pesticides business in North India.
technology from Denmark, Italy, United States To promote sustainable farming products,
and Japan.Chambal has a well structured farmer advisory
Chambal Fertilisers caters to the need of the programme known as 'Uttam Bandhan'. Under
farmers in eleven states in northern, eastern, this programme, the company organizes crop
central and western regions of India and is the seminars, products and field demonstrations
lead Fertiliser Supplier in the state of and farmer meets. Soil and water analysis is
Rajasthan. The company has a vast marketing also conducted at Chambal's laboratories and
network comprising 11 regional offices, 1700 based on the results, Chambal experts
dealers and 20,000 village level outlets. emphasize on balance use of fertilizers.
01
To encourage the new age farmer, a website, the qualified professionals. The soil testing
'uttamkrishi.com' provides information on service has immensely contributed to
weather, suitable cropping techniques and raising farm output and income in North-West
markets in Hindi language. 'Hello Uttam' regions of India.
toll- free telephonic helpline (1800 180 5550) Chambal is constantly trying to improve the
has been steup to answer the queries raised by quality of rural life by rendering agri-input and
farmers. Unemployed youth from villages are its related knowledge, to make best use of all
enrolled as 'Uttam Krishi Salahakars'. They are these, in addition to its efforts to fulfill social
trained in the latest farming techniques and initiatives like elementary education, technical
provide specialised services to farmers.training, elementary health care, women
For inculcating the practice of balanced and empowerment, rural infrastructure, sports, arts
economical use of fertilizers, Chambal extends and culture. Chambal Fertiliser is also
its soil testing facility located at Agra (U.P.) and committed towards environment in spheres like
Sriganganagar (Rajasthan) to more than wildlife preservation, water management etc.
60,000 farmers of North-West India every year.
These Agricultural Development Laboratories
are well equipped with most sophisticated ultra
modern electronic instruments including
AAS for micronutrient analysis and run by
02
Soil Fertility Statusof North-Western States of India
Introduction...
03
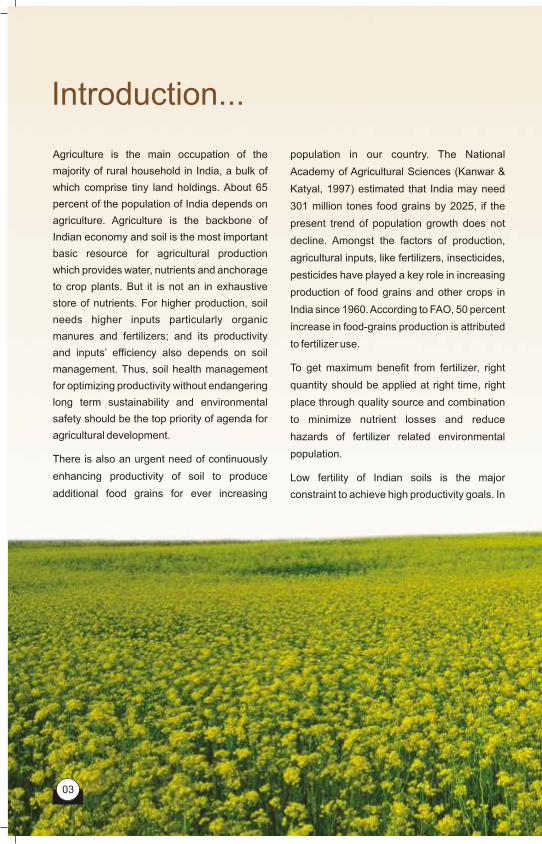
Agriculture is the main occupation of the population in our country. The National
majority of rural household in India, a bulk of Academy of Agricultural Sciences (Kanwar &
which comprise tiny land holdings. About 65 Katyal, 1997) estimated that India may need
percent of the population of India depends on 301 million tones food grains by 2025, if the
agriculture. Agriculture is the backbone of present trend of population growth does not
Indian economy and soil is the most important decline. Amongst the factors of production, basic resource for agricultural production agricultural inputs, like fertilizers, insecticides, which provides water, nutrients and anchorage pesticides have played a key role in increasing to crop plants. But it is not an in exhaustive
production of food grains and other crops in store of nutrients. For higher production, soil
India since 1960. According to FAO, 50 percent needs higher inputs particularly organic
increase in food-grains production is attributed manures and fertilizers; and its productivity
to fertilizer use.and inputs’ efficiency also depends on soil
To get maximum benefit from fertilizer, right management. Thus, soil health management
quantity should be applied at right time, right for optimizing productivity without endangering
long term sustainability and environmental place through quality source and combination
safety should be the top priority of agenda for to minimize nutrient losses and reduce
agricultural development. hazards of fertilizer related environmental
population.There is also an urgent need of continuously
enhancing productivity of soil to produce Low fertility of Indian soils is the major
additional food grains for ever increasing constraint to achieve high productivity goals. In
both agriculturally advanced irrigated nutrient and other inputs, (iii) a weakened
ecosystems and less- endowed rainfed foundation for high yielding sustainable
regions, nutrient replenishment through farming and (iv) escalating remedial costs for
fertilizers and manures remains far below crop rebuilding depleted soils. Therefore, for
removal, thus causing the mining of nutrient maintaining soil health and sustainable
reserves over years. Widespread deficiencies agricultural production, replenishment of
of N, P. K, S, Zn, Fe, B etc have emerged and macro and micronutrients and addition of soil
significant crop responses to application amendments is a must in the soil to obtain good
of these nutrients have been reported. crop yields. If their status in the soil is known
The deficiencies are so intense and severe that before the crop is sown, it provides a sound
visual symptoms are very often observed in basis for determining the nutr ients
major crops. requirements for the desired production. Soil
testing is the practical application of science in Soil fertility decline is naturally more alarming
this direction. It helps in assessing the nutrient in intensive cultivated regions wherein nutrient
supplying capacity of soil and providing site wi thdrawals by crop are h igh and
specific fertilizer recommendations. It also replenishment is not only inadequate in favour
helps in identifying problem with the soil and of N. Soil nutrient depletion has grave
suggesting their reclamation for better fertilizer implications in term of (i) more acute and wide
use efficiency and improving soil health.spread deficiencies, (ii) declining nutrient use
efficiency and returns from money spent on
04
Soil Fertility Statusof North-Western States of India

Introduction...
03
Agriculture is the main occupation of the population in our country. The National
majority of rural household in India, a bulk of Academy of Agricultural Sciences (Kanwar &
which comprise tiny land holdings. About 65 Katyal, 1997) estimated that India may need
percent of the population of India depends on 301 million tones food grains by 2025, if the
agriculture. Agriculture is the backbone of present trend of population growth does not
Indian economy and soil is the most important decline. Amongst the factors of production, basic resource for agricultural production agricultural inputs, like fertilizers, insecticides, which provides water, nutrients and anchorage pesticides have played a key role in increasing to crop plants. But it is not an in exhaustive
production of food grains and other crops in store of nutrients. For higher production, soil
India since 1960. According to FAO, 50 percent needs higher inputs particularly organic
increase in food-grains production is attributed manures and fertilizers; and its productivity
to fertilizer use.and inputs’ efficiency also depends on soil
To get maximum benefit from fertilizer, right management. Thus, soil health management
quantity should be applied at right time, right for optimizing productivity without endangering
long term sustainability and environmental place through quality source and combination
safety should be the top priority of agenda for to minimize nutrient losses and reduce
agricultural development. hazards of fertilizer related environmental
population.There is also an urgent need of continuously
enhancing productivity of soil to produce Low fertility of Indian soils is the major
additional food grains for ever increasing constraint to achieve high productivity goals. In
both agriculturally advanced irrigated nutrient and other inputs, (iii) a weakened
ecosystems and less- endowed rainfed foundation for high yielding sustainable
regions, nutrient replenishment through farming and (iv) escalating remedial costs for
fertilizers and manures remains far below crop rebuilding depleted soils. Therefore, for
removal, thus causing the mining of nutrient maintaining soil health and sustainable
reserves over years. Widespread deficiencies agricultural production, replenishment of
of N, P. K, S, Zn, Fe, B etc have emerged and macro and micronutrients and addition of soil
significant crop responses to application amendments is a must in the soil to obtain good
of these nutrients have been reported. crop yields. If their status in the soil is known
The deficiencies are so intense and severe that before the crop is sown, it provides a sound
visual symptoms are very often observed in basis for determining the nutr ients
major crops. requirements for the desired production. Soil
testing is the practical application of science in Soil fertility decline is naturally more alarming
this direction. It helps in assessing the nutrient in intensive cultivated regions wherein nutrient
supplying capacity of soil and providing site wi thdrawals by crop are h igh and
specific fertilizer recommendations. It also replenishment is not only inadequate in favour
helps in identifying problem with the soil and of N. Soil nutrient depletion has grave
suggesting their reclamation for better fertilizer implications in term of (i) more acute and wide
use efficiency and improving soil health.spread deficiencies, (ii) declining nutrient use
efficiency and returns from money spent on
04
Soil Fertility Statusof North-Western States of India

Methodology...
Following procedure was
fol lowed for collection,
analysis, reporting and
preparation of soil fertility
maps:
Soil Samples Collection:
Since Sept. 1995 to Sept
2011, around 6.96 lac surface
soil samples (0-15 cm) were
collected by Chambal's field
staff and farmers as per
standard procedure from
d i f f e r e n t v i l l a g e s o f
Rajasthan, Haryana, Punjab,
Uttar Pradesh, Madhya
Pradesh, Chhattisgarh and
Gujarat. Col lected soi l
samples were sent to ADLs
for the analysis. Some
samples were d i rect ly
received from the farmers.
05
Soil Analysis:
The soil samples were processed and stored in the lab at
suitable room temperature; and analysed for pH, Electrical
conductivity, Organic Carbon (%), available P O and K O in 2 5 2
general, available sulphur and available micronutrients (Zn, Fe,
Cu, Mn & B) in particular cases by using standard methods as
per details given below:
a) Soil Reaction (pH) was determined by using 1:2.5 soils:
water suspension with the calibrated pH meter by following the
method given by Jackson (1973).
b) Soil Salinity (Electrical Conductivity) was determined by
using 1:2.5 soils: water suspension with the calibrated
conductivity meter by following the method given by Jackson
(1973).
c) Organic Carbon was determined by following modified
Walkley-Black (1934) method.
d) Available Phosphorous was determined by following
Olsen et al (1954) method and available phosphorous was
expressed in P O by using conversion factor.2 5
e) Available Potassium was determined by Flame
Photometer with neutral ammonium acetate as an extractant by
following Hanway and Heidel (1952) method and available
potassium was expressed in K O by using conversion factor.2
f) Available Sulphur was
determined by following
Turbidimetric Chesin and
Yien (1950) method and
ava i lab le su lphur was
expressed in 'S'.
g) Available Micronutrient
cations (Zn, Fe, Cu & Mn)
were determined by following
Lindsay and Norvell (1978)
m e t h o d u s i n g A t o m i c
Absorption Spectrophoto-
meter.
h) Available Boron was
determined by following Hot-
water Soluble Boron Gupta
(1967) method and available
Boron was expressed in 'B'.
Communication of the Soil
Test and Recommendation
Report (STRR):
Based on the analysis data,
report was generated for
e a c h s a m p l e a n d
c o m m u n i c a t e d t o t h e
concerned farmer either
through mail or in person.
S u i t a b l e c h e m i c a l
amendments wherever
required for soil reclamation
to have optimum output were
also recommended including
use of organic manures.
06
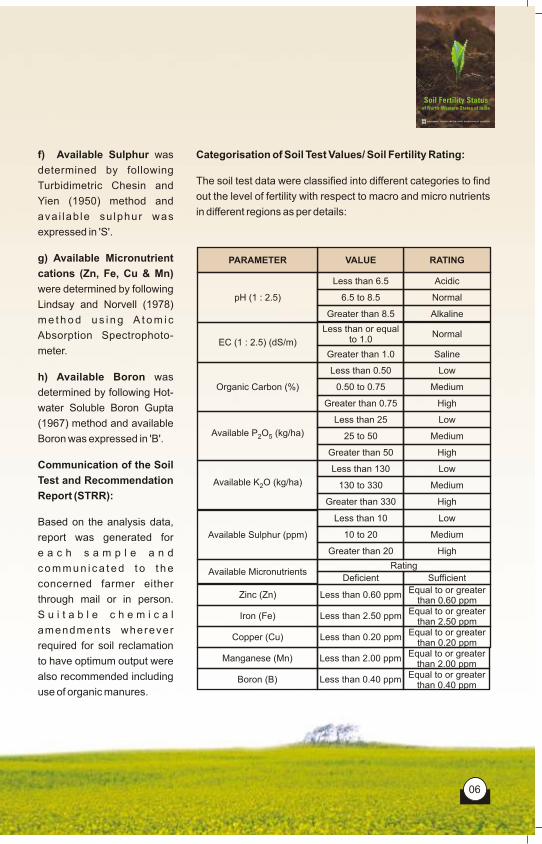
Categorisation of Soil Test Values/ Soil Fertility Rating:
The soil test data were classified into different categories to find
out the level of fertility with respect to macro and micro nutrients
in different regions as per details:
PARAMETER VALUE RATING
pH (1 : 2.5)
Less than 6.5 Acidic
6.5 to 8.5 Normal
Greater than 8.5 Alkaline
EC (1 : 2.5) (dS/m)
Less than or equal to 1.0
Normal
Greater than 1.0 Saline
Organic Carbon (%)
Less than 0.50 Low
0.50 to 0.75 Medium
Greater than 0.75 High
Available P O (kg/ha)2 5
Less than 25 Low
25 to 50 Medium
Greater than 50 High
Less than 130
Less than 10
Low
Low
130 to 330
10 to 20
Medium
Medium
Greater than 330
Greater than 20
High
High
Deficient Sufficient
Rating
Less than 0.60 ppmEqual to or greater
than 0.60 ppmZinc (Zn)
Less than 2.50 ppmEqual to or greater
than 2.50 ppmIron (Fe)
Less than 0.20 ppmEqual to or greater
than 0.20 ppmCopper (Cu)
Less than 2.00 ppm
Less than 0.40 ppm
Equal to or greater than 2.00 ppm
Equal to or greater than 0.40 ppm
Manganese (Mn)
Boron (B)
Available K O (kg/ha)2
Available Sulphur (ppm)
Available Micronutrients
Soil Fertility Statusof North-Western States of India
Methodology...
Following procedure was
fol lowed for collection,
analysis, reporting and
preparation of soil fertility
maps:
Soil Samples Collection:
Since Sept. 1995 to Sept
2011, around 6.96 lac surface
soil samples (0-15 cm) were
collected by Chambal's field
staff and farmers as per
standard procedure from
d i f f e r e n t v i l l a g e s o f
Rajasthan, Haryana, Punjab,
Uttar Pradesh, Madhya
Pradesh, Chhattisgarh and
Gujarat. Col lected soi l
samples were sent to ADLs
for the analysis. Some
samples were d i rect ly
received from the farmers.
05
Soil Analysis:
The soil samples were processed and stored in the lab at
suitable room temperature; and analysed for pH, Electrical
conductivity, Organic Carbon (%), available P O and K O in 2 5 2
general, available sulphur and available micronutrients (Zn, Fe,
Cu, Mn & B) in particular cases by using standard methods as
per details given below:
a) Soil Reaction (pH) was determined by using 1:2.5 soils:
water suspension with the calibrated pH meter by following the
method given by Jackson (1973).
b) Soil Salinity (Electrical Conductivity) was determined by
using 1:2.5 soils: water suspension with the calibrated
conductivity meter by following the method given by Jackson
(1973).
c) Organic Carbon was determined by following modified
Walkley-Black (1934) method.
d) Available Phosphorous was determined by following
Olsen et al (1954) method and available phosphorous was
expressed in P O by using conversion factor.2 5
e) Available Potassium was determined by Flame
Photometer with neutral ammonium acetate as an extractant by
following Hanway and Heidel (1952) method and available
potassium was expressed in K O by using conversion factor.2
f) Available Sulphur was
determined by following
Turbidimetric Chesin and
Yien (1950) method and
ava i lab le su lphur was
expressed in 'S'.
g) Available Micronutrient
cations (Zn, Fe, Cu & Mn)
were determined by following
Lindsay and Norvell (1978)
m e t h o d u s i n g A t o m i c
Absorption Spectrophoto-
meter.
h) Available Boron was
determined by following Hot-
water Soluble Boron Gupta
(1967) method and available
Boron was expressed in 'B'.
Communication of the Soil
Test and Recommendation
Report (STRR):
Based on the analysis data,
report was generated for
e a c h s a m p l e a n d
c o m m u n i c a t e d t o t h e
concerned farmer either
through mail or in person.
S u i t a b l e c h e m i c a l
amendments wherever
required for soil reclamation
to have optimum output were
also recommended including
use of organic manures.
06
Categorisation of Soil Test Values/ Soil Fertility Rating:
The soil test data were classified into different categories to find
out the level of fertility with respect to macro and micro nutrients
in different regions as per details:
PARAMETER VALUE RATING
pH (1 : 2.5)
Less than 6.5 Acidic
6.5 to 8.5 Normal
Greater than 8.5 Alkaline
EC (1 : 2.5) (dS/m)
Less than or equal to 1.0
Normal
Greater than 1.0 Saline
Organic Carbon (%)
Less than 0.50 Low
0.50 to 0.75 Medium
Greater than 0.75 High
Available P O (kg/ha)2 5
Less than 25 Low
25 to 50 Medium
Greater than 50 High
Less than 130
Less than 10
Low
Low
130 to 330
10 to 20
Medium
Medium
Greater than 330
Greater than 20
High
High
Deficient Sufficient
Rating
Less than 0.60 ppmEqual to or greater
than 0.60 ppmZinc (Zn)
Less than 2.50 ppmEqual to or greater
than 2.50 ppmIron (Fe)
Less than 0.20 ppmEqual to or greater
than 0.20 ppmCopper (Cu)
Less than 2.00 ppm
Less than 0.40 ppm
Equal to or greater than 2.00 ppm
Equal to or greater than 0.40 ppm
Manganese (Mn)
Boron (B)
Available K O (kg/ha)2
Available Sulphur (ppm)
Available Micronutrients
Soil Fertility Statusof North-Western States of India
Inferences...
1. Macronutrient Status in Soils(Nitrogen, Phosphorous and Potash):
07
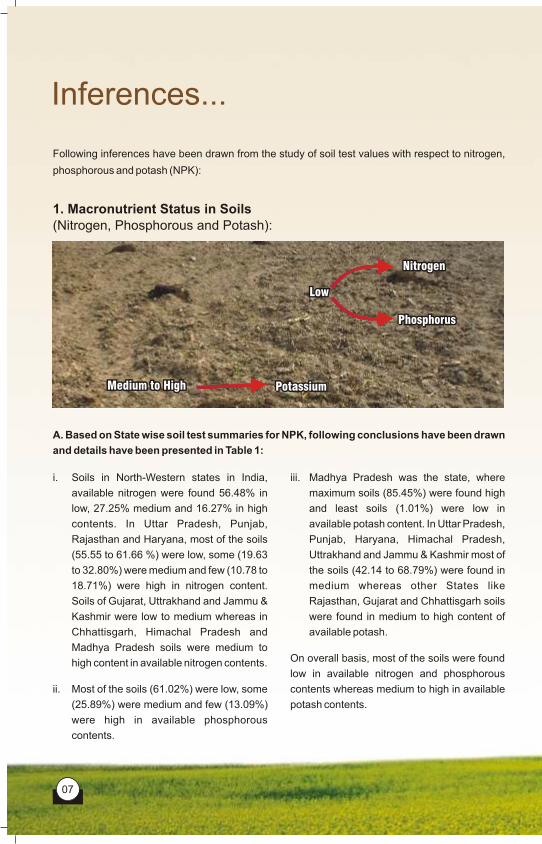
Following inferences have been drawn from the study of soil test values with respect to nitrogen,
phosphorous and potash (NPK):
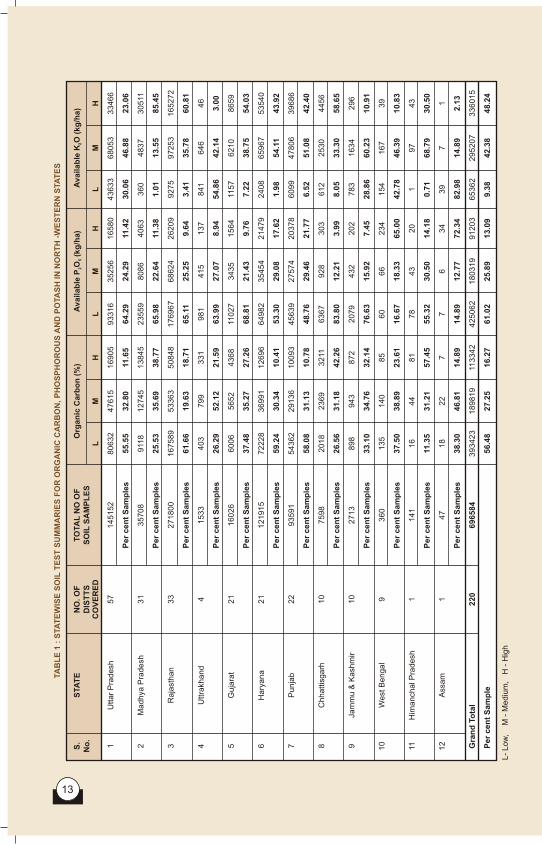
i. Soils in North-Western states in India, iii. Madhya Pradesh was the state, where
available nitrogen were found 56.48% in maximum soils (85.45%) were found high
low, 27.25% medium and 16.27% in high and least soils (1.01%) were low in
contents. In Uttar Pradesh, Punjab, available potash content. In Uttar Pradesh,
Rajasthan and Haryana, most of the soils Punjab, Haryana, Himachal Pradesh,
(55.55 to 61.66 %) were low, some (19.63 Uttrakhand and Jammu & Kashmir most of
to 32.80%) were medium and few (10.78 to the soils (42.14 to 68.79%) were found in
18.71%) were high in nitrogen content. medium whereas other States like
Soils of Gujarat, Uttrakhand and Jammu & Rajasthan, Gujarat and Chhattisgarh soils
Kashmir were low to medium whereas in were found in medium to high content of
Chhattisgarh, Himachal Pradesh and available potash.
Madhya Pradesh soils were medium to On overall basis, most of the soils were found high content in available nitrogen contents. low in available nitrogen and phosphorous
ii. Most of the soils (61.02%) were low, some contents whereas medium to high in available
(25.89%) were medium and few (13.09%) potash contents.
were high in available phosphorous
contents.
A. Based on State wise soil test summaries for NPK, following conclusions have been drawn
and details have been presented in Table 1:
Low Low
NitrogenNitrogen
PhosphorusPhosphorus
Medium to HighMedium to High PotassiumPotassium
08
i. Soils of Uttar Pradesh, Rajasthan, Punjab Himachal Pradesh and low status in
and Haryana were found low whereas soils Assam & Uttrakhand states.
of Madhya Pradesh, Jammu & Kashmir, On overall basis, it may be concluded that soils We s t B e n g a l , A s s a m , G u j a r a t , of North-Western India were low in available Chhattisgarh and Uttrakhand were found nitrogen & phosphorous and high in available medium and soil of Himachal Pradesh was potash status.high in available nitrogen contents.
ii. All soils of North-Western states in India
were low in available phosphorous status
except Punjab where it was medium and
West Bengal & Assam were high.
iii. Most of the soils in available potash were
found high status (Punjab, Rajasthan,
Haryana, Madhya Pradesh, Gujarat and
Chhattisgarh), medium in Uttar Pradesh,
Jammu & Kashmir, West Bengal and
B. Based on State wise NPK nutrient index, following conclusions have been drawn and
details have been presented in Table 2:
i. Soils of 100, 101 and 19 districts of North- districts of North-Western Indian States
Western Indian States were found low, respectively.
medium and high status in available Thus, it is inferred from the results that there is nitrogen content, respectively.wide spread deficiency (165 districts) of
phosphorous in North-Western Indian states. ii. Available phosphorous were found
Low to medium status in available nitrogen low, medium and high in soils of 165, (201 districts) and potash (128 districts), 47 and 8 districts of North-Western respectively. Hence, there is a need to apply Indian States.the balanced dosage of plant nutrients in order
iii. Status of available potash was found low, to maximise crop production.
medium and high in 24, 104 and 92
C. Based on District wise NPK nutrient index, following conclusions have been drawn and
details have been presented in Table 3:
Low Low
NitrogenNitrogen
PhosphorusPhosphorus
HighHigh PotassiumPotassium
Nitrogen Deficiency Phosphorous Deficiency Potash Deficiency
Soil Fertility Statusof North-Western States of India

Inferences...
1. Macronutrient Status in Soils(Nitrogen, Phosphorous and Potash):
07
Following inferences have been drawn from the study of soil test values with respect to nitrogen,
phosphorous and potash (NPK):
i. Soils in North-Western states in India, iii. Madhya Pradesh was the state, where
available nitrogen were found 56.48% in maximum soils (85.45%) were found high
low, 27.25% medium and 16.27% in high and least soils (1.01%) were low in
contents. In Uttar Pradesh, Punjab, available potash content. In Uttar Pradesh,
Rajasthan and Haryana, most of the soils Punjab, Haryana, Himachal Pradesh,
(55.55 to 61.66 %) were low, some (19.63 Uttrakhand and Jammu & Kashmir most of
to 32.80%) were medium and few (10.78 to the soils (42.14 to 68.79%) were found in
18.71%) were high in nitrogen content. medium whereas other States like
Soils of Gujarat, Uttrakhand and Jammu & Rajasthan, Gujarat and Chhattisgarh soils
Kashmir were low to medium whereas in were found in medium to high content of
Chhattisgarh, Himachal Pradesh and available potash.
Madhya Pradesh soils were medium to On overall basis, most of the soils were found high content in available nitrogen contents. low in available nitrogen and phosphorous
ii. Most of the soils (61.02%) were low, some contents whereas medium to high in available
(25.89%) were medium and few (13.09%) potash contents.
were high in available phosphorous
contents.
A. Based on State wise soil test summaries for NPK, following conclusions have been drawn
and details have been presented in Table 1:
Low Low
NitrogenNitrogen
PhosphorusPhosphorus
Medium to HighMedium to High PotassiumPotassium
08
i. Soils of Uttar Pradesh, Rajasthan, Punjab Himachal Pradesh and low status in
and Haryana were found low whereas soils Assam & Uttrakhand states.
of Madhya Pradesh, Jammu & Kashmir, On overall basis, it may be concluded that soils We s t B e n g a l , A s s a m , G u j a r a t , of North-Western India were low in available Chhattisgarh and Uttrakhand were found nitrogen & phosphorous and high in available medium and soil of Himachal Pradesh was potash status.high in available nitrogen contents.
ii. All soils of North-Western states in India
were low in available phosphorous status
except Punjab where it was medium and
West Bengal & Assam were high.
iii. Most of the soils in available potash were
found high status (Punjab, Rajasthan,
Haryana, Madhya Pradesh, Gujarat and
Chhattisgarh), medium in Uttar Pradesh,
Jammu & Kashmir, West Bengal and
B. Based on State wise NPK nutrient index, following conclusions have been drawn and
details have been presented in Table 2:
i. Soils of 100, 101 and 19 districts of North- districts of North-Western Indian States
Western Indian States were found low, respectively.
medium and high status in available Thus, it is inferred from the results that there is nitrogen content, respectively.wide spread deficiency (165 districts) of
phosphorous in North-Western Indian states. ii. Available phosphorous were found
Low to medium status in available nitrogen low, medium and high in soils of 165, (201 districts) and potash (128 districts), 47 and 8 districts of North-Western respectively. Hence, there is a need to apply Indian States.the balanced dosage of plant nutrients in order
iii. Status of available potash was found low, to maximise crop production.
medium and high in 24, 104 and 92
C. Based on District wise NPK nutrient index, following conclusions have been drawn and
details have been presented in Table 3:
Low Low
NitrogenNitrogen
PhosphorusPhosphorus
HighHigh PotassiumPotassium
Nitrogen Deficiency Phosphorous Deficiency Potash Deficiency
Soil Fertility Statusof North-Western States of India

09
2. Sulphur Status in Soils (Table 4):
About 15453 samples were collected from Uttar Pradesh (7084), Punjab (1922), Rajasthan (3163),
Haryana (2737) and Madhya Pradesh (547) and analysed at ADL’s with CaCl - extractable S 2
(Chesin and Yien, 1950) method.
Status of available sulphur was found 20.75% to 40.40% in
low, 13.53% to 22.32% in medium and 40.40% to 63.61% in
high category. Maximum deficiency percentages of sulphur
were observed in Madhya Pradesh (40.40%) followed by
Uttar Pradesh (38.82%), Punjab (35.74%), Rajasthan
(28.93%) and Haryana (20.75%).
10
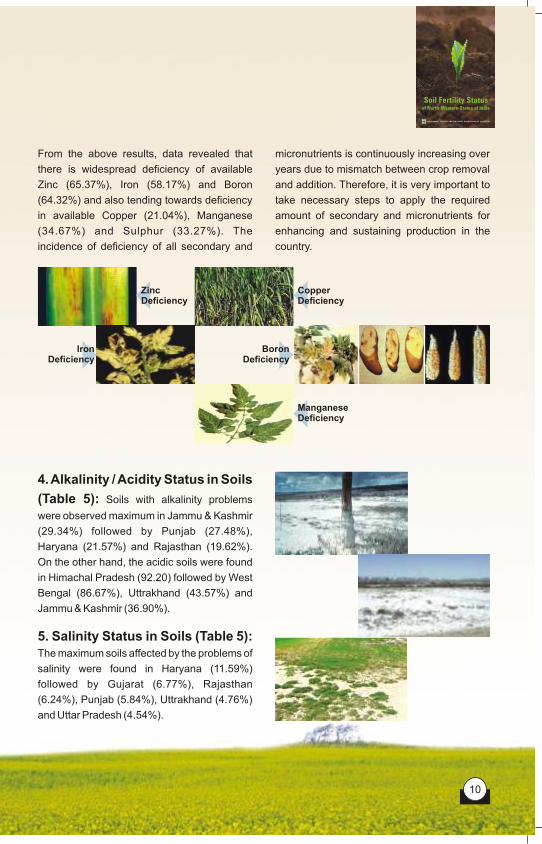
From the above results, data revealed that micronutrients is continuously increasing over
there is widespread deficiency of available years due to mismatch between crop removal
Zinc (65.37%), Iron (58.17%) and Boron and addition. Therefore, it is very important to
(64.32%) and also tending towards deficiency take necessary steps to apply the required
in available Copper (21.04%), Manganese amount of secondary and micronutrients for
(34.67%) and Sulphur (33.27%). The enhancing and sustaining production in the
incidence of deficiency of all secondary and country.
Sulphur Deficiency
deficient soils were found in Rajasthan 3. Micronutrients (Zinc, Iron, (79.88%) and minimum in Jammu & Copper, Manganese and Boron) Kashmir (14.04%).
Status in Soils (Table 4): Samples
c. Overall 21.04% soils were deficient in were collected with due care for micronutrients copper. Rajasthan was maximum deficient analysis and analysed by AAS (DTPA in copper (28.19%) followed by Punjab extractable Zn, Fe, Cu & Mn). Boron was (20.21%), Uttar Pradesh (17.91%) analysed with Hot-Water Soluble Boron whereas Madhya Pradesh (1.21%) and method. The sample size in states of Himachal Jammu & Kashmir (1.99%) were least Pradesh, Gujarat and Chhattisgarh were very deficient.small, therefore no valid conclusions can be
drawn for these states for Zn, Fe, Cu and Mn d. Mn deficiency in soils was observed in the
status. Based on state wise soil test range of 9.79% to 43.53% being minimum
summaries for above micronutrients, the in Madhya Pradesh (9.79%) and maximum
following conclusions have been drawn:in Jammu & Kashmir (43.53%).
a. Soils in North-Western states in India, e. Soil samples were collected for Boron
available Zn content were found 65.37% analysis from Uttar Pradesh, Punjab,
deficient. The maximum soils found Zn-Rajasthan, Haryana and Madhya
deficient in Jammu & Kashmir (88.94%) Pradesh. Sample size was very low in
followed by Rajasthan (84.68%), Punjab Punjab; hence no valid conclusion can be
(52.87%), Uttar Pradesh (50.48%), drawn. In North-Western states of India,
Madhya Pradesh (45.56%) and Haryana boron deficiency was found in 64.32%
(41.18%).soils. The maximum B-deficient soils were
found in Haryana (69.52%) followed by b. Iron deficient soil in North-Western states Uttar Pradesh (65.90%), Madhya Pradesh in India was 58.17% and ranged from (59.31%) and Rajasthan (52.69%).14.04 to 79.88%. The maximum Iron (Fe)
4. Acidity Status in Soils
(Table 5): Soils with alkalinity problems
were observed maximum in Jammu & Kashmir
(29.34%) followed by Punjab (27.48%),
Haryana (21.57%) and Rajasthan (19.62%).
On the other hand, the acidic soils were found
in Himachal Pradesh (92.20) followed by West
Bengal (86.67%), Uttrakhand (43.57%) and
Jammu & Kashmir (36.90%).
5. Salinity Status in Soils (Table 5): The maximum soils affected by the problems of
salinity were found in Haryana (11.59%)
followed by Gujarat (6.77%), Rajasthan
(6.24%), Punjab (5.84%), Uttrakhand (4.76%)
and Uttar Pradesh (4.54%).
Alkalinity /
ZincDeficiency
CopperDeficiency
Iron Deficiency
BoronDeficiency
ManganeseDeficiency
Soil Fertility Statusof North-Western States of India
09
2. Sulphur Status in Soils (Table 4):
About 15453 samples were collected from Uttar Pradesh (7084), Punjab (1922), Rajasthan (3163),
Haryana (2737) and Madhya Pradesh (547) and analysed at ADL’s with CaCl - extractable S 2
(Chesin and Yien, 1950) method.
Status of available sulphur was found 20.75% to 40.40% in
low, 13.53% to 22.32% in medium and 40.40% to 63.61% in
high category. Maximum deficiency percentages of sulphur
were observed in Madhya Pradesh (40.40%) followed by
Uttar Pradesh (38.82%), Punjab (35.74%), Rajasthan
(28.93%) and Haryana (20.75%).
10
From the above results, data revealed that micronutrients is continuously increasing over
there is widespread deficiency of available years due to mismatch between crop removal
Zinc (65.37%), Iron (58.17%) and Boron and addition. Therefore, it is very important to
(64.32%) and also tending towards deficiency take necessary steps to apply the required
in available Copper (21.04%), Manganese amount of secondary and micronutrients for
(34.67%) and Sulphur (33.27%). The enhancing and sustaining production in the
incidence of deficiency of all secondary and country.
Sulphur Deficiency
deficient soils were found in Rajasthan 3. Micronutrients (Zinc, Iron, (79.88%) and minimum in Jammu & Copper, Manganese and Boron) Kashmir (14.04%).
Status in Soils (Table 4): Samples
c. Overall 21.04% soils were deficient in were collected with due care for micronutrients copper. Rajasthan was maximum deficient analysis and analysed by AAS (DTPA in copper (28.19%) followed by Punjab extractable Zn, Fe, Cu & Mn). Boron was (20.21%), Uttar Pradesh (17.91%) analysed with Hot-Water Soluble Boron whereas Madhya Pradesh (1.21%) and method. The sample size in states of Himachal Jammu & Kashmir (1.99%) were least Pradesh, Gujarat and Chhattisgarh were very deficient.small, therefore no valid conclusions can be
drawn for these states for Zn, Fe, Cu and Mn d. Mn deficiency in soils was observed in the
status. Based on state wise soil test range of 9.79% to 43.53% being minimum
summaries for above micronutrients, the in Madhya Pradesh (9.79%) and maximum
following conclusions have been drawn:in Jammu & Kashmir (43.53%).
a. Soils in North-Western states in India, e. Soil samples were collected for Boron
available Zn content were found 65.37% analysis from Uttar Pradesh, Punjab,
deficient. The maximum soils found Zn-Rajasthan, Haryana and Madhya
deficient in Jammu & Kashmir (88.94%) Pradesh. Sample size was very low in
followed by Rajasthan (84.68%), Punjab Punjab; hence no valid conclusion can be
(52.87%), Uttar Pradesh (50.48%), drawn. In North-Western states of India,
Madhya Pradesh (45.56%) and Haryana boron deficiency was found in 64.32%
(41.18%).soils. The maximum B-deficient soils were
found in Haryana (69.52%) followed by b. Iron deficient soil in North-Western states Uttar Pradesh (65.90%), Madhya Pradesh in India was 58.17% and ranged from (59.31%) and Rajasthan (52.69%).14.04 to 79.88%. The maximum Iron (Fe)
4. Acidity Status in Soils
(Table 5): Soils with alkalinity problems
were observed maximum in Jammu & Kashmir
(29.34%) followed by Punjab (27.48%),
Haryana (21.57%) and Rajasthan (19.62%).
On the other hand, the acidic soils were found
in Himachal Pradesh (92.20) followed by West
Bengal (86.67%), Uttrakhand (43.57%) and
Jammu & Kashmir (36.90%).
5. Salinity Status in Soils (Table 5): The maximum soils affected by the problems of
salinity were found in Haryana (11.59%)
followed by Gujarat (6.77%), Rajasthan
(6.24%), Punjab (5.84%), Uttrakhand (4.76%)
and Uttar Pradesh (4.54%).
Alkalinity /
ZincDeficiency
CopperDeficiency
Iron Deficiency
BoronDeficiency
ManganeseDeficiency
Soil Fertility Statusof North-Western States of India
12
6. For reclamation of sodic/ alkali soils, use of chemical
amendments viz., gypsum, sulphur etc and for saline
soils, use of organic manures/ green manures coupled
with leaching of soluble salts with water from root zone
should be followed before on set of monsoon.
7. Soil conservation measures like leveling, bunding of
fields, cover crop, mulching etc to reduce erosion /
nutrient losses should be practiced.
8. In canal irrigated areas, irrigation water should also be used efficiently so as to avoid secondary
salinisation of soils.
9. Before using tubewell water for irrigation purposes it
should be analysed in Soil Testing Laboratory for its
suitability for a particular crop and soil in a particular
region.
10. Adopting crop rotation to maintain soil & crop health.
Crop rotation prevents soil depletion, maintain soil
fertility, reduce soil erosion, control insect-pests, disease
& weeds and also decrease the need for inorganic
supplements.
11. Crop follow periods practices should be adapted to maintain soil fertility. Crop follow periods are
when no crops are planted to allow time for plant to replace the nutrients in the soil. Follow
periods benefits include soil fertility restoration, suppression of weeds & protection of the soil
against erosion.
Recommendations/ Suggestions
11
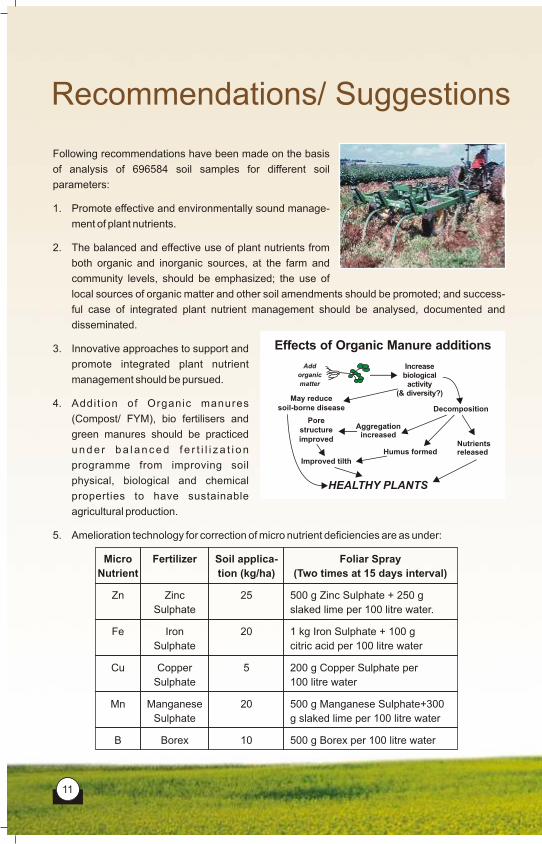
Following recommendations have been made on the basis
of analysis of 696584 soil samples for different soil
parameters:
1. Promote effective and environmentally sound manage-
ment of plant nutrients.
2. The balanced and effective use of plant nutrients from
both organic and inorganic sources, at the farm and
community levels, should be emphasized; the use of
local sources of organic matter and other soil amendments should be promoted; and success-
ful case of integrated plant nutrient management should be analysed, documented and
disseminated.
3. Innovative approaches to support and
promote integrated plant nutrient
management should be pursued.
4. Addi t ion of Organic manures
(Compost/ FYM), bio fertilisers and
green manures should be practiced
u n d e r b a l a n c e d f e r t i l i z a t i o n
programme from improving soil
physical, biological and chemical
properties to have sustainable
agricultural production.
5. Amelioration technology for correction of micro nutrient deficiencies are as under:
Micro Fertilizer Soil applica- Foliar Spray
Nutrient tion (kg/ha) (Two times at 15 days interval)
Zn Zinc 25 500 g Zinc Sulphate + 250 g
Sulphate slaked lime per 100 litre water.
Fe Iron 20 1 kg Iron Sulphate + 100 g
Sulphate citric acid per 100 litre water
Cu Copper 5 200 g Copper Sulphate per
Sulphate 100 litre water
Mn Manganese 20 500 g Manganese Sulphate+300
Sulphate g slaked lime per 100 litre water
B Borex 10 500 g Borex per 100 litre water
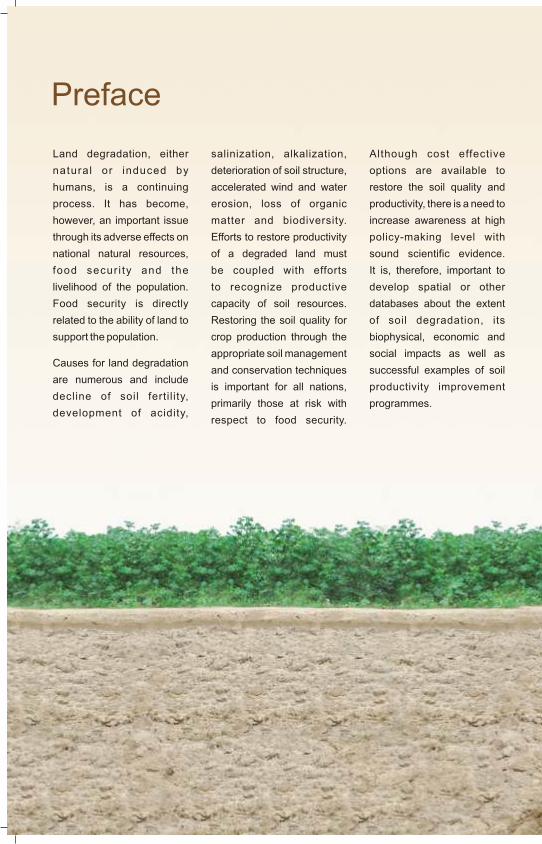
Effects of Organic Manure additions
Add
organic
matter
May reducesoil-borne disease
Porestructureimproved
Improved tilth
HEALTHY PLANTS
Humus formed
Aggregationincreased
Decomposition
Increasebiological
activity(& diversity?)
Nutrientsreleased
References• Chesin, L. and Yien, C.H. (1950). Turbidimetric 2025. National Academy of Agricultural Sciences, New
determination of available sulphates. Proc. Soil. Sci. Soc. Delhi, India, PP:91-113.Am. 14:149-151 • Lindsay, W.L. and Norvell, W.A. (1978). Development of
• Gupta, U.C. (1967). A simplified method for determining DTPA Soil test for Zinc, Iron, Manganese and Copper. Hot Water - Soluble Boron in Podzol soils. Soil Sci. Soil Sci. Soc. Am. J. 42:421-428.103:424-428. • Olsen, S.R., Cale, C.V. Watanabe, F.S. and Dean, L.A.
• Hanway, J.J. and Heidel, H. (1952). Soil analysis methods (1954). Estimation of available phosphorus in soil by as used in Lowa State Collage, Soil Testing Laboratory, extraction with sodium bicarbonate. Circular No. 939. Lowa State Collage Bull, 57:1-131. USDA Washington, DC, USA.
• Jackson, M.L. (1973). Soil Chemical Analysis. Prentice • Walkley, A. and Black, C.A. (1934). An examination of Hall of India Pvt. Ltd., PP:25-214. different methods for determining soil organic matter and
a proposed modification of the chromic acid titration • Kanwar, J.S. and Katyal, J.C. (1997). Plant Nutrient method. Soil Sci. 37:29-38.Needs, Supply, Efficiency and Policy Issues : 2000 -
Soil Fertility Statusof North-Western States of India

12
6. For reclamation of sodic/ alkali soils, use of chemical
amendments viz., gypsum, sulphur etc and for saline
soils, use of organic manures/ green manures coupled
with leaching of soluble salts with water from root zone
should be followed before on set of monsoon.
7. Soil conservation measures like leveling, bunding of
fields, cover crop, mulching etc to reduce erosion /
nutrient losses should be practiced.
8. In canal irrigated areas, irrigation water should also be used efficiently so as to avoid secondary
salinisation of soils.
9. Before using tubewell water for irrigation purposes it
should be analysed in Soil Testing Laboratory for its
suitability for a particular crop and soil in a particular
region.
10. Adopting crop rotation to maintain soil & crop health.
Crop rotation prevents soil depletion, maintain soil
fertility, reduce soil erosion, control insect-pests, disease
& weeds and also decrease the need for inorganic
supplements.
11. Crop follow periods practices should be adapted to maintain soil fertility. Crop follow periods are
when no crops are planted to allow time for plant to replace the nutrients in the soil. Follow
periods benefits include soil fertility restoration, suppression of weeds & protection of the soil
against erosion.
Recommendations/ Suggestions
11
Following recommendations have been made on the basis
of analysis of 696584 soil samples for different soil
parameters:
1. Promote effective and environmentally sound manage-
ment of plant nutrients.
2. The balanced and effective use of plant nutrients from
both organic and inorganic sources, at the farm and
community levels, should be emphasized; the use of
local sources of organic matter and other soil amendments should be promoted; and success-
ful case of integrated plant nutrient management should be analysed, documented and
disseminated.
3. Innovative approaches to support and
promote integrated plant nutrient
management should be pursued.
4. Addi t ion of Organic manures
(Compost/ FYM), bio fertilisers and
green manures should be practiced
u n d e r b a l a n c e d f e r t i l i z a t i o n
programme from improving soil
physical, biological and chemical
properties to have sustainable
agricultural production.
5. Amelioration technology for correction of micro nutrient deficiencies are as under:
Micro Fertilizer Soil applica- Foliar Spray
Nutrient tion (kg/ha) (Two times at 15 days interval)
Zn Zinc 25 500 g Zinc Sulphate + 250 g
Sulphate slaked lime per 100 litre water.
Fe Iron 20 1 kg Iron Sulphate + 100 g
Sulphate citric acid per 100 litre water
Cu Copper 5 200 g Copper Sulphate per
Sulphate 100 litre water
Mn Manganese 20 500 g Manganese Sulphate+300
Sulphate g slaked lime per 100 litre water
B Borex 10 500 g Borex per 100 litre water
Effects of Organic Manure additions
Add
organic
matter
May reducesoil-borne disease
Porestructureimproved
Improved tilth
HEALTHY PLANTS
Humus formed
Aggregationincreased
Decomposition
Increasebiological
activity(& diversity?)
Nutrientsreleased
References• Chesin, L. and Yien, C.H. (1950). Turbidimetric 2025. National Academy of Agricultural Sciences, New
determination of available sulphates. Proc. Soil. Sci. Soc. Delhi, India, PP:91-113.Am. 14:149-151 • Lindsay, W.L. and Norvell, W.A. (1978). Development of
• Gupta, U.C. (1967). A simplified method for determining DTPA Soil test for Zinc, Iron, Manganese and Copper. Hot Water - Soluble Boron in Podzol soils. Soil Sci. Soil Sci. Soc. Am. J. 42:421-428.103:424-428. • Olsen, S.R., Cale, C.V. Watanabe, F.S. and Dean, L.A.
• Hanway, J.J. and Heidel, H. (1952). Soil analysis methods (1954). Estimation of available phosphorus in soil by as used in Lowa State Collage, Soil Testing Laboratory, extraction with sodium bicarbonate. Circular No. 939. Lowa State Collage Bull, 57:1-131. USDA Washington, DC, USA.
• Jackson, M.L. (1973). Soil Chemical Analysis. Prentice • Walkley, A. and Black, C.A. (1934). An examination of Hall of India Pvt. Ltd., PP:25-214. different methods for determining soil organic matter and
a proposed modification of the chromic acid titration • Kanwar, J.S. and Katyal, J.C. (1997). Plant Nutrient method. Soil Sci. 37:29-38.Needs, Supply, Efficiency and Policy Issues : 2000 -
Soil Fertility Statusof North-Western States of India
1413
TA
BL
E 1
: S
TA
TE
WIS
E S
OIL
TE
ST
SU
MM
AR
IES
FO
R O
RG
AN
IC C
AR
BO
N, P
HO
SP
HO
RO
US
AN
D P
OTA
SH
IN
NO
RT
H -
WE
ST
ER
N S
TA
TE
S
S.
STA
TE
NO
. O
FT
OTA
L N
O O
FO
rgan
ic C
arb
on
(%
)A
vailab
le P
O (
kg
/ha)
Availab
le K
O (
kg
/ha)
25
No
.D
IST
TS
SO
IL S
AM
PL
ES
CO
VE
RE
DL
MH
LM
HL
MH
1U
ttar
Pra
desh
57
145152
80632
47615
16905
93316
35256
16580
43633
68053
33466
Per
cen
t S
am
ple
s
55.5
532.8
011.6
564.2
924.2
911.4
230.0
646.8
823.0
6
2M
adhya
Pra
desh
31
35708
911
812745
13845
23559
8086
4063
360
4837
30511
Per
cen
t S
am
ple
s
25.5
335.6
938.7
765.9
822.6
411.3
81.0
113.5
585.4
5
3R
aja
stha
n33
271800
167589
53363
50848
176967
68624
26209
9275
97253
165272
Per
cen
t S
am
ple
s
61.6
619.6
318.7
165.1
125.2
59.6
43.4
135.7
860.8
1
4U
ttra
khand
41533
403
799
331
981
415
137
841
646
46
Per
cen
t S
am
ple
s
26.2
952.1
221.5
963.9
927.0
78.9
454.8
642.1
43.0
0
5G
uja
rat
21
16026
6006
5652
4368
11027
3435
1564
1157
6210
8659
Per
cen
t S
am
ple
s
37.4
835.2
727.2
668.8
121.4
39.7
67.2
238.7
554.0
3
6H
ary
ana
21
121915
72228
36991
12696
64982
35454
21479
2408
65967
53540
Per
cen
t S
am
ple
s
59.2
430.3
410.4
153.3
029.0
817.6
21.9
854.1
143.9
2
7P
unja
b22
93591
54362
29136
10093
45639
27574
20378
6099
47806
39686
Per
cen
t S
am
ple
s
58.0
831.1
310.7
848.7
629.4
621.7
76.5
251.0
842.4
0
8C
hhattis
ga
rh10
7598
2018
2369
3211
6367
928
303
612
2530
4456
Per
cen
t S
am
ple
s
26.5
631.1
842.2
683.8
012.2
13.9
98.0
533.3
058.6
5
9Ja
mm
u &
Kash
mir
10
2713
898
943
872
2079
432
202
783
1634
296
Per
cen
t S
am
ple
s
33.1
034.7
632.1
476.6
315.9
27.4
528.8
660.2
310.9
1
10
West
Beng
al
9360
135
140
85
60
66
234
154
167
39
Per
cen
t S
am
ple
s
37.5
038.8
923.6
116.6
718.3
365.0
042.7
846.3
910.8
3
11H
imanch
al P
radesh
1141
16
44
81
78
43
20
197
43
Per
cen
t S
am
ple
s
11.3
531.2
157.4
555.3
230.5
014.1
80.7
168.7
930.5
0
12
Ass
am
147
18
22
77
634
39
71
Per
cen
t S
am
ple
s
38.3
046.8
114.8
914.8
912.7
772.3
482.9
814.8
92.1
3
Gra
nd
To
tal
220
696584
393423
189819
113342
425062
180319
91203
65362
295207
336015
Per
cen
t S
am
ple
56.4
827.2
516.2
761.0
225.8
913.0
99.3
842.3
848.2
4
L-
Low
, M
- M
ediu
m, H
- H
igh
2
TA
BL
E 2
: S
TA
TE
WIS
E N
UT
RIE
NT
IN
DE
X O
F N
, P
& K
IN
NO
RT
H -
WE
ST
ER
N S
TA
TE
S
S.
STA
TE
TO
TA
L N
ON
ITR
OG
EN
PH
OS
PH
OR
OU
SP
OTA
SH
No
.O
F S
OIL
SA
MP
LE
SV
AL
UE
CA
TE
GO
RY
VA
LU
EC
AT
EG
OR
YV
AL
UE
CA
TE
GO
RY
1U
ttar
Pra
desh
145152
1.5
6L
1.4
7L
1.9
3M
2M
adhya
Pra
de
sh35708
2.1
3M
1.4
5L
2.8
4H
3R
aja
sthan
271800
1.5
7L
1.4
5L
2.5
7H
4U
ttra
khand
1533
1.9
5M
1.4
5L
1.4
8L
5G
uja
rat
16026
1.9
0M
1.4
1L
2.4
7H
6H
ary
ana
121915
1.5
1L
1.6
4L
2.4
2H
7P
unja
b93591
1.5
3L
1.7
3M
2.3
6H
8C
hhattis
garh
7598
2.1
6M
1.2
0L
2.5
1H
9Ja
mm
u &
Kash
mir
2713
1.9
9M
1.3
1L
1.8
2M
10
West
Bengal
360
1.8
6M
2.4
8H
1.6
8M
11H
imanch
al P
radesh
141
2.6
4H
1.5
9L
2.3
0M
12
Ass
am
47
1.7
7M
2.5
7H
1.1
9L
Overa
ll696584
1.6
0
L1.5
2
L2.3
9
H
NU
TR
IEN
T IN
DE
X <
1.6
7 -
LO
W, 1
.67 -
2.3
3 -
ME
DIU
M, >
2.3
3 -
HIG
H
L -
LO
W, M
- M
ED
IUM
& H
- H
IGH
Nutr
ient In
dex
= (
Per
cent S
am
ple
s fa
lling in
low
cate
gory
X 1
) +
(P
er
cen
t sa
mple
s fa
lling in
mediu
m c
ate
gory
X 2
) +
(P
er
cent sa
mple
s fa
lling in
hig
h c
ate
gory
X 3
) / 1
00
Soil Fertility Statusof North-Western States of India

15 16
TA
BL
E -
3 S
OIL
TE
ST
SU
MM
AR
Y B
AS
ED
ON
DIS
TR
ICT
WIS
E N
UT
RIE
NT
IN
DE
X F
OR
N, P
& K
IN
NO
RT
H -
WE
ST
ER
N S
TA
TE
S
Sr.
No
.S
tate
Nu
trie
nt
Cate
go
ryD
istr
icts
1U
ttar
Pra
desh
Org
anic
Carb
on
Low
(34)
Hard
oi,
Eta
wah, A
ligarh
, F
arr
ukh
abad, A
llahabad, M
ain
puri, B
ula
ndsh
ar,
Ghazi
abad, F
ate
hpur,
Eta
h,
(Ava
ilable
Nitr
ogen)
Mora
dabad, A
gra
, Luck
now
, S
hahja
hanpur,
Vara
nasi
, R
aib
are
illy,
Santk
abir N
agar,
Maham
aya
Nagar,
H
ath
ras,
Kanpur,
Am
bedka
r N
agar,
Unnao, B
adaun, F
ero
zabad, M
ath
ura
, K
annoj,
Aura
iya,
Jala
un,
Ghazi
pur,
Sahara
npur,
Chandauli,
Mirza
pur,
Kash
iram
Nagar,
Bahra
ich
Mediu
m (
23)
Lakh
impur
Kheri, S
itapur,
Bara
banki
, M
eeru
t, M
uza
ffar
Nagar,
Bare
illy,
Faiz
abad, G
ora
khpur,
Lalit
pur,
S
ulta
npur,
Ram
pur,
Aza
mgarh
, D
eoria, Jh
ansi
, Jy
oth
i Phoole
Nagar,
Kaush
am
bi,
Mahara
jganj,
Mau,
Pili
bhit,
P
rata
pgarh
, G
onda, S
iddhart
h N
agar,
Kush
inagar
Hig
h (
0)
Nil
Ava
ilable
Phosp
horo
us
Low
(4
8)
Hard
oi,
Lakh
impur
Kheri, S
itapur, B
ara
banki
, Alig
arh
, Alla
habad, M
ain
puri, B
ula
ndsh
ar, M
uza
ffar
Nagar,
Ghazi
abad, F
ate
hpur, E
tah, M
ora
dabad, A
gra
, Luck
now
, F
aiz
abad, S
hahja
hanpur, V
ara
nasi
, G
ora
khpur,
Raib
are
illy,
Santk
abir N
agar, M
aham
aya
Nagar, L
alit
pur, S
ulta
npur, R
am
pur, A
zam
garh
, U
nnao, B
adaun,
Jhansi
, J.
P. N
agar, F
ero
zabad, M
ath
ura
, K
ush
inagar, K
annoj,
Kaush
am
bi,
Aura
iya, Ja
laun, M
ahara
jganj,
Mau,
Sahara
npur, P
ilibhit,
Pra
tapgarh
, C
handauli,
Mirza
pur, K
ash
iram
Nagar, G
onda, S
idhart
h N
agar, B
ahra
ich
Mediu
m (
8)
Eta
wah, F
arr
ukh
abad, M
eeru
t, B
are
illy,
Kanpur,
Deoria, A
mbedka
rnagar,
Ghazi
pur
Hig
h (
0)
Nil
Ava
ilable
Pota
shLow
(1
2)
Lakh
impur
Kheri, S
itapur,
Faiz
abad, G
ora
khpur,
Am
bedka
rnagar,
Unnao, B
adaun, K
ush
i N
agar,
K
aush
am
bi,
Mahara
jganj,
Gonda, S
iddhart
h N
agar
Mediu
m (4
2)
Hard
oi,
Bara
banki
, E
taw
ah, A
ligarh
, F
aru
kkhabad, M
eeru
t, B
ula
ndsh
ahar,
Muza
ffar
Naga
r, G
hazi
abad,
Fate
hpur,
Mora
dabad, B
are
illy,
Agra
, Luck
now
, S
hahja
hanpur,
Vara
nasi
, R
aib
are
ili, S
ant
Kabir N
agar,
H
ath
ras,
Kanpur,
Sulta
npur,
Ram
pur,
Aza
mgarh
, D
eoria, Jy
otib
a P
hoole
Nagar,
Firoza
ba
d,
Math
ura
, K
annoj,
Aura
iya, Ja
laun, G
hazi
pur,
Mau, S
ahara
npur,
Pili
bhit,
Pra
tapgarh
, C
handauli,
Mirza
pur,
Kash
iram
N
agar,
Eta
h, M
ain
puri, A
llahabad, B
ahra
ich
Hig
h (2
)Lalit
pur,
Jhansi
2P
unja
bO
rganic
Carb
on
Low
(1
0)
Fero
zepur,
Mansa
, M
ukt
sar, S
angru
r, J
ala
ndhar,
Hosh
iarp
ur,
Bath
inda, F
aridko
t, T
ara
n -
Tara
n,
Barn
ala
,
(Ava
ilable
Nitr
ogen)
Mediu
m (1
1)
Gurd
asp
ur,
Rupnagar,
Fate
hgarh
Sahid
, K
apurt
hala
, M
ohali,
Patia
la, Ludhia
na, S
ahid
Bh
agat
Sin
gh N
agar,
A
mrist
ar,
Moga
Hig
h (0
)N
il
Ava
ilable
Phosp
horo
us
Low
(4
)F
ero
zepur,
Mansa
, M
ukt
sar, B
arn
ala
Mediu
m (1
6)
Gurd
asp
ur,
Ropar,
Fate
hgarh
Sahib
, K
apoort
hala
, M
ohali,
Patia
la, Ludhia
na, S
ahid
Bhagat
Sin
gh N
agar,
S
angru
r, J
ala
ndhar,
Hosh
iarp
ur,
Bath
inda, F
aridko
t, T
ara
n -
Tara
n, A
mrist
ar,
Moga
Hig
h (
1)
Mohali
Ava
ilable
Pota
shLow
(1)
Mohali
Mediu
m (1
2)
Gurd
asp
ur,
Rupnagar,
Fate
hgar
Sahib
, K
apurt
hala
, M
ohali,
Patia
la, Ludhia
na, S
ahid
Bha
gat
Sin
gh N
agar,
S
angru
r, J
ala
ndhar,
Hosh
iarp
ur,
Barn
ala
Hig
h (8
)F
ero
zepur,
Mansa
, M
ukt
sar, B
ath
inda, F
aridko
t, T
ara
n -
Tara
n, A
mrist
ar,
Moga
3R
aja
sthan
Org
anic
Carb
on
Low
(2
0)
Jaip
ur,
Tonk,
Dausa
, S
riganganagar,
Hanum
angarh
, C
huru
, B
ikaner,
Jodhpur,
Sik
ar, A
lwar,
Sw
ai
(Ava
ilable
Nitr
ogen)
Madhopur,
Barm
er, P
ali,
Jhunjh
unu, B
hara
tpur,
Jais
alm
er,
Kara
uli,
Nagaur,
Jalo
ur,
Dholp
ur
Mediu
m (1
1)
Ajm
er,
Bansw
ara
, Jh
ala
war,
Bhilw
ara
, B
ara
n, U
daip
ur,
Kota
, B
undi,
Sirohi,
Rajs
am
and, D
ungarp
ur
Hig
h (2
)C
hitt
org
arh
, P
rata
pgarh
Ava
ilable
Phosp
horo
us
Low
(2
9)
Jaip
ur,
Tonk,
Dausa
, S
riganganagar,
Hanum
angarh
, C
huru
, B
answ
ara
, B
ikaner,
Jodhpur,
Jhala
war,
Sik
ar,
Bhilw
ara
, A
lwar,
Sw
ai M
adhopur,
Bara
n, U
daip
ur,
Chitt
org
arh
, K
ota
, B
undi,
Barm
er,
Pali,
Sirohi,
Jhunjh
unu,
Bhara
tpur,
Jais
alm
er,
Kara
uli,
Nagaur,
Jalo
ur,
Pra
tapgarh
Mediu
m (4
)A
jmer,
Rajs
am
and, D
ungarp
ur,
Dholp
ur
Hig
h (0
)N
il
Ava
ilable
Pota
shLow
(0
)N
il
Mediu
m (1
1)
Jaip
ur,
Dausa
, C
huru
, S
ikar,
Barm
er, J
hunjh
unu, B
hara
tpur,
Kara
uli,
Jalo
ur,
Dungarp
ur,
Dholp
ur
Hig
h (
22)
Tonk,
Ajm
er,
Sriganganagar,
Hanum
angarh
, B
answ
ara
, B
ikaner,
Jodhpur,
Jhala
war,
Bhilw
ara
, A
lwar,
Sw
ai
Madhopur,
Bara
n, U
daip
ur,
Chitt
org
arh
, Kota
, Bundi,
Pali,
Sirohi,
Rajs
am
and, J
ais
alm
er,
Nagaur,
Pra
tapgarh
4H
ary
ana
Org
anic
Carb
on
Low
(1
6)
His
ar,
Kaith
al,
Mahendra
garh
, Ji
nd, R
ohta
k, S
irsa
, F
aridabad, R
ew
ari, F
ate
habad, Jh
ajja
r, S
onip
at,
(Ava
ilable
Nitr
ogen)
Bhiw
ani,
Gurg
aon, P
alw
al,
Mew
at, P
anch
kula
Mediu
m (5
)K
arn
al,
Kuru
kshetr
a, P
anip
at, Y
am
unanagar,
Am
bala
Hig
h (0
)N
il
Ava
ilable
Phosp
horo
us
Low
(1
4)
His
ar,
Rohta
k, S
irsa
, F
aridabad, R
ew
ari, F
ate
habad, Jh
ajja
r, Y
am
unagar,
Am
bala
, B
hiw
ai,
Gurg
aon,
Palw
al,
Mew
at, P
anch
kula
Mediu
m (7
)K
arn
al,
Kuru
kshetr
a, K
aith
al,
Mahendra
garh
, P
anip
at, J
ind, S
onip
at
Hig
h (0
)N
il
Ava
ilable
Pota
shLow
(0
)N
il
Mediu
m (
12)
Sonip
at, K
arn
al,
Panip
at, F
aridabad, R
ew
ari, Y
am
unagar, A
mbala
, Bhiw
ani,
Gurg
aon, P
alw
al,
Mew
at, P
anch
kula
Hig
h (9
)H
isar,
Kuru
kshetr
a, K
aith
al,
Mahendra
garh
, Ji
nd, R
ohta
k, S
irsa
, F
ate
habad, Jh
ajja
r,
5M
adhya
Org
anic
Carb
on
Low
(5
)M
ore
na, B
urh
anpur,
Khandw
a, T
ikam
garh
, D
am
oh,
Pra
desh
(Ava
ilable
Nitr
ogen)
Mediu
m (1
8)
Ujja
in, G
walio
r, K
harg
one, M
andsa
ur,
Ratla
m, R
ais
en, B
hopal,
Bhin
d, D
har,
Shaja
pur,
Ha
rda,
Sehore
, D
atia
, Ja
balp
ur,
Sheopur,
Ash
okn
agar,
Sagar, S
eoni
Hig
h (8
)In
dore
, H
osh
angabad, D
ew
as,
Neem
uch
, C
hhin
dw
ara
, S
hiv
puri, G
una, B
arw
ani
Ava
ilable
Phosp
horo
us
Low
(2
6)
Ujja
in, G
walio
r, K
harg
one, M
andsa
ur,
Hosh
angabad, R
atla
m, R
ais
en, B
hopal,
Bhin
d, D
ew
as,
Dhar,
S
haja
pur,
Hard
a, S
ehore
, C
hhin
dw
ara
, S
hiv
puri, G
una, D
atiy
a, Ja
balp
ur,
Burh
anpur,
She
opur,
Ash
okn
agar,
T
ikam
garh
, D
am
oh, S
agar,
Seoni
Mediu
m (5
)In
dore
, M
ore
na, N
eem
uch
, K
handw
a, B
arw
ani
Hig
h (0
)N
il
Sr.
No
.S
tate
Nu
trie
nt
Cate
go
ryD
istr
icts
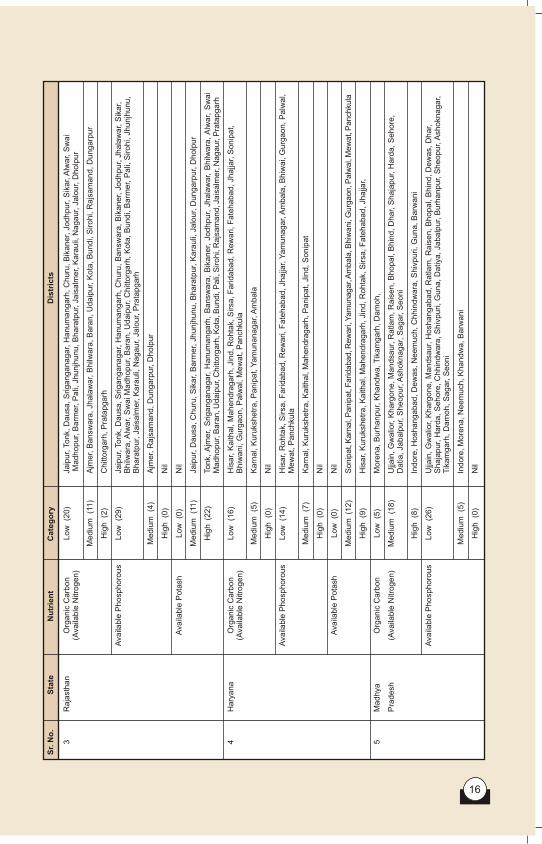

17 18
Ava
ilable
Pota
shLow
(0
)N
il
Mediu
m (1
)N
eem
uch
Hig
h (3
0)
Ujja
in, G
walio
r, K
harg
one, In
dore
, M
andsa
ur,
More
na, H
osh
angabad, R
atla
m, R
ais
en, B
hopal,
Bhin
d,
Dew
as,
Dhar,
Shaja
pur,
Hard
a, S
ehore
, C
hhin
dw
ara
, S
hiv
puri, G
una, D
atia
, Ja
balp
ur,
Burh
anpur,
K
handw
a, S
heopur,
Ash
okn
agar,
Tik
am
garh
, B
arw
ani,
Dam
oh, S
agar,
Seoni
6Ja
mm
u &
O
rganic
Carb
on
Low
(2
)K
upw
ara
, B
andip
ora
Kash
mir
(Ava
ilable
Nitr
ogen)
Mediu
m (7
)B
ara
mulla
, S
hopia
n, A
nanta
ng, B
udgam
, K
ulg
am
, G
anderb
al,
Srinagar
Hig
h (1
)P
ulw
am
a
Ava
ilable
Phosp
horo
us
Low
(9
)B
ara
mulla
, S
hopia
n, A
nanta
ng, B
udgam
, K
upw
ara
, K
ulg
am
, G
anderb
al,
Srinagar,
Bandip
ora
Mediu
m (1
)P
ulw
am
a
Hig
h (0
)N
il
Ava
ilable
Pota
shLow
(3
)S
hopia
n, K
upw
ara
, B
andip
ora
Mediu
m (7
)B
ara
mulla
, A
nanta
ng, B
udgam
, K
ulg
am
, G
anderb
al,
Srignagar,
Pulw
am
a
Hig
h (0
)N
il
7W
est
Bengal
Org
anic
Carb
on
Low
(2
)B
anku
ra, W
est
Medin
apur
(Ava
ilable
Nitr
ogen)
Mediu
m (6
)S
outh
24 P
arg
anas,
Mald
a, M
urs
hid
abad, E
ast
Medin
ipur,
How
rah, H
ooghly
Hig
h (1
)B
urd
man
Ava
ilable
Phosp
horo
us
Low
(0
)N
il
Mediu
m (4
)S
outh
24 P
arg
anas,
Banku
ra, M
urs
hid
abad, E
ast
Medin
ipur
Hig
h (5
)B
urd
wan, M
ald
a, H
ow
arh
, H
ooghly
, S
outh
Medin
ipur
Ava
ilable
Pota
shLow
(3
)B
anku
ra, M
idnapur,
South
Medin
ipur
Mediu
m (6
)B
urd
wan, S
outh
24 P
arg
anas,
Mald
a, M
urs
hid
abad, H
ow
arh
, H
ooghly
Hig
h (0
)N
il
8A
ssam
Org
anic
Carb
on
Low
(0
)N
il
(Ava
ilable
Nitr
ogen)
Mediu
m (1
)B
arp
eta
(B
aks
a)
Hig
h (0
)N
il
Ava
ilable
Phosp
horo
us
Low
(0
)N
il
Mediu
m (0
)N
il
Hig
h (1
)B
arp
eta
(B
aks
a)
Ava
ilable
Pota
shLow
(1
)B
arp
eta
(B
aks
a)
Mediu
m (0
)N
il
Hig
h (0
)N
il
Sr.
No
.S
tate
Nu
trie
nt
Cate
go
ryD
istr
icts
Pra
desh
(Ava
ilable
Nitr
ogen)
Mediu
m (0
)N
il
Hig
h (1
)K
ullu
Ava
ilable
Phosp
horo
us
Low
(1
)K
ullu
Mediu
m (0
)N
il
Hig
h (0
)N
il
Ava
ilable
Pota
shLow
(0
)N
il
Mediu
m (1
)K
ullu
Hig
h (0
)N
il
10
Guja
rat
Org
anic
Carb
on
Low
(8
)G
andhin
agar,
Sabark
anth
a, M
ehsa
na, K
heda, B
anask
anth
a, A
nand, Ja
mnagar,
Porb
and
ar
(Ava
ilable
Nitr
ogen)
Mediu
m (1
0)
Sura
t, A
hm
edabad, B
haru
ch, M
ehsa
na, V
als
ad, V
adodara
, R
ajk
ot, N
arm
ada, S
ure
ndra
nagar,
Am
reli
Hig
h (3
)N
avs
ari, B
havn
agar,
Junagarh
Ava
ilable
Phosp
horo
us
Low
(1
9)
Sura
t, G
andhin
agar,
Navs
ari, S
abark
anth
a, M
ehsa
na, V
als
ad, V
ijayp
ur,
Bhavn
agar,
Vadodara
, R
ajk
ot,
K
heda, Ju
nagarh
, B
anask
anth
a, N
arm
ada, S
ure
ndra
nagar,
Am
reli,
Jam
nagar,
Porb
andar,
B
haru
ch
Mediu
m (2
)A
hm
edabad, A
nand
Hig
h (0
)N
il
Ava
ilable
Pota
shLow
(0
)N
il
Mediu
m (5
)S
abark
anth
a, K
heda, B
anask
anth
a, Ja
mnagar,
Porb
andar
Hig
h (1
6)
Gandhin
agar,
Sura
t, A
hm
edabad, N
avs
ari, B
haru
ch, M
ehsa
na, V
als
ad, B
havn
agar,
Vadodara
, R
ajk
ot,
Ju
nagarh
, N
arm
ada, A
nand, S
ure
ndra
nagar,
Am
reli
11C
hhattis
garh
Org
anic
Carb
on
Low
(1
)M
ahasa
mund
(Ava
ilable
Nitr
ogen)
Mediu
m (6
)K
anke
r, R
aig
arh
, R
aip
ur,
Dham
tari, D
urg
, B
ilasp
ur
Hig
h (3
)S
urg
uja
, B
ast
ar,
Janjg
ir-C
ham
pa
Ava
ilable
Phosp
horo
us
Low
(1
0)
Kanke
r, R
aig
arh
, R
aip
ur,
Dham
tari, D
urg
, B
ilasp
ur,
Surg
uja
, B
ast
ar,
Mahasa
mandh, Ja
jgir
Mediu
m (0
)N
il
Hig
h (
0)
Nil
Ava
ilable
Pota
shLow
(1
)Ja
njg
ir-C
ham
pa
Mediu
m (5
)K
anke
r, R
aig
arh
, S
urg
uja
, B
ast
ar,
Mahasa
mund
Hig
h (4
)R
aip
ur,
Durg
, D
ham
tari, B
ilasp
ur
12
Uttra
khand
Org
anic
Carb
on
Low
(1
)N
ain
ital
(Ava
ilable
Nitr
ogen)
Mediu
m (3
)U
dham
Sin
gh N
agar,
Haridw
ar
Hig
h (0
)N
il
Ava
ilable
Phosp
horo
us
Low
(4)
Udham
Sin
gh N
agar,
Haridw
ar,
Nain
ital
Mediu
m (0
)N
il
Hig
h (0
)N
il
Ava
ilable
Pota
shLow
(3
)U
dham
Sin
gh N
agar,
Haridw
ar,
Nain
ital
Mediu
m (1
)U
dham
Sin
gh N
agar
Hig
h (0
)N
il
Sr.
No
.S
tate
Nu
trie
nt
Cate
go
ryD
istr
icts
9H
imanch
al
Org
anic
Carb
on
Low
(0
)N
il
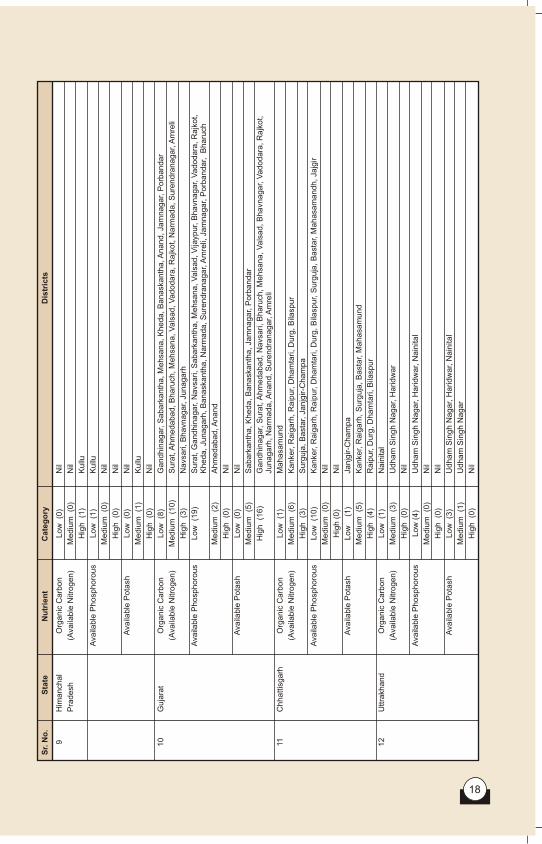

19 20
TA
BL
E 4
: S
TA
TE
WIS
E S
OIL
TE
ST
SU
MM
AR
IES
FO
R M
ICR
O A
ND
SE
CO
ND
RY
NU
TR
IEN
T-Z
INC
, IR
ON
, C
OP
PE
R, M
AN
GA
NE
SE
, B
OR
ON
& S
UL
PH
UR
IN
NO
RT
H-W
ES
TE
RN
STA
TE
S
S.
Zn
F
eC
uM
nB
oro
nS
ulp
hu
rS
TA
TE
No
.D
SD
SD
SD
SD
SL
MH
1U
ttar
Pra
desh
5872
5761
5795
58
03
2077
9521
3821
7777
1268
656
2750
1375
2959
Per
cen
t sam
ple
s50.4
849.5
249.9
750.0
317.9
182.0
932.9
567.0
565.9
034.1
038.8
219.4
141.7
7
2M
adhya
Pra
desh
657
785
189
557
9737
73
673
274
188
221
105
221
Per
cen
t sam
ple
s45.5
654.4
425.3
474.6
61.2
198.7
99.7
990.2
159.3
140.6
940.4
019.2
040.4
0
3R
aja
sthan
19292
3490
18198
4584
6422
16360
7370
15412
88
79
915
428
1820
Per
cen
t sam
ple
s84.6
815.3
279.8
820.1
228.1
971.8
132.3
567.6
552.6
947.3
128.9
313.5
357.5
4
4U
ttra
khand
00
00
00
00
00
10
0
Per
cen
t sam
ple
s0.0
00.0
00.0
00.0
00.0
00.0
00.0
00.0
00.0
00.0
0100.0
00.0
00.0
0
5G
uja
rat
28
513
20
132
132
00
00
0
Per
cen
t sam
ple
s84.8
515.1
539.3
960.6
13.0
396.9
73.0
396.9
70.0
00.0
00.0
00.0
00.0
0
6H
ary
ana
2037
2910
1341
36
06
555
4392
1783
3164
130
57
568
428
1741
Per
cen
t sam
ple
s41.1
858.8
227.1
172
.89
11.2
288.7
836.0
463.9
669.5
230.4
820.7
515.6
463.6
1
7P
unja
b7733
6893
5878
59
02
2381
9399
4675
7105
10
2687
429
806
Per
cen
t sam
ple
s52.8
747.1
349.9
050.1
020.2
179.7
939.6
960.3
183.3
316.6
735.7
422.3
241.9
4
8C
hhattis
garh
14
05
05
05
00
00
0
Per
cen
t sam
ple
s20.0
080.0
00.0
0100.0
00.0
0100.0
00.0
0100.0
00.0
00.0
00.0
00.0
00.0
0
9Ja
mm
u &
Kash
mir
2413
300
381
2332
54
2659
1181
1532
00
00
0
Per
cen
t sam
ple
s88.9
411.0
614.0
485.9
61.9
998.0
143.5
356.4
70.0
00.0
00.0
00.0
00.0
0
11H
imanch
al P
radesh
35
19
054
054
46
80
00
00
Per
cen
t sam
ple
s64.8
135.1
90.0
0100.0
00.0
0100.0
085.1
914.8
10.0
00.0
00.0
00.0
00.0
0
Gra
nd
To
tal
38068
20167
31795
22863
11499
43159
18950
35708
1770
982
5142
2765
7547
65.3
734.6
358.1
741.8
321.0
478.9
634.6
765.3
364.3
235.6
833.2
717.8
948.8
4
D
- D
efic
ient N
o. of S
am
ple
s, S
- S
uffic
ient N
o. of S
am
ple
s, L
- L
ow
, M
- M
ediu
m, H
- H
igh
Avail
ab
le
Avail
ab
le
Av
aila
ble
A
va
ila
ble
A
va
ila
ble
A
va
ilab
le
TA
BL
E 5
: S
TA
TE
WIS
E S
OIL
RE
AC
TIO
N / S
AL
INIT
Y S
TA
TU
S IN
NO
RT
H -
WE
ST
ER
N S
TA
TE
S
pH
(1:2
.5)
EC
(1:2
.5)
dS
/mS
.S
TA
TE
NO
. O
F D
IST
TS
T
OTA
L N
O O
F
No
.C
OV
ER
ED
SA
MP
LE
SA
CID
ICN
EU
TR
AL
AL
KA
LIN
EN
OR
MA
LS
AL
INE
1U
ttar
Pra
desh
57
145152
7530
127699
9923
138557
659
5
Per
cen
t S
am
ple
s5.1
987.9
86.8
495.4
64.5
4
2M
adhya
Pra
desh
31
35708
617
34476
615
35040
668
Per
cen
t S
am
ple
s1.7
396.5
51.7
298.1
31.8
7
3R
aja
sthan
33
271800
1213
217260
53327
254848
1695
2
Per
cen
t S
am
ple
s0.4
579.9
319.6
293.7
66.2
4
4U
ttra
khand
41533
668
865
01460
73
Per
cen
t S
am
ple
s43.5
756.4
30.0
095.2
44.7
6
5G
uja
rat
21
16026
803
14801
422
14941
108
5
Per
cen
t S
am
ple
s5.0
192.3
62.6
393.2
36.7
7
6H
ary
ana
21
121915
408
95210
26297
107785
1413
0
Per
cen
t S
am
ple
s0.3
378.1
021.5
788.4
111.5
9
7P
unja
b22
93591
1221
66652
25718
88121
5470
Per
cen
t S
am
ple
s1.3
071.2
227.4
894.1
65.8
4
8C
hhattis
garh
10
7598
2135
5445
18
7534
64
Per
cen
t S
am
ple
s28.1
071.6
60.2
499.1
60.8
4
9Ja
mm
u &
Kash
mir
10
2713
1001
916
796
2705
8
Per
cen
t S
am
ple
s36.9
033.7
629.3
499.7
10.2
9
10
West
Bengal
9360
312
48
0357
3
Per
cen
t S
am
ple
s86.6
713.3
30.0
099.1
70.8
3
11H
imanch
al P
rad
esh
1141
130
110
141
0
Per
cen
t S
am
ple
s92.2
07.8
00.0
0100.0
00.0
0
12
Ass
am
147
47
00
47
0
Per
cen
t S
am
ple
s100.0
00.0
00.0
0100.0
00.0
0
Gra
nd
To
tal
220
696584
16085
563383
117116
651536
45048
Per
cen
t S
am
ple
s2.3
180.8
816.8
193.5
36.4
7
Soil Fertility Statusof North-Western States of India
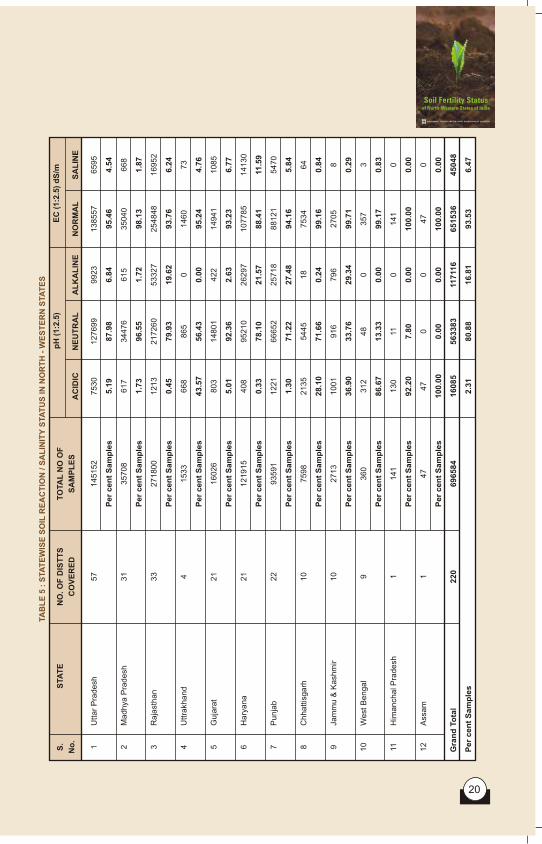
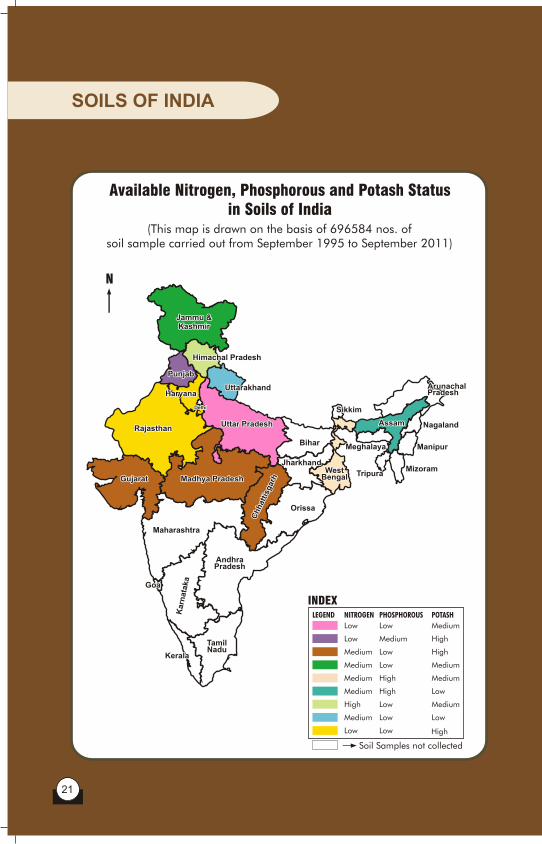
SOILS OF INDIA
21
UTTAR PRADESH
Available Nitrogen, Phosphorous and Potash Status in Soils of India
Soil Reaction, Salinity & Available NPK Status in Soils of Uttar Pradesh
(This map is drawn on the basis of 696584 nos. of soil sample carried out from September 1995 to September 2011)
(This map is drawn on the basis of 145152 nos. of soil sample analysis carried out from September 1995 to September 2011)
Andhra PradeshAndhra Pradesh
Arunachal PradeshArunachal Pradesh
AssamAssam
BiharBihar
Chhat
tisg
arh
Chhat
tisg
arh
GoaGoa
GujaratGujarat
HaryanaHaryana
Himachal PradeshHimachal Pradesh
Jammu &KashmirJammu &Kashmir
JharkhandJharkhand
Karn
ata
ka
Karn
ata
ka
KeralaKerala
Madhya PradeshMadhya Pradesh
MaharashtraMaharashtra
ManipurManipurMeghalayaMeghalaya
MizoramMizoram
NagalandNagaland
OrissaOrissa
PunjabPunjab
RajasthanRajasthan
SikkimSikkim
Tamil NaduTamil Nadu
TripuraTripura
Uttar PradeshUttar Pradesh
UttarakhandUttarakhand
West BengalWest
Bengal
DelhiDelhi
INDEXLEGEND NITROGEN PHOSPHOROUS POTASH
Low
Low
Medium
Medium
Medium
Medium
High
Medium
Low
Low
Medium
Low
Low
High
High
Low
Low
Low
Medium
High
High
Medium
Medium
Low
Medium
Low
Soil Samples not collected
N N
High
Soil Fertility Statusof North-Western States of India
INDEXLEGEND NITROGEN PHOSPHOROUS POTASH
Low
Medium
Medium
Low
Medium
Low
Low
Medium
Low
Low
Low
Low
Medium
Medium
Low
Low
Low
Medium
Medium
Low
Medium
Medium
Medium
Low
High
High
Low
Soil Samples not collected
22
N
95.66%
4.34%
Soil Salinity
Normal
Saline
Soil Reaction
N
5.19%6.84%
87.97%
Neutral
Acidic
Alkaline

PUNJAB
23 24
RAJASTHAN
Soil Reaction, Salinity & Available NPK Status in Soils of Rajasthan
Soil Reaction, Salinity & Available NPK Status in Soils of Punjab
(This map is drawn on the basis of 271800 nos. of soil sample analysis carried out from September 1995 to September 2011)
(This map is drawn on the basis of 93591 nos. of soil sample analysis carried out from September 1995 to September 2011)
INDEXLEGEND NITROGEN PHOSPHOROUS POTASH
Low
Low
Medium
Medium
High
Medium
Low
Low
Low
Medium
Low
Low
Medium
Medium
Medium
High
High
High
High
Medium
Medium
Soil Samples not collected
INDEXLEGEND NITROGEN PHOSPHOROUS POTASH
Low
Low
Medium
Low
Medium
Low
Medium
Medium
Low
Medium
Medium
Medium
Low
High
Medium
High
Medium
High
High
Medium
Low
Soil Samples not collected
N N
Soil Fertility Statusof North-Western States of India
Mohali
Barnala
Tarantaran
Chandigarh
N
93.76%
6.24%
Soil Salinity
Normal
Saline
Soil Reaction
N
19.62%
0.46%
79.93% Neutral
Acidic
Alkaline
N
94.16%
5.84%
Soil Salinity
Normal
Saline
Neutral
Acidic
Alkaline
Soil Reaction
N1.30%
27.48%
71.22%Sriganganagar
Sahib
Sahid B
hagat Singh
Ferozpur
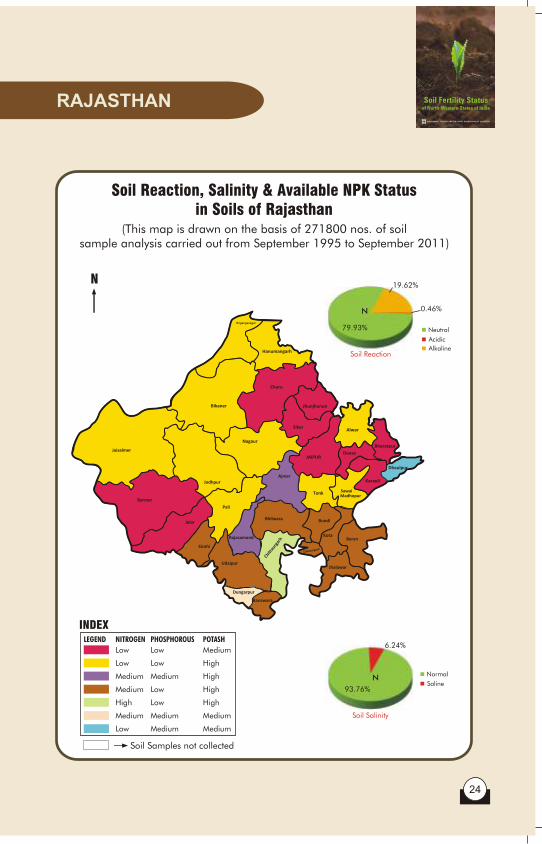
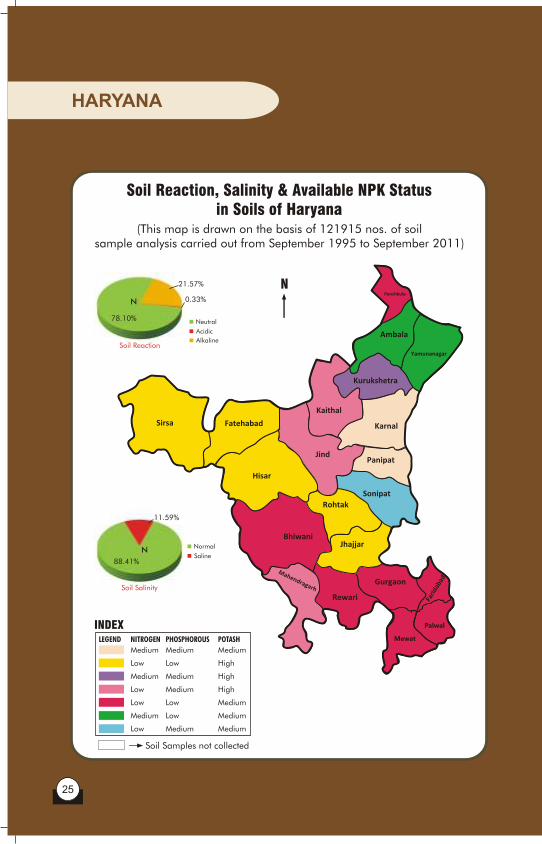
HARYANA
25
MADHYA PRADESH
26
Soil Reaction, Salinity & Available NPK Status in Soils of Madhya Pradesh
(This map is drawn on the basis of 35708 nos. of soil sample analysis carried out from September 1995 to September 2011)
Soil Reaction, Salinity & Available NPK Status in Soils of Haryana
(This map is drawn on the basis of 121915 nos. of soil sample analysis carried out from September 1995 to September 2011)
INDEXLEGEND NITROGEN PHOSPHOROUS POTASH
Medium
Low
Medium
Low
Low
Medium
Low
Medium
Low
Medium
Medium
Low
Low
Medium
Medium
High
High
High
Medium
Medium
Medium
Soil Samples not collected
INDEXLEGEND NITROGEN PHOSPHOROUS POTASH
Medium
High
Low
High
High
Low
Low
Medium
Medium
Low
Medium
Low
High
High
High
High
Medium
Low
Soil Samples not collected
Mewat
Palwal
Burhanpur
KhandwaKhargaon
N N
Soil Fertility Statusof North-Western States of India
Neutral
Acidic
AlkalineSoil Reaction
N 0.33%
21.57%
78.10%
N
88.41%
11.59%
Soil Salinity
Normal
Saline
Neutral
Acidic
AlkalineSoil Reaction
N
1.73%1.72%
96.55%
N
98.13%
1.87%
Soil Salinity
Normal
Saline
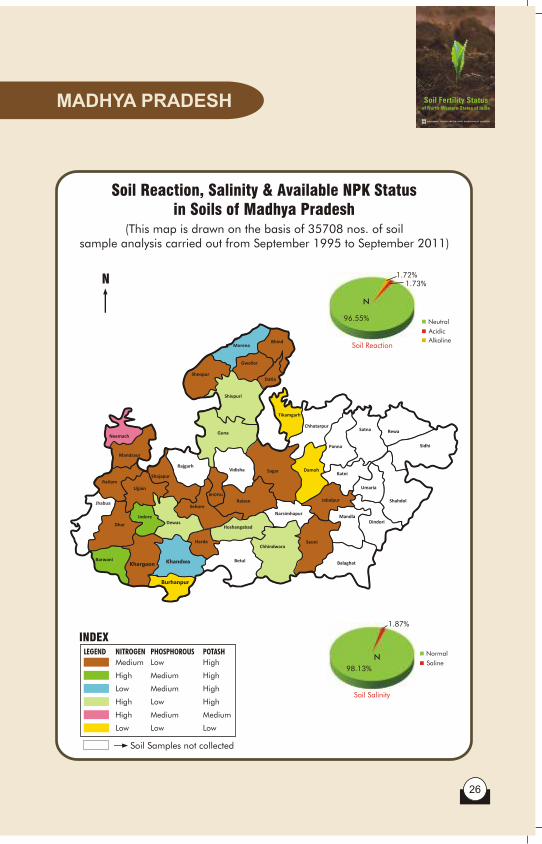

GUJARAT
27 28
CHHATTISGARH
Soil Reaction, Salinity & Available NPK Status in Soils of Chhattisgarh
(This map is drawn on the basis of 7598 nos. of soil sample analysis carried out from September 1995 to September 2011)
Soil Reaction, Salinity & Available NPK Status in Soils of Gujarat
(This map is drawn on the basis of 16026 nos. of soil sample analysis carried out from September 1995 to September 2011)
INDEXLEGEND NITROGEN PHOSPHOROUS POTASH
Medium
Medium
Low
High
Low
Low
Low
Medium
Low
Low
Low
Medium
High
High
High
High
Medium
High
Soil Samples not collected
INDEXLEGEND NITROGEN PHOSPHOROUS POTASH
Medium
Medium
High
High
Low
Low
Low
Low
Low
Low
High
Medium
Low
Medium
Medium
Soil Samples not collected
NN
Soil Fertility Statusof North-Western States of India
N
99.16%
0.84%
Soil Salinity
Normal
Saline
Soil Reaction
N
28.10%
71.66%
0.24%
Neutral
Acidic
Alkaline
N
93.23%
6.77%
Soil Salinity
Normal
Saline
Soil Reaction
N
5.01%
92.36%
2.63%
Neutral
Acidic
Alkaline
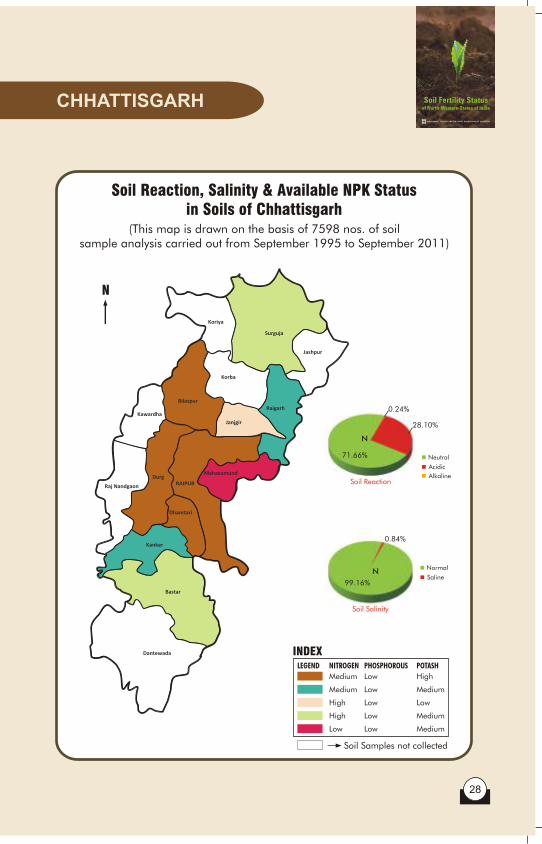
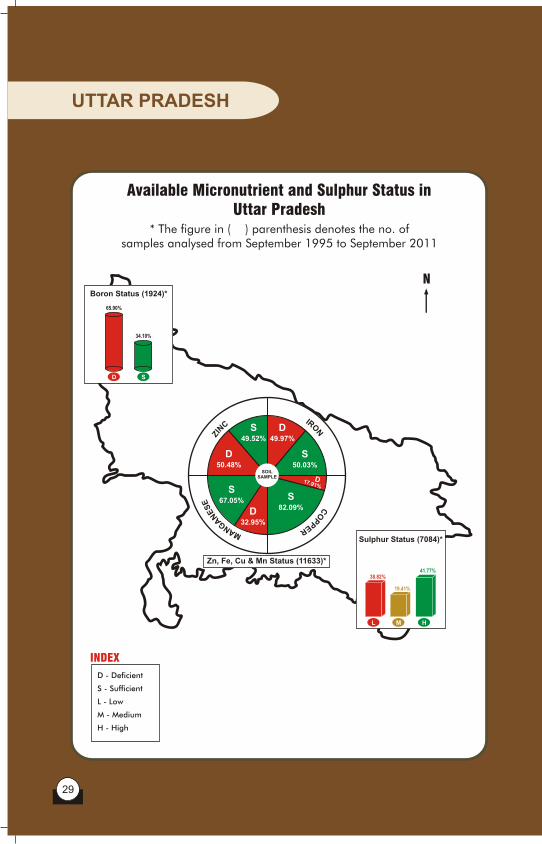
UTTAR PRADESH
29 30
MADHYA PRADESH
Available Madhya Pradesh
Micronutrient and Sulphur Status in Available Micronutrient and Sulphur Status in Uttar Pradesh
* The figure in ( ) parenthesis denotes the no. of samples analysed from September 1995 to September 2011
* The figure in ( ) parenthesis denotes the no. of samples analysed from September 1995 to September 2011
N NN
Soil Fertility Statusof North-Western States of India
INDEX
D - Deficient
S - Sufficient
L - Low
M - Medium
H - High
INDEX
D - Deficient
S - Sufficient
L - Low
M - Medium
H - High
CNIZE
SE
NA
GNA M
S49.52%
D49.97%
D50.48%
S50.03%
S67.05% S
82.09%D32.95%
D17.91%
SOILSAMPLE
65.90%
34.10%
D S
Boron Status (1924)*
Zn, Fe, Cu & Mn Status (11633)*
Sulphur Status (7084)*
41.77%38.82%
19.41%
L HM
Sulphur Status (547)*
40.40%40.40%
19.20%
L HM
59.31%
40.69%
D S
Boron Status (462)*
CNIZE
SE
NA
GNA M
S54.44%
D25.34%
D45.56%
S74.66%
S90.21% S
98.79%
D9.79%
D 1.21%
SOILSAMPLE
Zn, Fe, Cu & Mn Status (1442)*
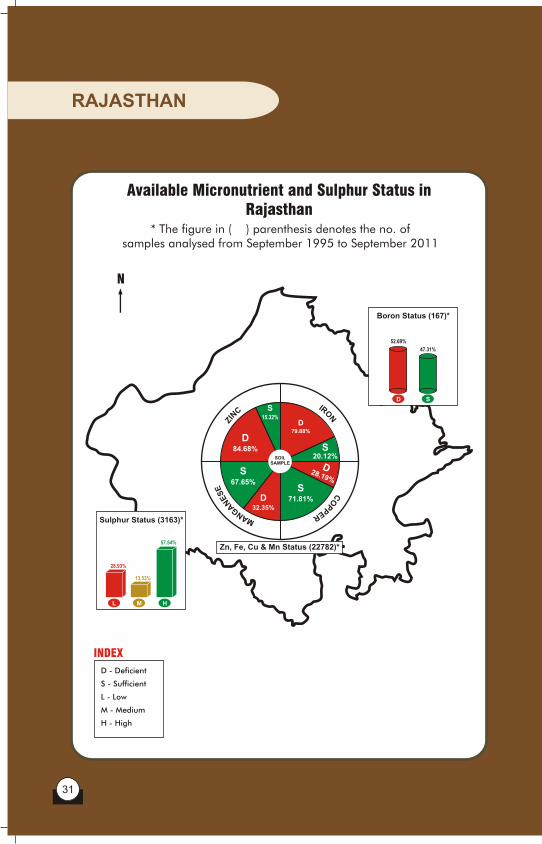
RAJASTHAN
31 32
HARYANA
N
Available Micronutrient and Sulphur Status in Haryana
* The figure in ( ) parenthesis denotes the no. of samples analysed from September 1995 to September 2011
Available Micronutrient and Sulphur Status in Rajasthan
* The figure in ( ) parenthesis denotes the no. of samples analysed from September 1995 to September 2011
N
Soil Fertility Statusof North-Western States of India
INDEX INDEX
D - Deficient
S - Sufficient
L - Low
M - Medium
H - High
D - Deficient
S - Sufficient
L - Low
M - Medium
H - High
52.69%
47.31%
D S
Boron Status (167)*
Sulphur Status (3163)*
57.54%
28.93%
13.53%
L HM
CNIZE
SE
NA
GNA M
S15.32%
D79.88%
D84.68% S
20.12%
S67.65%
S71.81%D
32.35%
SOILSAMPLE D
28.19%
Zn, Fe, Cu & Mn Status (22782)*
Sulphur Status (2737)*
63.61%
20.75%15.64%
L HM
69.52%
30.48%
D S
Boron Status (187)*
CNIZE
SE
NA
GNA M
S58.82%
D41.18%
S72.89%
S63.96% S
88.78%D36.04%
D 11.22%
SOILSAMPLE
D27.11%
Zn, Fe, Cu & Mn Status (4947)*

PUNJAB
33
Our Network
Jharkhand
Jammu and Kashmir
Himachal
Pradesh
Punjab
Uttaranchal
Haryana
Rajasthan
Uttar Pradesh
Madhya Pradesh
Maharastra
Gujarat
Orissa
Chhattisgarh
Bihar
West
Bengal
Meghalaya
Assam
Arunachal
Pradesh
Nagaland
Manipur
Mizoram
Tripura
Andhra
Pradesh
Karnataka
Kerala
Tamilnadu
Goa
Delhi
Sikkim
Bhatinda
Amritsar
Ludhiyana
AmbalaKurikshetra
Kaithal
Karnal
Panipat
Sonepat
Jind
FatehabadSirsa
Bhiwani
Rewari
Gurgaon
Faridabad
MahenderGarh
Kathua
Doda
Udhampur
Anantnag
Pulwama
Srinagar
Baramula
Badgam
Kupwara
Punch
Rajauri
Kargil
Rohtak
Hisar
Udaipur
Jaipur
Bharatpur
Srigangangar
Indore
Bhopal
Agra
Meerut
Kanpur
Varanasi
Rajkot Barodra
Chandigarh
Lucknow
Ahmedabad
Raipur
Kota
Jammu
Patna
Saharanpur
Uttarkashi
Rudraprayag
Tehri Garwal
GarwalHardwar
Dehradun Chamoli
Pithoragarh
Bageshwar
Almora
NainitalChampawat
YamunaNagar
Muzaffarnagar Bijnor
Bagpat
Ghaziabad
Jyoti BaPhule Nagar Rampur
MoradabadBulandshahr
Aligarh
Budaun
Bareilly
Pilibhit
KheriShahjahanpur
MahamayaNagar
Mathura
FirozabadMainpuri
Etah
Farrukhbad
Hardoi
SitapurBahraich Shravasir
Balrampur
Etawah
Kannauj
Auraiya
Unnao
Barabanki
Faizabad
Gonda
Basti
SidharthNagar Maharajganj
Sant Kabir NagarKushinagar
Deoria
Mau
Ballia
Ghazipur
Azamgarh
Jaunpur
Pratapgarh
SultanpurRae Bareli
Fatehpur
KaushambhiBanda
Hamirpur
Mahoba
Jalaun
Jhansi
Lalitpur
Chandauli
Sonbhadra
Mirzapur
Allahabad
Gorakhpur
GautamBudh
Nagar
PaschimChamparan
PurabiChamparan
Gopalganj
Siwan
Saran
Muzaffarpur
SitamarhiSheohar Madhubani
Darbhanga
Supaul
Madhepura
Saharsa
KhagariaBegusarai
SamastipurVaishali
Araria
KishanGanj
Purnia
Katihar
Bhagalpur
Banka
MungerLakhisaraiSheikhpura
JamuiNawada
GayaAurangabad
RohtasKaimur(Bhabua)
Buxar
Bhojpur
JahanabadNalanda
SurgujaKoriya
Korba
Jashpur
RaigarhBilaspur
Kawardha
RajnandgaonDurg
Mahasamund
Janjgir-Champa
Dhamtari
Kanker
Baster
Dantewada
Sidhi
Rewa
Satna
Shahdol
Umaria
Dindori
Mandla
Balaghat
Seoni
Jabalpur
Katni
Panna
Chhatarpur
Tikamgarh
DamohSagar
Narsimhapur
Chhindwara
Betul
Harda
East NimarWest NimarBadwani
Dhar
Jhabua
RatlamUjjain
Dewas
Hoshangabad
RaisenSehore
Shajapur
Mandsaur
Neemach
Rajgarh Vidisha
Guna
Shivpuri
Datia
Gwalior
Sheopur
MorenaBhind
Valsad
The DangsNavsari
Surat
NarmadaBharuch
Anand
KhedaPanchMahals
Dohad
SabarKantha
Gandhinagar
Mahesana
Patan
Bans Kantha
Surendra nagar
Bhavnagar
Amreli
Junagadh
Porbandar
Jamnagar
Banswara
Dungarpur
Chittaurgarh
Rajsamand
distt. Sirohi
Jalor
Barmer
Pali
Jaiselmer
Jodhpur
Bikaner
Hanumangarh
Churu
Jhunjhunun
Sikar
Nagaur
Ajmer
TonkSawai
Madhopur
Karauli Dhaulpur
Dausa
Bhilwara Bundi
Baran
Jhalawar
Alwar
Marketing Head Office
Urea Plant
ADL
Regional Office
DRM Headquarter
MO/AM Headquarter
Garhwa
PalamuChatra
Kodarma
Hazaribag
GiridihDeoghar
Dumka
Pakaur
Godda
Sahibaganj
Dhanbad
Bokaro
RanchiLohardaga
Gumla
PaschimiSinghbhum
PurbiSinghbhum
PuruliaBankura
Midnapur
24-Parganas
North
24-Parganas
South
Hooghly
Nadia
Birbhum
Burdwan
Murshidbad
Malda
SouthDinajpur
NorthDinajpur
Coochbehar
Jalpaiguri
Darjeeling
Palwal
Jhajjar
Shivganj
Anoopgarh
Hindon
Khandwa
Gurdaspur
Hoshiarpur
Jalandhar
Kapurthala
Moga
Mansa
Sangrur
Patiala
Rupnagar
Firozpur Muktsar
Faridkot
Nawanshahr
FatehgarhSahib
Batala
Rudrapur
Udham Singh Nagar
Kolkata
Aurangabad
Available Micronutrient and Sulphur Status in Punjab
* The figure in ( ) parenthesis denotes the no. of samples analysed from September 1995 to September 2011
N
INDEX
D - Deficient
S - Sufficient
L - Low
M - Medium
H - High
34
83.33%
16.67%
D S
Boron Status (12)*Sulphur Status (1922)*
41.94%
35.74%
22.32%
L HM
Zn, Fe, Cu & Mn Status (14626)*
CNIZE
SE
NA
GNA M
S47.13%
D49.90%
D52.87%
S50.10%
S60.31%
S79.79%D
39.69%
SOILSAMPLE D20.21%
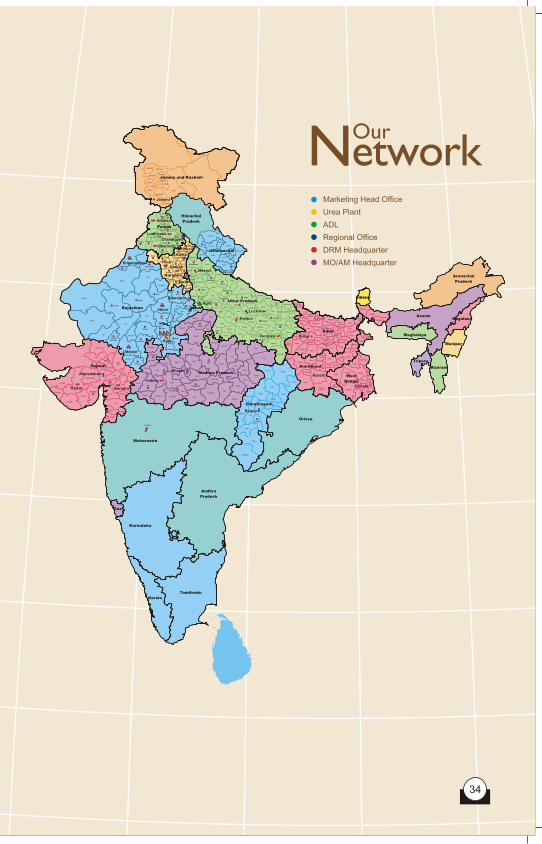
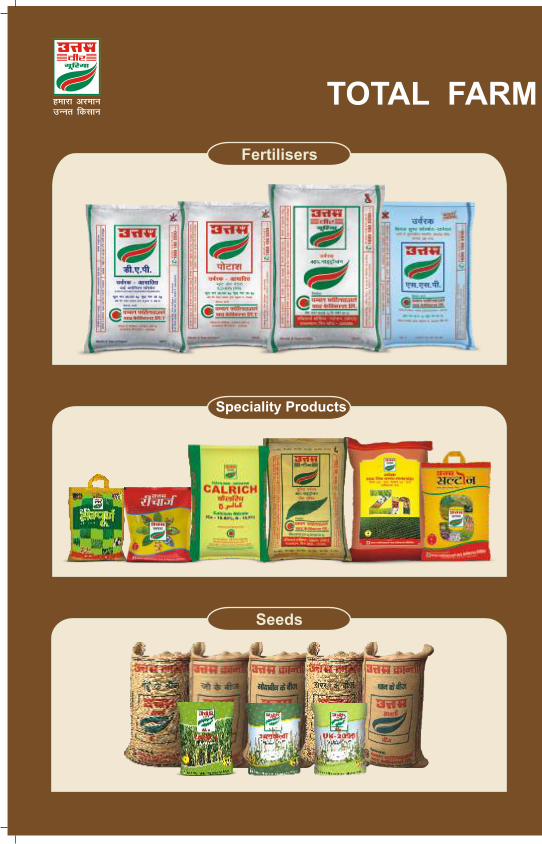
TOTAL FARM SOLUTION
Fertilisers
Insecticides
FungicidesSeeds
Weedicides
Speciality Products
Soil Fertility Statusof North-Western States of India

TOTAL FARM SOLUTION
Fertilisers
Insecticides
FungicidesSeeds
Weedicides
Speciality Products
Soil Fertility Statusof North-Western States of India

Soil Fertility Statusof North-Western States of India
37 38
JUNE
DECEMBER
Fungicid
e
Insecticide
Weedicide
NO
VE
MB
ER
AUGUST
SEPTEMBER
OCTOBER
JULY
JAN
UA
RY
FEBRUARY
MARCH
APRIL
MAY
Uttam Krishi Inputs
Fungicide
Figo
Hexaveer
M-2
Manzim
Sulfino
Veer M-45
Veercon
Veerzim
Monthly Usage Table
Product
Jan
.
Feb
.
Marc
h
Ap
ril
May
Ju
ne
Ju
ly
Au
g.
Se
pt.
Oc
t.
No
v.
De
c.
Insecticide
Aceveer
Acto
Alphaveer
Bruno
Chlorveer
Cyperveer
Imidaveer
Karbo
Kelvo
Lamdaveer
Monoveer
Novel
Proveer
Tempo
Toro-10
Trizoveer
Veercombi
Veertap Power
Monthly Usage Table
Product
Jan
.
Feb
.
Marc
h
Ap
ril
May
Ju
ne
Ju
ly
Au
g.
Sep
t.
Oct.
No
v.
Dec.
Weedicide
Attract
Butaveer
Isoveer
Kleeno
Metaveer
Moto
Penveer
Pritilaveer
Proto
Toto
Veerkill
Weeza
Wheto
Zoro
Soil Health
Sampoorn
Sulton
Uttam Recharge
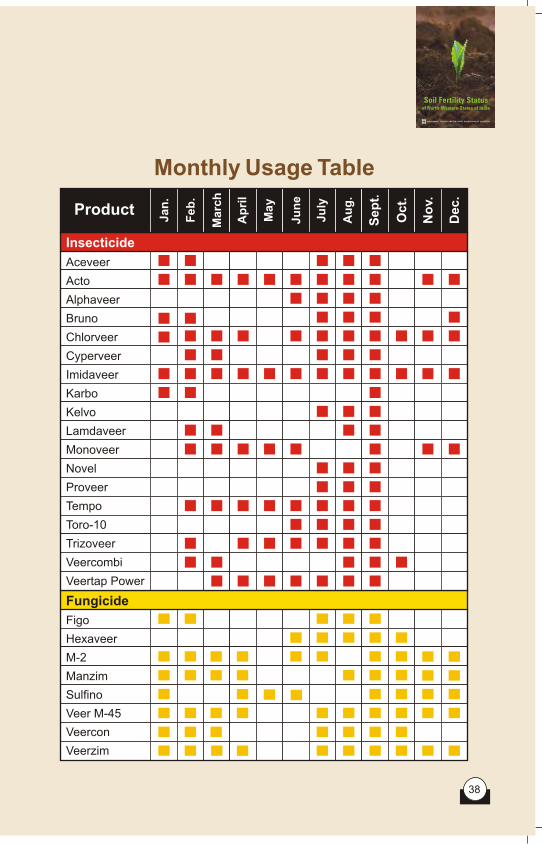
Corporate Office: Corporate One, First Floor, 5 Commercial Centre, Jasola, New Delhi - 110 025
Phone +91 11 41697900 / 46581300, Fax + 91 11 40638679, www.chambalfertilisers.in